Ambient Gaseous Pollutants in an Urban Area in South Africa: Levels and Potential Human Health Risk


1
Department of Environmental Health, Faculty of Science, Tshwane University of Technology, Private Bag X680, Pretoria 0001, South Africa
2
Department of Environmental Health Sciences, Faculty of Public Health, College of Medicine, University of Ibadan, Ibadan 200284, Nigeria
*
Author to whom correspondence should be addressed.
Atmosphere 2020, 11(7), 751; https://doi.org/10.3390/atmos11070751
Submission received: 11 March 2020
/
Revised: 27 May 2020
/
Accepted: 28 May 2020
/
Published: 16 July 2020
(This article belongs to the Section Air Quality)
Abstract
:Urban air pollution from gaseous pollutants is a growing public health problem in many countries including South Africa. Examining the levels, trends and health risk of exposure to ambient gaseous pollutants will assist in understanding the effectiveness of existing control measures and plan for suitable management strategies. This study determined the concentration levels and non-cancer risk of CO, SO2, NO2, and O3 at an industrial area in Pretoria West, South Africa. We utilised a set of secondary data for CO, NO2, SO2, and O3 that was obtained from a monitoring station. Analysis of the hourly monitored data was done. Their non-cancer risk (HQ) was determined using the human health risk assessment model for different age categories. The annual levels of NO2 (39.442 µg/m3), SO2 (22.464 µg/m3), CO (722.003 µg/m3) and the 8-hour concentration of CO (649.902 µg/m3) and O3 (33.556 µg/m3) did not exceed the South African National Ambient Air Quality Standards for each pollutant. The HQ for each pollutant across exposed groups (except children) was less than 1. This indicates that the recorded levels could not pose non-cancer risk to susceptible individuals.
1. Introduction
Urban air pollution from gaseous pollutants is a growing environmental and public health problem in many cities of the world [1,2]. Carbon monoxide (CO), Nitrogen dioxide (NO2), Sulphur dioxide (SO2), and Ozone (O3) are gaseous pollutants that have been internationally recognised as environmental priority air pollutants since they can constitute a threat to human health and the environment [3].
Reduction in lung function in children with a history of persistent asthma resulting from exposure to modest ambient concentrations of NO2, NO, PM10, and SO2 has been reported in South Africa [4]. In addition, O3, NO2 and SO2 can induce harmful effects such as increased bronchial reactivity [5,6], pulmonary and systemic inflammation [6], and protracted inflammatory and thrombotic responses in vulnerable individuals [7]. A possible association between short-term exposure to SO2 and adverse endpoints, including gastrointestinal disorders and inflammation of the blood vessels, has been reported [8]. Also, association between day-to-day variations in NO2 concentration and mortality, hospital admissions and respiratory symptoms was reported by the World Health Organization [9].
South Africa is among the world’s foremost mining and mineral-processing nations, with large deposits of metals and coal. The country also possesses an energy and carbon-intensive economy [10]. Coal is an essential fuel for industrial processes in South Africa that is substantially used by coal-fired power stations. Most (91%) of the electricity generated in South Africa is from coal [11]. Although most power stations in South Africa use low-grade coal, the resultant emissions from coal burning such as CO, NO2, SO2, and Particulate matter (PM) have created huge environmental and health problems for communities sited in ‘hot spot’ areas with a large industrial presence [12]. South Africa often experiences high pollution levels that are injurious to human health, mainly in large industrial areas such as the South Durban Industrial Basin and the Vaal Triangle [13].
The Constitution of South Africa, 1996 Constitution of the Republic of South Africa (Act No. 108 of 1996) serves as the foundation for environmental regulation and policy in South Africa. The right to environmental protection and to live in an environment that is not harmful to health or well-being is clearly stated in Section 2.4 of Chapter 2 of the Bill of Rights. This fundamental right strengthens environmental policies and laws. In the year 2009, the South African government promulgated the National Ambient Air Quality Standards in terms of section 9 (1) of the National Management: Air Quality Act, 2004 [14]. This is to guard against adverse health effects in humans from exposure to ambient gaseous pollutants. In the year 2007, the National Framework for Air Quality Management (NFAQM) was formulated [15]. The establishment of the NFAQM ensured the emergence of new air quality and emission guidelines that target emissions emanating from industrial activities [15].
Understanding the trend in ambient concentration of gaseous pollutants and the non-cancer risks associated with short and long-term exposure to these pollutants in an industrial area has become an important field of air pollution health research [16]. This study will provide evidence-based knowledge on the impact of control measures instituted by governments in recent years, and for planning suitable risk assessment and management strategies for pollution control if need be. Therefore, this study examined the non-cancer health risk associated with exposure to concentrations of CO, SO2, NO2, and O3 in an industrial area in Pretoria West, South Africa.
2. Methods
2.1. Study Area
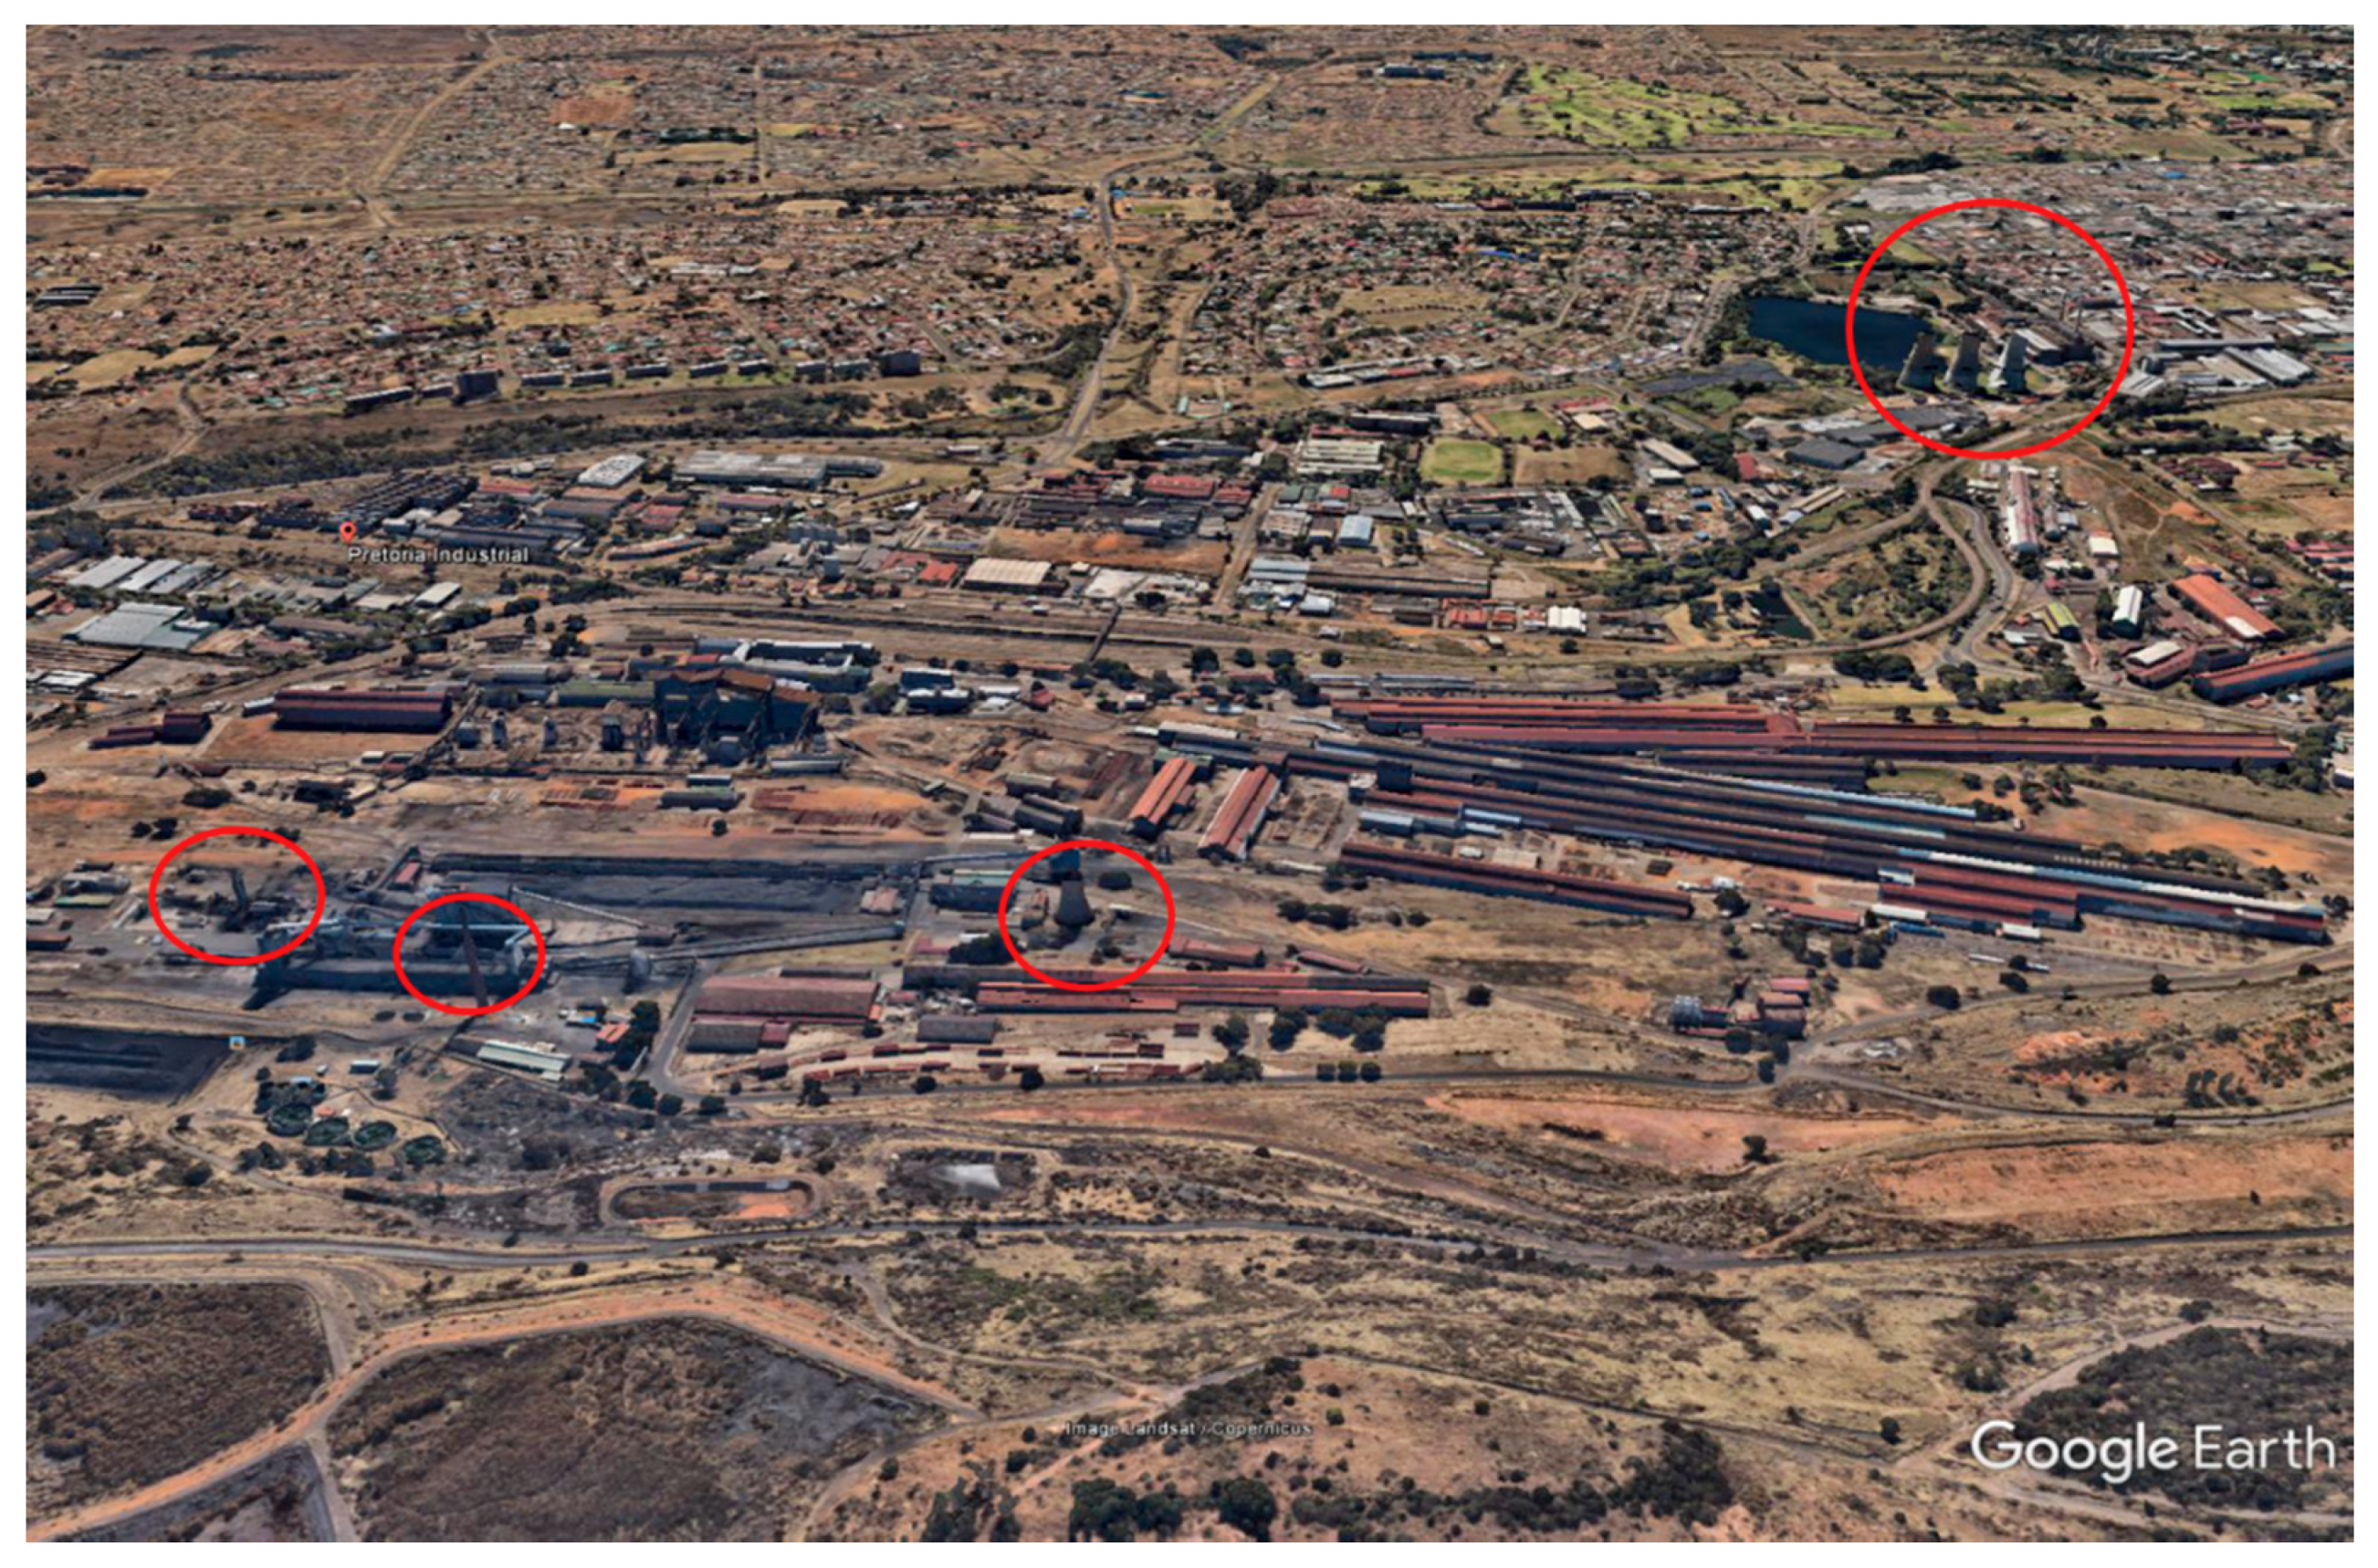
The study was conducted in Pretoria West industrial area in the Gauteng province (Figure 1). It is positioned to the north of Johannesburg and extends from Centurion in the South to Temba in the North, encompassing an area of 2200 km2 [17]. Within the Pretoria West industrial area, are industries with approved air emission licences, power plants and metallurgical industries and facilities with small boilers [18]. High pollution levels have been reported previously in this area [19]. The air quality monitoring station located in the industrial area is one of the seven monitoring air quality stations owned by the City of Tshwane. The stations are able to monitor priority pollutants such as SO2, O3, CO, NO2, PM2.5, PM10, volatile organic compounds, benzene, toluene, and xylene effectively. Meteorological parameters such as wind speed, wind direction, temperature, relative humidity, precipitation, and solar radiation are also monitored. The detailed information on the study area has been reported in our earlier published works [18,19,20,21].
2.2. Sampling
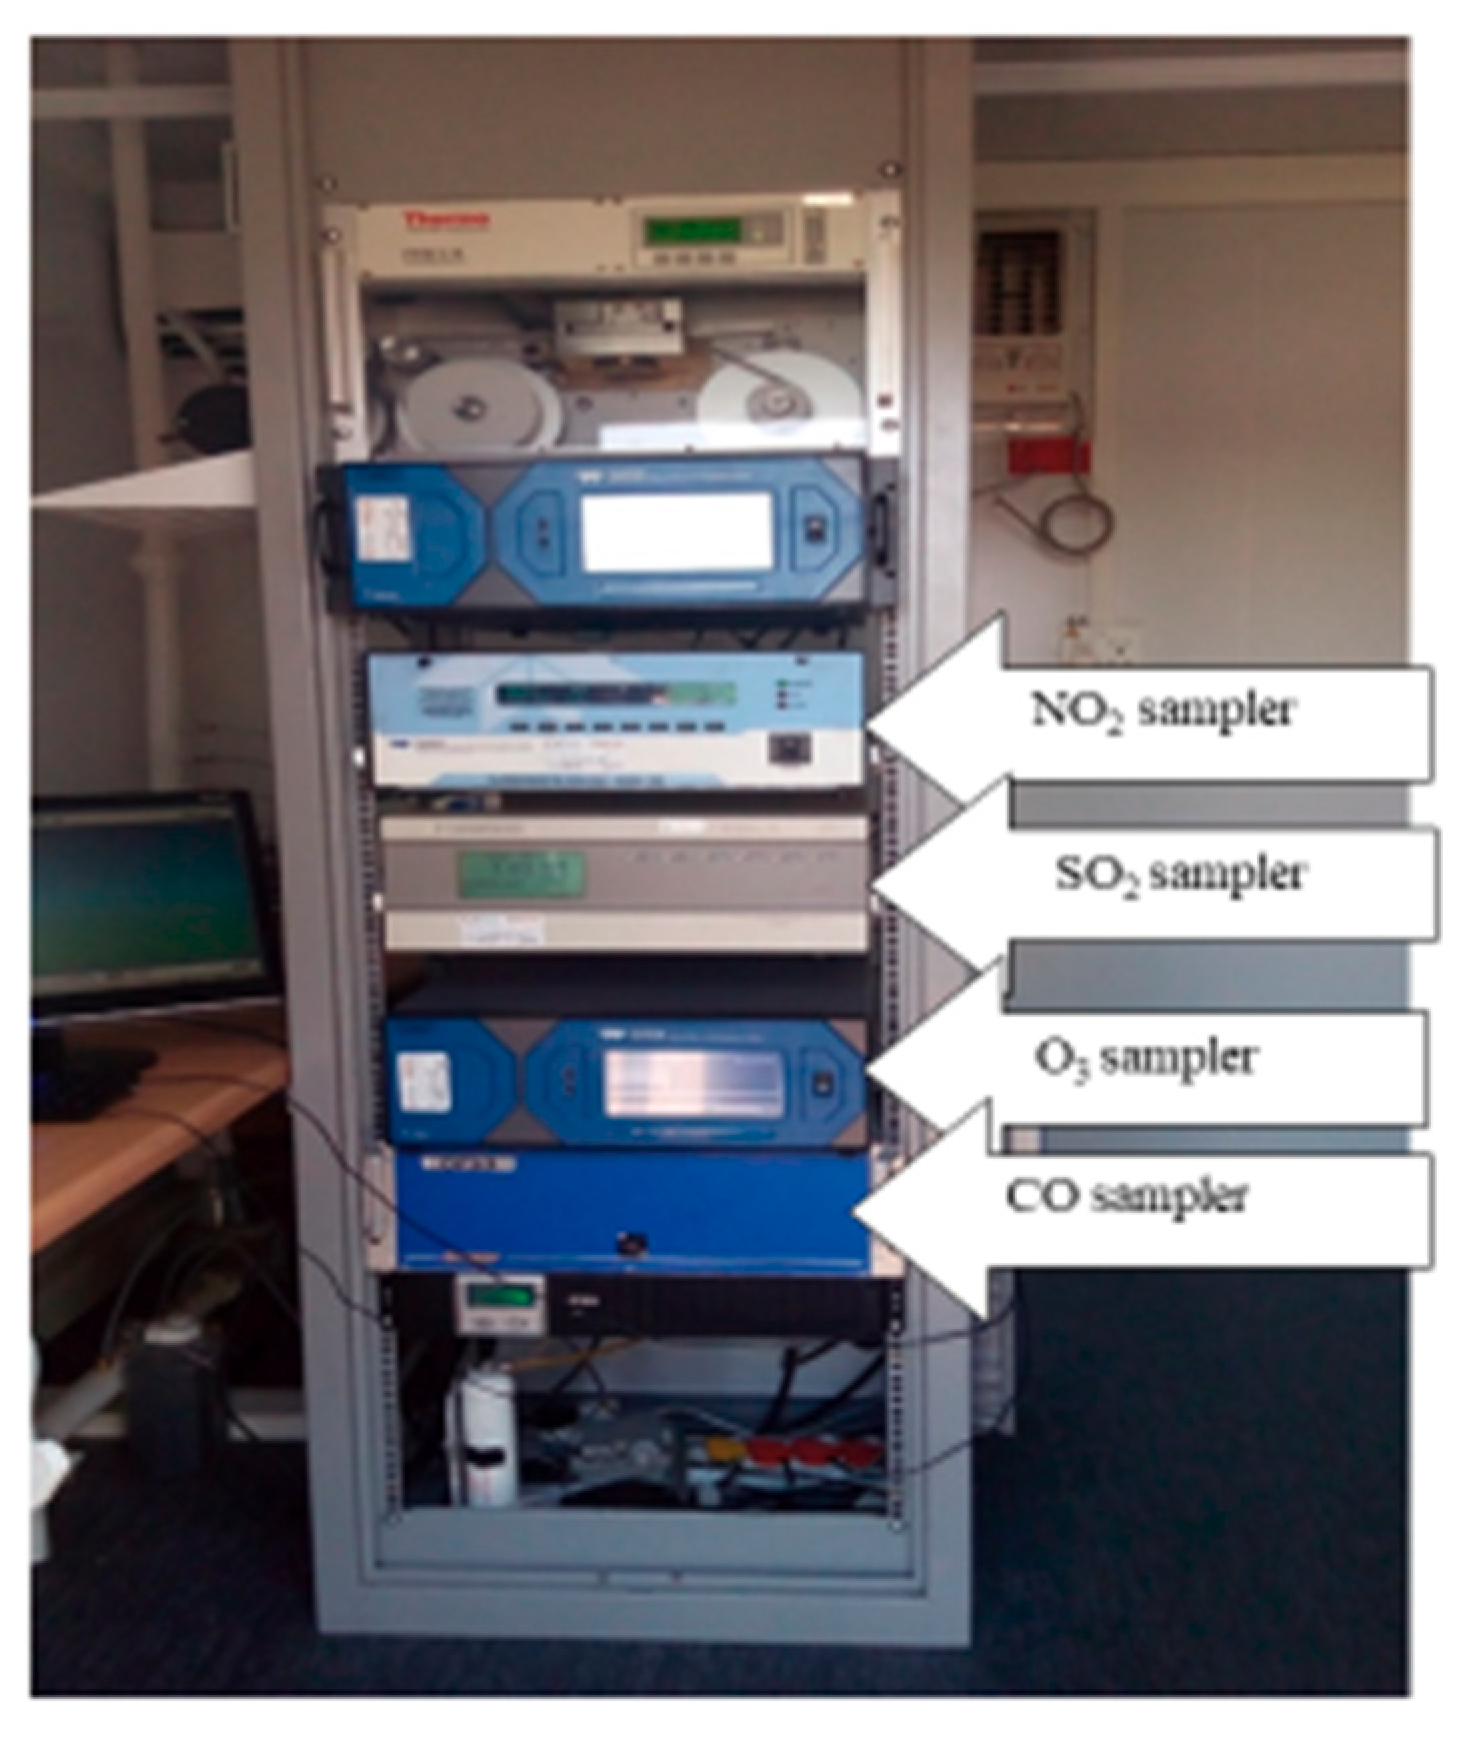
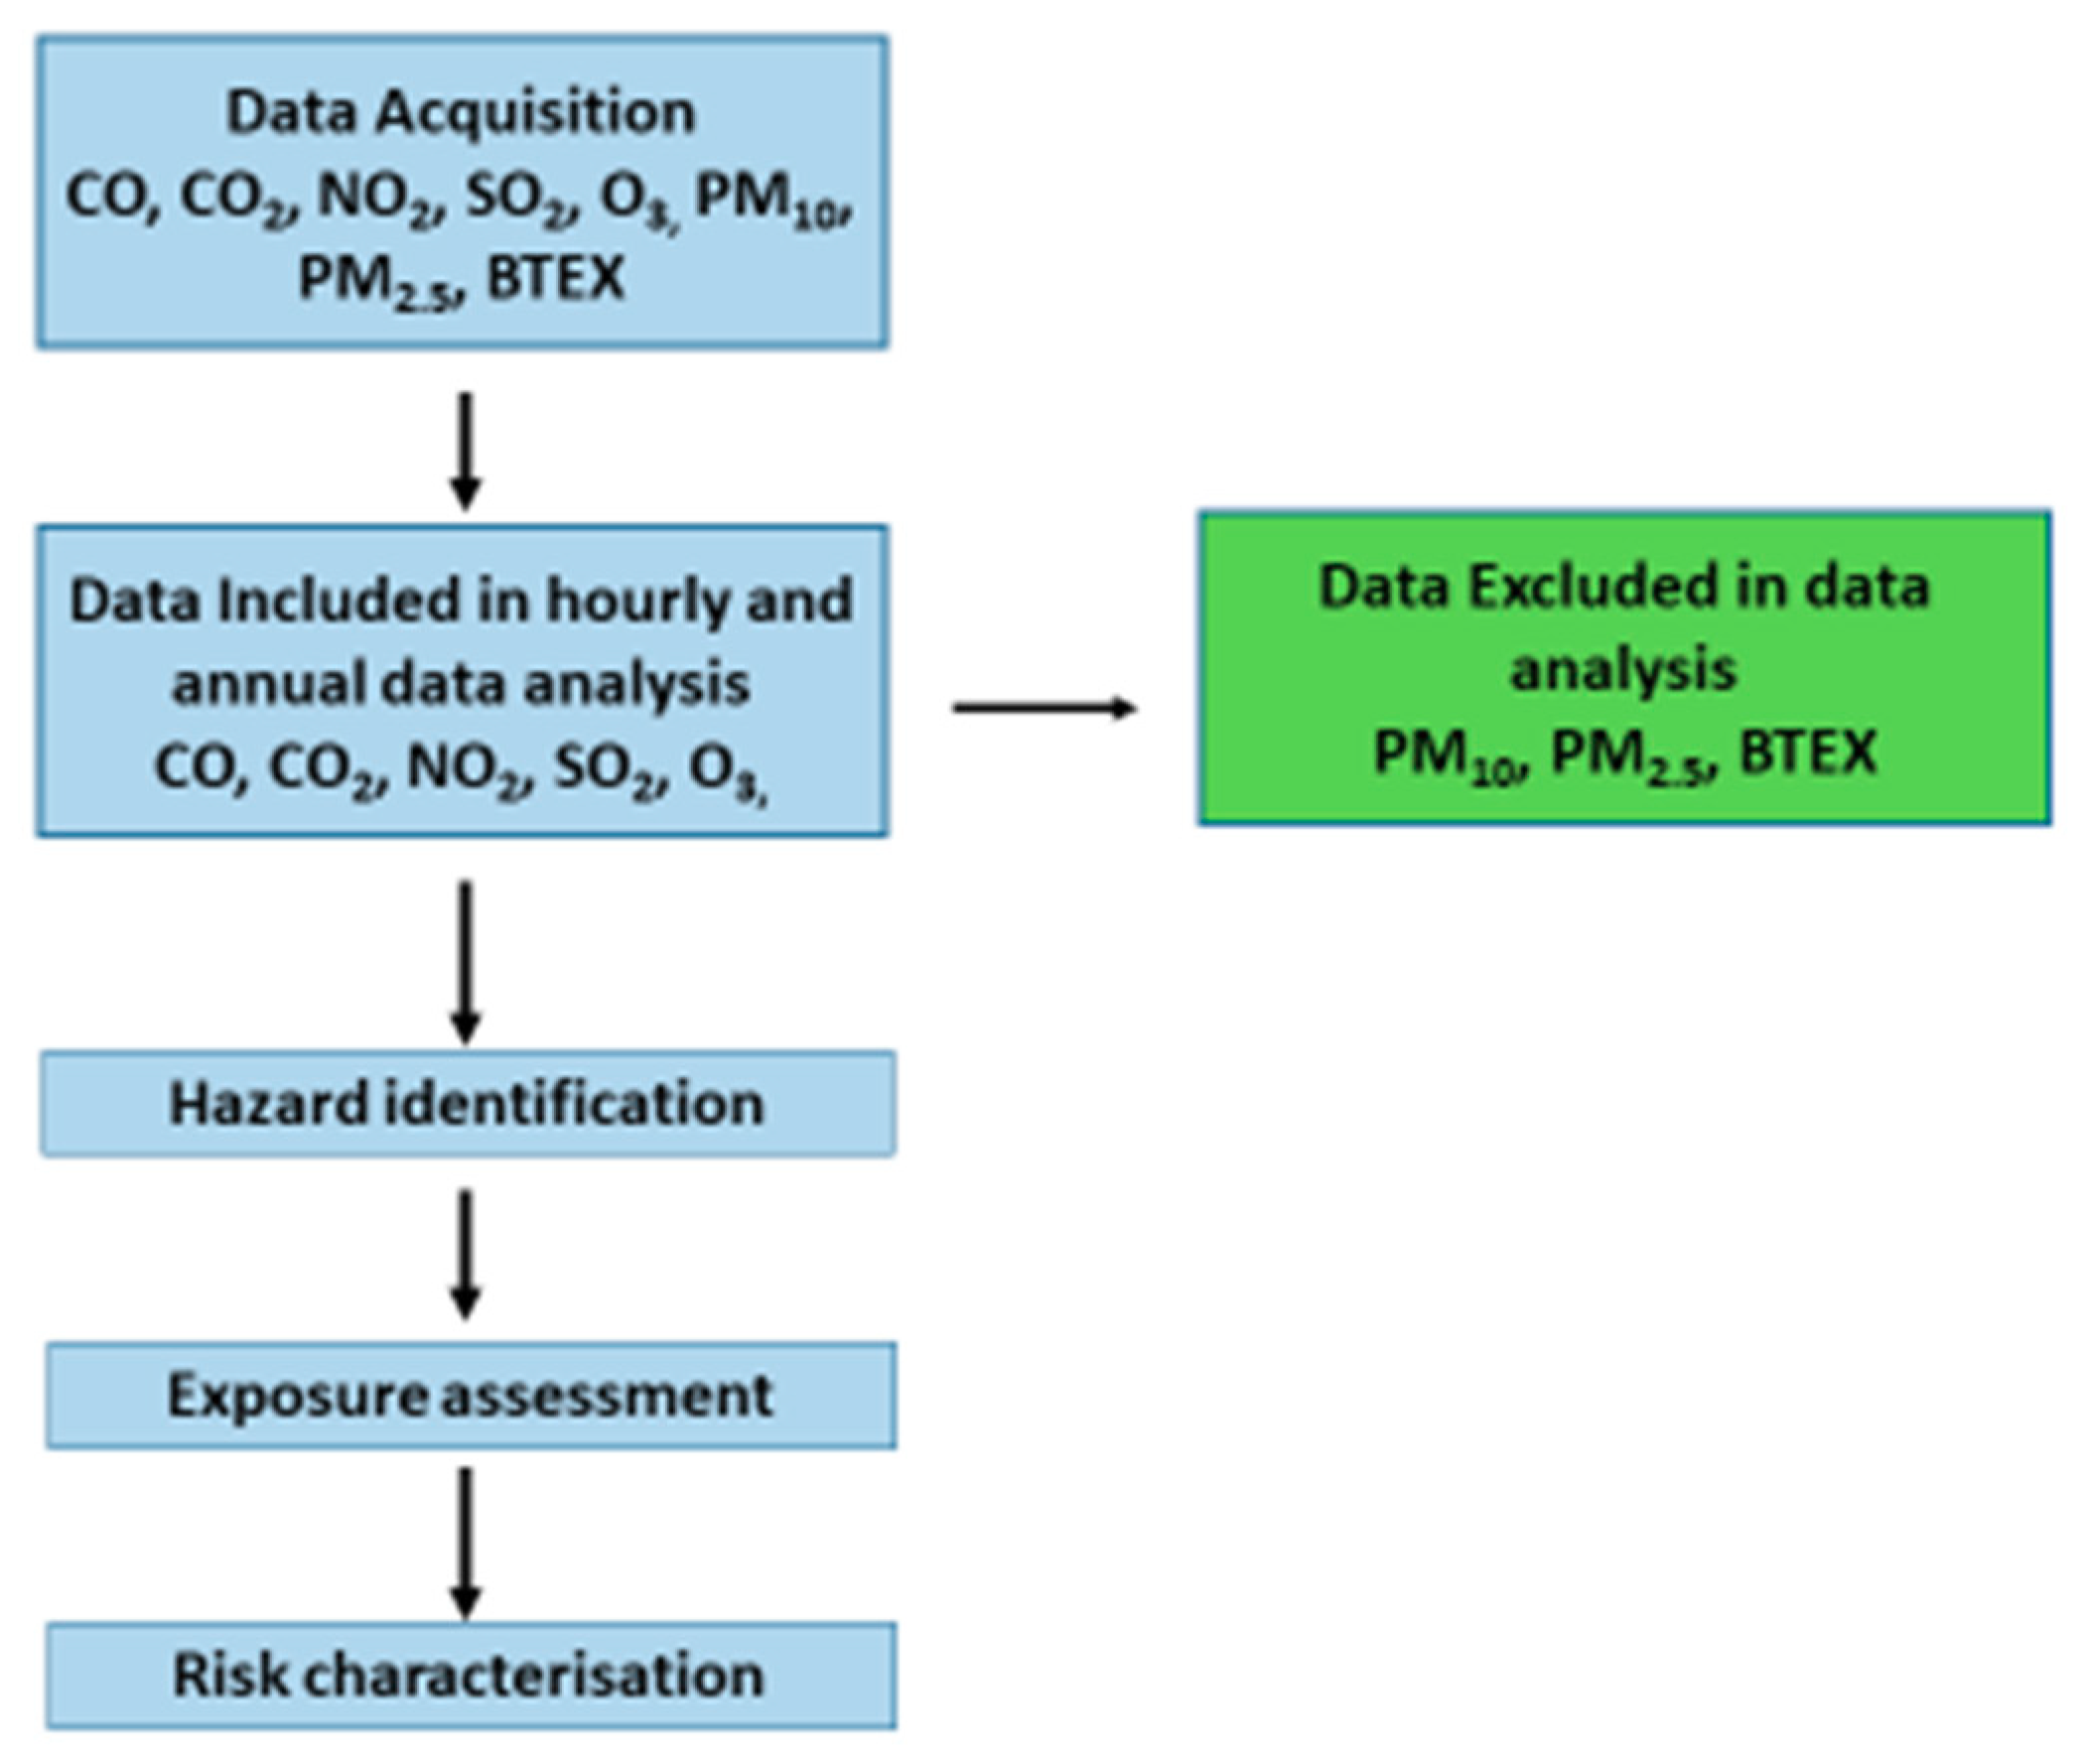
For this study, we utilised a set of data for CO, NO2, SO2, and O3 that were obtained from the Environmental Management Services Department City of Tshwane. Ambient concentrations of CO, NO2, SO2, and O3 were monitored by the data originators using a CO Analyzer (Model T300; S/N: 449), a NOX Analyzer (Model T200; S/N: 1624), a Fluorescence SO2 Analyzer (Model 100E; S/N: 2891), and an O3 Analyzer (EC 9810; S/N: 08-1084) (Figure 2). The operational procedures for the samplers are described in their respective operational manuals [23,24,25,26]. Particulate matter of aerodynamic size 2.5 and 10, Benzene, Toluene, and Xylene were not included in the data analysis because there were so many missing data across different days due the malfunctioning of their monitors (Figure 3).
Measurement of the air quality in Pretoria West industrial area is useful in estimating the levels of exposure to a pollutant that is considered to be safe for humans over their lifetime. To achieve acceptable air quality levels in the City of Tshwane (where Pretoria West industrial area is situated) and to minimise the impact of air pollution on both human health and the environment, the air quality management for Tshwane was developed in 2006 by the Environmental Management Division and the municipal health services [17].
In estimating the overall air quality in Pretoria West industrial area, we analyzed a 1-year (January 2016 to December 2016) long term ambient monitoring data of CO, SO2, NO2, and 8 h. The 24-h average concentrations of CO, SO2, and NO2 were estimated for days when they were valid data for not more than 20 h. Moreover, the 8 h average concentration of O3 was calculated using the hourly concentration. The levels of the pollutants measured were compared with recommended guidelines as shown in Table 1. The most recent national air quality standards for PM10, CO, SO2, NO2, and O3 as stated in Schedule 32816 of the NEMA: AQA was gazetted by the then Minister of Water and Environmental Affairs on 24 December 2009 [27]. Air quality standards indicate the levels of exposure to air pollutants that are safe for human health over a set time span.
The four seasons in South Africa are classified based on the months of the year as follows: summer (December, January and February), autumn (March, April and May), winter (June, July and August), and spring (September, October and November).
Analysis of hourly monitored data for monthly and annual concentrations of CO, NO2, SO2, and O3 was done using IBM SPSS statistical software version 20 (SPSS Inc., Chicago, USA), while the graphical representation was done using Microsoft Excel 2013 spreadsheet. Graphical representation (wind rose and polar plots) of the effects of wind speed and wind direction on the concentration of CO, NO2, SO2, and O3 was done using R© (v.2.13.1) statistical software. This was used to deduce the dominant prevailing winds and the seasonal distribution and levels of the pollutants in the study area. Descriptive statistics such as mean, standard deviation and percentages were used to summarise the air pollution data in a meaningful way so that the hourly, weekly, monthly, and annual patterns of the pollutants in the study area emerged. Descriptive statistics give a summary of the data under consideration and together with graphics analysis form the basis of quantitative data analysis.
2.3. Health Risk Assessment
To estimate the possible health risks that exposure to CO, NO2, SO2, and O3 could pose to residents of the study area, human health risk assessment (HHRA) of the inhalation exposure pathways was conducted. The HHRA is a tool used by regulatory agencies to assist in the formulation of policies that protect public health against the harmful effects of air pollution [28]. The HHRA framework used in this study has four components: hazard identification, dose-response assessment, exposure assessment, and risk characterisation.
2.4. Hazard Identification
Hazard identification is a process of recognising if a pollutant present in an environment is likely to induce adverse human health effects should exposure to that pollutant occur [29]. The identification of CO, NO2, SO2, and O3 as injurious to human health in this study was achieved through a review of existing literature.
2.5. Dose-Response Assessment
The dose-response assessment detects the association between exposure level or dose and the severity of the health endpoints that are likely to occur [30]. Dose-response assessment was not calculated in this study. The amount of CO, NO2, SO2, and O3 absorbed into the body was estimated from their concentration and the duration of exposure. The measured ambient concentrations was then compared with the South African National Ambient Air Quality Standards (NAAQS) [14].
2.6. Exposure Assessment
The exposure assessment describes the population exposed to the pollutant and the magnitude and duration of exposure to the pollutant. In this study, the human populations living in Pretoria West are the likely receptors of levels of the pollutants. The population consists of 23.2% young persons (0–14 years), 71.9% persons of working-age (15–64 years) and 4.9% elderly persons (65+ years) [31]. The study population was grouped into four categories: infants (birth–1 year), children (2–5 years), children (6–12 years), and adults (19−75 years). We have utilised this age classification in our previous study [22].
2.7. Risk Characterisation
Risk characterisation is the quantitative estimation of the health risk of exposure to a pollutant. It reflects the probability of an adverse health outcome occurring among healthy and/or sensitive individuals [32]. In this study, the risk of exposure to the pollutants was determined by estimating the Hazard Quotient (HQ) for non-carcinogens [29].
The health risk of exposure to CO, NO2, SO2, and O3 through the inhalation route was estimated using Equations (1) and (2).
where:
HQ = ADDinh/RfC
- ADD is the average daily dose of CO, NO2, SO2, and O3 through the inhalation route
- C is the concentration of CO, NO2, SO2, and O3 in ambient air
- InhR is the inhalation rate (m3/day)
- ED is the exposure duration (days)
- BW is the body weight of the exposed group (kg)
- AT is the averaging time (days)
- EF is the exposure frequency (days/year)
- HQ is the hazard quotient
3. Results and Discussion
3.1. Mean Concentrations of NO2, SO2, CO and O3
Table 3 shows the hourly, daily and annual concentration levels of pollutants in the ambient air of the study area. The mean 1-hour concentrations of NO2, SO2, CO, and O3 are 18.345 µg/m3, 16.138 µg/m3, 295.410 µg/m3, and 26.840 µg/m3 respectively.
The recorded annual levels of NO2 (39.442 µg/m3), SO2 (22.464 µg/m3), and CO (722.003 µg/m3) and the 8-hour concentration of CO (649.902 µg/m3) and O3 (33.556 µg/m3) did not exceed the NAAQS. However, the annual mean concentrations of NO2 and SO2 decreased from 39.442 µg/m3 to 11.50 µg/m3 and from 22.464 µg/m3 to 18.68 µg/m3 during the periods of 2014 and 2016 respectively [19]. The annual concentration of NO2 recorded in this study was lower than that recorded in certain urban cities in Africa such as Dakar, Senegal (59.6 µg/m3; 31.7 ppb) [37] and Cairo, Egypt (66.74 µg/m3; 35.5 ppb) [38].
However, the annual means of NO2 and SO2 recorded in this study were higher than the annual means of 30.5 µg/m3 (16.2 ppb) and 9.4 µg/m3 (3.6 ppb) documented in Bamako, Mali [37], and the annual means of 9.1 µg/m3 (4.85 ppb) and 0.8 µg/m3 (0.29 ppb) reported in Kampala, Uganda [39]. Levels of NO2 and SO2 in urban areas have been linked to coal combustion in industries and biomass burning in residential areas [40,41]. Coal burning is the main contributor of SO2 into the atmosphere [42]. The emission inventory of most industrial areas has shown that power plants, industry and vehicular emissions are the major contributors of NO2 [43,44].
3.2. Diurnal Variations in the Concentrations of NO2, SO2, CO and O3
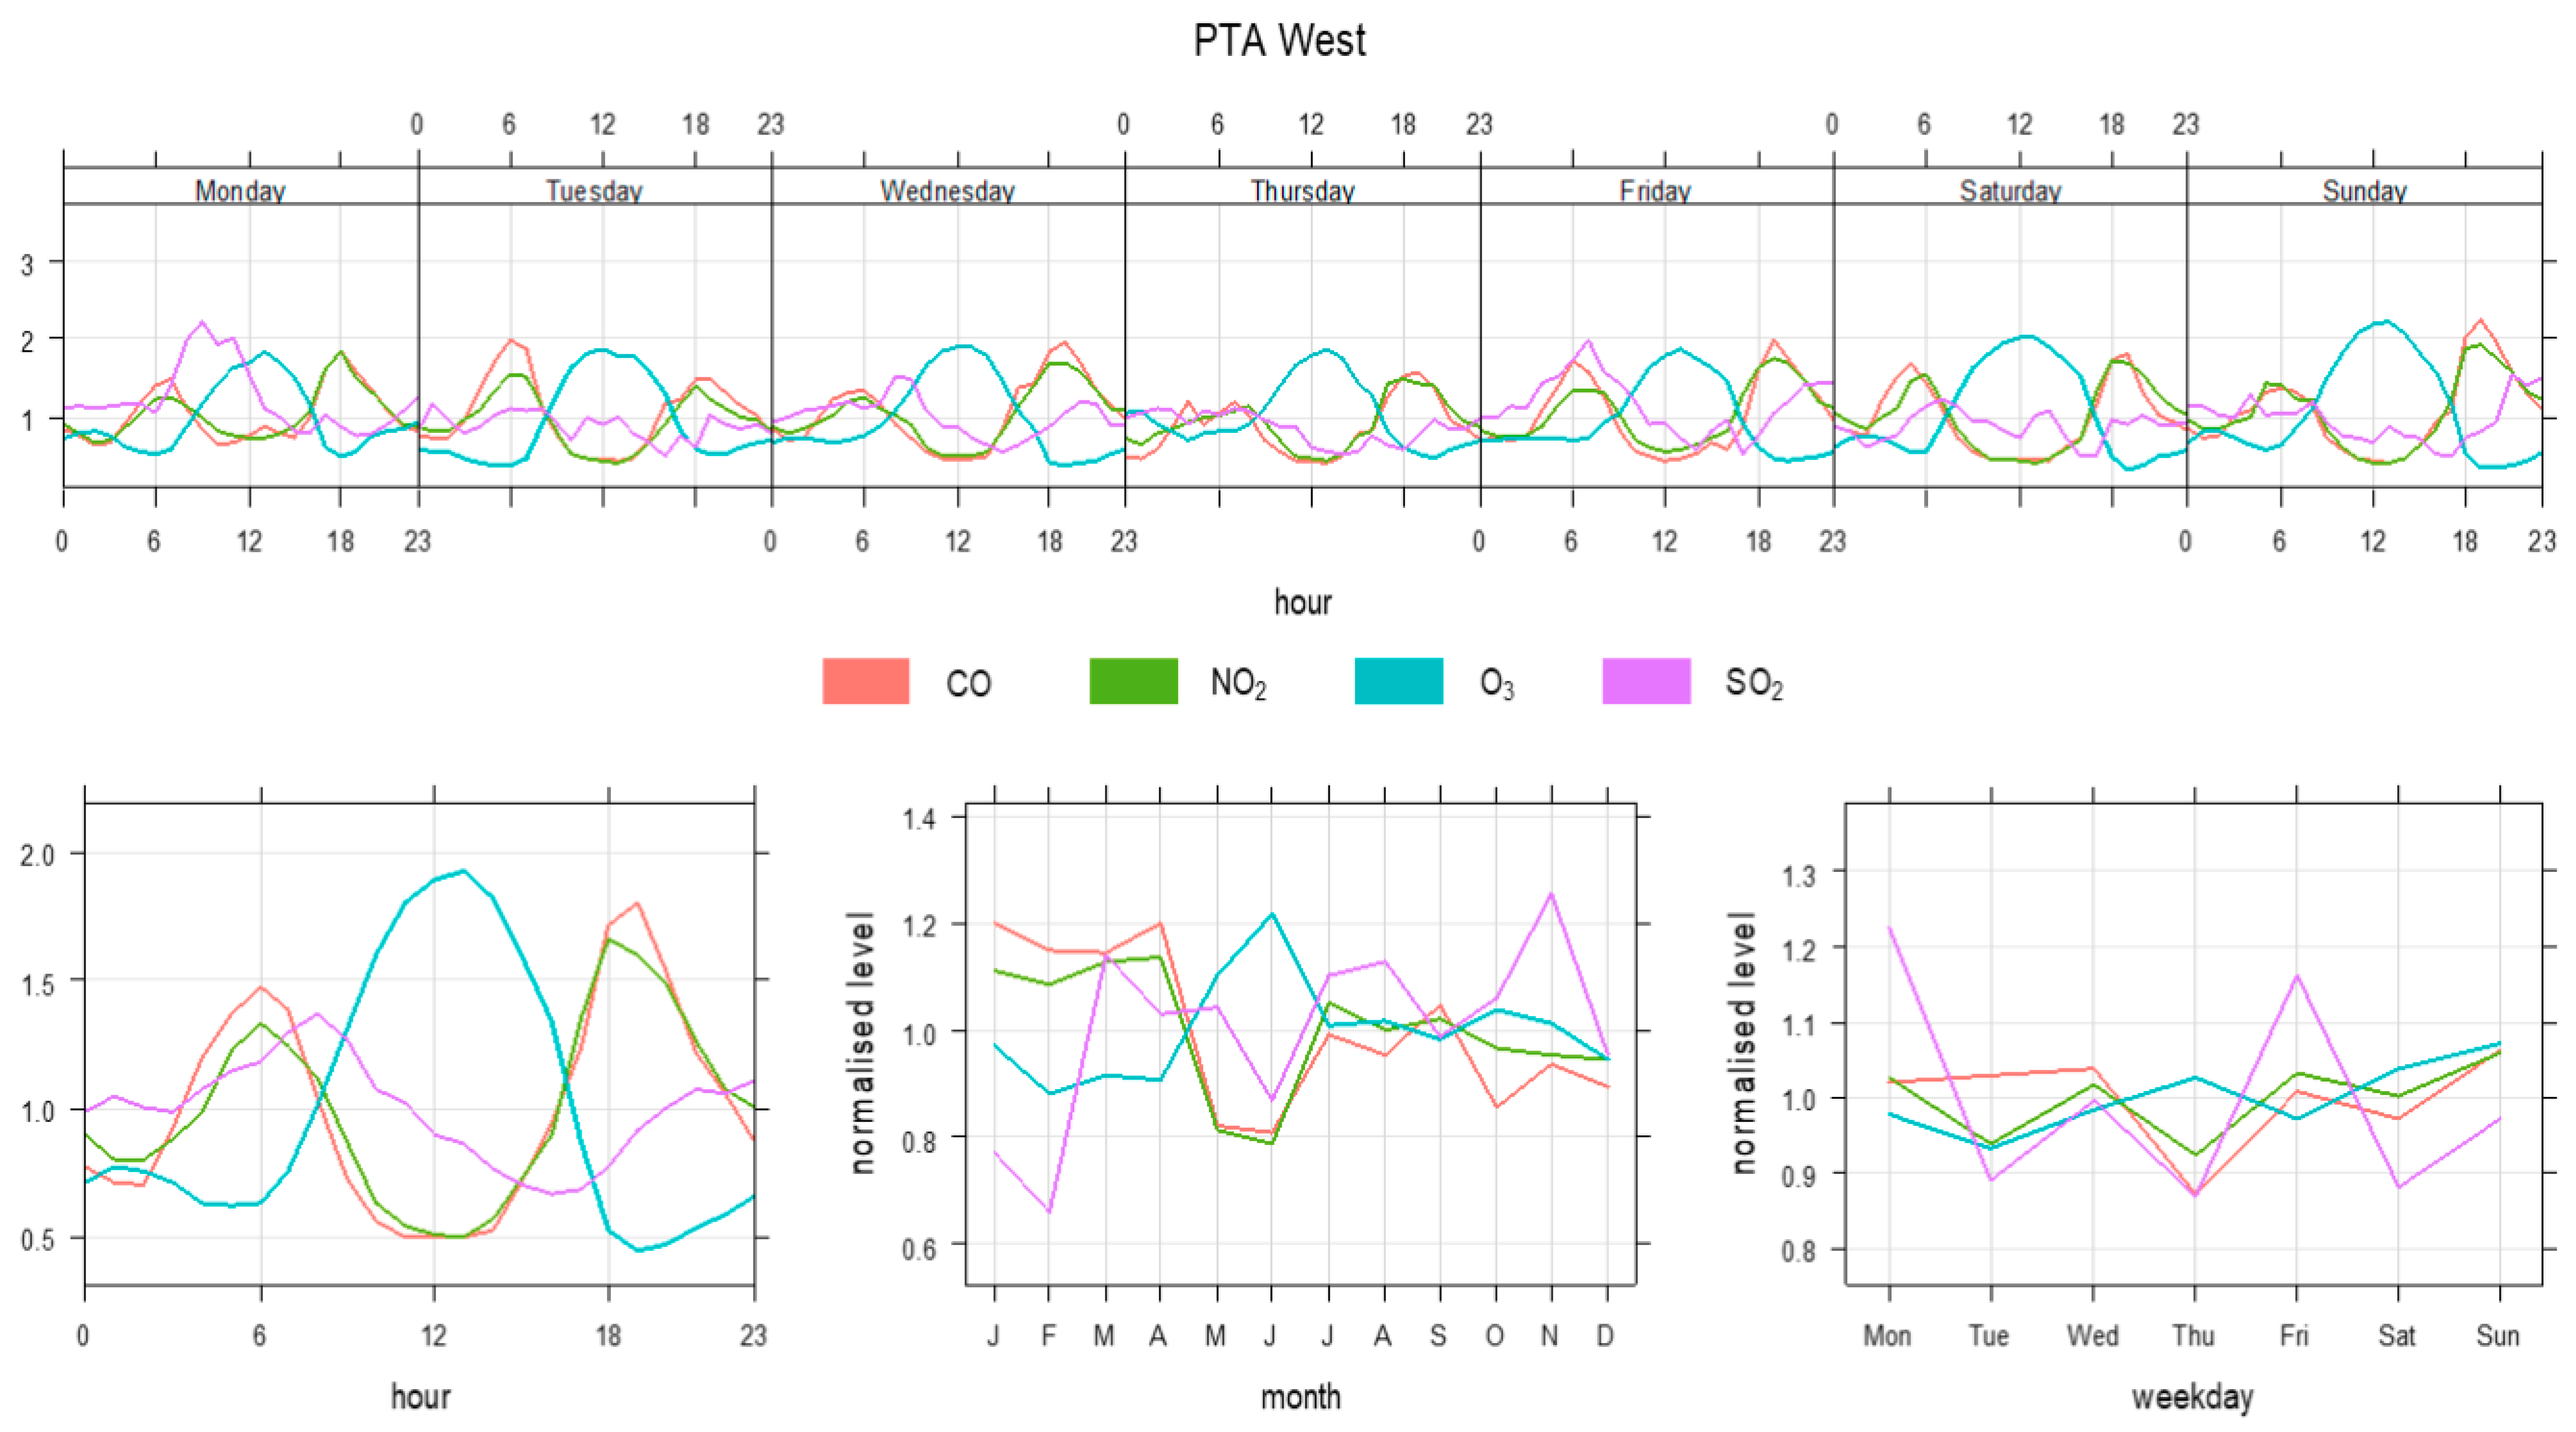
The levels of the pollutants fluctuated over the days of the week, with NO2, CO and O3 showing similar temporal variation and the highest levels recorded on Sundays. In comparison, the level of SO2 was highest on Mondays (Figure 4. The ambient concentrations of pollutants on weekdays (Monday to Friday) vs the weekend (Saturday to Sunday) showed higher levels of NO2 (40.66 µg/m3 vs 37.26 µg/m3), SO2 (19.73 µg/m3 vs 15.75 µg/m3) and CO (569.0 µg/m3 vs 515.0 µg/m3).
This finding is consistent with the results of a study conducted in Senegal in which higher levels of gaseous pollutants were recorded on weekdays than on weekends [37]. Other studies have presented similar patterns [38,45]. It is believed that the level of emissions of air pollutants from anthropogenic sources is lower on weekends than on weekdays in urban areas [45].
However, higher levels of O3 were observed on weekends (50.09 µg/m3) than on weekdays (48.63 µg/m3). This corroborated findings from an earlier study conducted in Europe in the Veneto region of Italy [46]. In the current study, higher levels of 8-hour O3 were recorded during the daytime (62.23 µg/m3) than during the nighttime (31.81 µg/m3). An obvious daily peak at mid-afternoon (Figure 4) that corresponded to hours with solar radiation was observed. Researchers have linked O3 formation in the atmosphere with an extended period of sunshine (solar radiation) and high daytime temperatures [47,48].
Similar day and night variations were observed for NO2 (36.95 µg/m3 vs 40.63 µg/m3), SO2 (15.85 µg/m3 vs 18.58 µg/m3) and CO (528.0 µg/m3 vs 548.0 µg/m3), with more pollution recorded during the night hours than during the daytime hours. A similar trend was reported in Cairo by Hassan et al. [38]. Possible explanations for this trend are the build-up of pollutants in the atmosphere due to steady air, reduced vertical mixing within a low boundary layer [49] and nighttime conditions occasioned by reduced wind speeds and increased calm conditions.
Peak levels of NO2 (5:00 p.m.–7:00 p.m.), SO2 (6:00 a.m.–9:00 a.m.), CO (5:00 p.m.–7:00 p.m.), and O3 (10:00 a.m.–4:00 p.m.) were observed at different hours of the day. Moreover, NO2 and CO presented two daily peaks in the morning (6:00 a.m.–8:00 a.m.) and evening (6:00 p.m.–8:00 p.m.) (Figure 4). Similar bimodal diurnal patterns are reported in the literature [37]. These periods correspond to hours with higher vehicular movement and industrial production. In between the two modes is the period with the lowest levels of NO2 and CO (10:00 a.m.–2:00 p.m.) (Figure 4). This scenario could be due to reduced vehicular movement, improved atmospheric dispersion, higher levels of O3 in the ambient air, the photolysis of NOx, the oxidation of CO, and the elevated boundary layer [46]. In addition, the mean concentration of SO2 increased at 6:00 a.m.–8:00 a.m. and 6:00 p.m.–8:00 p.m., probably due to changes in climatic conditions and the boundary layer.
3.3. Seasonal Distribution of NO2, SO2, CO and O3
Elevated pollution levels for NO2 (70.196 ± 52.77 µg/m3), SO2 (31.779 ± 23.72 µg/m3) and CO (1108.360 ± 1053.40 µg/m3) were observed in winter compared with the summer levels of NO2 (18.760 ± 11.70 µg/m3), SO2 (14.227 ± 12.68 µg/m3) and CO (352.889 ± 201.13 µg/m3) (Table 4). The average concentrations of NO2, SO2 and CO were in the order of winter > autumn > spring > summer. These seasonal variations reflect the effects of meteorological conditions occasioned by dawdling winds and a greater percentage of wind calm hours [50,51]; lower mixing of boundary heights, limiting the diffusion capacity of the atmosphere and thus confining the emitted pollutants close to the ground [52]; less rainfall [53]; lower temperatures [53]; and reduced oxidation potential with a reduction in O3 formation [46]. In contrast, a reduction of pollutants was seen in summer due to the increased duration of sunshine, resilient turbulent currents and precipitation that dilutes the concentration of pollutants emitted at the Earth’s surface [54].
Nevertheless, O3 showed a different seasonal variation pattern with the peak pollution levels observed in summer and the lowest in winter (Table 4). This pollutant displays the highest concentration in summer when solar radiation is higher and the atmospheric photochemistry is largely dynamic [46]. The formation of O3 in the atmosphere is a function of photochemical reactions that are influenced by solar radiation and precursor emissions [55]. Also, the stratosphere–troposphere exchange process plays a critical role in the increase of the mean concentration of O3 in summer and spring [56]. However, recent findings have reported higher O3 concentrations in winter than in summer [57].
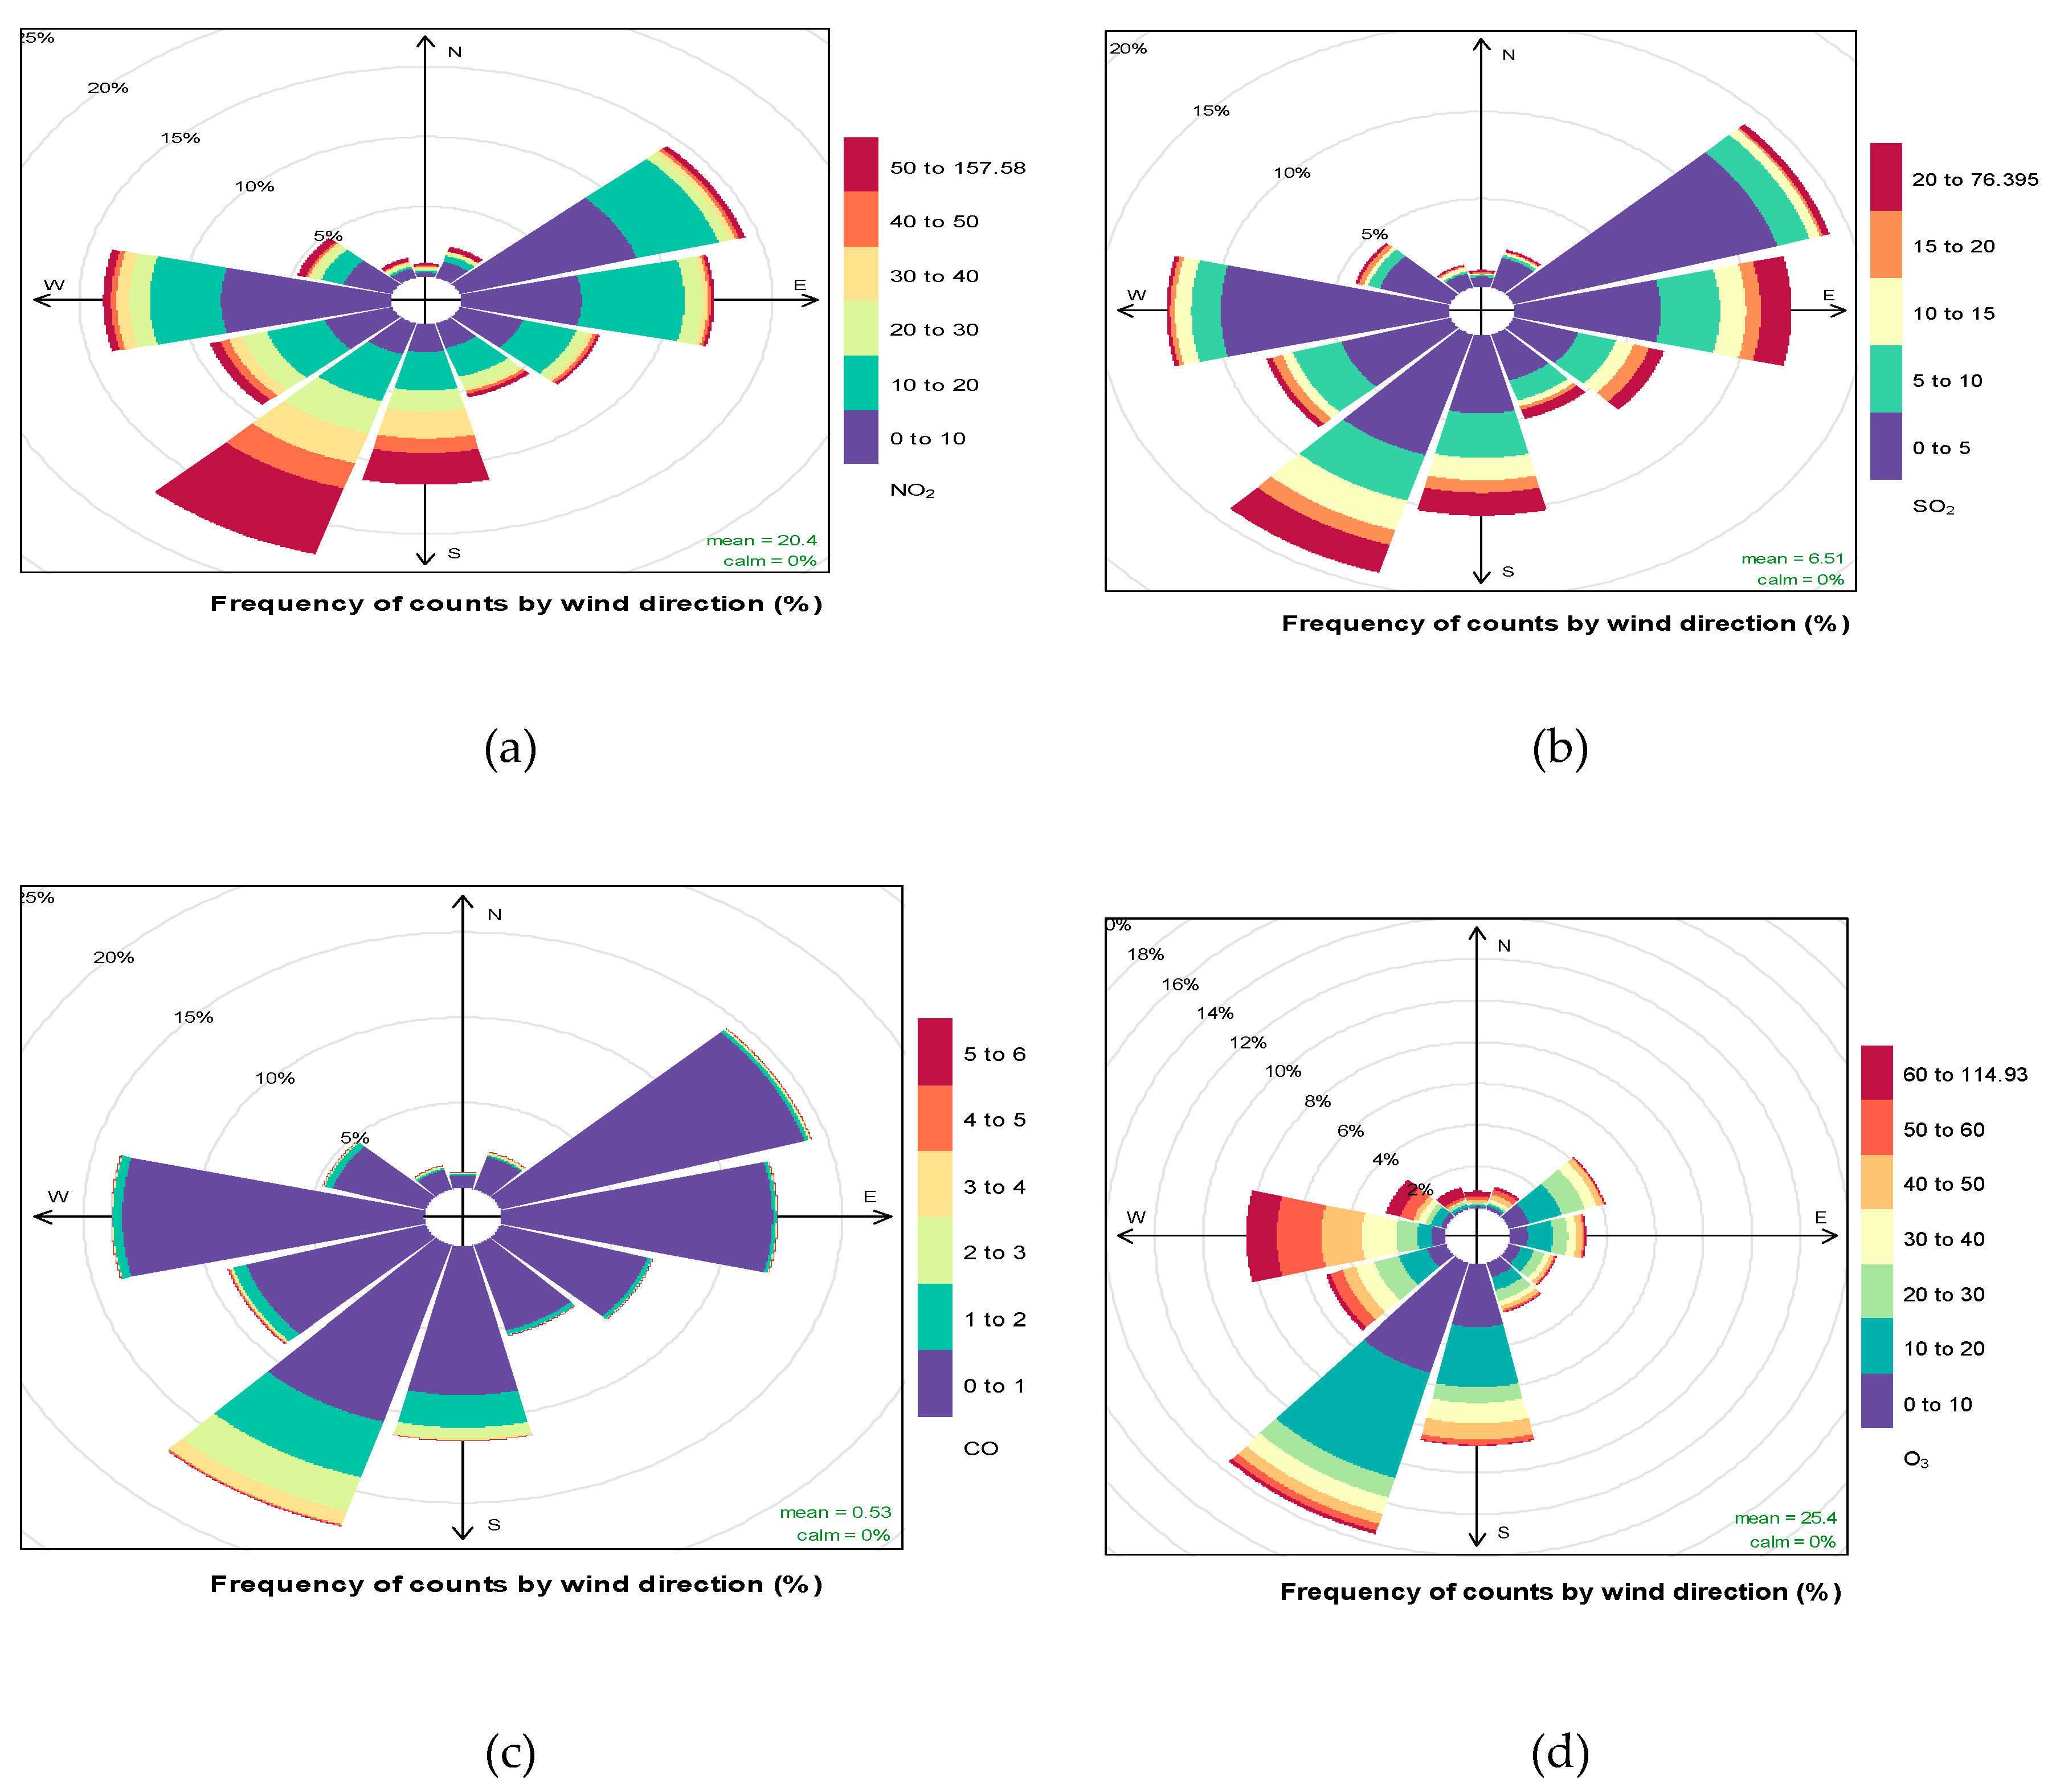
The pollution rise shows the wind directions that dominate the overall concentration of a pollutant. Figure 5a–d indicate that the south-westerly winds and the north-easterly winds are the most predominant winds controlling the overall concentrations of NO2, SO2, CO, and O3. This clearly shows that the probability of these pollutants originating from the same source or direction is high. In Figure 5b, the concentration of SO2 is highest when the winds are from the southwest, perhaps from the Vaal Triangle air pollution priority area, and also from the east, perhaps from the Highveld air pollution priority area where many Eskom power plants are sited.
3.4. Non-Carcinogenic Health Risks of NO2, SO2, CO and O3 via Inhalation Route
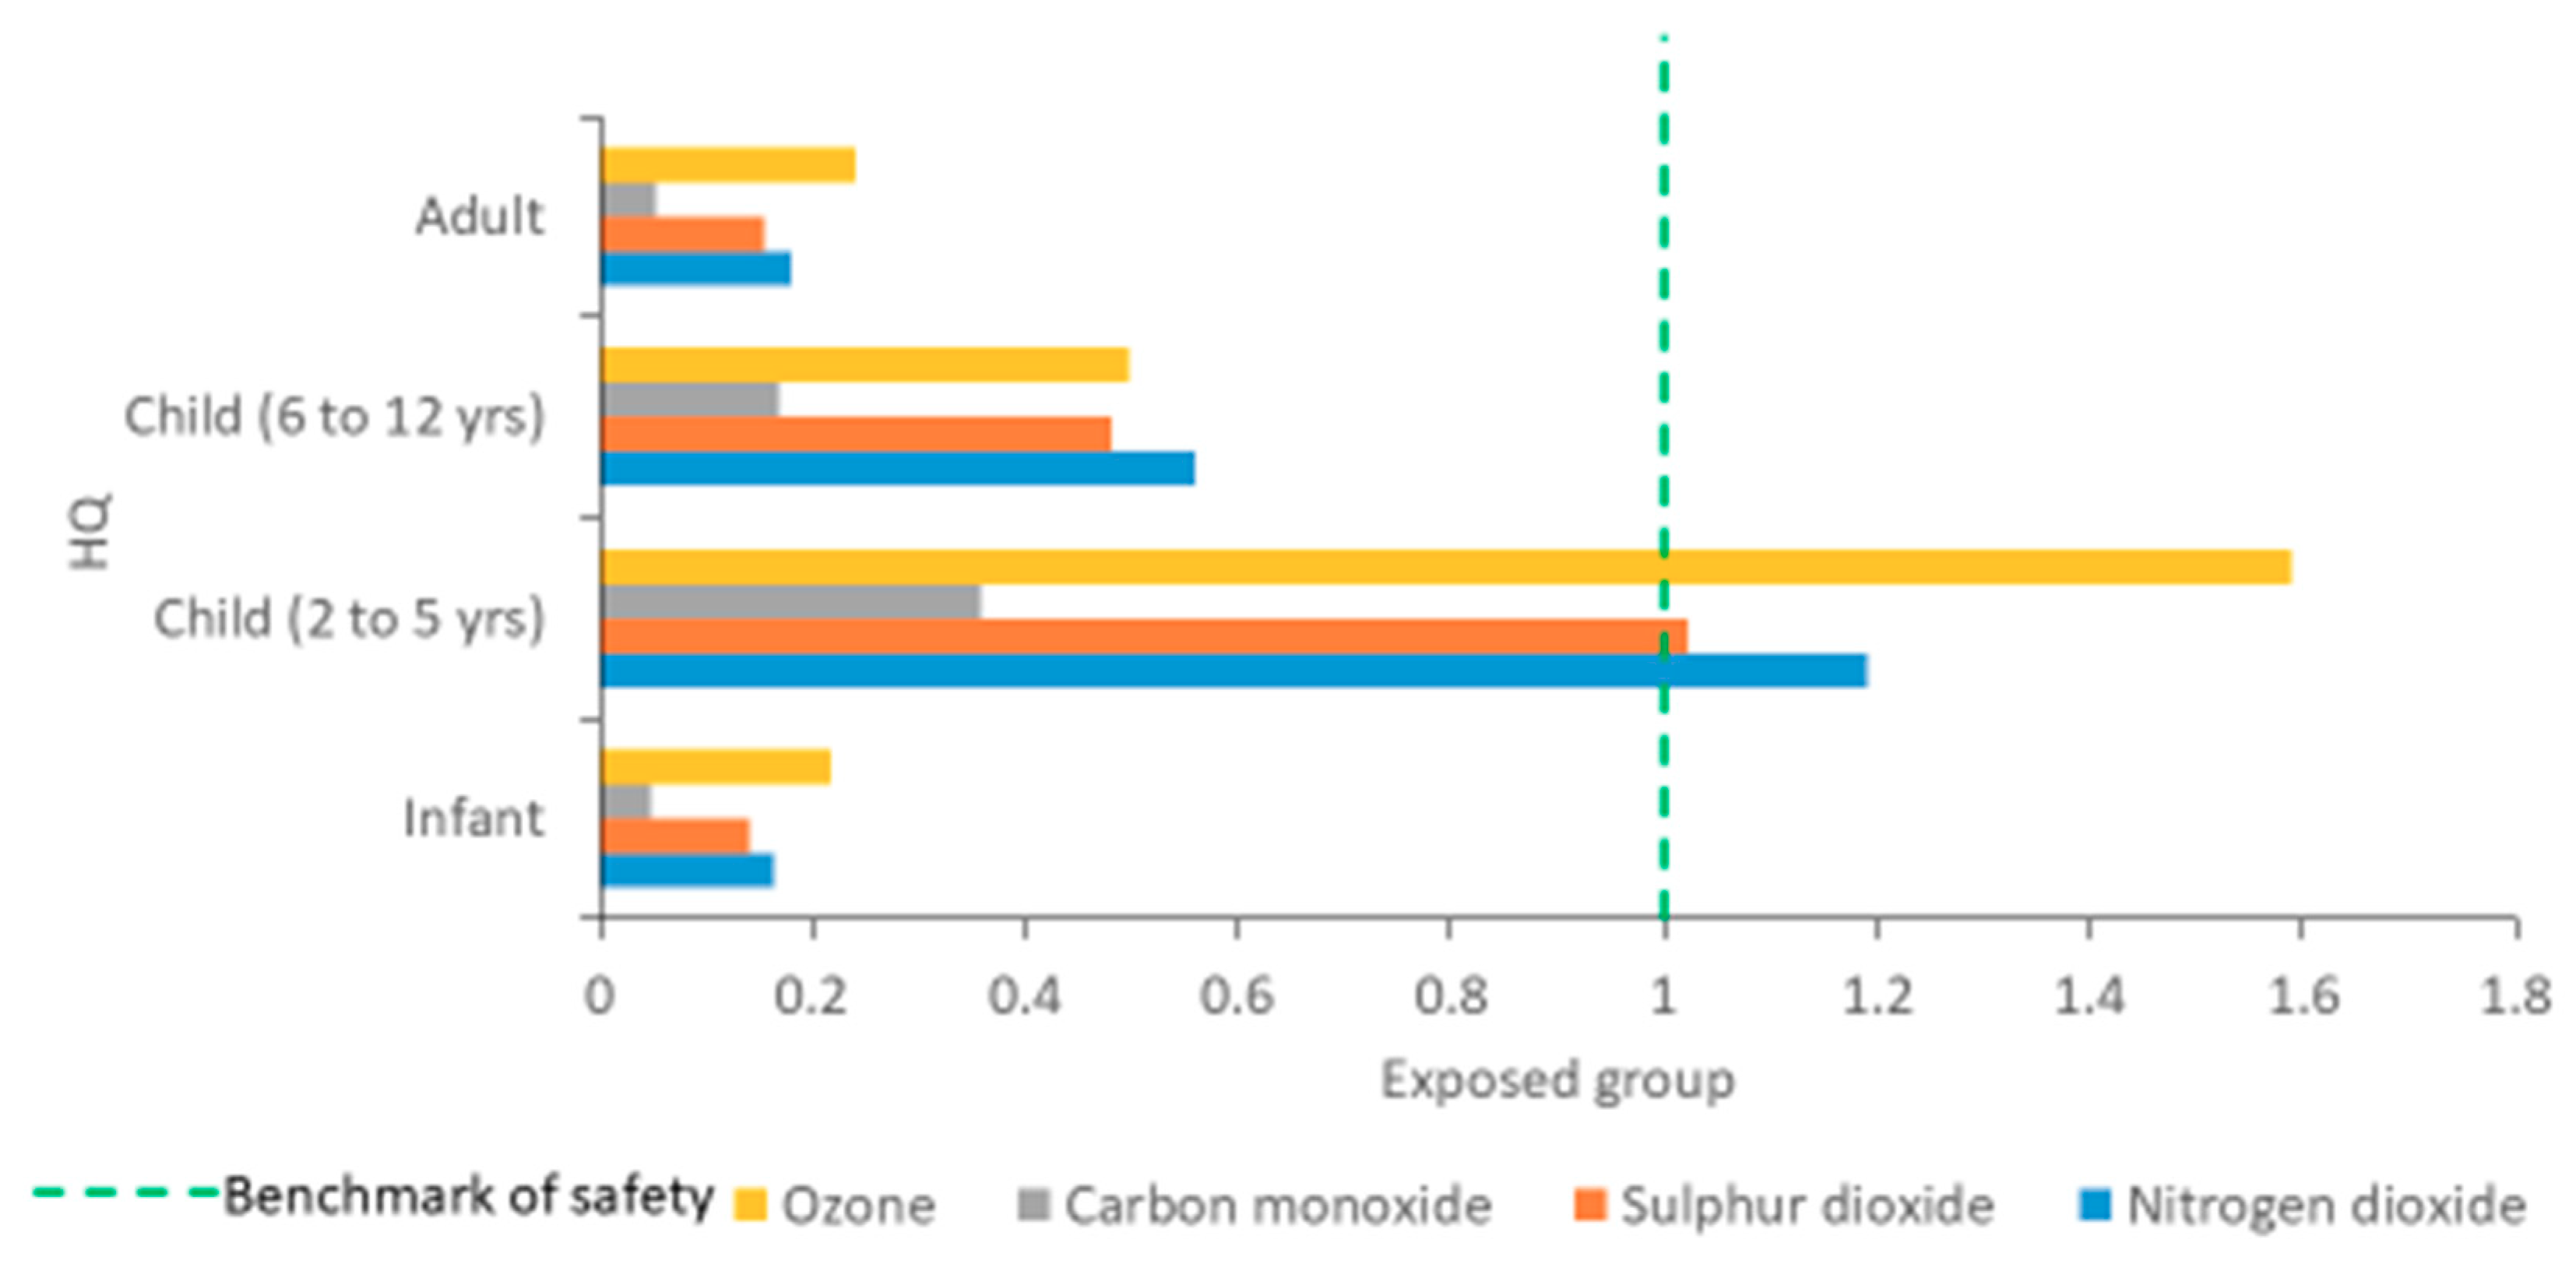
The results of the non-carcinogenic risks from exposure to an ADD of NO2, SO2, CO, and O3 via the inhalation route are presented in Figure 6. It was assumed that the inhalation route is the major pathway for exposure to the pollutants. A similar pattern of health risk from exposure to NO2, SO2, CO, and O3 was observed. The calculated HQ for each pollutant across exposed groups (except children) was less than 1 (HQ < 1). This indicates that the levels of NO2, SO2, CO, and O3 recorded for Pretoria West are unlikely to pose a threat to public health (infants, toddlers and adults). However, the HQ of exposure to NO2 (1.192), SO2 (1.021) and O3 (1.589) among children was greater than 1 (HQ > 1). This implies that children (2–5 years) have a higher potential for experiencing non-carcinogenic health effects through exposure to NO2, SO2 and O3 than infants and adults.
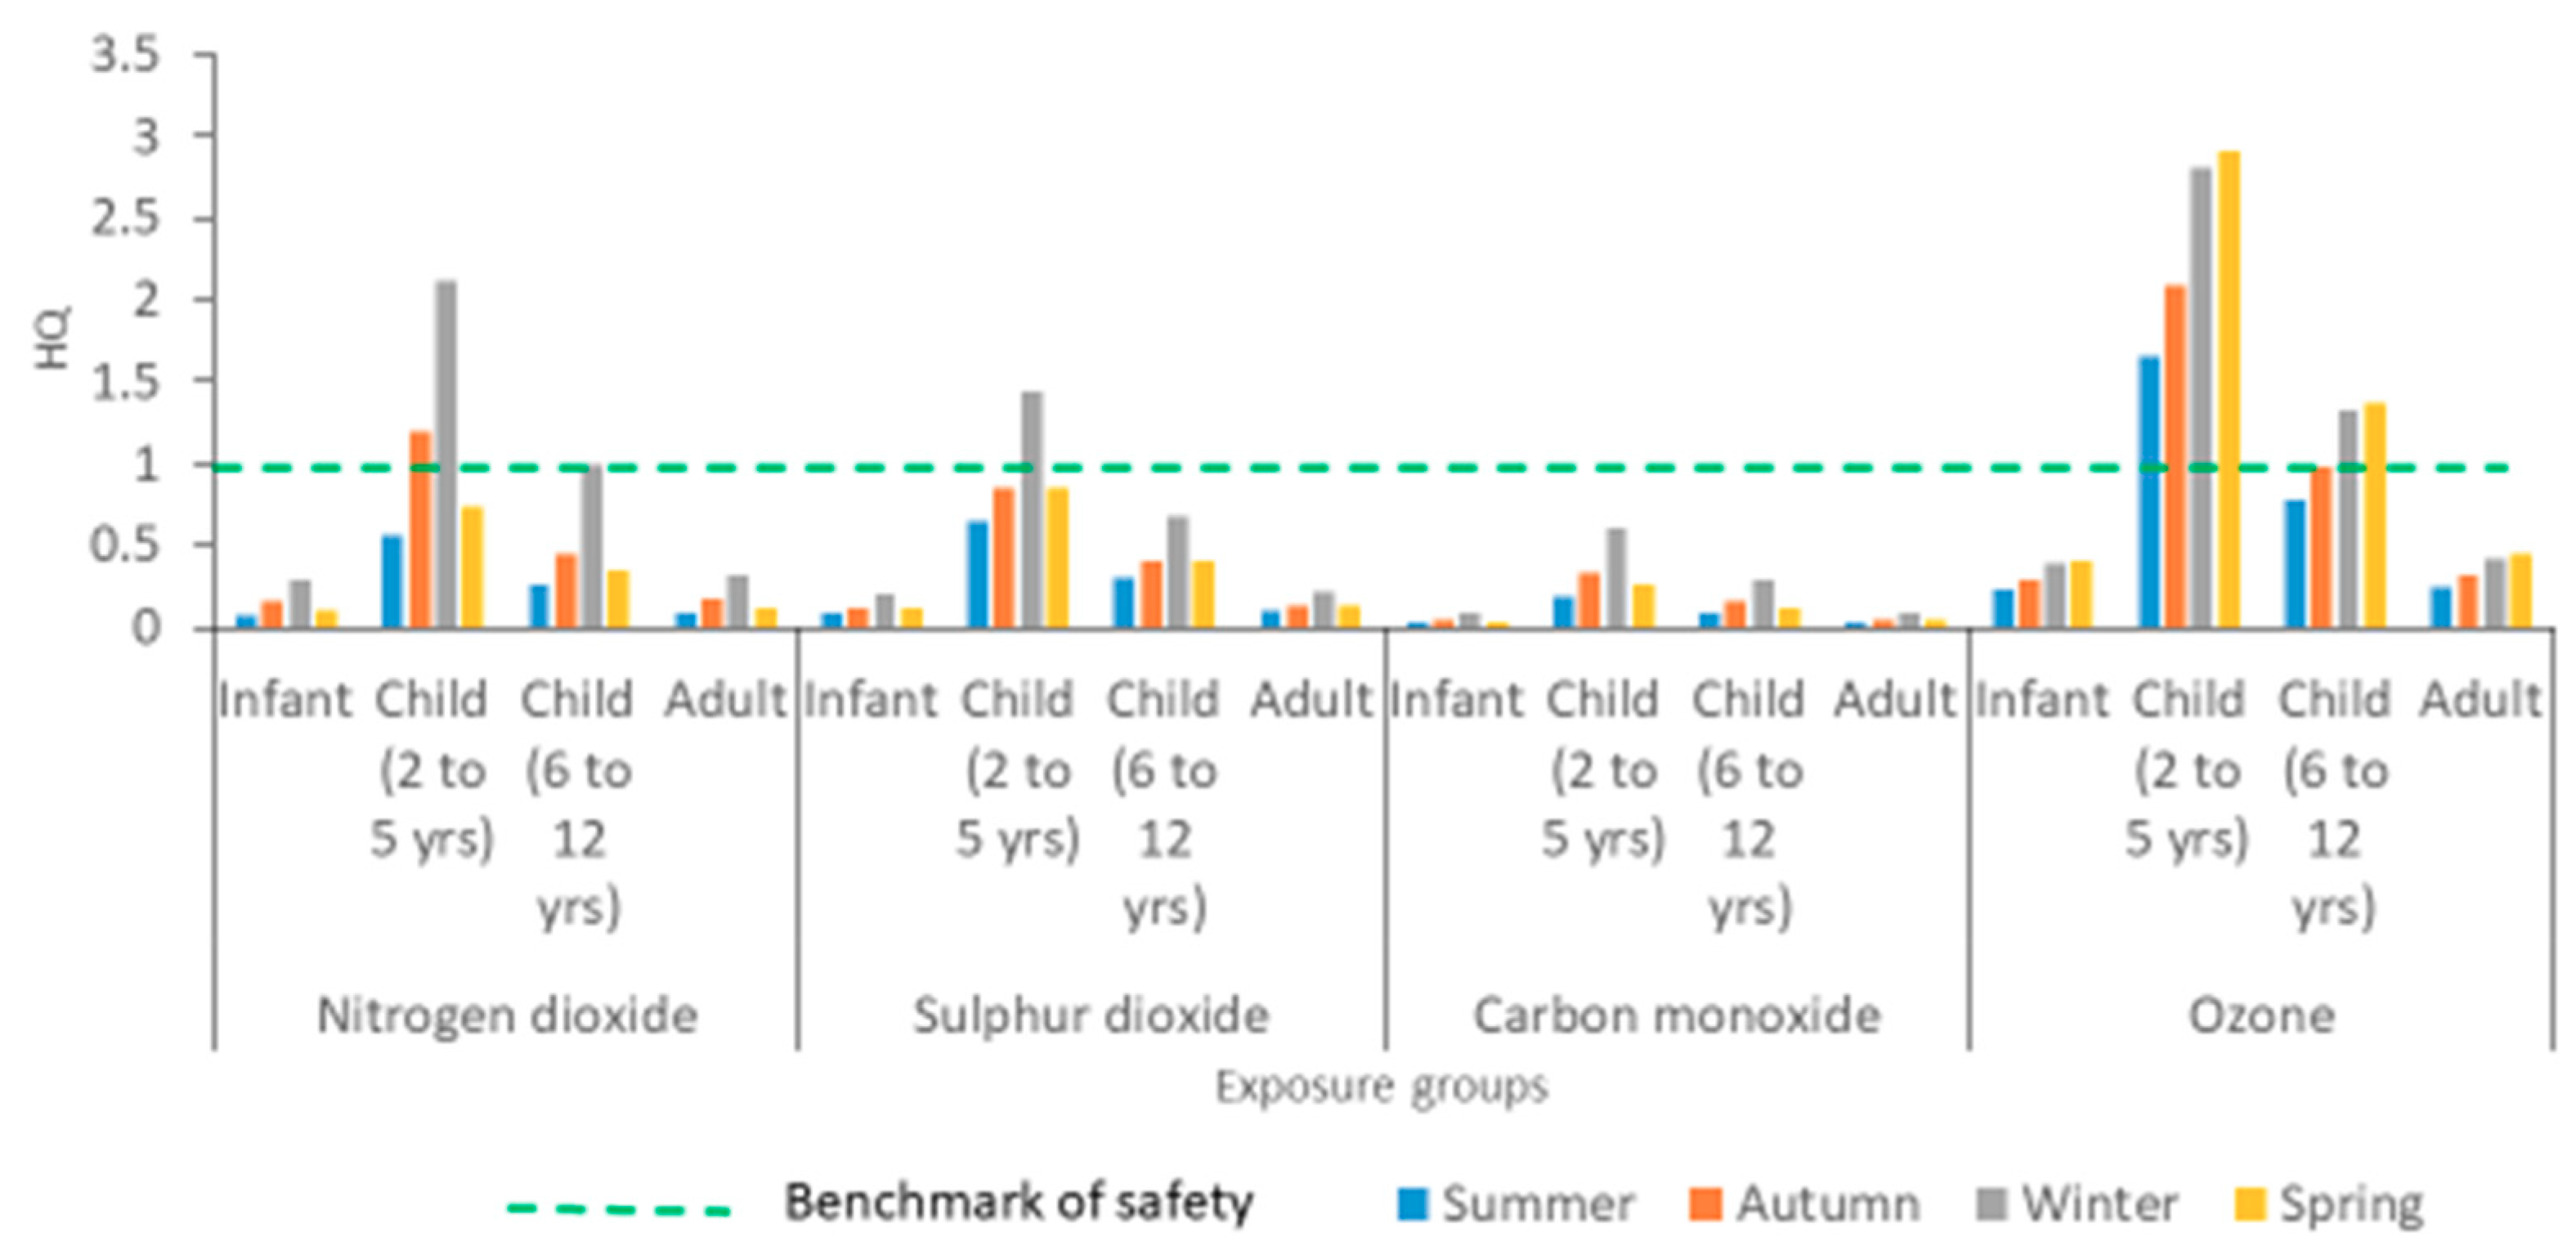
The seasonal non-carcinogenic risks of NO2, SO2, CO, and O3 through the inhalation pathway are presented in Figure 7. All pollutants induce greater non-carcinogenic effects during winter than during the other seasons. The order of HQ is winter > autumn > spring > summer. Similarly, higher non-carcinogenic risks from the ingestion of NO2, SO2, CO, and O3 were observed among children than among the other age groups during the different seasons. This suggests that although the levels of NO2, SO2, CO, and O3 in the study area are low, some non-cancer risks among vulnerable groups could be induced.
The possibility of adverse health outcomes occurring from exposure to levels of gaseous pollutants that are below the safe limits stipulated by regulatory agencies has been reported [58]. Human exposure to low concentrations of NO2 may result in hospital admission for respiratory infections and acute and obstructive lung diseases [59,60]. In Europe, a significant association was found between exposure to a small amount of NO2 and the occurrence of acute is chaemic stroke [61,62]. Owing to the ability of O3 to impair lung tissues, exposure to O3 can induce coughing, breathlessness and chest pain. An immune response to allergens in susceptible individuals could also be triggered [2].
4. Conclusions
This study provided information on the concentrations and trends of key gaseous pollutants in Pretoria West industrial area. Air quality in the study area was based on the monitored data of NO2, SO2, CO, and O3 from January to December 2016. The annual mean concentrations of the pollutants did not exceed the South African recommended standards. There was a daily diurnal variation in the concentration of the pollutants, with NO2, SO2 and CO having the highest and lowest levels during the night hours and the day hours respectively. Conversely, higher levels of O3 were recorded during the daytime. Also, NO2, SO2, and CO presented the highest levels in winter and the lowest level in summer, while the O3 concentration peaked in summer and was at its lowest in winter. Moreover, children are more likely to be susceptible to the non-cancer effects of exposure to the monitored gaseous pollutants. Although the annual concentration of the pollutants did not exceed the level recommended by the South African government, the recorded levels could pose some degree of non-cancer risk to susceptible individuals. Continuous monitoring of the ambient levels of the pollutant in the study area will ensure compliance with emission standards as instituted by government of South Africa.
Author Contributions
Conceptualization, O.M.M., M.I.M. and M.S.M.; Methodology, O.M.M., M.I.M. and M.S.M.; Software, O.M.M.; Validation, O.M.M., M.I.M. and M.S.M.; formal Analysis, O.M.M.; Investigation, O.M.M., M.I.M. and M.S.M.; Resources, M.I.M. and M.S.M.; Data curation, O.M.M., M.I.M., and M.S.M.; Writing—Original draft preparation, O.M.M.; Writing—Review and Editing, O.M.M., M.I.M.; Visualization, O.M.M.; Supervision, M.I.M. and M.S.M.; Project administration, O.M.M., M.I.M. and M.S.M.; Funding acquisition, M.I.M. and M.S.M. All authors have read and agreed to the published version of the manuscript.
Funding
This research was funded by the Tshwane University of Technology, Pretoria, South Africa. We also acknowledge part funding from the National Institute of Human and Social Sciences (NIHSS), South Africa’s BRICS think tank, Education and Health Cluster.
Acknowledgments
The authors thank the originators of the data used in this study.
Conflicts of Interest
The authors declare no conflict of interest. The sponsors had no role in the design, execution, interpretation, or writing of the study.
References
- Brauer, M.; Amann, M.; Burnett, R.T.; Cohen, A.; Dentener, F.; Ezzati, M.; Henderson, S.B.; Krzyzanowski, M.; Martin, R.V.; Van Dingenen, R.V.; et al. Exposure assessment for estimation of the global burden of disease attributable to outdoor air pollution. Environ. Sci. Technol. Lett. 2012, 46, 652–660. [Google Scholar] [CrossRef] [Green Version]
- Kim, K.H.; Jahan, S.A.; Kabir, E. A review on human health perspective of air pollution with respect to allergies and asthma. Environ. Int. 2013, 59, 41–52. [Google Scholar] [CrossRef]
- Mustafić, H.; Jabre, P.; Caussin, C.; Murad, M.H.; Escolano, S.; Tafflet, M.; Périer, M.; Marijon, E.; Vernerey, D.; Empana, J.; et al. Main air pollutants and myocardial infarction: A systematic review and meta-analysis. JAMA 2012, 307, 713–721. [Google Scholar] [CrossRef]
- Naidoo, R.; Robins, T.G.; Batterman, S.; Mentz, G.; JACK, C. Ambient pollution and respiratory outcomes among school children in Durban, South Africa. S. Afr. J. Child Health 2013, 7, 127–134. [Google Scholar] [CrossRef]
- Happo, M.S.; Salonen, R.O.; Hälinen, A.I.; Jalava, P.I.; Pennanen, A.S.; Dormans, J.A.; Gerlofs-Nijland, M.E.; Cassee, F.R.; Kosma, V.M.; Sillanpää, M.; et al. Inflammation and tissue damage in mouse lung by single and repeated dosing of urban air coarse and fine particles collected from six European cities. Inhal. Toxicol. 2010, 22, 402–416. [Google Scholar] [CrossRef]
- Ko, F.W.; Hui, D.S. Air pollution and chronic obstructive pulmonary disease. Respirology 2012, 17, 395–401. [Google Scholar] [CrossRef]
- Chen, S.-Y.; Chan, C.-C.; Su, T.-C. Particulate and gaseous pollutants on inflammation, thrombosis, and autonomic imbalance in subjects at risk for cardiovascular disease. Environ. Pollut. 2017, 223, 403–408. [Google Scholar] [CrossRef]
- United States Environmental Protection Agency (US EPA). Primary National Ambient Air Quality Standard for Sulfur Dioxide; Final Rule; Federal Register; Office of the Federal Register, National Archives and Records Administration: Washington, DC, USA, 2010.
- World Health Organization (WHO). Review of Evidence on Health Aspects of Air Pollution—REVIHAAP Project; WHO: Geneva, Switzerland, 2013; Available online: http://www.euro.who.int/data/assests/pdffile/0020/182432/e96762-final.pdf (accessed on 29 June 2018).
- Organisation for Economic Co-operation and Development (OECD). Environmental Performance Reviews: South Africa; OECD: Paris, France, 2013; pp. 1–204. [Google Scholar]
- National Electricity Regulator (NER). Electricity Supply Statistics for South Africa; National Electricity Regulator: Johannesburg, South Africa, 2000. [Google Scholar]
- Spalding-Fecher, R.; Matibe, D.K. Electricity and externalities in South Africa. Energy Policy 2003, 31, 721–734. [Google Scholar] [CrossRef]
- Terblanche, P.; Nel, R.; Golding, T. Household Energy Sources in South Africa: An Overview of the Impact of Air Pollution on Human Health; CSIR Environmental Services, Department of Mineral and Energy Affairs and EMSA (Pty) Ltd.: Pretoria, South Africa, 1994. [Google Scholar]
- South Africa Department of Environmental Affairs and Tourism. National Environmental Management: Air Quality Act, 2004 (ACT NO. 39 of 2004). National Ambient Air Quality Standards for Particulate matter with aerodynamic diameter less than 2.5 micron metres (PM2.5). Gov. Gaz. 2012, 1–486. [Google Scholar]
- South Africa Department of Environmental Affairs and Tourism (DEAT). The 2007 National Framework for Air Quality Management in the Republic of South Africa; DEAT: Pretoria, South Africa, 2007. [Google Scholar]
- Maji, S.; Ahmed, S.; Siddiqui, W.A.; Ghosh, S. Short term effects of criteria air pollutants on daily mortality in Delhi, India. Atmos. Environ. 2017, 150, 210–219. [Google Scholar] [CrossRef]
- City of Tshwane Agriculture and Environmental Management Department. Air Quality Management in Tshwane; Environmental Management Division; City of Tshwane Agriculture and Environmental Management Department: Pretoria, South Africa, 2016. [Google Scholar]
- Environmental Management Services Department, City of Tshwane. Available online: www.tshwane.gov.za (accessed on 25 September 2015).
- Morakinyo, O.M.; Adebowale, A.S.; Mokgobu, M.I.; Mukhola, M.S. Health risk of inhalation exposure to sub-10 µm particulate matter and gaseous pollutants in an urban-industrial area in South Africa: An ecological study. BMJ Open. 2017, 7, 1–9. [Google Scholar] [CrossRef]
- Morakinyo, O.M.; Mokgobu, M.I.; Mukhola, M.S.; Engelbrecht, J.C. Health Risk assessment of exposure to ambient concentrations of Benzene, Toluene, and Xylene in Pretoria West, South Africa. Afr. J. Sci. Technol. Innov. Dev. 2017, 9, 489–496. [Google Scholar] [CrossRef]
- Morakinyo, O.M.; Mokgobu, M.I.; Mukhola, M.S.; Godobedzha, T. Biological composition of Respirable Particulate matter in an industrial vicinity in South Africa. Int. J. Environ. Res. Public Health 2019, 16, 629. [Google Scholar] [CrossRef] [Green Version]
- Morakinyo, O.M.; Mukhola, M.S.; Mokgobu, M.I. Concentration levels and carcinogenic and mutagenic risks of PM2.5-bound polycyclic aromatic hydrocarbons in an urban–industrial area in South Africa. Environ. Geochem. Health 2019, 42, 1–16. [Google Scholar] [CrossRef]
- Ecotech. EC9810.A & B Series. Ozone Analyser. User Manual. Available online: www.ecotech.com (accessed on 9 December 2017).
- Teledyne Advanced Pollution Instrumentation, Inc. (Teledyne API). Model T300/T300M Carbon Monoxide Analyser. 2012. Available online: http://www.teledyne-api.com/products/carbon-compound-instruments/t300 (accessed on 8 March 2017).
- Teledyne Advanced Pollution Instrumentation, Inc. (Teledyne API). Model T100 UV Fluorescence SO2 Analyzer. 2012. Available online: http://www.teledyne-api.com/products/sulfur-compound-instruments/t100 (accessed on 8 March 2017).
- Teledyne Advanced Pollution Instrumentation, Inc. (Teledyne API). Model T200 NO/NO2/NOX Analyser. 2016. Available online: http://www.teledyne-api.com/products/nitrogen-compound-instruments/t200 (accessed on 8 March 2017).
- South Africa Department of Environmental Affairs and Tourism (DEAT). National Environmental Management: Air Quality Act, 2004 (Act No. 39 of 2004). In National Ambient Air Quality Standards; DEAT: Pretoria, South Africa, 2009. [Google Scholar]
- Organisation for Economic Cooperation and Development (OECD). OECD Environmental Outlook to 2030; OECD: Paris, France, 2008; Available online: www.sourceoecd.or (accessed on 8 March 2017).
- Saliba, N.A.; Nassar, J.; Hussein, F.; El Kfoury, D.E.L.; Nicolas, D.J.; El Tal, T.; Baalbaki, R. Airborne toxic pollutants: Levels, health effects, and suggested policy implementation framework in developing countries. Adv. Mol. Toxicol. 2016, 10, 187–233. [Google Scholar]
- Gratt, L.B. Air Toxic Risk Assessment and Management: Public Health Risks for Normal Operations; Van Nostrand Reinhold: New York, NY, USA, 1996. [Google Scholar]
- Statistics South Africa. Available online: www.statssa.gov.za/ (accessed on 2 September 2015).
- Muller, E.; Diab, R.D.; Binedell, M.; Hounsome, R. Health risk assessment of kerosene usage in an informal settlement in Durban, South Africa. Atmos. Environ. 2003, 37, 2015–2022. [Google Scholar] [CrossRef]
- United States Environmental Protection Agency (US EPA). Guidelines for exposure assessment. In Federal Register; Risk Assessment Forum, U.S. Environmental Protection Agency: Washington, DC, USA, 1992. [Google Scholar]
- United States Environmental Protection Agency (US EPA). Risk Assessment Guidance for Superfund, Vol 1: Human Health Evaluation Manual (Part A); Office of Emergency and Remedial Response, US Environmental Protection Agency: Washington, DC, USA, 1989. Available online: http://www.epa.gov/superfund/programs/risk/ragsa (accessed on 20 June 2015).
- United States Environmental Protection Agency (US EPA). Exposure Factors Handbook; National Center for Environmental Assessment, Office of Research and Development, U.S. Environmental Protection Agency: Washington, DC, USA, 1997. Available online: http://www.epa.gov/ncea/expofac.htm (accessed on 20 June 2015).
- Matooane, M.; Diab, R. Health risk assessment for sulfur dioxide pollution in South Durban, South Africa. Arch. Environ. Health 2003, 58, 763–770. [Google Scholar] [CrossRef]
- Adon, M.; Yoboue, V.; Galy-Lacaux, C.; Liousse, C.; Diop, B.; Doumbia, E.H.T.; Gardrat, E.; Ndiaye, S.A.; Jarnot, C. Measurements of NO2, SO2, NH3, HNO3 and O3 in West African urban Environments. Atmos. Environ. 2016, 135, 31–40. [Google Scholar] [CrossRef]
- Hassan, S.K.; El-Abssawy, A.A.; Khoder, M.I. Characteristics of gas-phase nitric acid and ammonium-nitrate-sulfate aerosol, and their gas-phase precursors in a suburban area in Cairo, Egypt. Atmos. Pollut. Res. 2013, 4, 117–129. [Google Scholar] [CrossRef] [Green Version]
- Kirenga, B.J.; Meng, Q.; Van Gemert, F.; Aanyu-Tukamuhebwa, H.; Chavannes, N.; Katamba, A.; Obai, G.; Van Der Molen, T.; Schwander, S.; Mohsenin, V. The state of ambient air quality in two Ugandan cities: A pilot cross-sectional spatial assessment. Int. J. Environ. Res. Public Health 2015, 12, 8075–8091. [Google Scholar] [CrossRef] [Green Version]
- Chai, F.; Gao, J.; Chen, Z.; Wang, S.; Zhang, Y.; Zhang, J.; Zhang, H.; Yun, Y.; Ren, C. Spatial and temporal variation of particulate matter and gaseous pollutants in 26 cities in China. J. Environ. Sci. 2014, 26, 75–82. [Google Scholar] [CrossRef]
- Pui, D.Y.; Chen, S.-C.; Zuo, Z. PM2.5 in China: Measurements, sources, visibility and health effects, and mitigation. Particuology 2014, 13, 1–26. [Google Scholar] [CrossRef]
- Xue, Y.; Tian, H.; Yan, J.; Zhou, Z.; Wang, J.; Nie, L.; Pan, T.; Zhou, J.; Hua, S.; Wang, Y.; et al. Temporal trends and spatial variation characteristics of primary air pollutants emissions from coal-fired industrial boilers in Beijing, China. Environ. Pollut. 2016, 213, 717–726. [Google Scholar] [CrossRef]
- Zhang, H.; Li, J.; Ying, Q.; Yu, J.Z.; Wu, D.; Cheng, Y.; He, K.; Jiang, J. Source apportionment of PM2.5 nitrate and sulfate in China using a source-oriented chemical transport model. Atmos. Environ. 2012, 62, 228–242. [Google Scholar] [CrossRef]
- Zhao, B.; Wang, P.; Ma, J.Z.; Zhu, S.; Pozzer, A.; Li, W. A high-resolution emission inventory of primary pollutants for the Huabei region, China. Atmos. Chem. Phys. 2012, 12, 481–501. [Google Scholar] [CrossRef] [Green Version]
- Yadav, R.; Sahu, L.K.; Beig, G.; Tripathi, N.; Jaaffrey, S.N.A. Ambient particulate matter and carbon monoxide at an urban site of India: Influence of anthropogenic emissions and dust storms. Environ. Pollut. 2017, 225, 291–303. [Google Scholar] [CrossRef]
- Masiol, M.; Squizzato, S.; Formenton, G.; Harrison, R.M.; Agostinelli, C. Air quality across a European hotspot: Spatial gradients, seasonality, diurnal cycles and trends in the Veneto region, NE Italy. Sci. Total Environ. 2017, 576, 210–224. [Google Scholar] [CrossRef]
- Ran, L.; Lin, W.; Deji, Y.; La, B.; Tsering, P.; Xu, X.; Wang, W. Surface gas pollutants in Lhasa, a highland city of Tibet–current levels and pollution implications. Atmos. Chem. Phys. 2014, 14, 10721–10730. [Google Scholar] [CrossRef] [Green Version]
- Ou, J.; Zheng, J.; Li, R.; Huang, X.; Zhong, Z.; Zhong, L.; Lin, H. Speciated OVOC and VOC emission inventories and their implications for reactivity-based ozone control strategy in the Pearl River Delta region, China. Sci. Total Environ. 2015, 530, 393–402. [Google Scholar] [CrossRef]
- Sharma, S.K.; Datta, A.; Saud, T.; Saxena, M.; Mandal, T.K.; Ahammed, Y.N.; Arya, B.C. Seasonal variability of ambient NH3, NO, NO2 and SO2 over Delhi. J. Environ. Sci. 2010, 22, 1023–1028. [Google Scholar] [CrossRef]
- Jeong, J.I.; Park, R.J. Winter monsoon variability and its impact on aerosol concentrations in East Asia. Environ. Pollut. 2017, 221, 285–292. [Google Scholar] [CrossRef]
- Liu, T.; Gong, S.; He, J.; Yu, M.; Wang, Q.; Li, H.; Liu, W.; Zhang, J.; Li, L.; Wang, X.; et al. Attributions of meteorological and emission factors to the 2015 winter severe haze pollution episodes in China’s Jing-Jin-Ji area. Atmos. Chem. Phys. 2017, 17, 2971–2980. [Google Scholar] [CrossRef] [Green Version]
- Li, R.; Cui, L.; Li, J.; Zhao, A.; Fu, H.; Wu, Y.; Zhang, L.; Kong, L.; Chen, J. Spatial and temporal variation of particulate matter and gaseous pollutants in China during 2014–2016. Atmos. Environ. 2017, 161, 235–246. [Google Scholar] [CrossRef]
- Xu, R.G.; Tang, G.Q.; Wang, Y.S.; Tie, X.X. Analysis of a long-term measurement of air pollutants (2007–2011) in North China Plain (NCP); impact of emission reduction during the Beijing Olympic Games. Chemosphere 2016, 159, 647–658. [Google Scholar] [CrossRef] [PubMed]
- Antony Chen, L.W.; Doddridge, B.G.; Dickerson, R.R.; Chow, J.C.; Mueller, P.K.; Quinn, J.; Butler, W.A. Seasonal variations in elemental carbon aerosol, carbon monoxide and sulfur dioxide: Implications for sources. Geophys. Res. Lett. 2001, 28, 1711–1714. [Google Scholar] [CrossRef]
- Jaffe, D.A.; Zhang, L. Meteorological anomalies lead to elevated O3 in the western U.S. in June 2015. Geophys. Res. Lett. 2017, 44, 1990–1997. [Google Scholar] [CrossRef]
- Skerlak, B.; Sprenger, M.; Pfahl, S.; Roches, A.; Sodemann, H.; Wernli, H. Rapid exchange between the stratosphere and the planetary boundary layer over the Tibetan Plateau. EGU Gen. Assem. Conf. Abstr. 2014, 16, 9903. [Google Scholar]
- Ghozikali, M.G.; Heibati, B.; Naddafi, K.; Kloog, I.; Conti, G.O.; Polosa, R.; Ferrante, M. Evaluation of chronic obstructive pulmonary disease (COPD) attributed to atmospheric O3, NO2, and SO2 using Air Q Model (2011–2012 year). Environ. Res. 2016, 144, 99–105. [Google Scholar] [CrossRef] [Green Version]
- Katsouyanni, K.; Touloumi, G.; Spix, C.; Schwartz, J.; Balducci, F.; Medina, S.; Rossi, G.; Wojtyniak, B.; Sunyer, J.; Bacharova, L.; et al. Short-term effects of ambient sulphur dioxide and particulate matter on mortality in 12 European cities: Results from time series data from the APHEA project. Air Pollution and Health: A European Approach. BMJ 1997, 314, 1658–1663. [Google Scholar] [CrossRef] [Green Version]
- Chen, R.; Samoli, E.; Wong, C.M.; Huang, W.; Wang, Z.; Chen, B.; Kan, H. Associations between short-term exposure to nitrogen dioxide and mortality in 17 Chinese cities: The China Air Pollution and Health Effects Study (CAPES). Environ. Intl. 2012, 45, 32–38. [Google Scholar] [CrossRef]
- Santus, P.; Russo, A.; Madonini, E.; Allegra, L.; Blasi, F.; Centanni, S.; Miadonna, A.; Schiraldi, G.; Amaducci, S. How air pollution influences clinical management of respiratory diseases. A case-crossover study in Milan. Resp. Res. 2012, 13, 95. [Google Scholar] [CrossRef] [PubMed] [Green Version]
- Vidale, S.; Bonanomi, A.; Guidotti, M.; Arnaboldi, M.; Sterzi, R. Air pollution positively correlates with daily stroke admission and in hospital mortality: A study in the urban area of Como, Italy. Neurol. Sci. 2010, 31, 179–182. [Google Scholar] [CrossRef]
- Anderson, Z.J.; Kristiansen, L.C.; Anderson, K.K.; Olsen, T.S.; Hvidberg, M.; Jensen, S.S.; Ketzel, M.; Loft, S.; Sorensen, M.; Tjonneland, A.; et al. Stroke and long-term exposure to outdoor air pollution from nitrogen dioxide: A cohort study. Stroke 2012, 43, 320–325. [Google Scholar] [CrossRef] [Green Version]
Figure 1.
Google Earth image depicting Pretoria West industrial area. Source: Morakinyo et al. [20,21,22]. Red rings indicate some of the emission stacks in the study area.

Figure 2.
CO, NO2, SO2, and O3 samplers.

Figure 3.
A flow chart of data type analysed and used for human health risk assessment.

Figure 4.
Trends in the concentrations of NO2, SO2, CO, and O3. *PTA West – Pretoria West Industrial Area.
Figure 4.
Trends in the concentrations of NO2, SO2, CO, and O3. *PTA West – Pretoria West Industrial Area.

Figure 5.
Pollution roses NO2 (a), SO2 (b), CO (c), and O3 (d).

Figure 6.
Non-carcinogenic risks of NO2, SO2, CO, and O3.

Figure 7.
Seasonal non-carcinogenic risk assessment for NO2, SO2, CO, and O3.


Table 1.
Reference ambient standards for CO, NO2, SO2, and O3.
| Pollutant | Reference Standard Concentration | |||
|---|---|---|---|---|
| 1 h (µg/m3) | 8 h (µg/m3) | 24 h (µg/m3) | Annual (µg/m3) | |
| NO2 | 200* | - | 188*** | 40* |
| SO2 | 350* | - | 125* | 50* |
| CO | 29,770** | 10,305** | - | - |
| O3 | 226*** | 120* | - | - |
*NAAQS—National Ambient Air Quality Standards for South Africa; **Default value was in ppm; ***South Africa standards—Air Quality Act (Act 39 of 2004); NO2: nitrogen dioxide, SO2: sulphur dioxide, CO: carbon monoxide, O3: ozone Source: South Africa [27].
Table 2.
Recommended values in equations of the daily exposure dose of CO, NO2, SO2.
| Parameter | Definition | Value for Age Categories | Reference | |||
|---|---|---|---|---|---|---|
| Infant (0–1 yr.) | Child (2–5 yrs.) | Child (6–12 yrs.) | Adult (19–75 yrs.) | |||
| C | Mean concentration of CO, NO2, SO2 in ambient air (μg/m3) | |||||
| EF | Exposure frequency (days/year) | 350 | 350 | 350 | 350 | [19,35] |
| ED | Exposure duration (years) | 1 | 6 | 12 | 30 | [35,36] |
| AT | Averaging time (days); AT = ED X365 days | 365 | 2190 | 4380 | 10,950 | [35,36] |
| BW | Body weight (kg) | 11.3 | 22.6 | 45.3 | 71.8 | [35,36] |
| InhR | Inhalation rate (m3/day) | 9.2 | 16.74 | 21.02 | 21.4 | [35] |
Table 3.
Ambient concentrations of NO2, SO2, CO, and O3.
| Averaging Time | NO2 (µg/m3) Mean | SO2 (µg/m3) Mean | CO (µg/m3) Mean | O3 (µg/m3) Mean |
|---|---|---|---|---|
| 1 h | 18.35 | 16.21 | 295.41 | 26.84 |
| 8 h | - | - | 649.90 | 33.56 |
| 24 h | 18.47 | 16.84 | - | - |
| Annual | 39.44 | 22.46 | 722.00 | - |
Table 4.
Mean seasonal concentrations of NO2, SO2, CO and O3.
| Season | NO2 (µg/m3) Mean | SO2 (µg/m3) Mean | CO (µg/m3) Mean | O3 (µg/m3) Mean |
|---|---|---|---|---|
| Summer | 18.76 | 14.23 | 352.89 | 61.51 |
| Autumn | 39.51 | 18.83 | 592.42 | 44.04 |
| Winter | 70.20 | 31.80 | 1108.36 | 34.92 |
| Spring | 24.43 | 18.74 | 459.03 | 59.36 |
© 2020 by the authors. Licensee MDPI, Basel, Switzerland. This article is an open access article distributed under the terms and conditions of the Creative Commons Attribution (CC BY) license (http://creativecommons.org/licenses/by/4.0/).
Share and Cite
MDPI and ACS Style
Morakinyo, O.M.; Mukhola, M.S.; Mokgobu, M.I. Ambient Gaseous Pollutants in an Urban Area in South Africa: Levels and Potential Human Health Risk. Atmosphere 2020, 11, 751. https://doi.org/10.3390/atmos11070751
AMA Style
Morakinyo OM, Mukhola MS, Mokgobu MI. Ambient Gaseous Pollutants in an Urban Area in South Africa: Levels and Potential Human Health Risk. Atmosphere. 2020; 11(7):751. https://doi.org/10.3390/atmos11070751
Chicago/Turabian StyleMorakinyo, Oyewale Mayowa, Murembiwa Stanley Mukhola, and Matlou Ingrid Mokgobu. 2020. "Ambient Gaseous Pollutants in an Urban Area in South Africa: Levels and Potential Human Health Risk" Atmosphere 11, no. 7: 751. https://doi.org/10.3390/atmos11070751
Note that from the first issue of 2016, this journal uses article numbers instead of page numbers. See further details here.