An Improved Traffic Congestion Monitoring System Based on Federated Learning

1
Department of Computer Application, China University of Geosciences, Wuhan 430074, China
2
Department of Computer Science and Technology, Nanjing University, Nanjing 210023, China
*
Author to whom correspondence should be addressed.
Information 2020, 11(7), 365; https://doi.org/10.3390/info11070365
Submission received: 20 June 2020
/
Revised: 15 July 2020
/
Accepted: 15 July 2020
/
Published: 16 July 2020
(This article belongs to the Special Issue Smart Sensing, Data Communication, and Decision Making in Intelligent Transportation and Logistics Systems)
Abstract
:This study introduces a software-based traffic congestion monitoring system. The transportation system controls the traffic between cities all over the world. Traffic congestion happens not only in cities, but also on highways and other places. The current transportation system is not satisfactory in the area without monitoring. In order to improve the limitations of the current traffic system in obtaining road data and expand its visual range, the system uses remote sensing data as the data source for judging congestion. Since some remote sensing data needs to be kept confidential, this is a problem to be solved to effectively protect the safety of remote sensing data during the deep learning training process. Compared with the general deep learning training method, this study provides a federated learning method to identify vehicle targets in remote sensing images to solve the problem of data privacy in the training process of remote sensing data. The experiment takes the remote sensing image data sets of Los Angeles Road and Washington Road as samples for training, and the training results can achieve an accuracy of about 85%, and the estimated processing time of each image can be as low as 0.047 s. In the final experimental results, the system can automatically identify the vehicle targets in the remote sensing images to achieve the purpose of detecting congestion.
1. Introduction
With the increasing number of vehicles, traffic congestion is inevitable. Traffic congestion consumes time, wastes energy, and causes air pollution. According to the global Traffic Scorecard 2019 [1], in Boston, the most congested city in America, the average commuter spends 149 h a year stuck in traffic, costing each driver $2205. With the continuous improvement of the road traffic system, traffic congestion occurs not only in cities, but also on some highways and township roads without monitoring systems. In addition, the traffic situation changes rapidly, and other factors such as bad weather, construction projects, and road traffic accidents often cause traffic congestion [2]. There are some unexpected factors which make it difficult for the existing traffic system to find traffic problems in time.
In order to achieve the extensive monitoring of traffic congestion, sporadic areas cannot be missed and traffic congestion caused by emergencies can be discovered in time. We use remote sensing data as the data source of this system. Remote sensing uses the earth satellites and some near-ground aircrafts to realize the real-time monitoring of the state of the earth’s surface. With the continuous improvement of remote sensing data accuracy, it is more convenient for people to analyze the real-time state of some places on the earth surface from the remote sensing data. For example, Google maps provide us with navigation services using remote sensing satellite data. Remote sensing data can be obtained in real time [3]. Aerial photography—the real-time image captured by the Unmanned Aerial Vehicle—is a kind of real-time remote sensing data. We can also obtain real-time remote sensing data from satellites’ remote sensing.
Due to the privacy of some remote sensing data sources, how to ensure their data security during deep learning training is a crucial issue. This system introduces a method of federated learning so that when multiple training nodes form a training model at the same time, they cannot obtain the training data sources of other data and the server node cannot infer its data source from the model provided by the training node, in order to achieve the purpose of protecting remote sensing source data.
Even with remote sensing data and federated learning, designing such a real-time traffic monitoring system is still very challenging. Technical difficulties are mainly in the following four areas.
- The high-resolution remote sensing data are classified—they cannot be processed using the usual deep learning methods which may lead to data leakage, and data privacy is one of the major concerns of this system.
- There are many causes of road traffic congestion such as traffic accidents, traffic control, and some emergencies, which lead to difficulties in determining current traffic situations.
- How to select appropriate remote sensing images as training samples is another problem. Remote sensing images need to cover road areas and make the vehicle targets clear enough.
- Choosing a suitable neural network model based on the characteristics of targets in remote sensing images is also a problem.
In order to resolve these challenges, we have taken a series of measures in our system; this is also the main contribution of this study.
- This system uses remote sensing data as a data source for congestion analysis, which solves the problem of the inadequate coverage of the traffic monitoring system.
- Due to the huge amount of data processing, the system uses the MobileNet convolutional neural network to solve the problem that each picture needs to have multiple targets that need to be detected.
- The system proposes federated learning on the basis of deep learning to solve the data protection problem, which is an implicit but high-risk problem. The node data model generated by federated learning solves the problems of the inaccurate training results of single-node remote sensing data and slow training speed.
The rest of the study is as follows. The related work and research comparison and analysis of traffic congestion monitoring based on remote sensing data and federated learning methods are presented in Section 2. Section 3 analyzes the necessary methods for implementing this system. Section 4 carries out simulation experiments based on the method and conducts control experiments to determine the optimal method. Section 5 describes related experimental results and improved methods for different data sources, as well as congestion monitoring methods and some conclusions and suggestions for future research. The final conclusion and future research directions of this study will be discussed in Section 6.
2. Related Work
The studies related to the traffic congestion monitoring system based on remote sensing data and federated learning have two main parts. These are the use of target detection and the applications of deep learning in remote sensing data, and other methods of implementing traffic congestion monitoring systems.
2.1. Application of Target Detection and Deep Learning in Remote Sensing
The realization method of this research is to realize the target detection on the remote sensing data. In the study of Zambanini S. et al. [4], a parking space detection method based on high-resolution stereo satellite images was proposed. This method can infer the movement of cars through time intervals. In the research of Rheinhardt Scholtz et al. [5], middle-resolution remote sensing images were used to detect wildfires. These researches provided the possibility to realize vehicle target recognition based on remote sensing data to monitor traffic congestion. There are many applications of deep learning and neural networks in the field of remote sensing data. David j.lary’s team summarized the application of machine learning in geosciences and remote sensing [6]. Charlotte Pelletier’s team researched the robustness of random forests on remote sensing images [7]. Hugo Boulze et al. [8] proposed an algorithm to classify features in remote sensing images using convolutional neural networks. Daniel Laumer’s team used deep learning based on Google street-view to realize the detection of border trees in order to achieve city beautification [9]. Jie Chen’s team used a convolutional neural network to realize the classification of remote sensing data [10]. Haikel Alhichri’s team proposed a new convolutional neural network to adapt to deep learning in remote sensing images [11]. Some machine learning techniques, such as support vector machines, are used in remote sensing data classification. These machine learning algorithms together form a new generation of remote sensing data processing software—the Environment for Visualizing Images (ENVI) [12].
2.2. Implemented Traffic Congestion Monitoring
The current traffic congestion monitoring system mainly relies on a video monitoring system and a Global Position System. Wang. H [13] and Zhang X. [14] proposed a traffic congestion identification method based on a road monitoring system, similar to Chen. YZ [15] also proposed an OBD-based traffic congestion operation monitoring and optimization technology for urban road intersections; it can be concluded that this is one of the most commonly used methods. Shenzhen institute of advanced technology [16] proposed a congestion recognition technology based on a GPS positioning system which determines the congestion situation by measuring the vehicle speed through on-board GPS positioning.
There are far more ways to monitor traffic congestion. Similarly, the research by Rijurekha Sen et al. [17] also considered how to conduct congestion monitoring in areas where the traffic monitoring system is underdeveloped. They proposed an acoustic-based monitoring model to detect congestion. In order to reduce the expenses caused by half of the monitoring system and facilitate data processing, P. Chen et al. [18] proposed a method based on social software Twitter tweets to determine the congestion status in the vicinity through text analysis. E. del Arco et al. [19] proposed the establishment of a sensor network to detect the vehicle speed and position information to monitor congestion. Koushik Mandal et al. [20] have proposed a complete system for road congestion monitoring, which mainly used active RFID and GSM technology and used probe vehicles for data acquisition and monitoring. For the congestion monitoring of high-speed road sections, A. Ober-Sundermeier et al. [21] also proposed a method to provide traffic information to users based on existing models.
The above road congestion monitoring technologies can be roughly divided into two directions: one is based on advanced hardware-assisted monitoring, and the other is based on existing software for analysis to determine congestion. However, these methods still have some shortcomings in some aspects.
- The traffic congestion monitoring system implemented by hardware is mainly due to the high cost of hardware [13,15,19,20], and it is difficult to cover the vast economically underdeveloped areas, resulting in a limited monitoring range. Take the most commonly used road video surveillance system [13] as an example—even if there are multiple cameras at an intersection, each camera has a limited view and a limited visual distance. If the views of multiple cameras are spliced together, the results are not necessarily continuous. Therefore, the deployment of video surveillance systems in real life often fails to achieve ideal results, and there will always be blind corners.
The remote sensing data set used in this research has the characteristics of wide coverage and easy access, and is based on the application of deep learning described in research [6,7,9,10,11] in remote sensing, combined with an existing research [4,5,8] target detection algorithm. The availability of remote sensing images has related improvements to the above-mentioned traffic monitoring methods.
- Compared with the congestion monitoring algorithm implemented by software, the study highlights the characteristics of the wide coverage of remote sensing data and high accuracy of the target detection algorithm.
- Compared with the hardware implementation method, the study only uses remote sensing images, and the cost is much lower than that of the hardware equipment.
- Compared with the general deep learning methods based on remote sensing images, the study highlights the use of federated learning to solve the data security problem of remote sensing data training.
3. Methods
3.1. Geographic Information System for Transportation
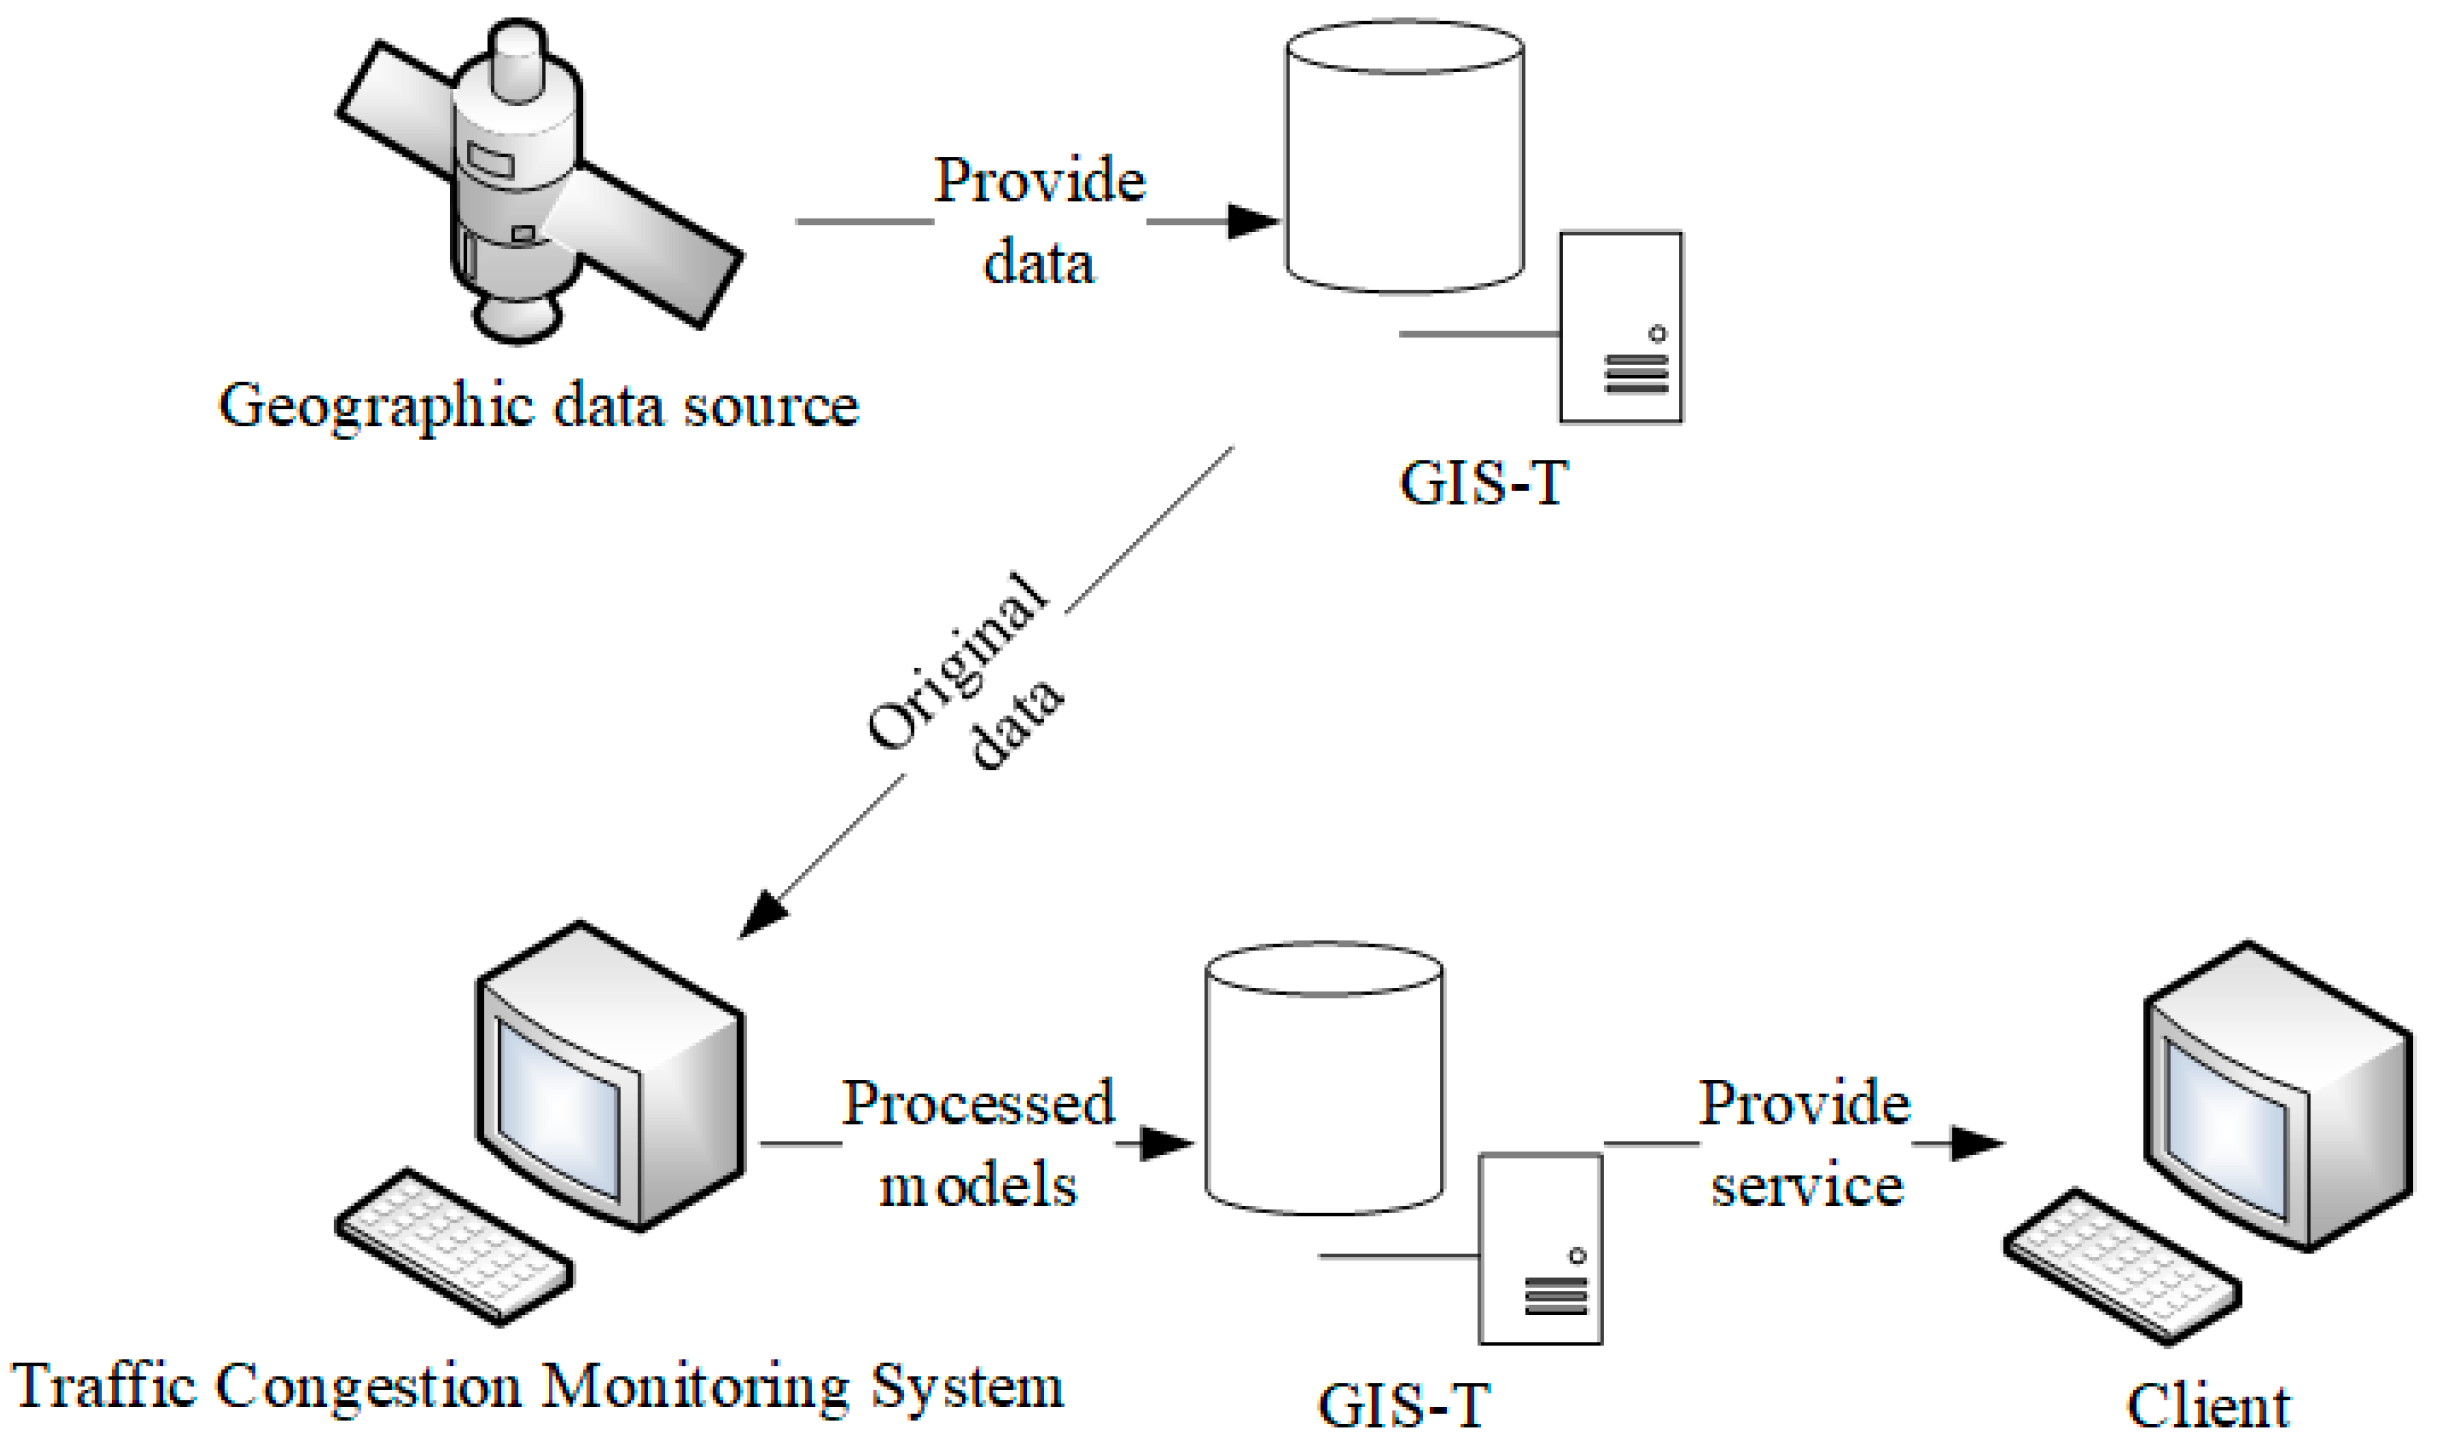
The traffic congestion monitoring system is a traffic geographic information analysis processing system. This system uses remote sensing data as the data source, so it is closely linked with the geographic information system (GIS). The functions of GIS in planning traffic and transportation belong to the Geographic Information System for Transportation (GIS-T) [22]. The realization of the GIS-T simulation and the improvement based on data security are the main realization ideas of this study.
In fact, GIS-T is presented in the form of a spatial information database which stores the traffic information and traffic status of various places and can provide convenience for urban planning and traffic management through the stored information. Inspired by GIS-T, our traffic congestion management system uses remote sensing data which are one of the GIS-T data sources as the data processing object; it firstly selects the appropriate convolutional neural network to construct the target detection algorithm, and then uses the federated learning method for synchronous training to obtain the prediction model. The whole process of data processing shown in Figure 1 is that the satellites provides data to GIS-T, and then GIS-T provides original data to the traffic congestion monitoring system. After the models are calculated by the system, they are sent to GIS-T again, and then GIS-T provides services to customers.
3.2. Convolutional Neural Network
The traffic congestion monitoring system based on remote sensing data essentially still requires vehicle target recognition in remote sensing images. Obviously, we need to use the relevant processing methods of computer vision. Therefore, it is necessary to first find a suitable neural network. The neural network needs to be able to be used in picture classification and recognition algorithms, and has the characteristics of being suitable for processing a large number of pictures, processing pictures with a high speed and high precision.
A convolutional neural network (CNN) [23] is a neural network which is centered on convolution computation and imitates human visual perception through repeated convolution and pooling and is fully connected. In 2020, the latest study, CNN is also often used as the foundation network for complex images recognition and constantly optimized face recognition [24]. For general large-scale image classification, CNN is appropriate to extract the discriminant features of the images by convolutional kernel to achieve the purpose of image recognition.
Due to the processing characteristics of CNN in computer vision, we chose this algorithm for image target recognition in remote sensing data, because the detection target vehicle is only a small part of the remote sensing image. Therefore, the target detection algorithm should be added in the detection process. This requires that the selected neural network be concise and universal. In addition, due to the large amount of data calculation, the selected neural network needs to have a fast calculation speed. Thus, we use the MobileNet network, which is a kind of convolution neural network, as the basis for constructing the target detection algorithm.
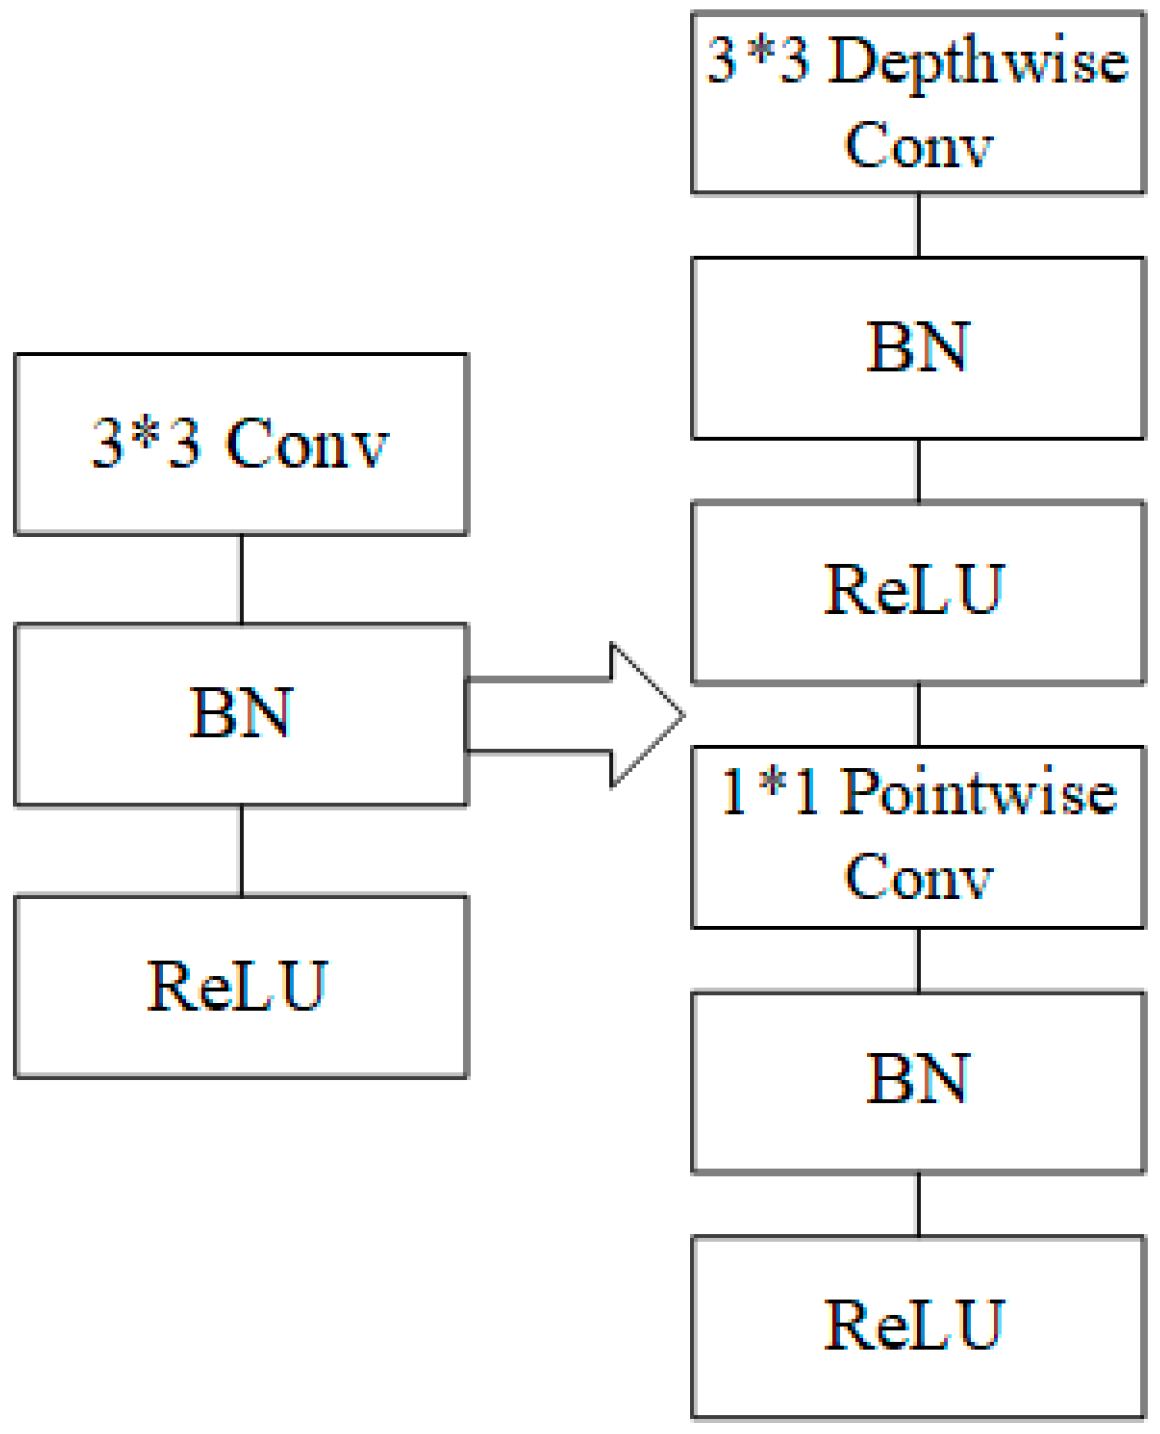
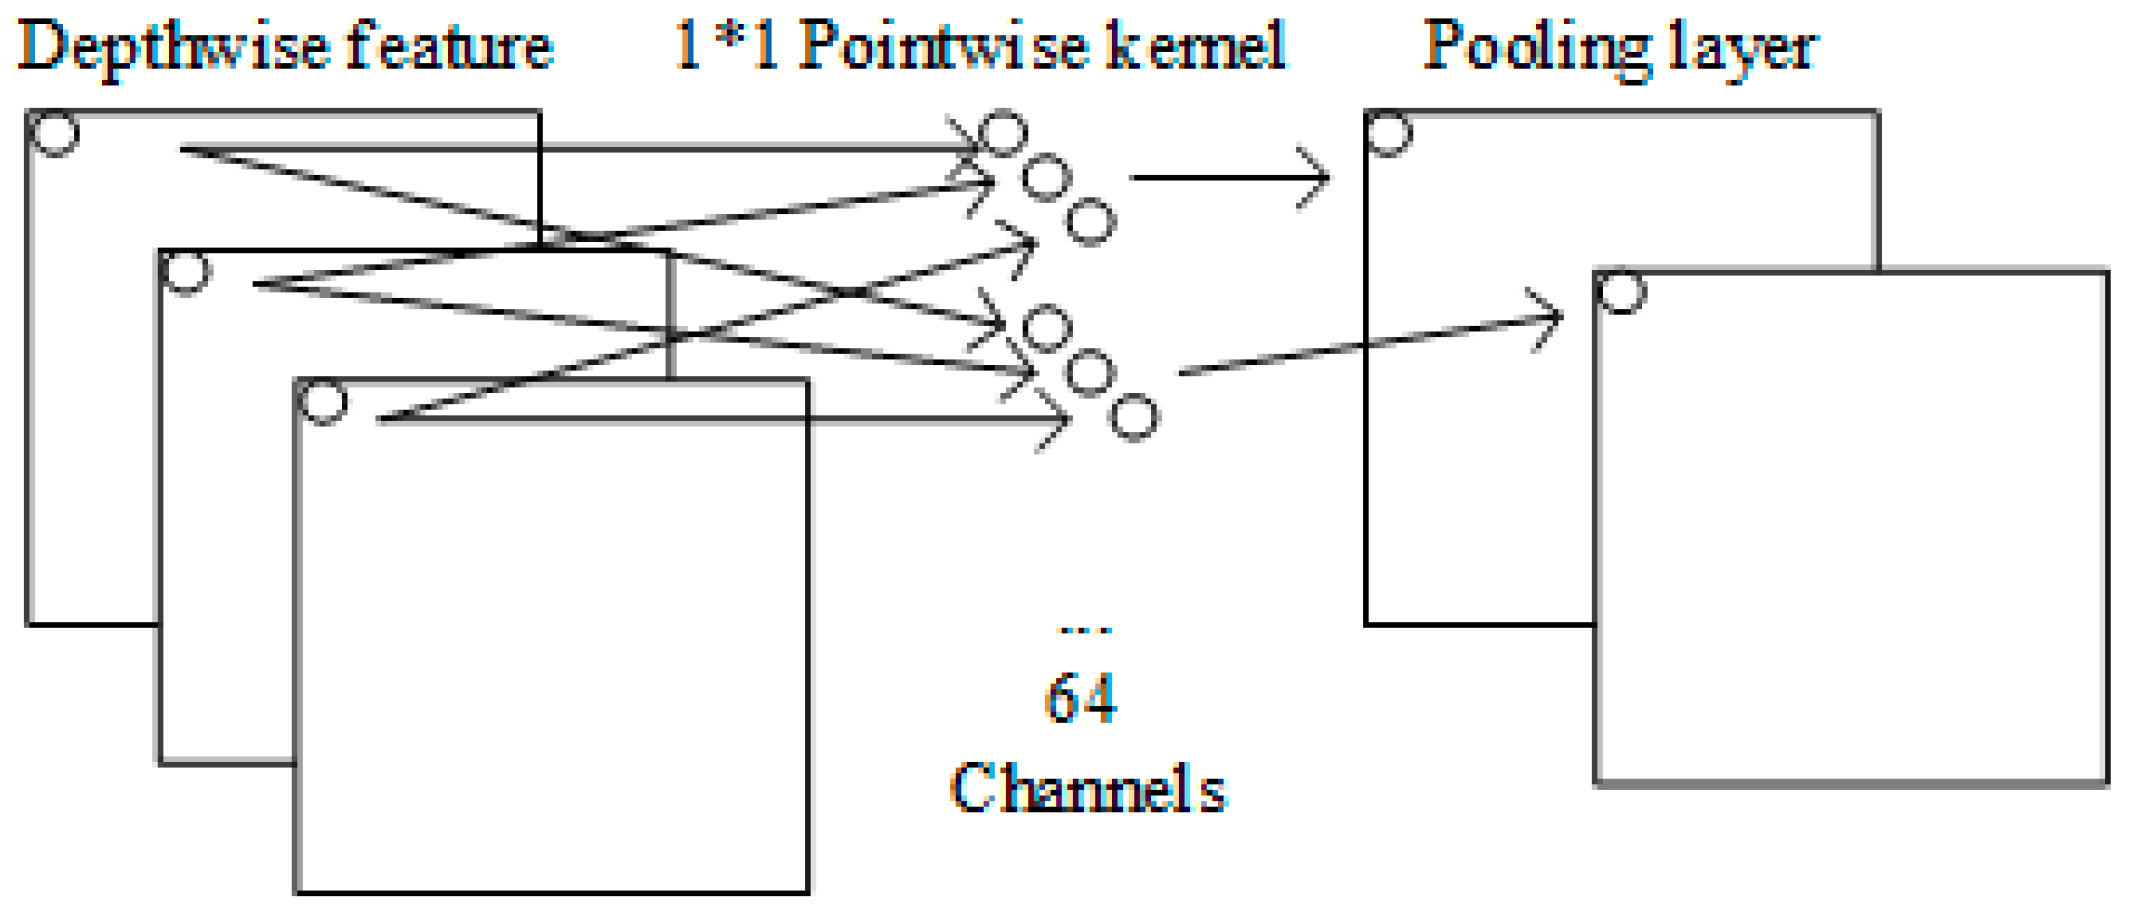
The MobileNet [25] convolutional neural network is optimized on standard CNN. The MobileNet network splits the standard convolution into Depthwise and pointwise convolution. If a standard convolutional layer requires a 3 × 3 convolutional kernel of 64 channels, the convolutional layer of MobileNet needs only a 3 × 3 Depthwise convolutional kernel of one channel and a pointwise convolutional kernel of 64 channels, as shown in Figure 2.
Specifically, we can see the convolutional processing of a standard CNN from Figure 3. On the other hand, we can see the Depthwise convolution from Figure 4 and Pointwise convolution from Figure 5. The MobileNet network combines the Depthwise and Pointwise convolution to reduce the number of arguments entered, so there is less calculated amount at per channel.
As a result, the MobileNet network has less computation and model parameters. This greatly improves the calculation speed and does not impact the result of inference. Thus, the MobileNet network is just what system needs.
3.3. Single Shot Multibox Detector
In the traffic congestion monitoring system, it is necessary to know the number of vehicles on the current road, so the detection of vehicle targets in remote sensing images is the basis of the system. In order to realize the target detection function in the images, we need to use the target detection algorithm.
Due to the wide coverage of remote sensing images and the large number of vehicle targets in the images, it is still necessary to select an algorithm that is simple to operate and has a fast processing speed when selecting an object detection algorithm.
The target detection algorithms are mainly divided into two types: two-stage and one-stage methods. The main idea of the two-stage method is to generate a series of candidate boxes by a selective search algorithm or CNN, and then classify and perform a regression on these candidate boxes. The advantage of the two-stage method is its high accuracy. The main idea of the one-stage method is to evenly sample at different positions of the image. In the sampling process, it uses different scales and aspect ratios. After that, features can be extracted by CNN network and then directly classified and regressed, like You Only Look Once (YOLO) and Single Shot Multibox Detector (SSD) [26]. According to our needs, for a faster calculation, the one-stage method is more suitable. Next, compared with YOLO, the SSD uses a CNN to detect directly, rather than after the fully connected layer as YOLO does. The structure of the SSD algorithm is more clear and concise. As a result, we chose the SSD as the target detection algorithm in this system.
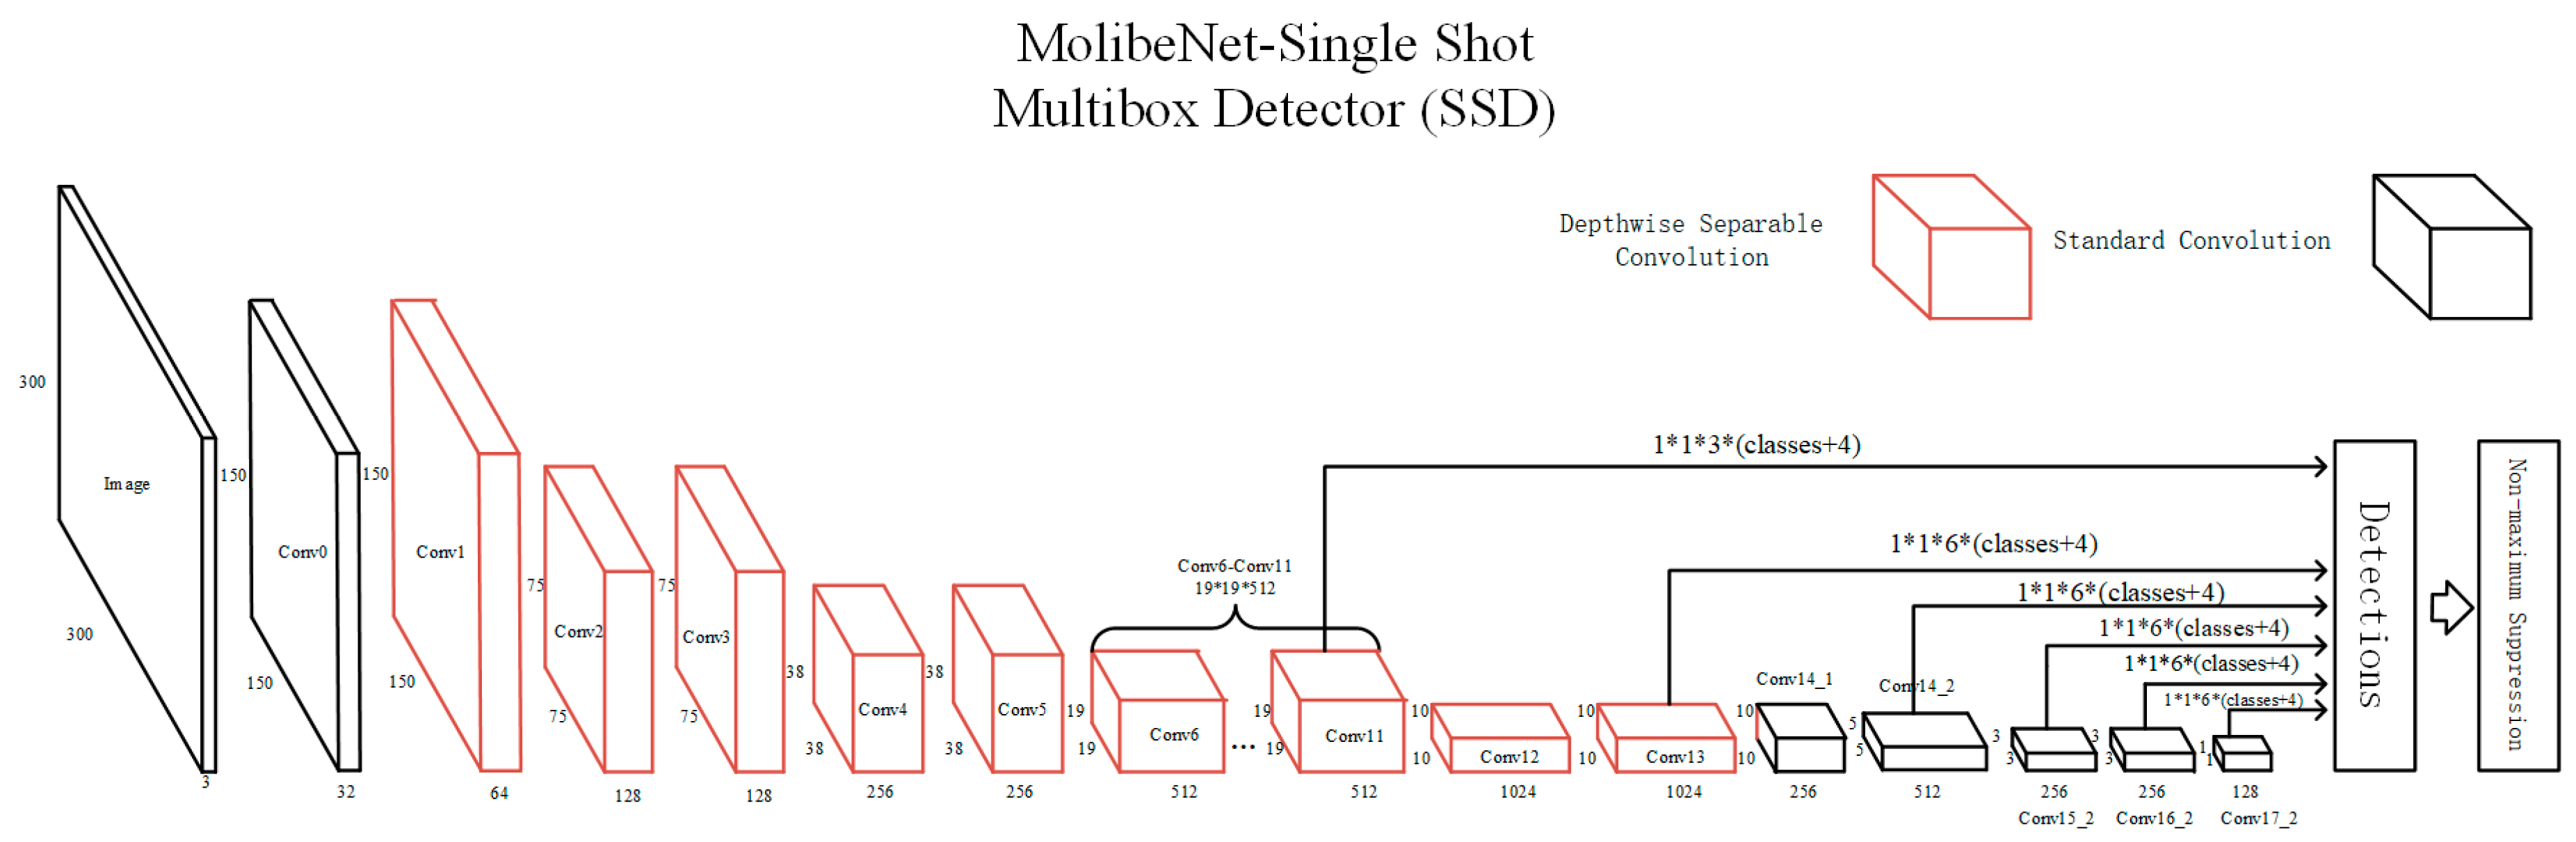
The SSD (Figure 6) is based on a feed-forward convolutional network which generates a set of bounding boxes of fixed size. According to the previous analysis results, we use MobileNet as its feed-forward neural network. In the process of calculation, the size of the prior box has a great influence on the prediction results. For each prior box, the algorithm calculates two eigenvalues—the confidence coefficient and the boundary position—and selects the optimal prior box according to these two eigenvalues to generate the bounding box. From Figure 6, we can see that the MobileNet network retains the convolution part, with the original pooling and fully connected layers removed. In the SSD section, we use six feature plots of different scales to extract the features.
3.4. Federated Learning
Based on the previous deep learning studies on remote sensing data, the obvious problem is that the differences in remote sensing data and the other different data in data security are not taken into account during the training process. The source of the remote sensing data are the satellites of different countries, and their images sometimes involve state secrets, so it is important to ensure that the remote sensing data is not leaked during the deep learning process.
Federated learning [27] is the main innovation introduced in this system and is also the main contribution of the experiment. This was put forward by Google in 2016, and then Google developed a federated learning framework called TensorFlow Federated (TFF) [28] based on Tensorflow. Its design goal is to carry out efficient machine learning on the premise to protect information security and personal data privacy in a multi-user big data exchange.
The essence of federated learning is the ability to conduct collaborative training without sharing private data. Federated learning does not aggregate the data needed for model training to centralize compute, but distributes the computation of machine learning to the database of the participating parties for distributed computation. In order to coordinate the nodes of each distributed computation, the model needs to be passed, but the model alone cannot pushed back the source data. No original data is transmitted throughout the whole model training process, thus protecting the privacy of the data owners.
Thus, the advantages of federated learning are significant. Firstly, federated learning isolates the data so that the data will not be disclosed to the outside world, so as to meet the user’s privacy protection and data security needs. Secondly, federated learning can ensure that the quality of the model is lossless. The federated model synthesizes all the fragmented independent models, so the federated model is better than the fragmented independent model. Third, the participants have equal status while cooperating. Finally, federated learning allows the participants to maintain independent training and speculation while passing the model parameters.
From the above discussion, it can be concluded that remote sensing data is particularly suitable for processing by federated learning. It can be seen from the related work that most remote sensing data can cover large areas, but it is protected. Privacy data may be leaked when commercial companies are involved in the remote sensing data that need to be used to make traffic congestion systems. Thus, in order to protect remote sensing data sources, we need to enable commercial companies to predict traffic congestion without the need for raw data.
Traffic congestion monitoring systems need to be jointly implemented by a number of satellites and traffic management departments around the world. In federated learning, we make a traffic management department the server node to analyze and forward the model, and we make each satellite a node to participate in the training, in which the satellite data is confidential. The satellites train the remote sensing data into a model and send it to the traffic management department, which forwards the models of each satellite to each other and integrates them for prediction. Because the data sets of each satellite overlap a lot, the system adopts horizontal federated learning. This allows the traffic management department to predict traffic congestion without access to the raw data, and thus does not lead to remote-sensing data leaks. Traffic management department can combine the satellites’ data to make the predictions more accurate.
However, in this case access to satellite data is limited. We had to install a calculator on the satellite to train the model, which was hard to do. However, we can use the receiver of remote sensing data as the node of training data, and we need to guarantee the confidentiality of the data on these nodes in the first place. Due to the addition of new nodes, when these training nodes transmit data to server nodes the model is easily intercepted, resulting in data model leakage.
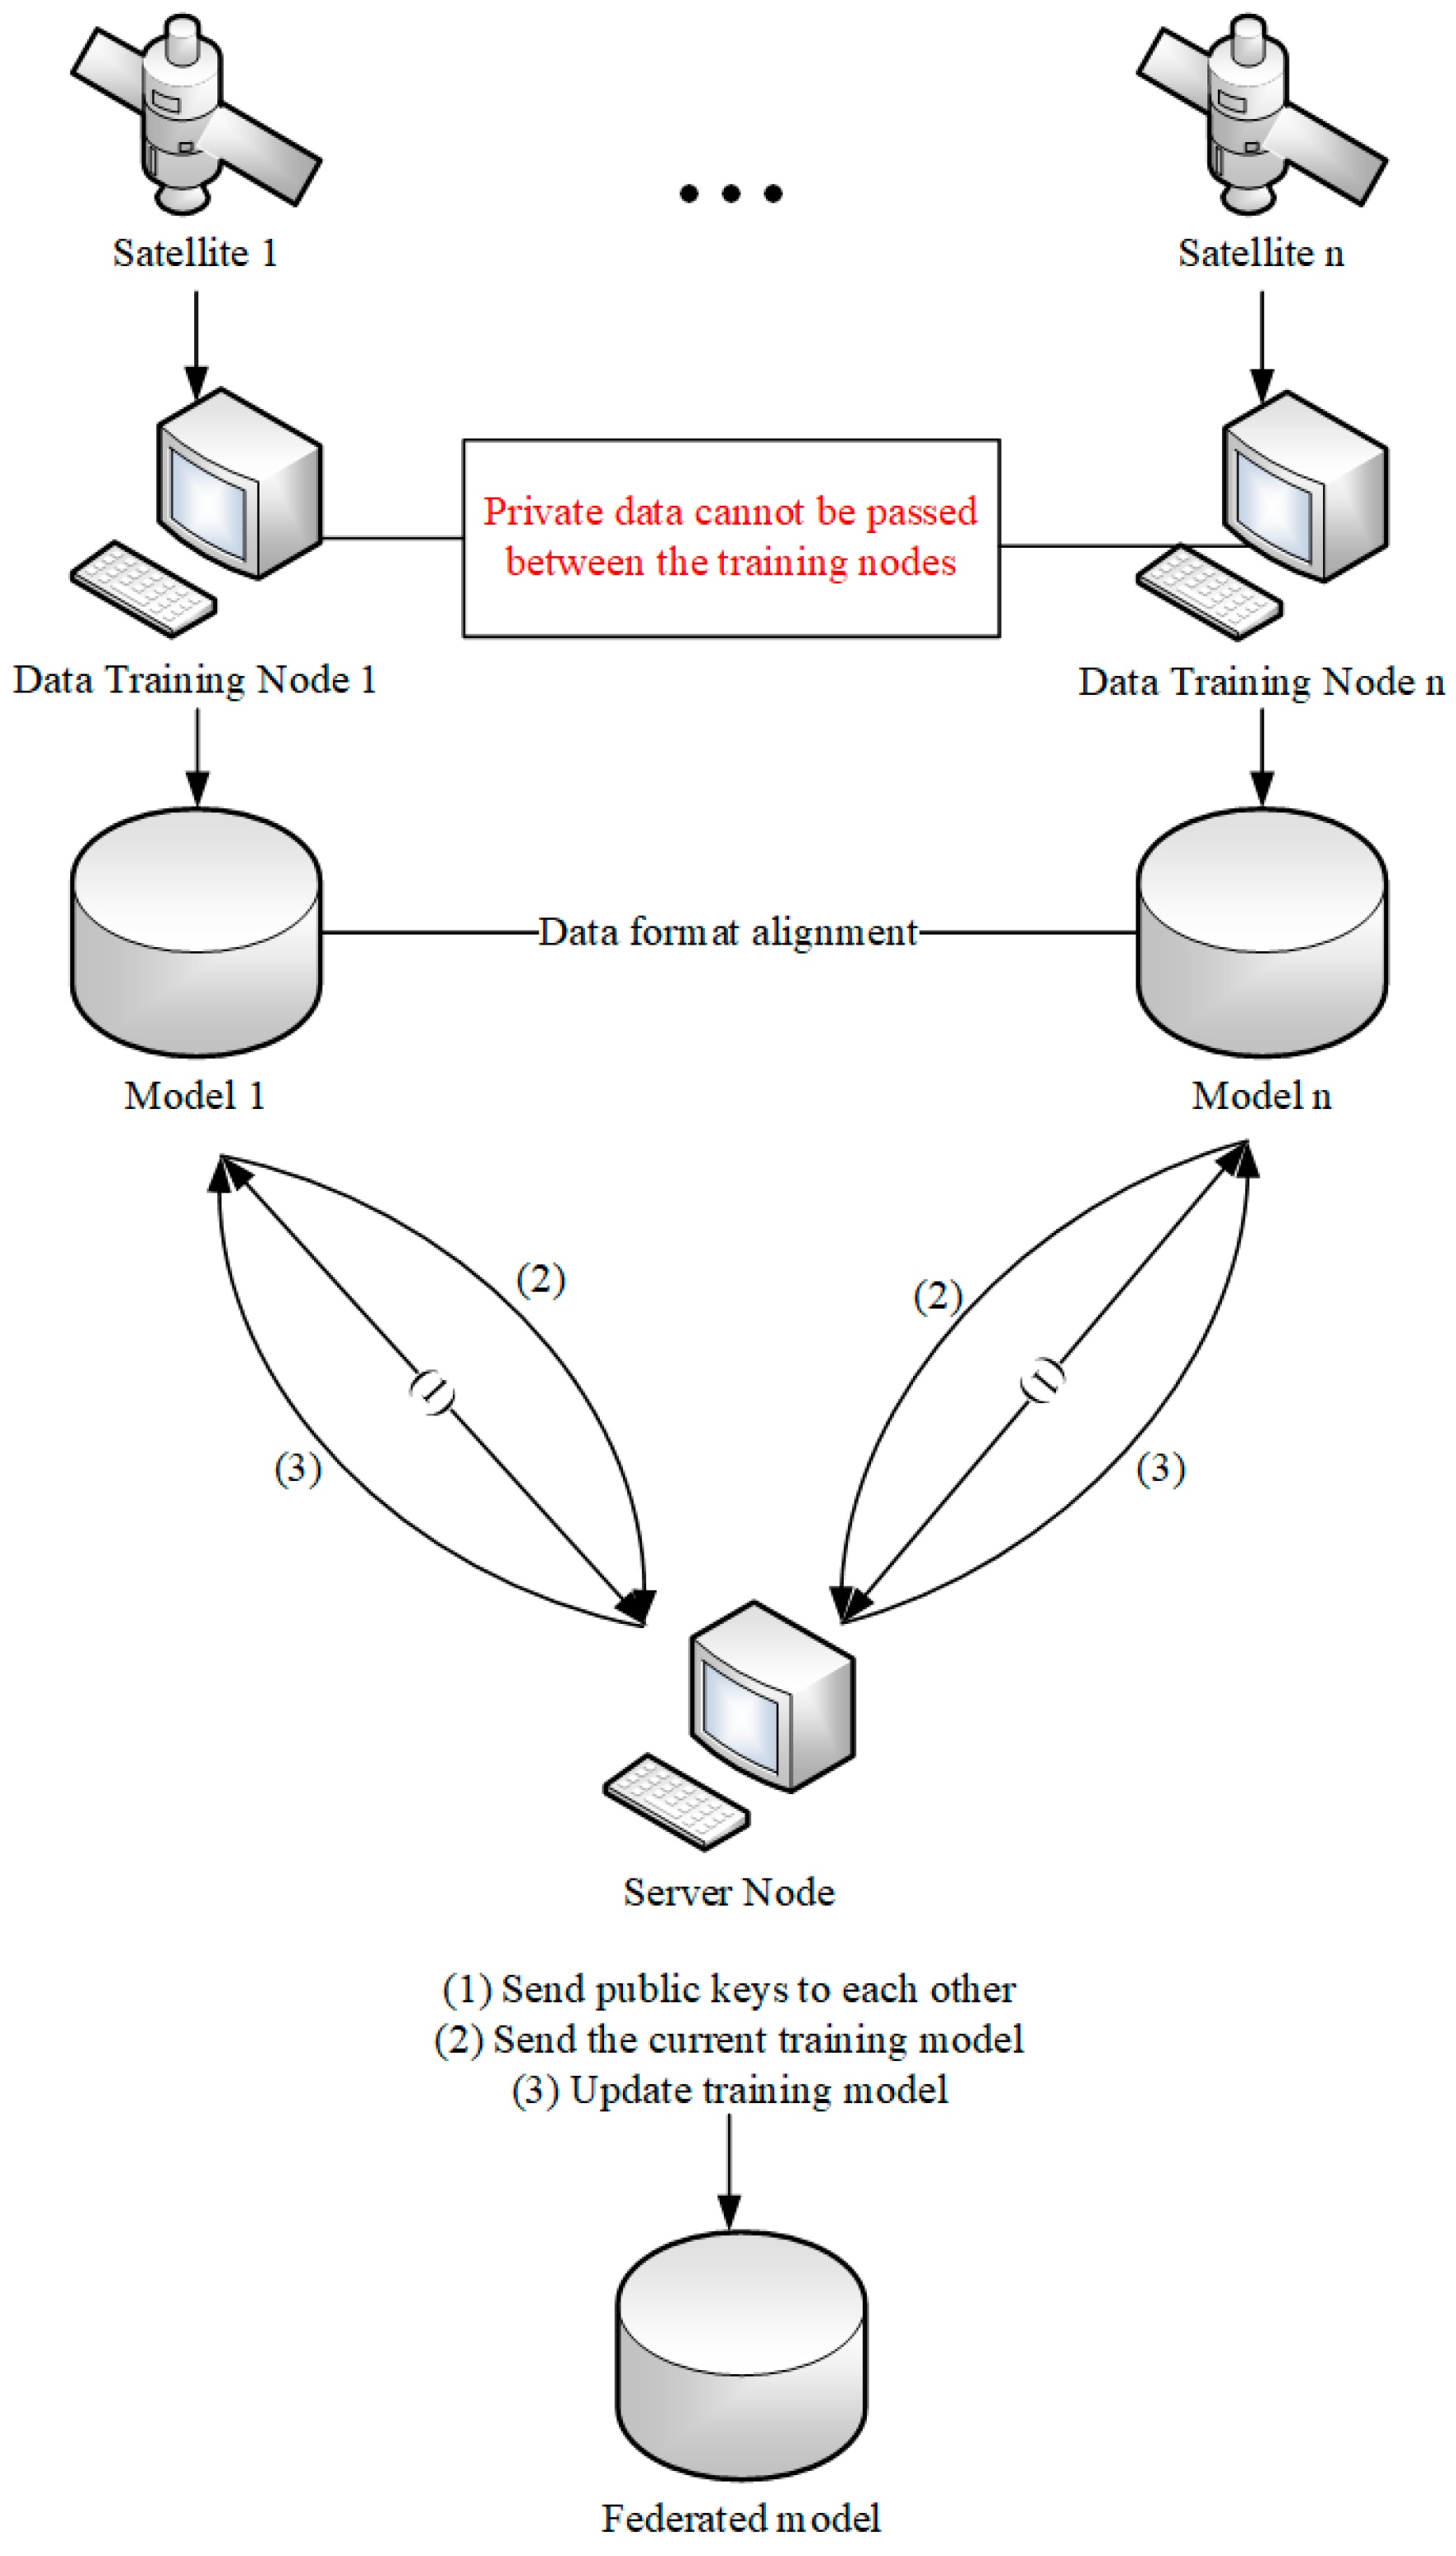
Therefore, we optimized the federated learning framework and added an asymmetric encryption algorithm in the data transmission process. The server node distributes its public key to the data training nodes before receiving the data. The data training nodes encrypt the model that needs to be transmitted with the public key of the server node. The data training nodes then transmit the encrypted model to the server node. This ensures that only the server node can use its private key to decrypt the models sent from the various data training nodes; it then combines the data of each data training node and sends to them with the same encryption principle to update their existing models.
Through the secret algorithm, we can send satellite data to specific training nodes for processing and ensure that the data transmission between nodes is safe. Improved federated learning makes data processing easier, reduces the burden on satellites, increases the processing speed in practice, and ensures data transmission security. Improvements have made the system easier to use between satellites and traffic management.
The entire improved federated learning processing is shown in Figure 7. As shown in the figure, satellites transmit data to their corresponding data training nodes respectively, and these nodes do not transmit private data to each other. The training nodes train their respective models and encrypt them to the service nodes with the public key. The service node is responsible for updating the models, sending back to the training nodes, and forming the final federated learning model. However, in our single-machine simulation experiment, we did not add encryption algorithm to the experiment because there was no data leakage during data transmission.
3.5. Long Short-Term Memory Neural Network
Due to the limitation of data acquisition, for the realization of the traffic congestion monitoring system, our data source selects remote sensing images. However, the analysis of a single picture often fails to grasp the real-time traffic flow. With the development of remote sensing technology, remote sensing data is no longer limited to image presentation. In many scenarios, dynamic, video-based remote sensing data is applied to actual data analysis. In order to grasp the dynamic traffic flow and judge the real-time road status, we can use the dynamic remote sensing data as the data source for processing. This is also the main research direction of this research in the future.
The model of the SSD algorithm based on a convolutional neural network is discrete. There is no necessary relation between the output features—that is, the output features of each frame correspond to the corresponding output model. In order to connect the model of each frame and make the model of the previous frame influence the model of the following frame in the target detection based on a video stream, we can introduce the recurrent neural network based on CNN.
Recurrent Neural Network (RNN) [29] is the existing network structure to carry out cyclic calculation. The general neural network is only related to the input value, while the input value of each loop of RNN includes the result of the last loop and the data to be processed. In this way, the results of each cycle will have an impact on the results of the next cycle, rather than being isolated from each calculation. According to the structure of the cyclic neural network shown in Figure 8, we can see that it is very suitable for the target detection algorithm based on the video stream.
However, as the length of the video stream grows, the previous video frames have less and less impact on the final result. For example, in the structure of Figure 8, after the input of the huge video frames, the impact of Input 1—the earliest input video frame—on the final Output n cannot be shown.
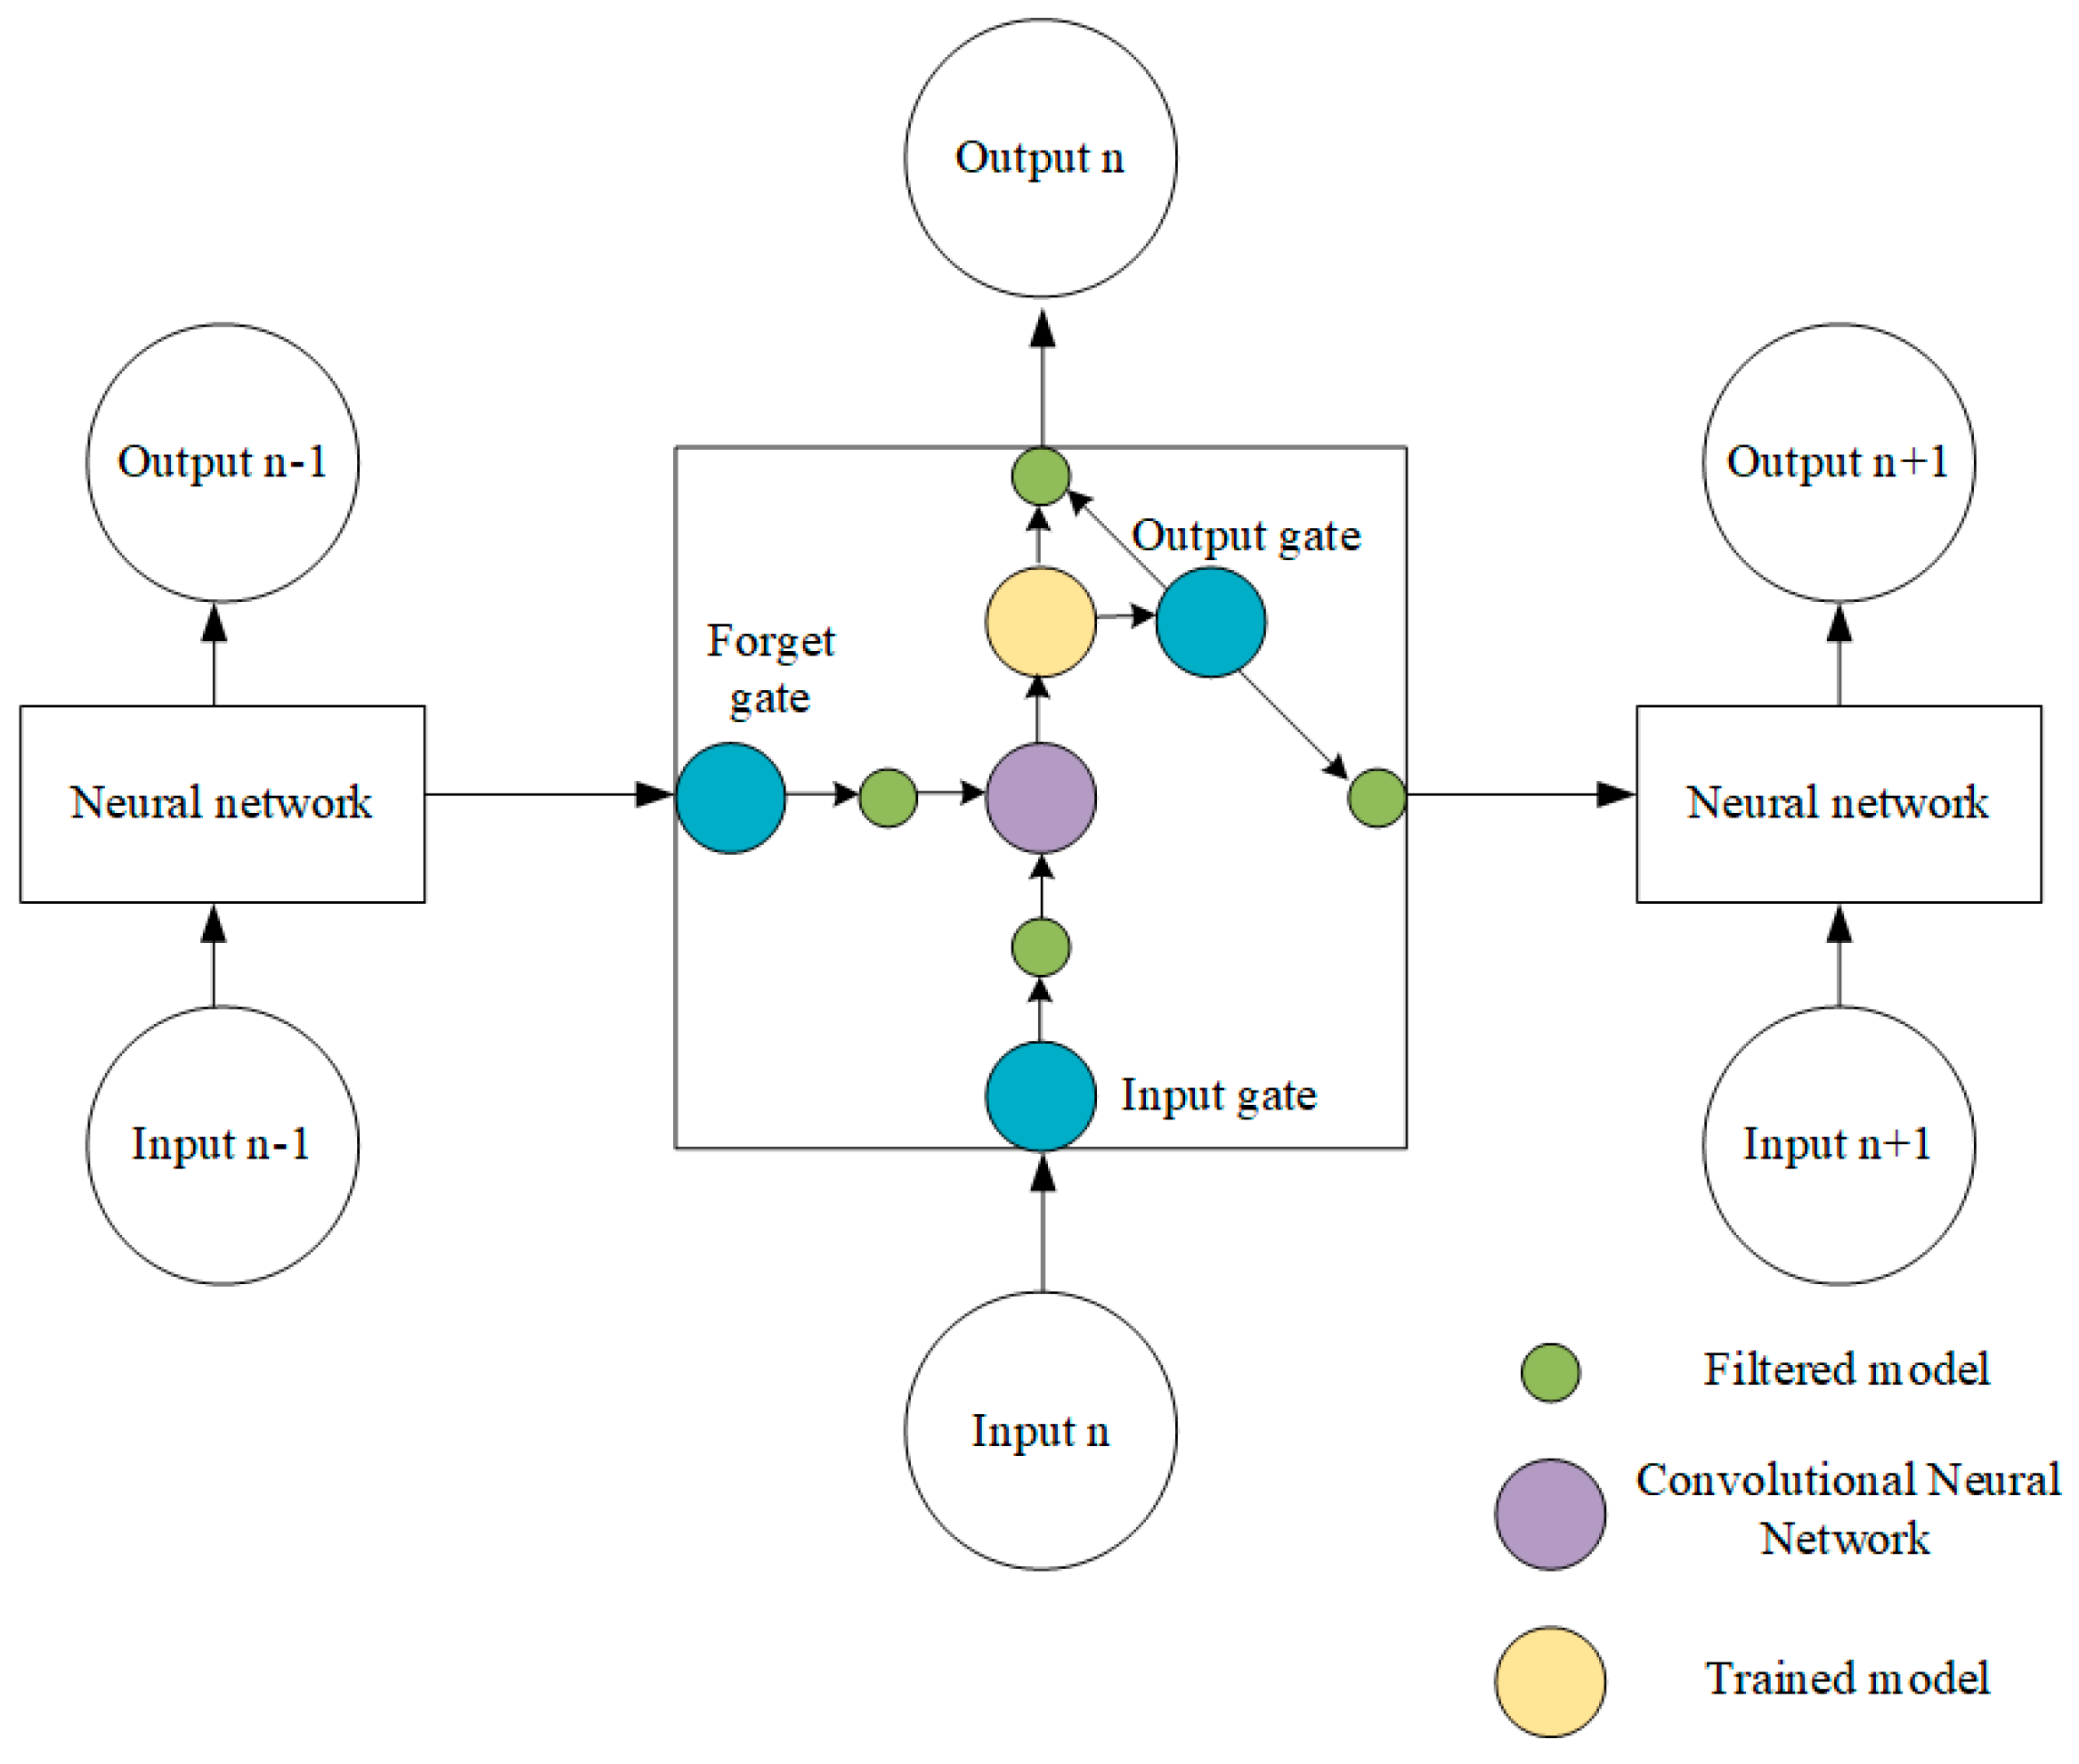
To solve this problem, we can use a Long Short-Term Memory (LSTM) [30] neural network, which is a special RNN. LSTM mainly improves the loop body in the circular neural network. The LSTM loop body can be divided into three stages.
In order to solve the problems caused by the RNN network, LSTM adjusts the input, storage, and output parts of the recurrent neural network. Its structure is shown in Figure 9. The change is mainly reflected in the control of the useless information in the forget gate; the memory gate chooses to store the information that has a great influence on the result, and the output gate filters the invalid model. This leaves the information with the greatest impact on the final result efficiently.
Since LSTM is a cyclic neural network, we only need to nest the existing basic CNN in the loop body of LSTM to realize target detection by LSTM. LSTM has been proven to be used in combination with the GPS detection of vehicle tracks for road congestion detection over a long time [31]. Thus, we can use the particularity of LSTM in video stream processing. We need to change the data source from the original remote sensing images to the remote sensing video streams recorded by real-time remote sensing satellites or unmanned aerial vehicles. By carrying out target detection on the remote sensing video stream, we can obtain real-time road condition information, such as the running speed of the vehicle targets, the changing information of the number of vehicles at the intersection, and the vehicles’ trajectory.
4. System Implementation
4.1. Remote Sensing Data
Remote sensing data have the characteristics of a wide coverage, large visible range, and clear features, and are suitable as a data source for road congestion monitoring—that is, vehicle identification.
Many countries have launched military and commercial satellites. Military satellite data is not publicly available. Since certain objects on the ground involve national privacy, some of our commercial satellite data is often hidden. This has a significant impact on some model analyses involving private data. This leads us to the reason for federated learning.
In this system, it is better to use Google Earth [32] to select the remote sensing data. Google Earth is a virtual Earth software developed by the Google company which arranges satellite photos, aerial photography, and a Geographic Information System on a three-dimensional model of the earth. The data for Google Earth comes mainly from the Maxar company [33], and the satellite images are mainly taken by the Landsat and Copernicus satellites. We can obtain remote sensing images of Los Angeles by entering the official website of Google Earth—https://earth.google.com/—and positioning it on Los Angeles, USA.
Since the detection targets are the vehicles, we need to zoom in on a city which has enough targets, magnify the remote sensing image to an intersection, and make sure that the vehicles in the image are clear. In this process, it is more beneficial to select an area with better light and less trees as the data source. Then, we intercept the current image and save it as JPEG. An example is shown in Figure 10. We used this data acquisition method to collect the remote sensing data of some urban roads in Washington, D.C., and Los Angeles and integrated the remote sensing images of each city into a data set composed of 3200 images as the training data set for the following experiments. We used the same method to intercept remote sensing images in different areas of Los Angeles and Washington to form a validation set of 300 pictures and a test set of 100 pictures.
In this system, labelImg-master is used as the labeling software to mark the object to be identified by the label—namely, the cars. In order to adapt to the Single Shot Multibox Detector neural network, the software should stay in the state of PascalVOC. We mark the car target with a box and the corresponding folders will generate corresponding XML information files after completion. Each file contains information such as the coordinate value of the annotated targets.
4.2. PaddlePaddle Framework
In this system, we use PaddlePaddle [34] as our deep learning framework. PaddlePaddle is a deep learning framework developed by Baidu and based on Python. PaddlePaddle is more encapsulated, faster for large amounts of data, and provides a way to run on GPU, allowing us to process large amounts of remote sensing data faster. Therefore, we chose PaddlePaddle version 1.6.0 with Python version 3.7. The operating environment is the Tesla V100 GPU with a 16GB video memory.
4.3. Federated Learning Simulation Training Process
In the system design, we regard each satellite as a node for deep learning and the traffic management departments as the server node. Thus, we use remote sensing data to complete the federated learning simulation process in only one computer.
Firstly, we need to define the MobileNet convolutional neural network and the SSD algorithm, as well as some image processing functions, and prepare a list of data in the corresponding format. The image preprocessing functions are to enhance the original images to make the sample images more accurate in the analysis. The MobileNet convolutional neural network uses the convolutional kernel to extract the features of the image samples. The SSD algorithm analyzes the extracted features and generates the corresponding candidate boxes. By calculating the precision value of the candidate box, the most appropriate one is selected as the bounding box and the model is saved.
PaddlePaddle provides a very convenient model reading function. However, it should be noted that each data training node in the single-machine federated learning simulation experiment needs to read its own data. The data reading function create_py_reader_by_data provided by the framework can only be executed once per run. This is because the queue data structure is used when the data is read, but when the function is called a second time, the queue will be created repeatedly and the memory will be exceeded. We overwrote this function so that the queue created on the first call to create reads normally and is cleared after use. Instead of creating the queue the second time the function is called, the queue that was already created the first time is used. Again, we need to empty it after use. This way, we avoid creating the queue repeatedly. However, in the traffic congestion monitoring system, each satellite data processing node carries out its own data reading operation and does not run in the same process, so this problem will not occur.
In the most important training stage, we simulate the process of transferring data from the satellite node to the traffic management department as the process of saving the training model in the server node. We simulate the process of integrating the satellite node model of the traffic management department into the process of training node, using the model in the server node as the pre-training model and continuously updating the model. Thus, we first make N training nodes and assign raw data to each training node. Then, a server node stores the merged model. In the process of training, each training node will first check whether the server node has a model which can be used as a pre-training model. If not, the node will use its own data to train the model and save it in the server node folder. If there is an existing model, the node will use it as a pre-training model and use its own data to train and update the model. In this way, we achieve the essence of federated learning, and the server node gets a comprehensive training model without touching any node source data.
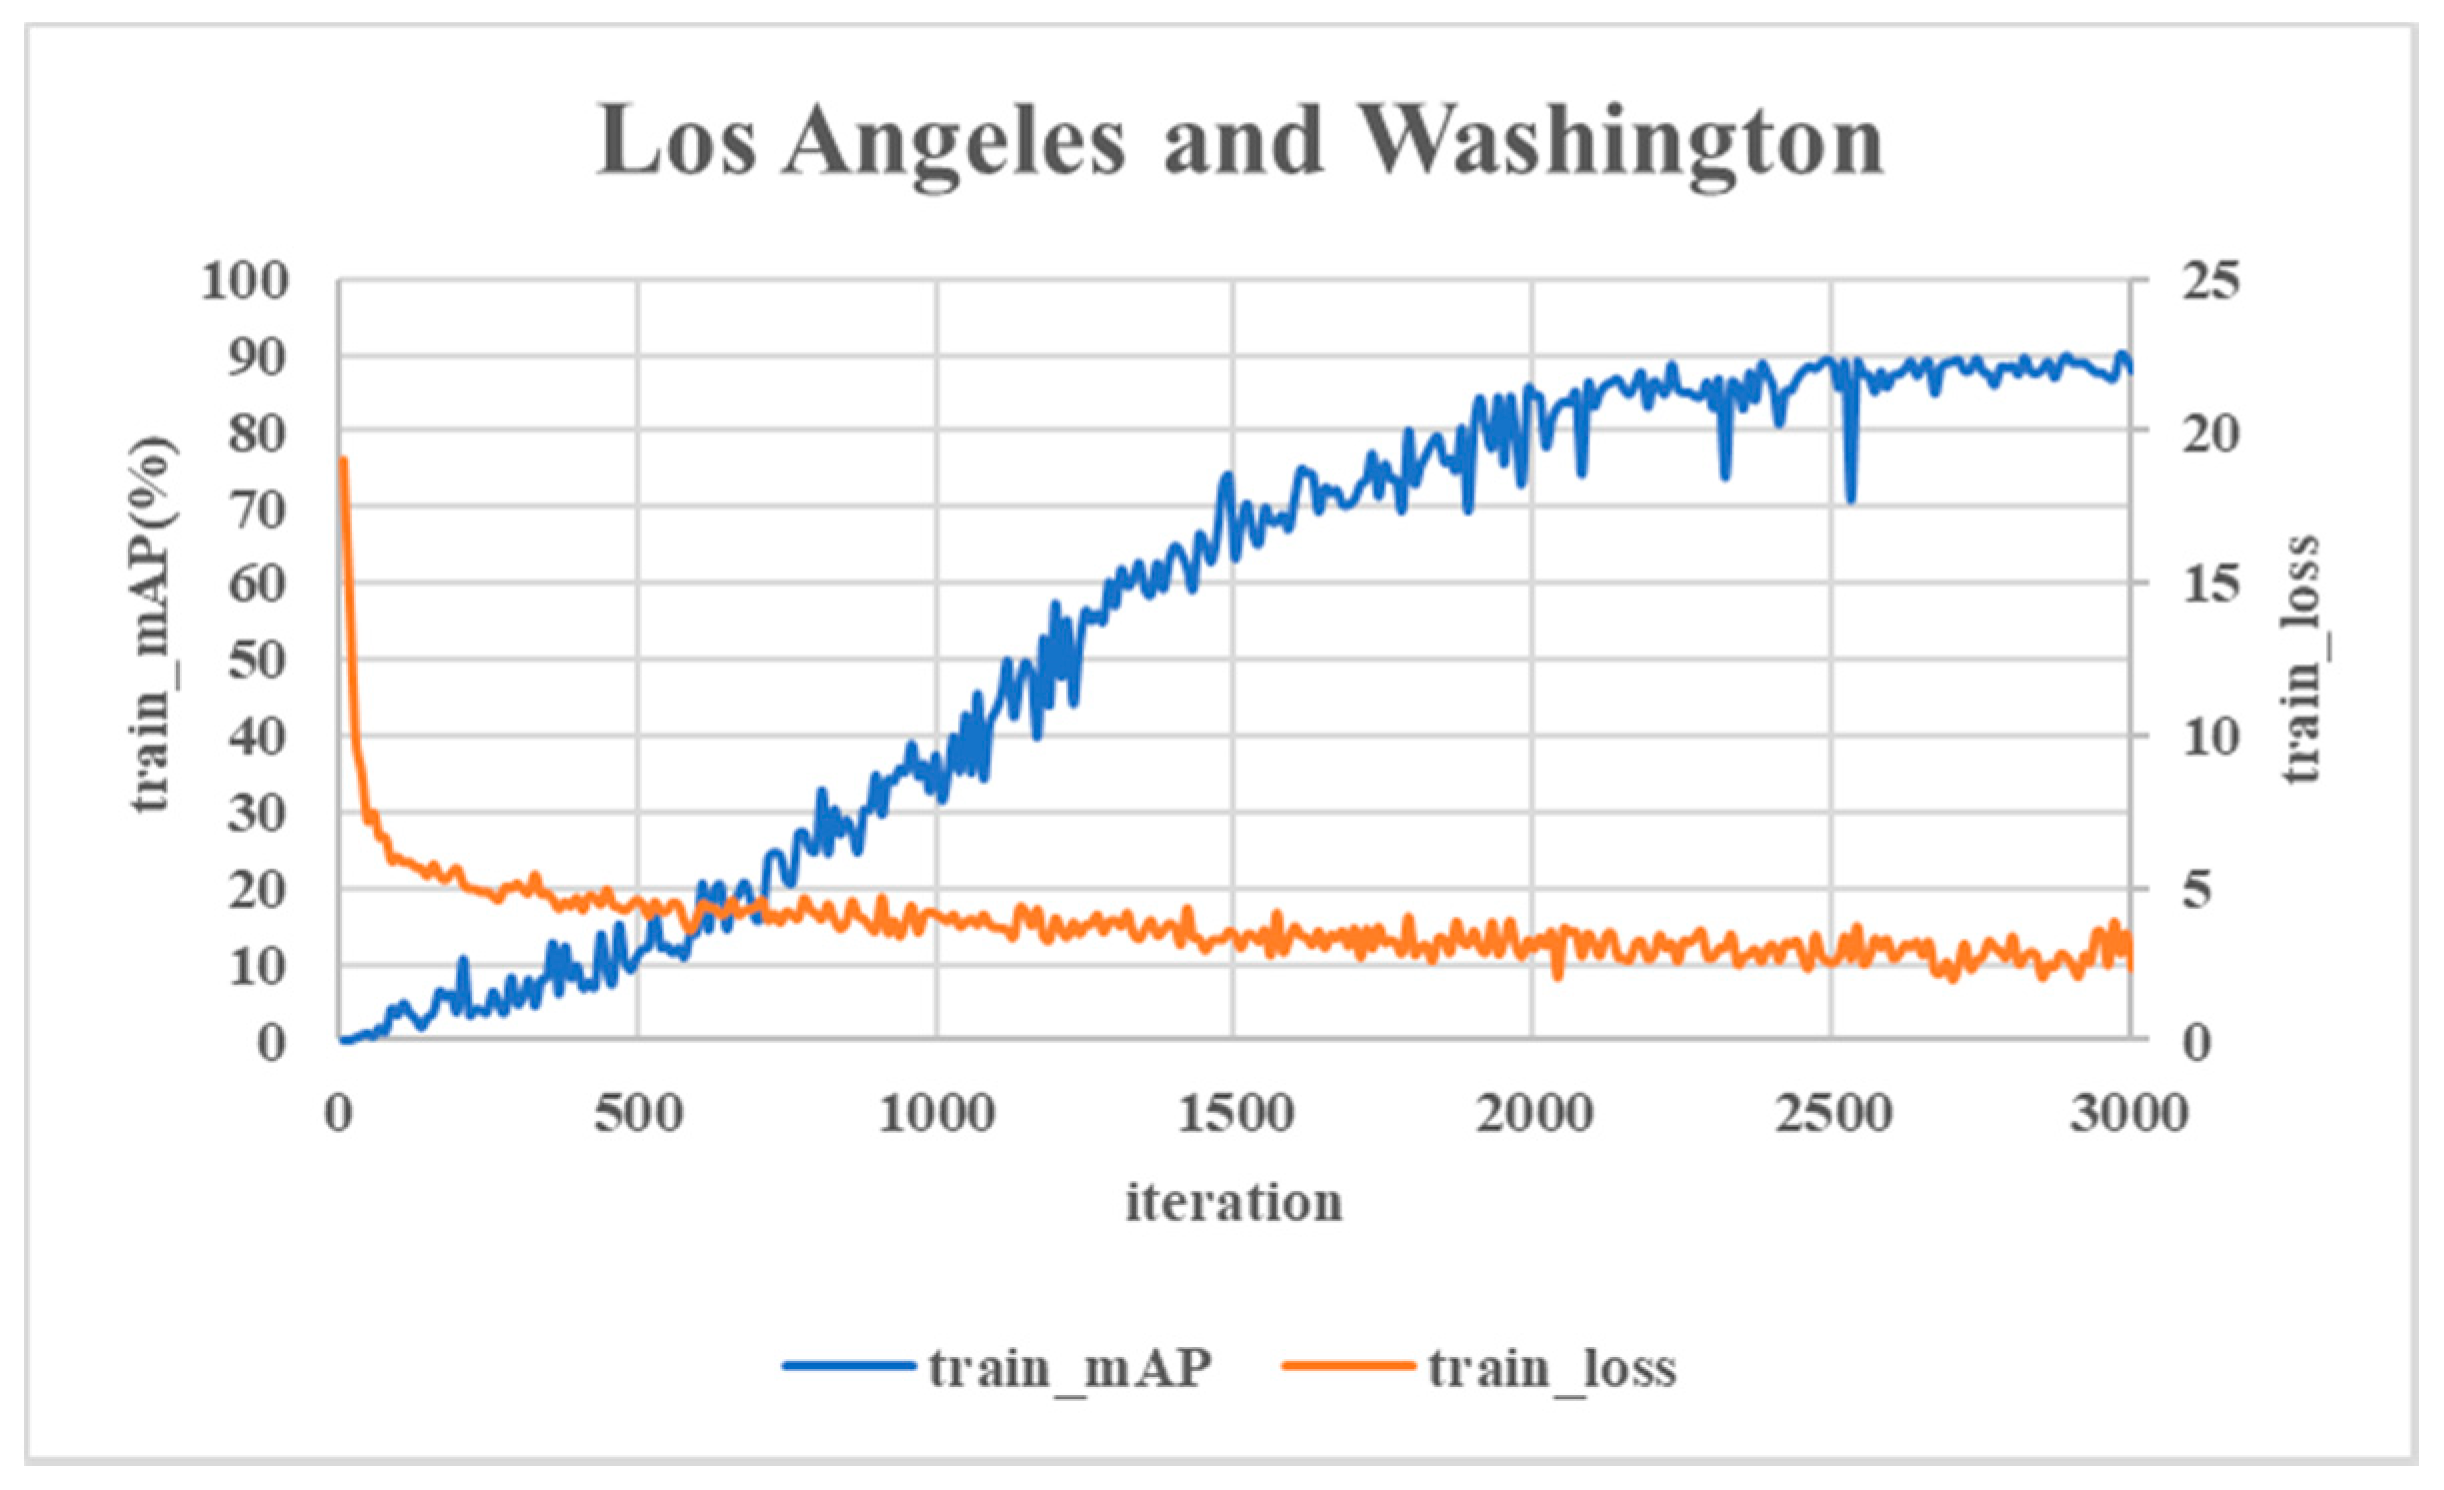
Figure 11 shows the variation diagram of the training process of this experiment. Because the traffic congestion monitoring needs to accurately detect the vehicle target in the remote sensing images, the precision value is an important criterion to evaluate the experimental performance. Therefore, we used the mAP value of training to evaluate the experimental performance in the comparison experiments. Our experiment adopted the Washington remote sensing data set and the Los Angeles remote sensing data set mentioned in the related work. We set up corresponding training nodes for the two data sets and input the corresponding data into the neural network for training. We made the two training nodes exchange models every 500 iterations. As can be seen from the figure, the data mAP value of the node that is trained first first increases, and the precision of the other node that is trained later then increases. After a period of training, the accuracy changes as a whole show a state of upper limit stability and lower limit cyclic fluctuation. This is due to the low accuracy of the first group of data trained after each model exchange, but it has no effect on the prediction of the final model. We set the size of each iterations to 32 images and configured the gradient descent optimizer with an initial learning rate of 0.001. The experiment is carried out for 4000 iterations to get the final federated model. Through the experimental results, we found that after 3000 iterations—that is, when the model of each node is trained to achieve a stable accuracy of about 90%—there is a good experimental effect. According to the experimental results, we can get a high accuracy detection method for vehicle target acquisition.
In order to find the best experimental effect and train the best model in the shortest time, we conducted several groups of control experiments.
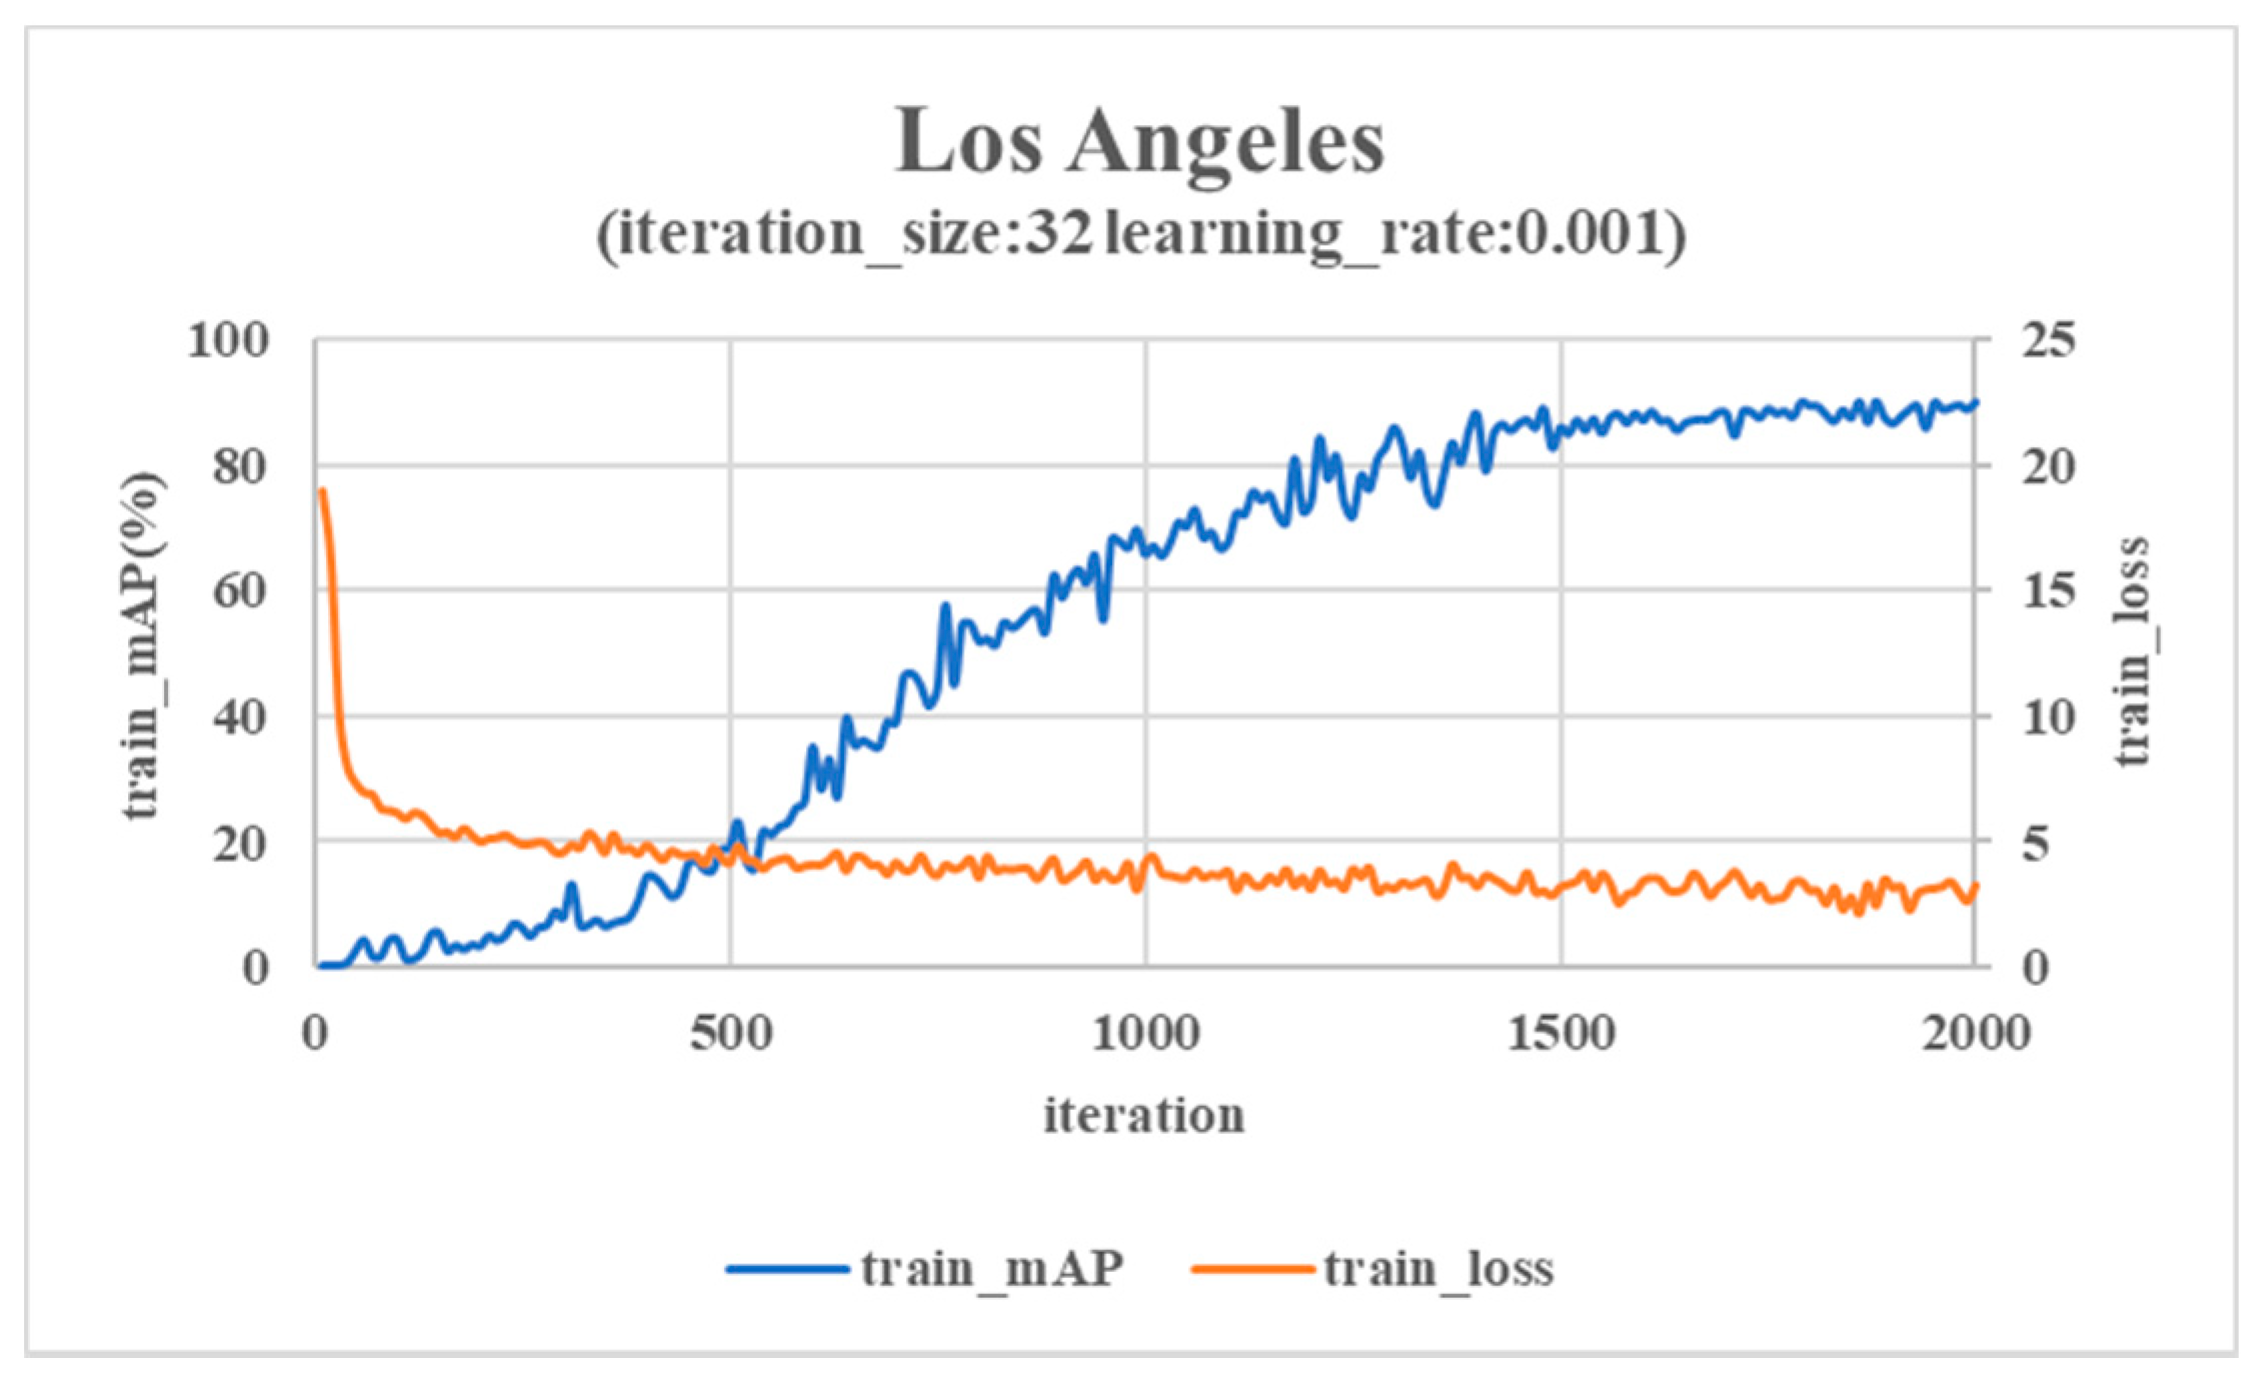
The size of each training set affects the overall training speed and the time to reach the required accuracy. In order to find a more suitable training set size to speed up the training speed, we conducted the following control experiments. We started with a single data set like the Los Angeles data set. We carried out a group of control experiments and set the size of each training set to 32 and 64, respectively, to compare the situation of the two experimental training models.
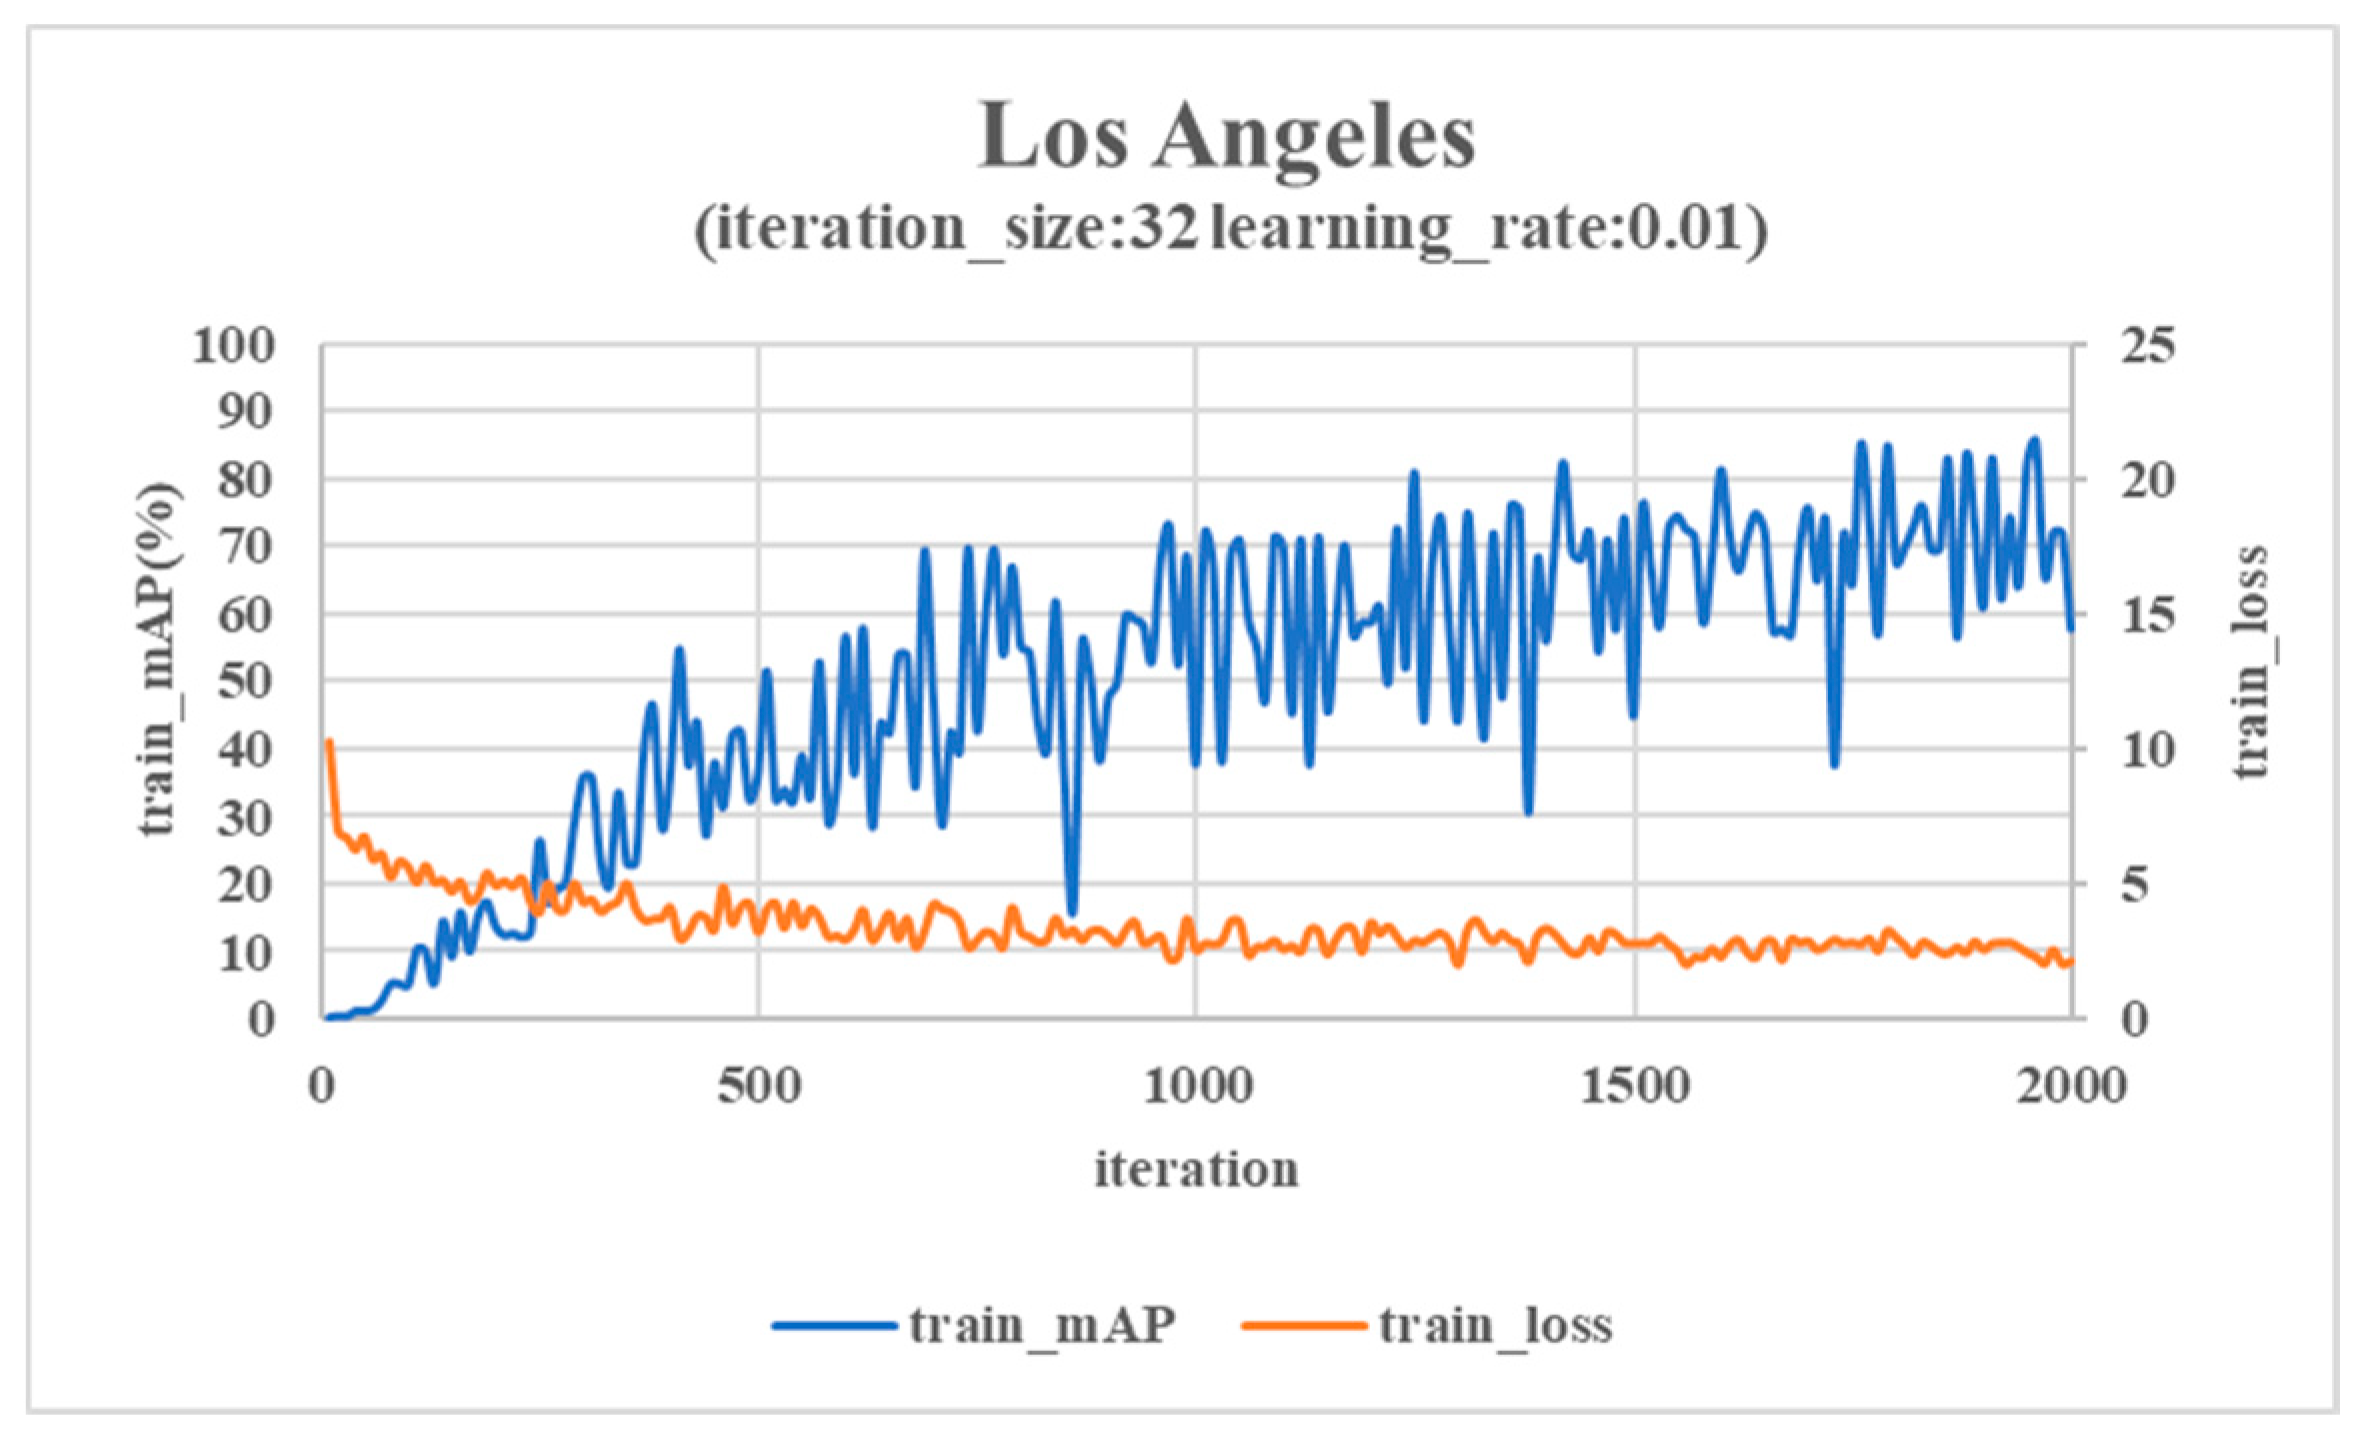
As shown in Figure 12, this is the experimental case where each iteration size is 32. The value of train_loss dropped to about 3% rapidly. The value of train_mAP grows to 89% and flattens out, requiring 2000 iterations.
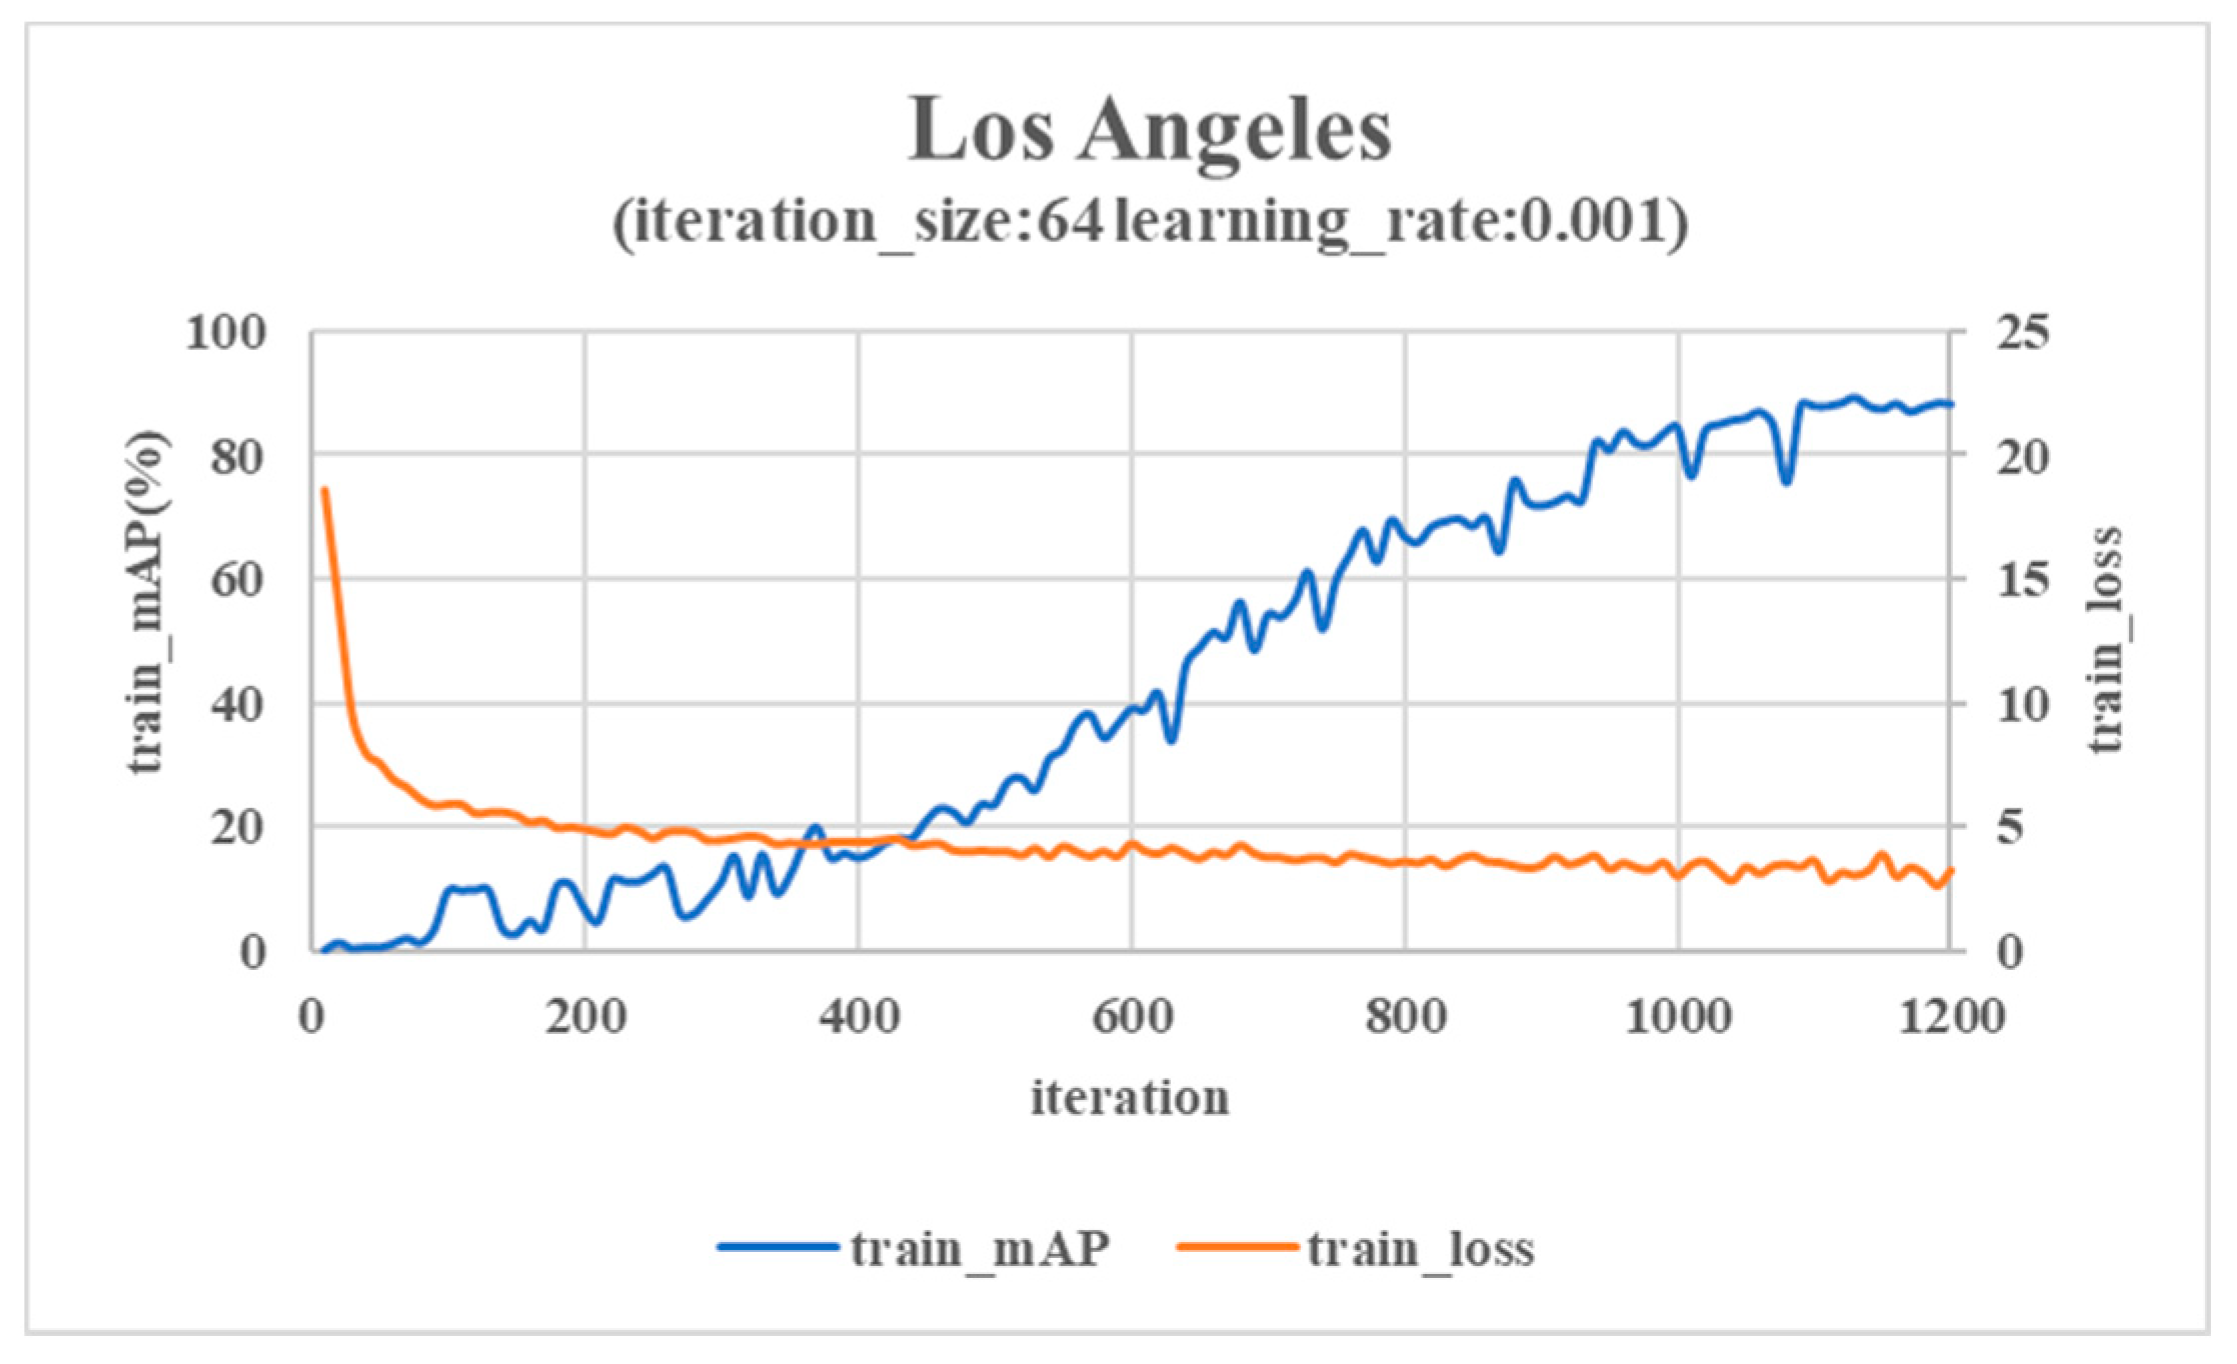
As shown in Figure 13, this is the experimental case where each iteration size is 64. Since each iteration is twice the size of the previous iterations, if we train the same iterations, we need to have 000 iterations attempts. The value of train_loss dropped to about 3% rapidly as the same. When the number of iterations reached 1000, the value of train_mAP increased to 80%, but it still did not tend to be smooth, and the precision value gradually tended to be smooth when the iterations reached 1200. It can be seen from the experimental results that when the size of each iteration is 32 for the same training quantity, the value of train_mAP tends to reach a higher value faster. Thus, we set the size of each iteration to 32 for the following experiment.
The whole process of neural network processing is rather complex; we define the corresponding optimizer. The purpose of this set of control experiments is to test how much the learning rate of the optimizer can be set to have a suitable training speed when the required accuracy is achieved. In the process of data processing, the optimizer can select the most suitable learning rate according to the current training stage to improve the model accuracy. In the early stage of training, we chose a high learning rate in order to improve the training speed. With the increasing of the training amount, the improvement rate of the model accuracy was gradually slowed down, so we gradually reduced the learning rate to keep the model accuracy rising and stabilize the model.
We conducted a controlled experiment on the training optimizer. In the experiment in Figure 13, we used an optimizer that uses the RMSProp [35] method to realize the adaptive learning rate. The default learning rate of RMSProp is 0.001. We used a group of control experiments, as shown in Figure 14, to change the learning rate to 0.01 and observed the variation trend of accuracy. We found that with the same number of iterations, although the central value of precision tended to be flat, the fluctuation range was relatively large, which was not suitable for continuous training.
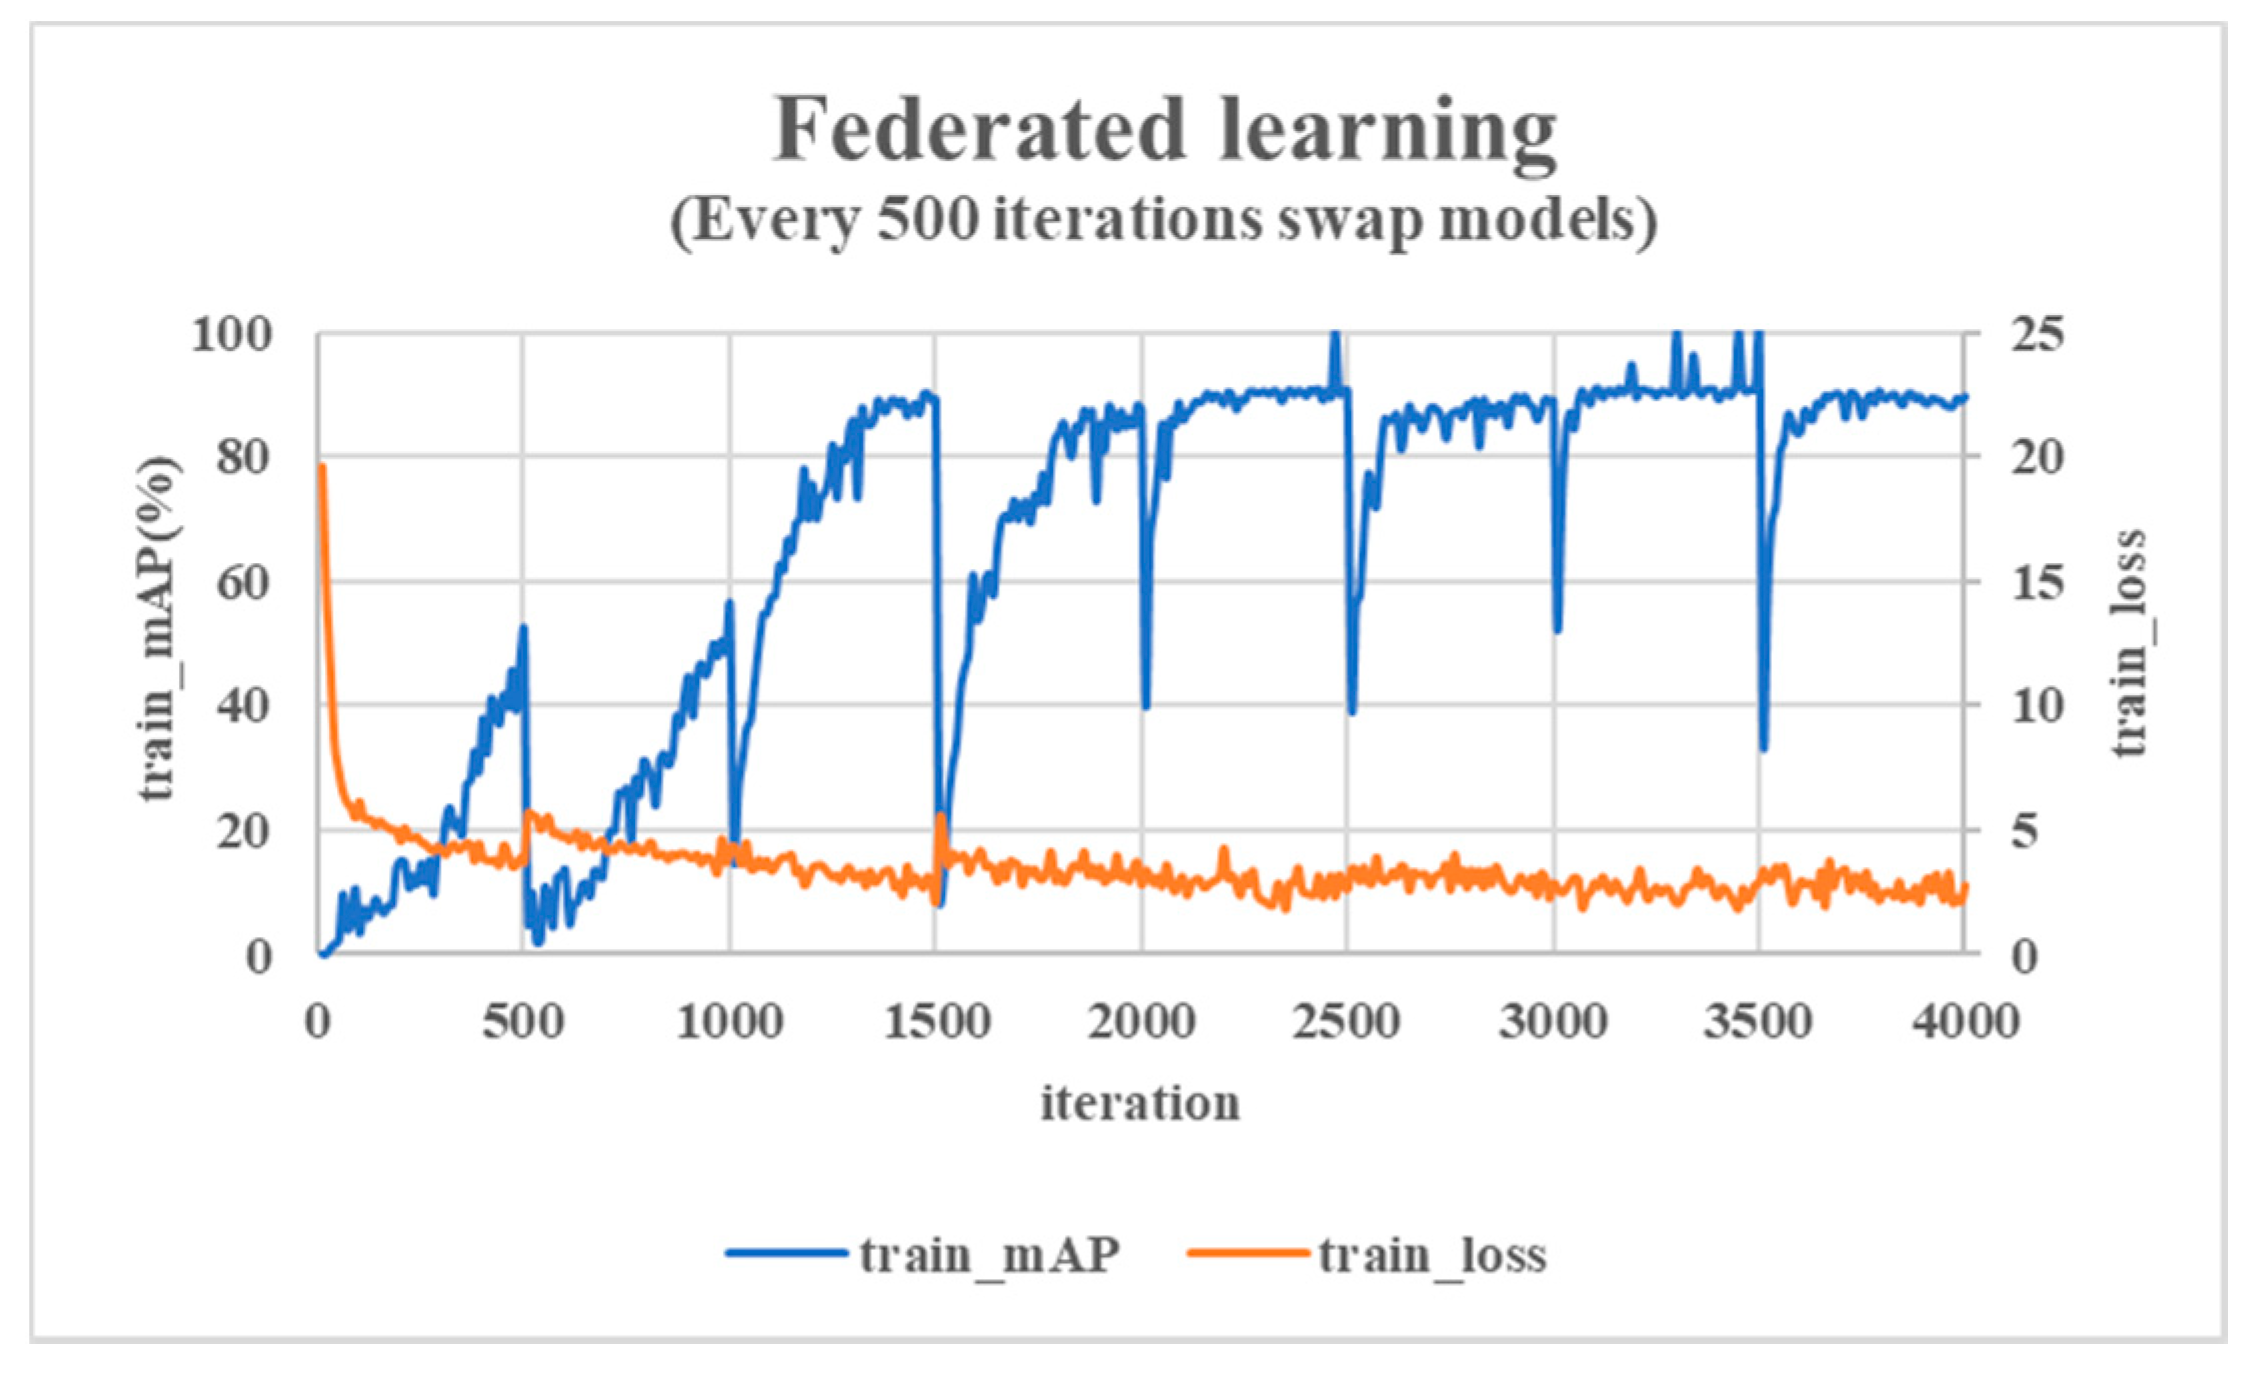
After completing the above controlled trial, we followed the training results in Figure 12 for federated learning. In the process of simulating federated learning, it is very important to hand over the training process model to other nodes to continue training. This determines whether the training models of different data sets can be merged, and also determines the training speed and final accuracy. If the model exchange is too frequent, the model of a single data set is difficult to form. If the number of exchanges is too small, it is difficult for the more mature models to merge, so when to exchange models is crucial.
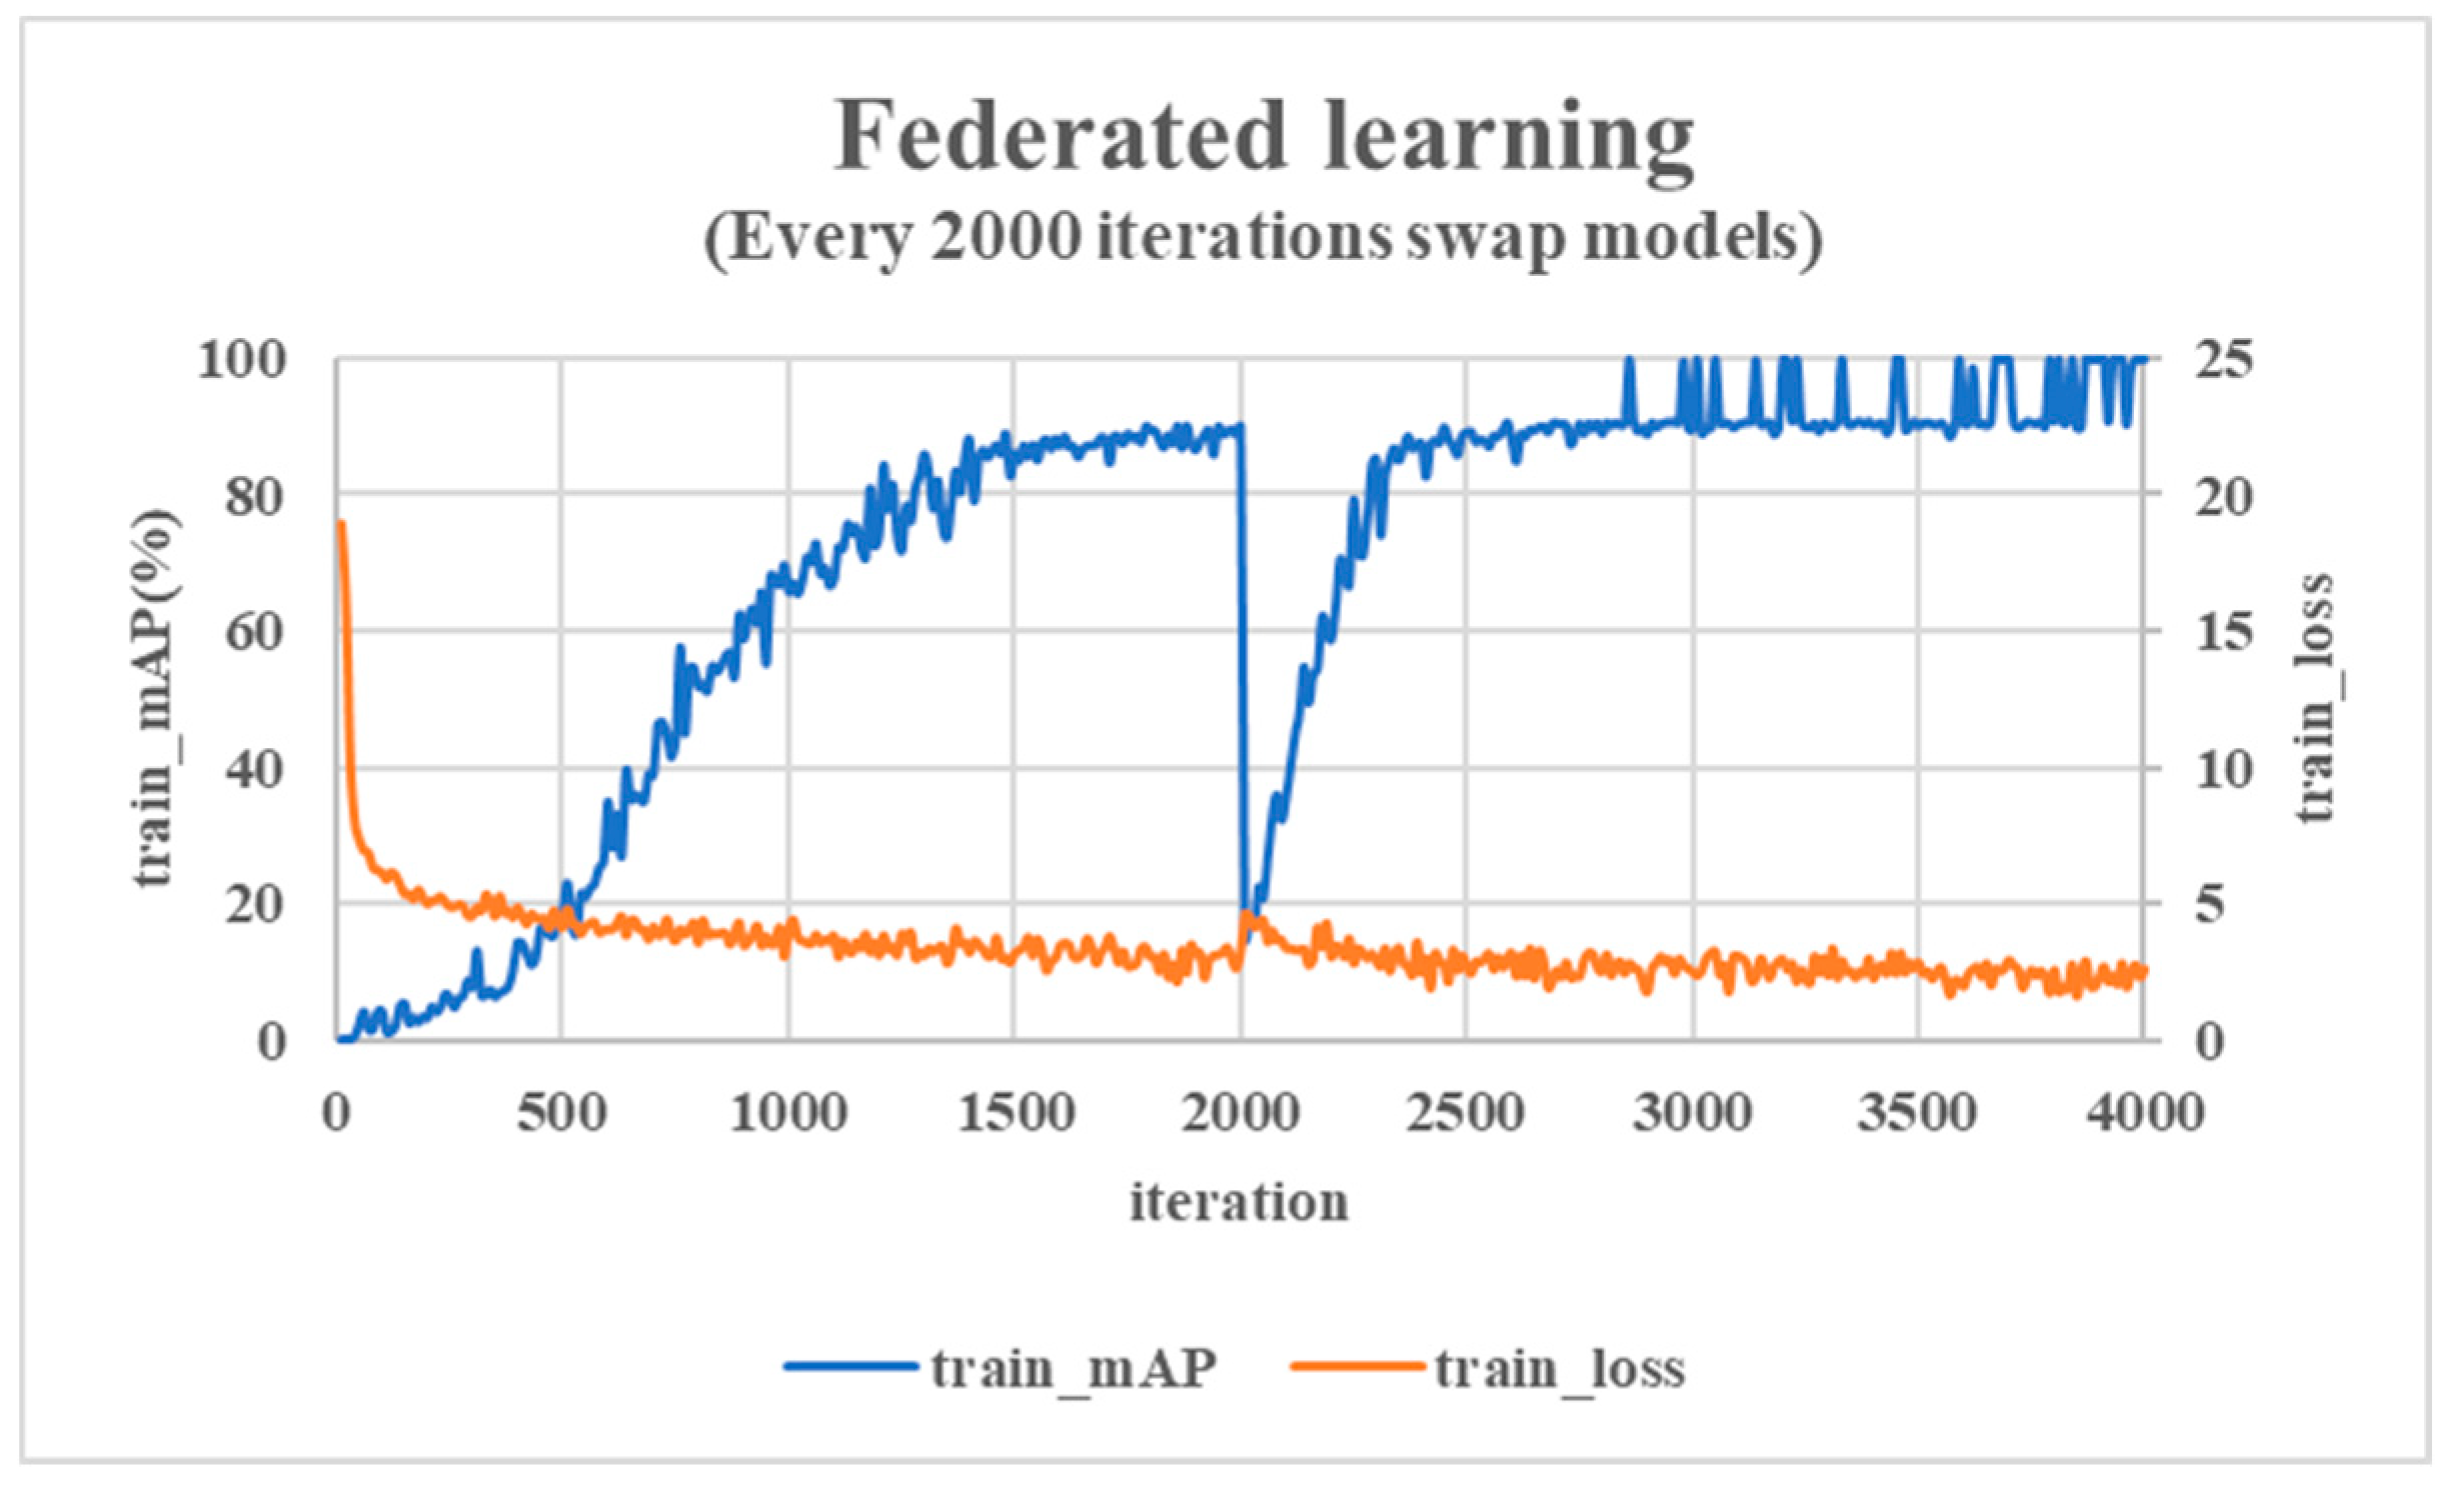
Thus, we conducted a set of controlled experiments to determine how the training nodes were exchanged during federated learning. The experiment in Figure 12 is to train the data set of Los Angeles. After the training accuracy becomes smooth, we used its training model as the basic training model for the training node corresponding to the Washington data set. After this experiment, a federated model of two city data sets can be obtained. Compared to our main experiment, this control experiment also changed the training subjects every 2000 iterations, which is shown in Figure 15. According to the accuracy change, we can see that it also gradually leveled off after 3000 iterations and reached about 90%. However, in 4000 iterations each data node was trained only once, so its adaptability to the new model could not be verified. Therefore, its cost must be greater than that of the experiment of exchanging models every 500 iterations, so we did not adopt this method.
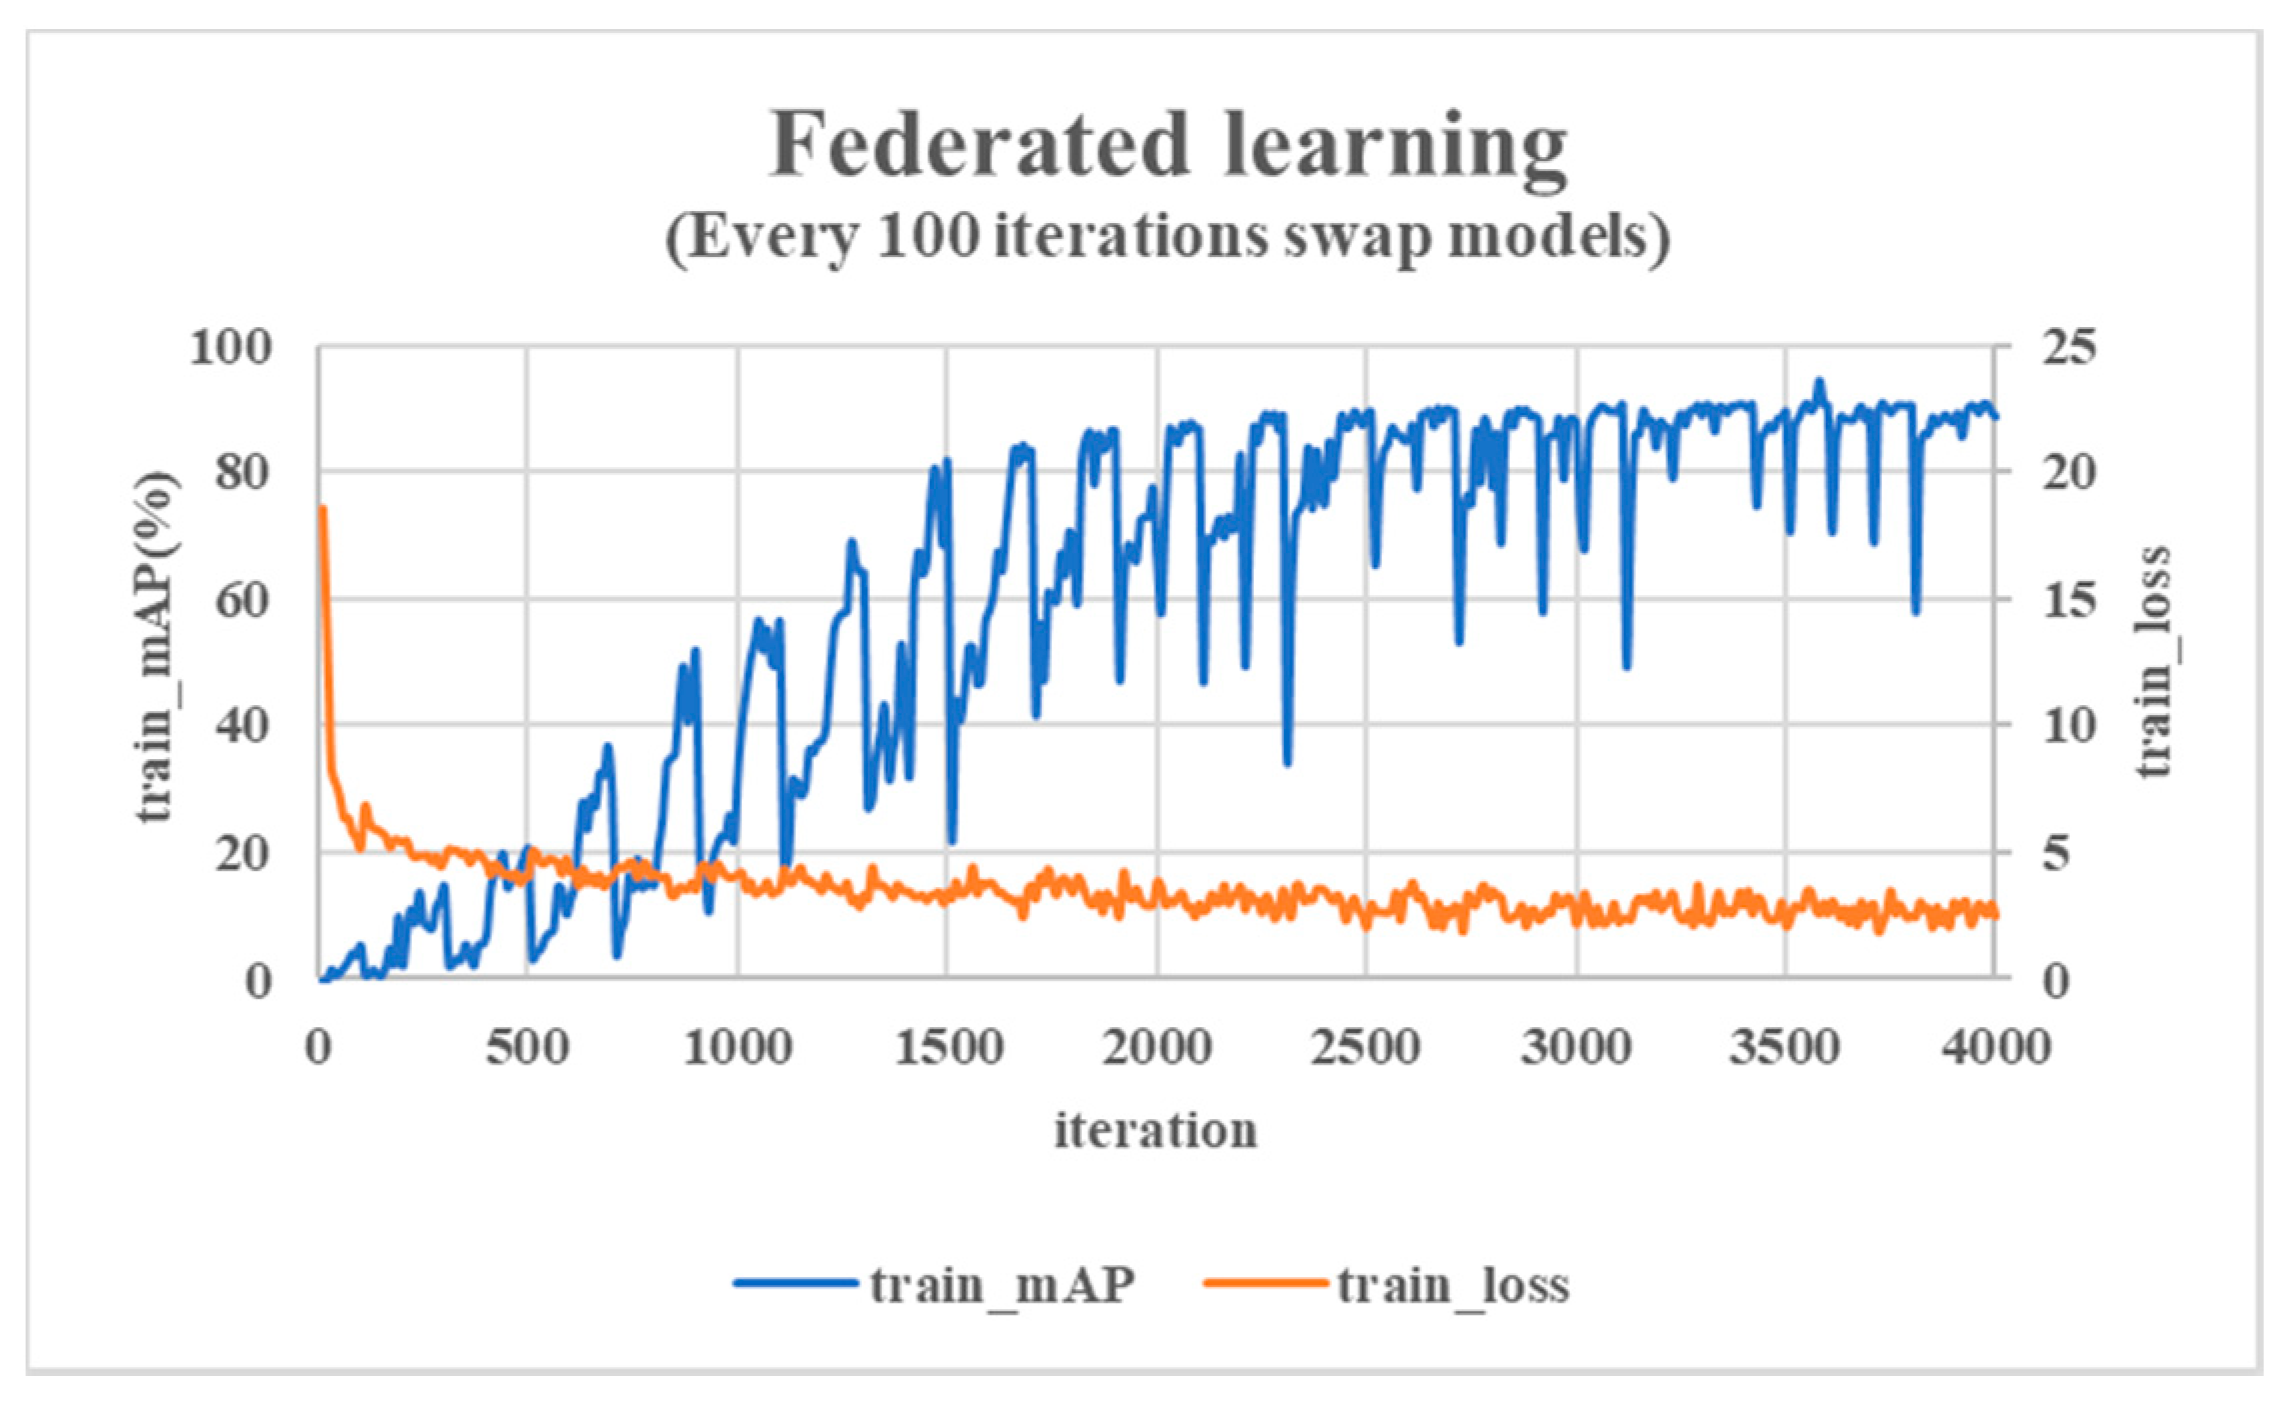
Then, we carried out a control experiment as shown in Figure 16. We made each training node exchange model every 100 iterations. We found that the accuracy leveled off and went through more than 3000 iterations at around 90%, so the cost of this control experiment was greater than that of the main experiment.
Thus, we moved to federated learning by training nodes with iterations every 500 times, so we needed to transfer the model once. In order to show the difference between the federal learning and the general deep learning methods for the data model formation process, we used the general method for the model training. In the general deep learning training comparison experiment, the data of the two data sets were directly mixed and directly trained. From Figure 17, without federated learning the accuracy flattens out to about 88% and requires at least 3000 iterations. Therefore, the use of federated learning can achieve a better training effect in a similar time, with higher training accuracy, and also protect the privacy of the data and the data security.
Since the data sources of the simulation experiment are remote sensing images, we do not use the LSTM recurrent neural network for further processing. Since there is no data leakage problem in the process of data transmission in the simulation experiment, there is no need to encrypt the transmission mode.
4.4. Prediction
In the traffic congestion monitoring system, the traffic management department is required to make real-time traffic congestion prediction. In the simulation system, we simulate this process as prediction through the model saved by the training node just now. Firstly, the image that needs to be predicted is pre-processed, and then the vehicle targets in it are detected to judge the traffic congestion according to the current number of vehicles.
5. Experimental Result
5.1. Experimental Result
In order to verify the correctness of the above experimental process, we designed a verification experiment to use the model to predict the pictures in the test set. The prediction results are as follows. The algorithm marks the vehicle targets through the red detection frame, and the number of vehicle targets can be observed to achieve the purpose of detect congestion.
Our trained target classifier is a model of vehicle detection. The detection standard is the recognition accuracy of vehicles. The definition of recognition accuracy is the number of objects correctly identified as vehicles in the current remote sensing image divided by all the vehicles in the current remote sensing image. We used a counter to count the marked detection frame. In the program, every time a detection frame is drawn, the counter is increased by one. The total number of detection frames is the number of vehicle targets detected in the image.
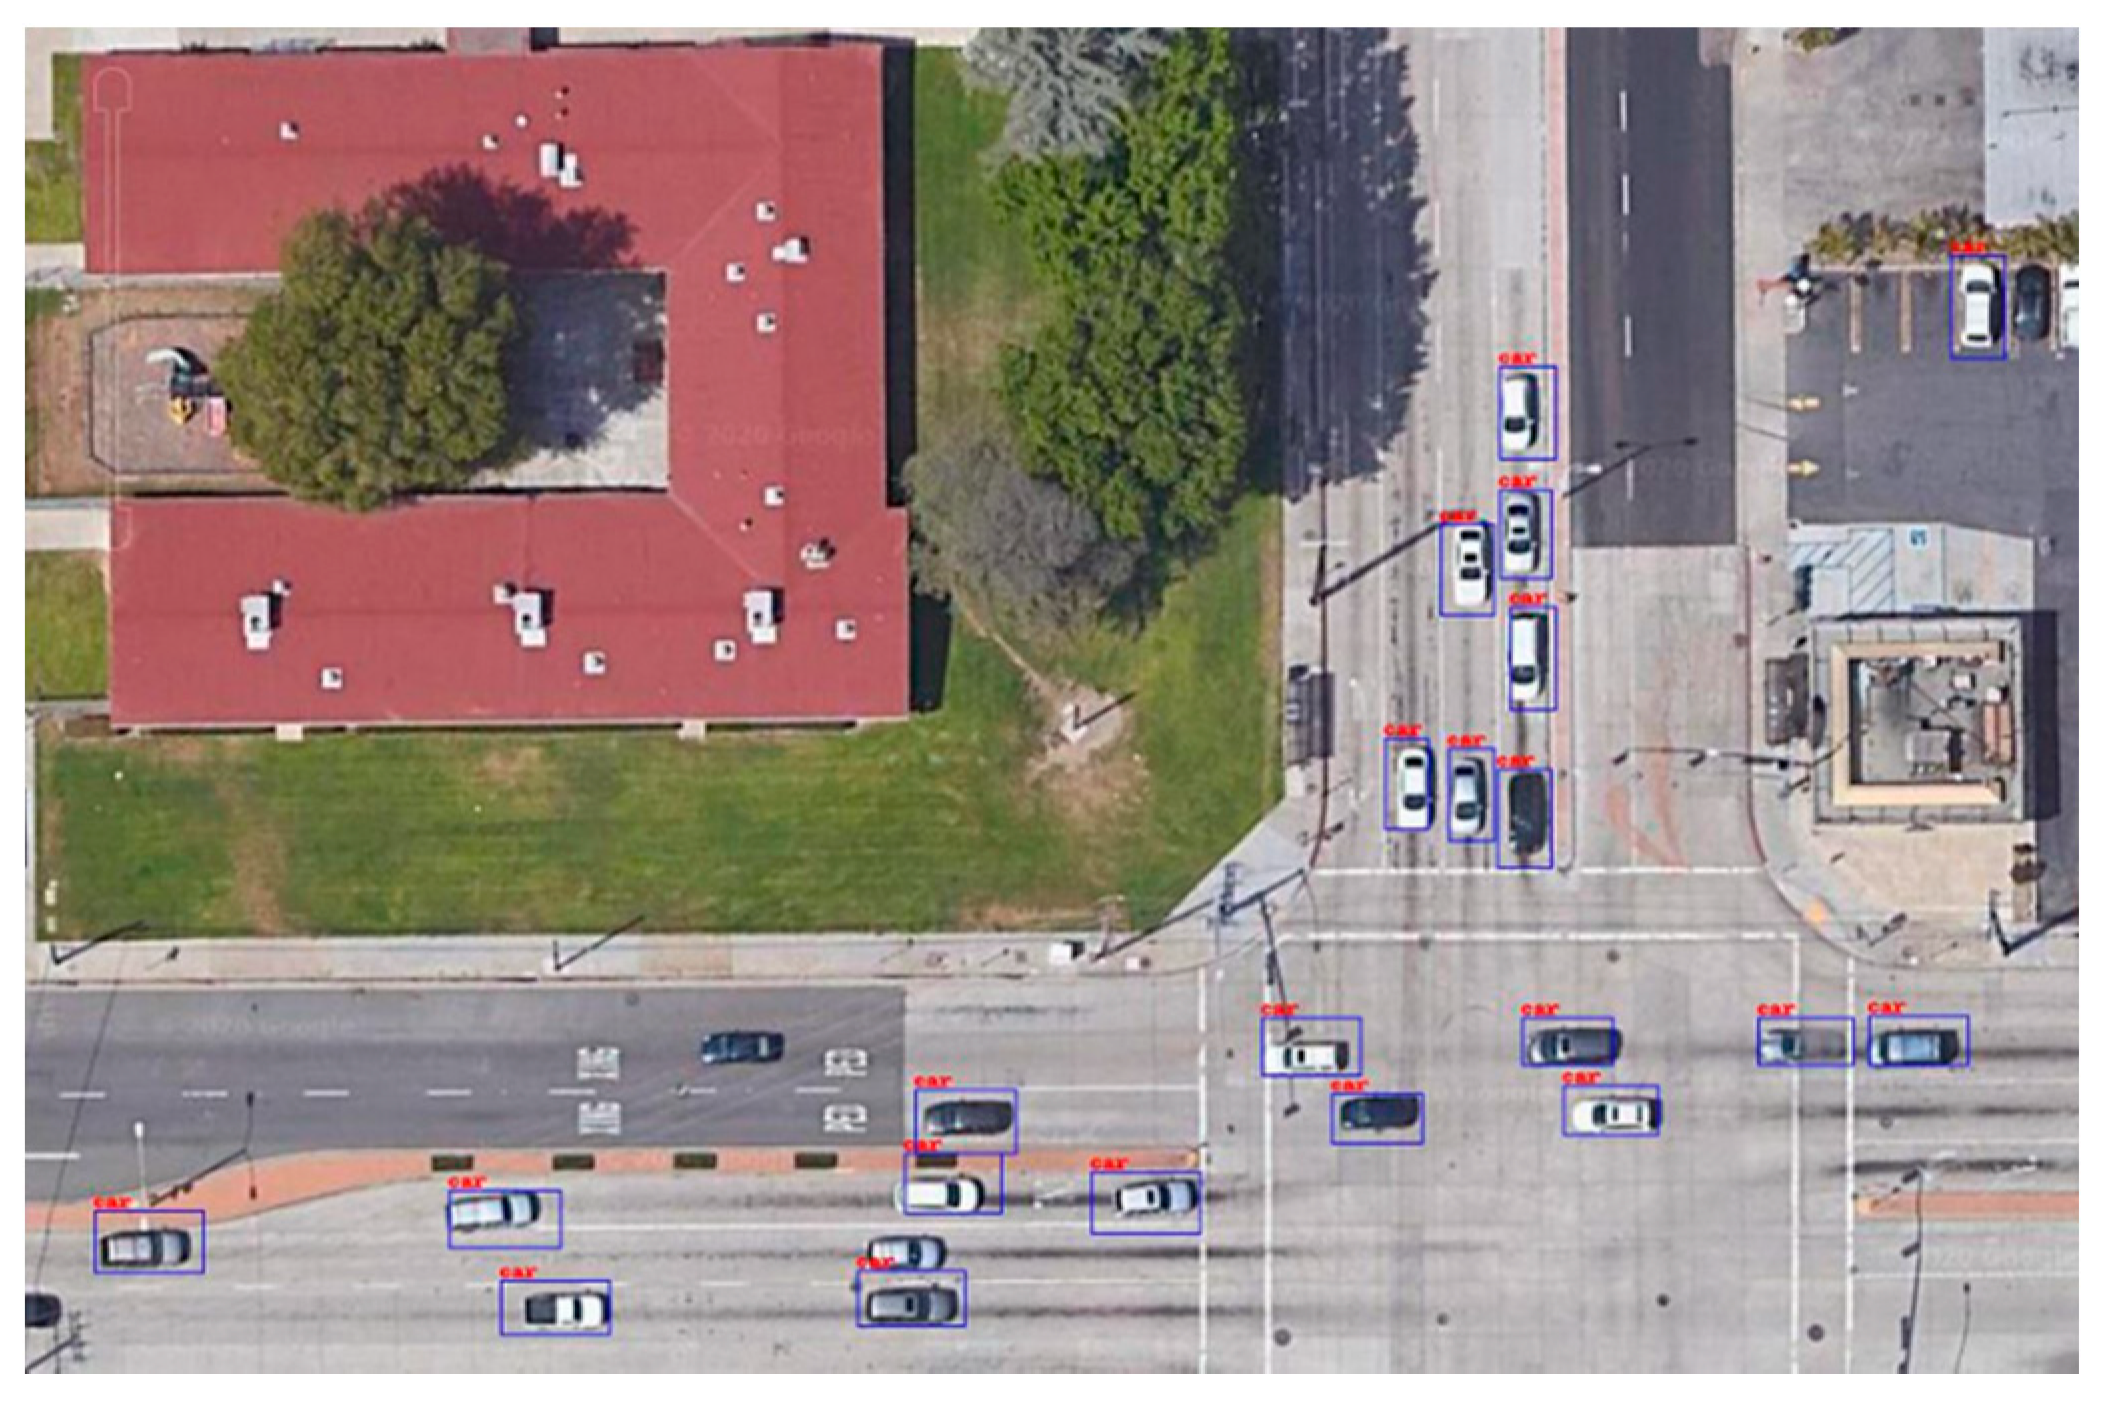
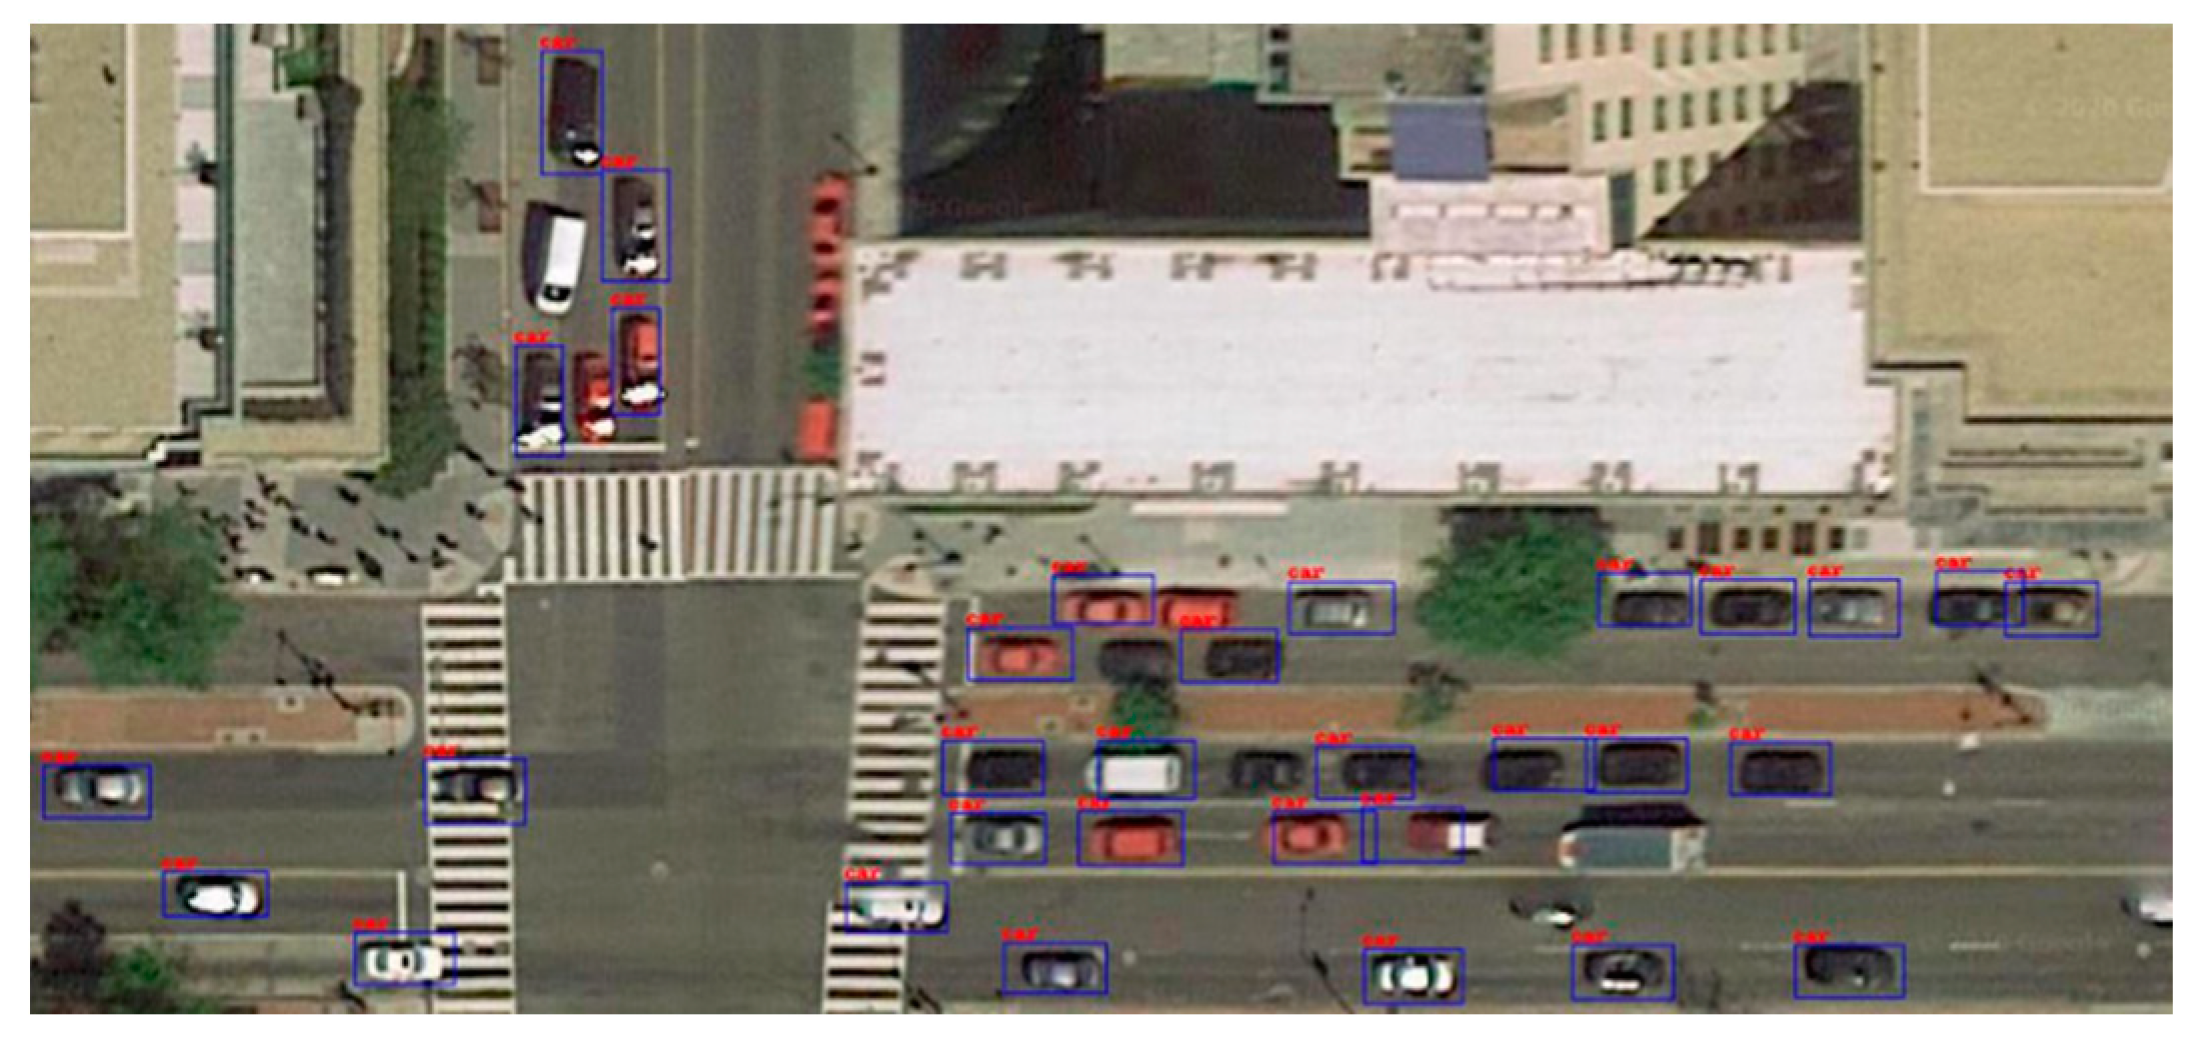
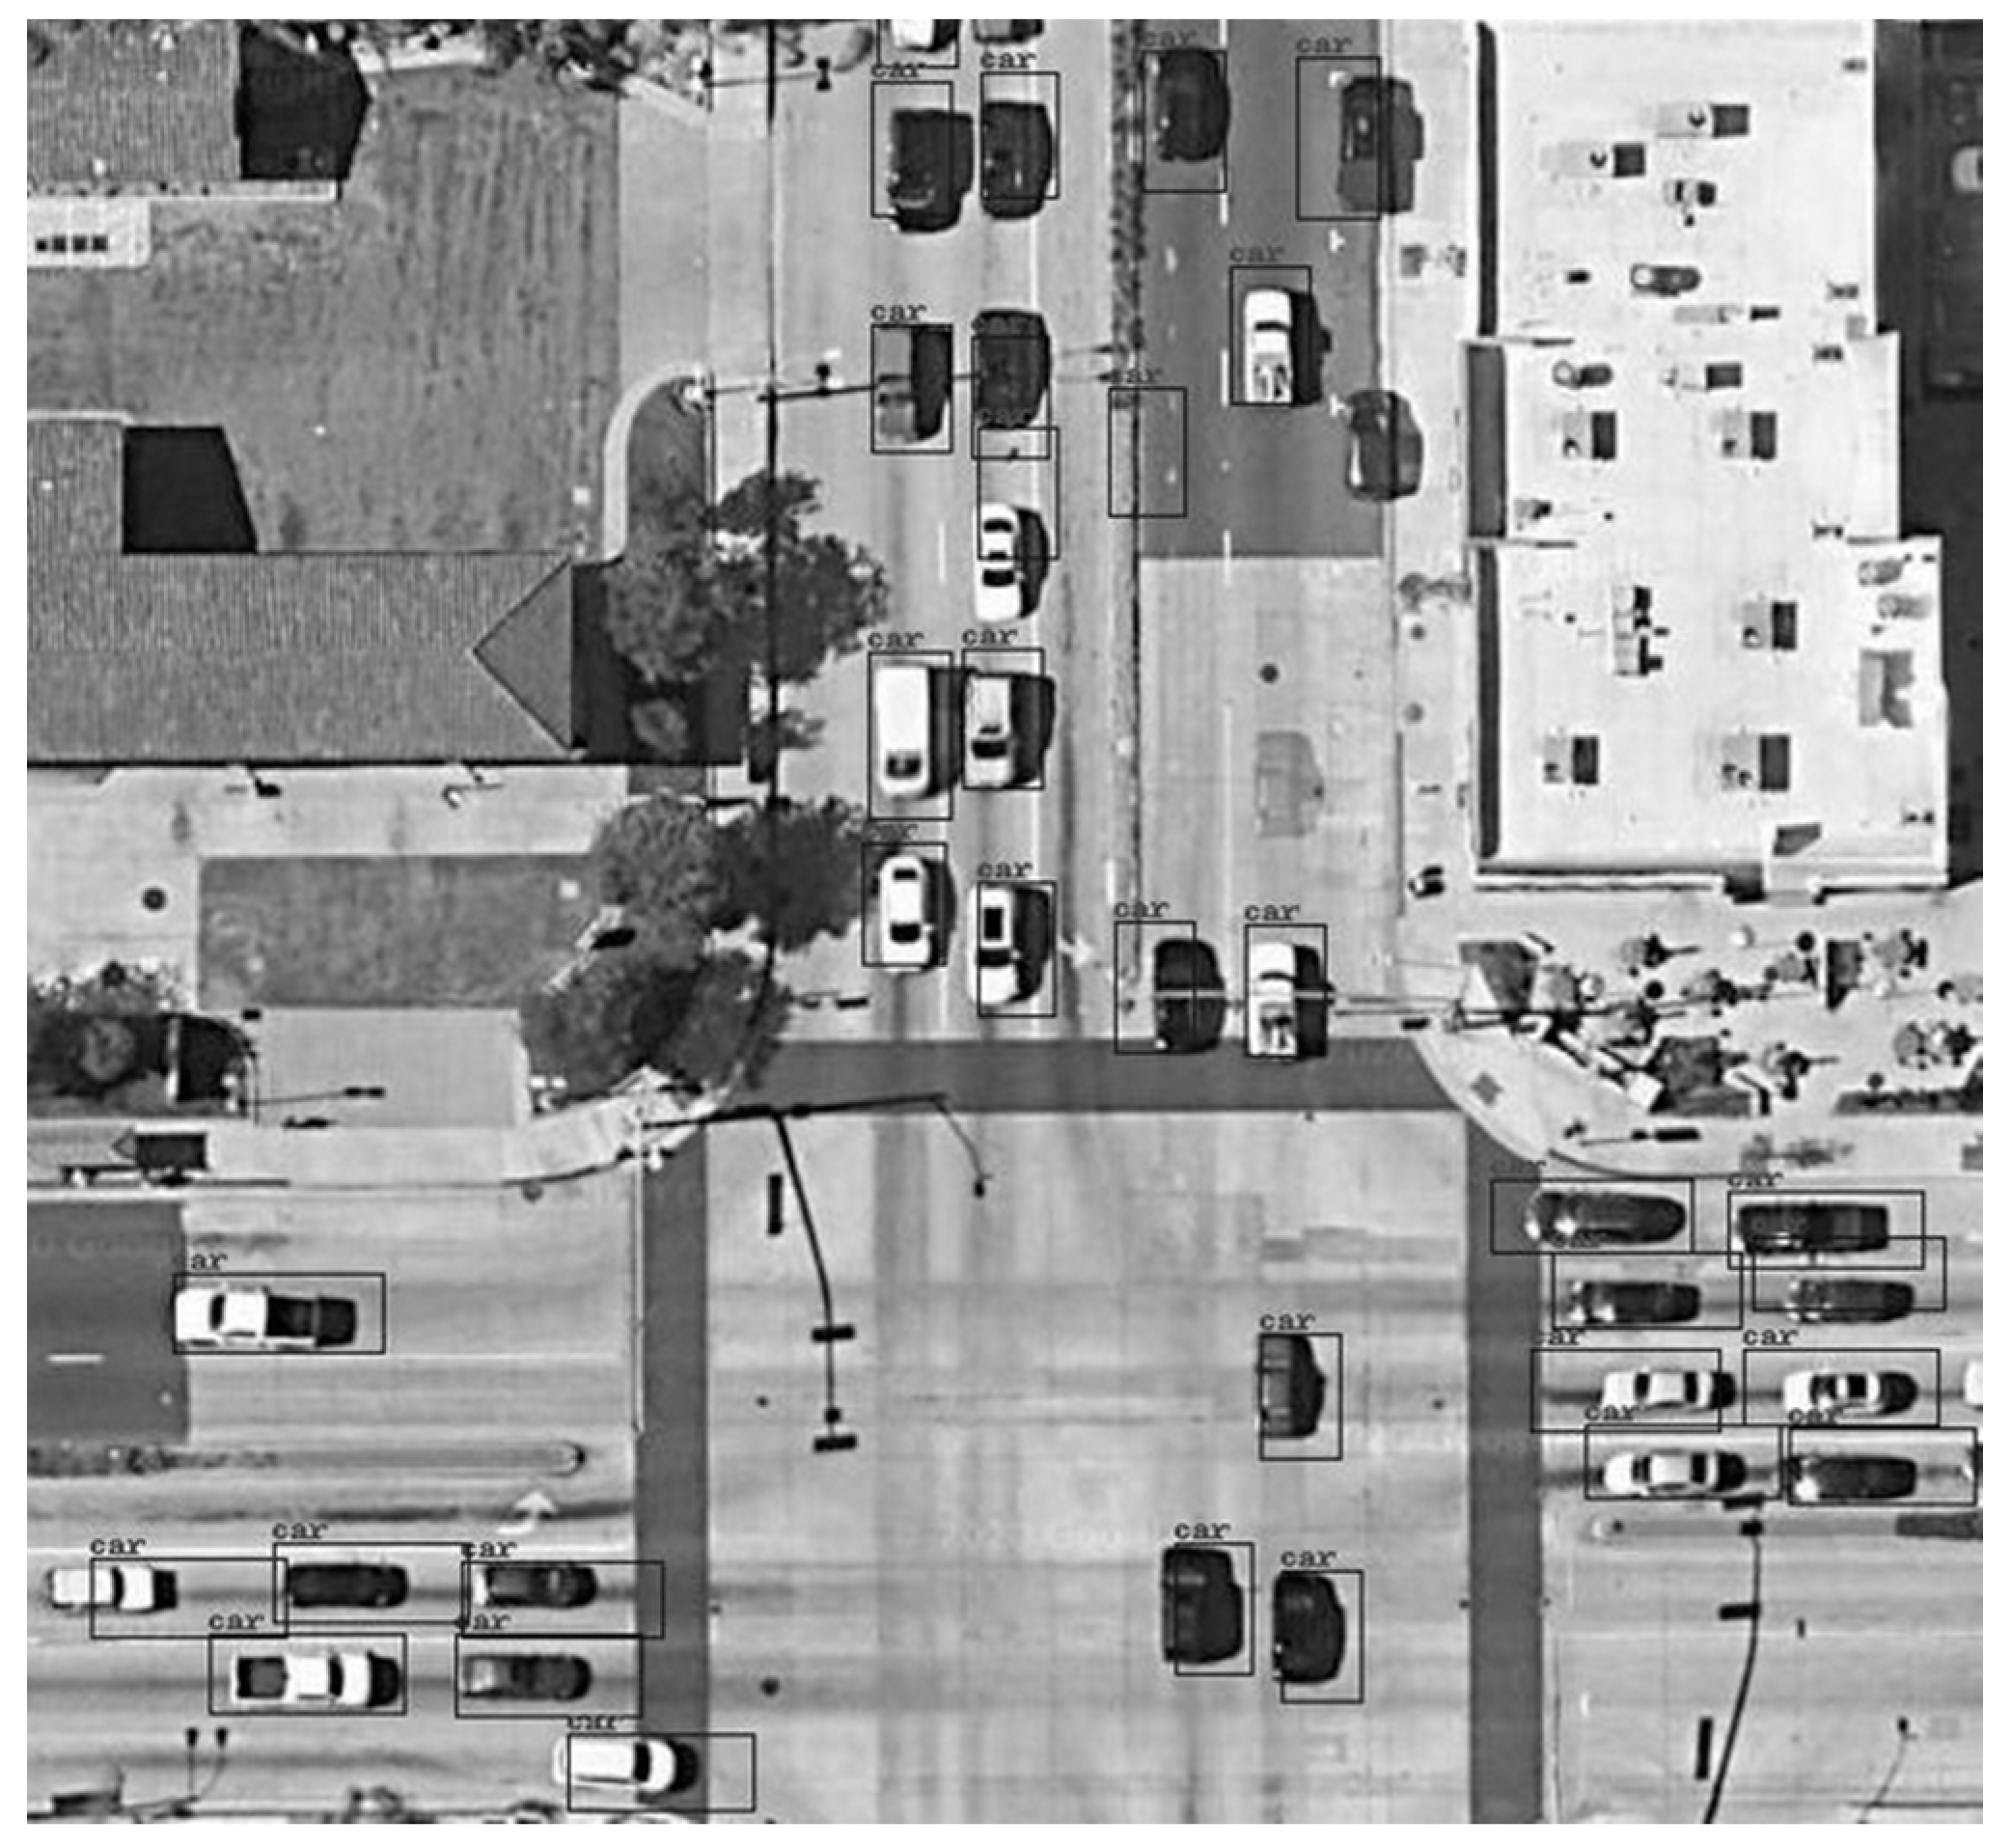
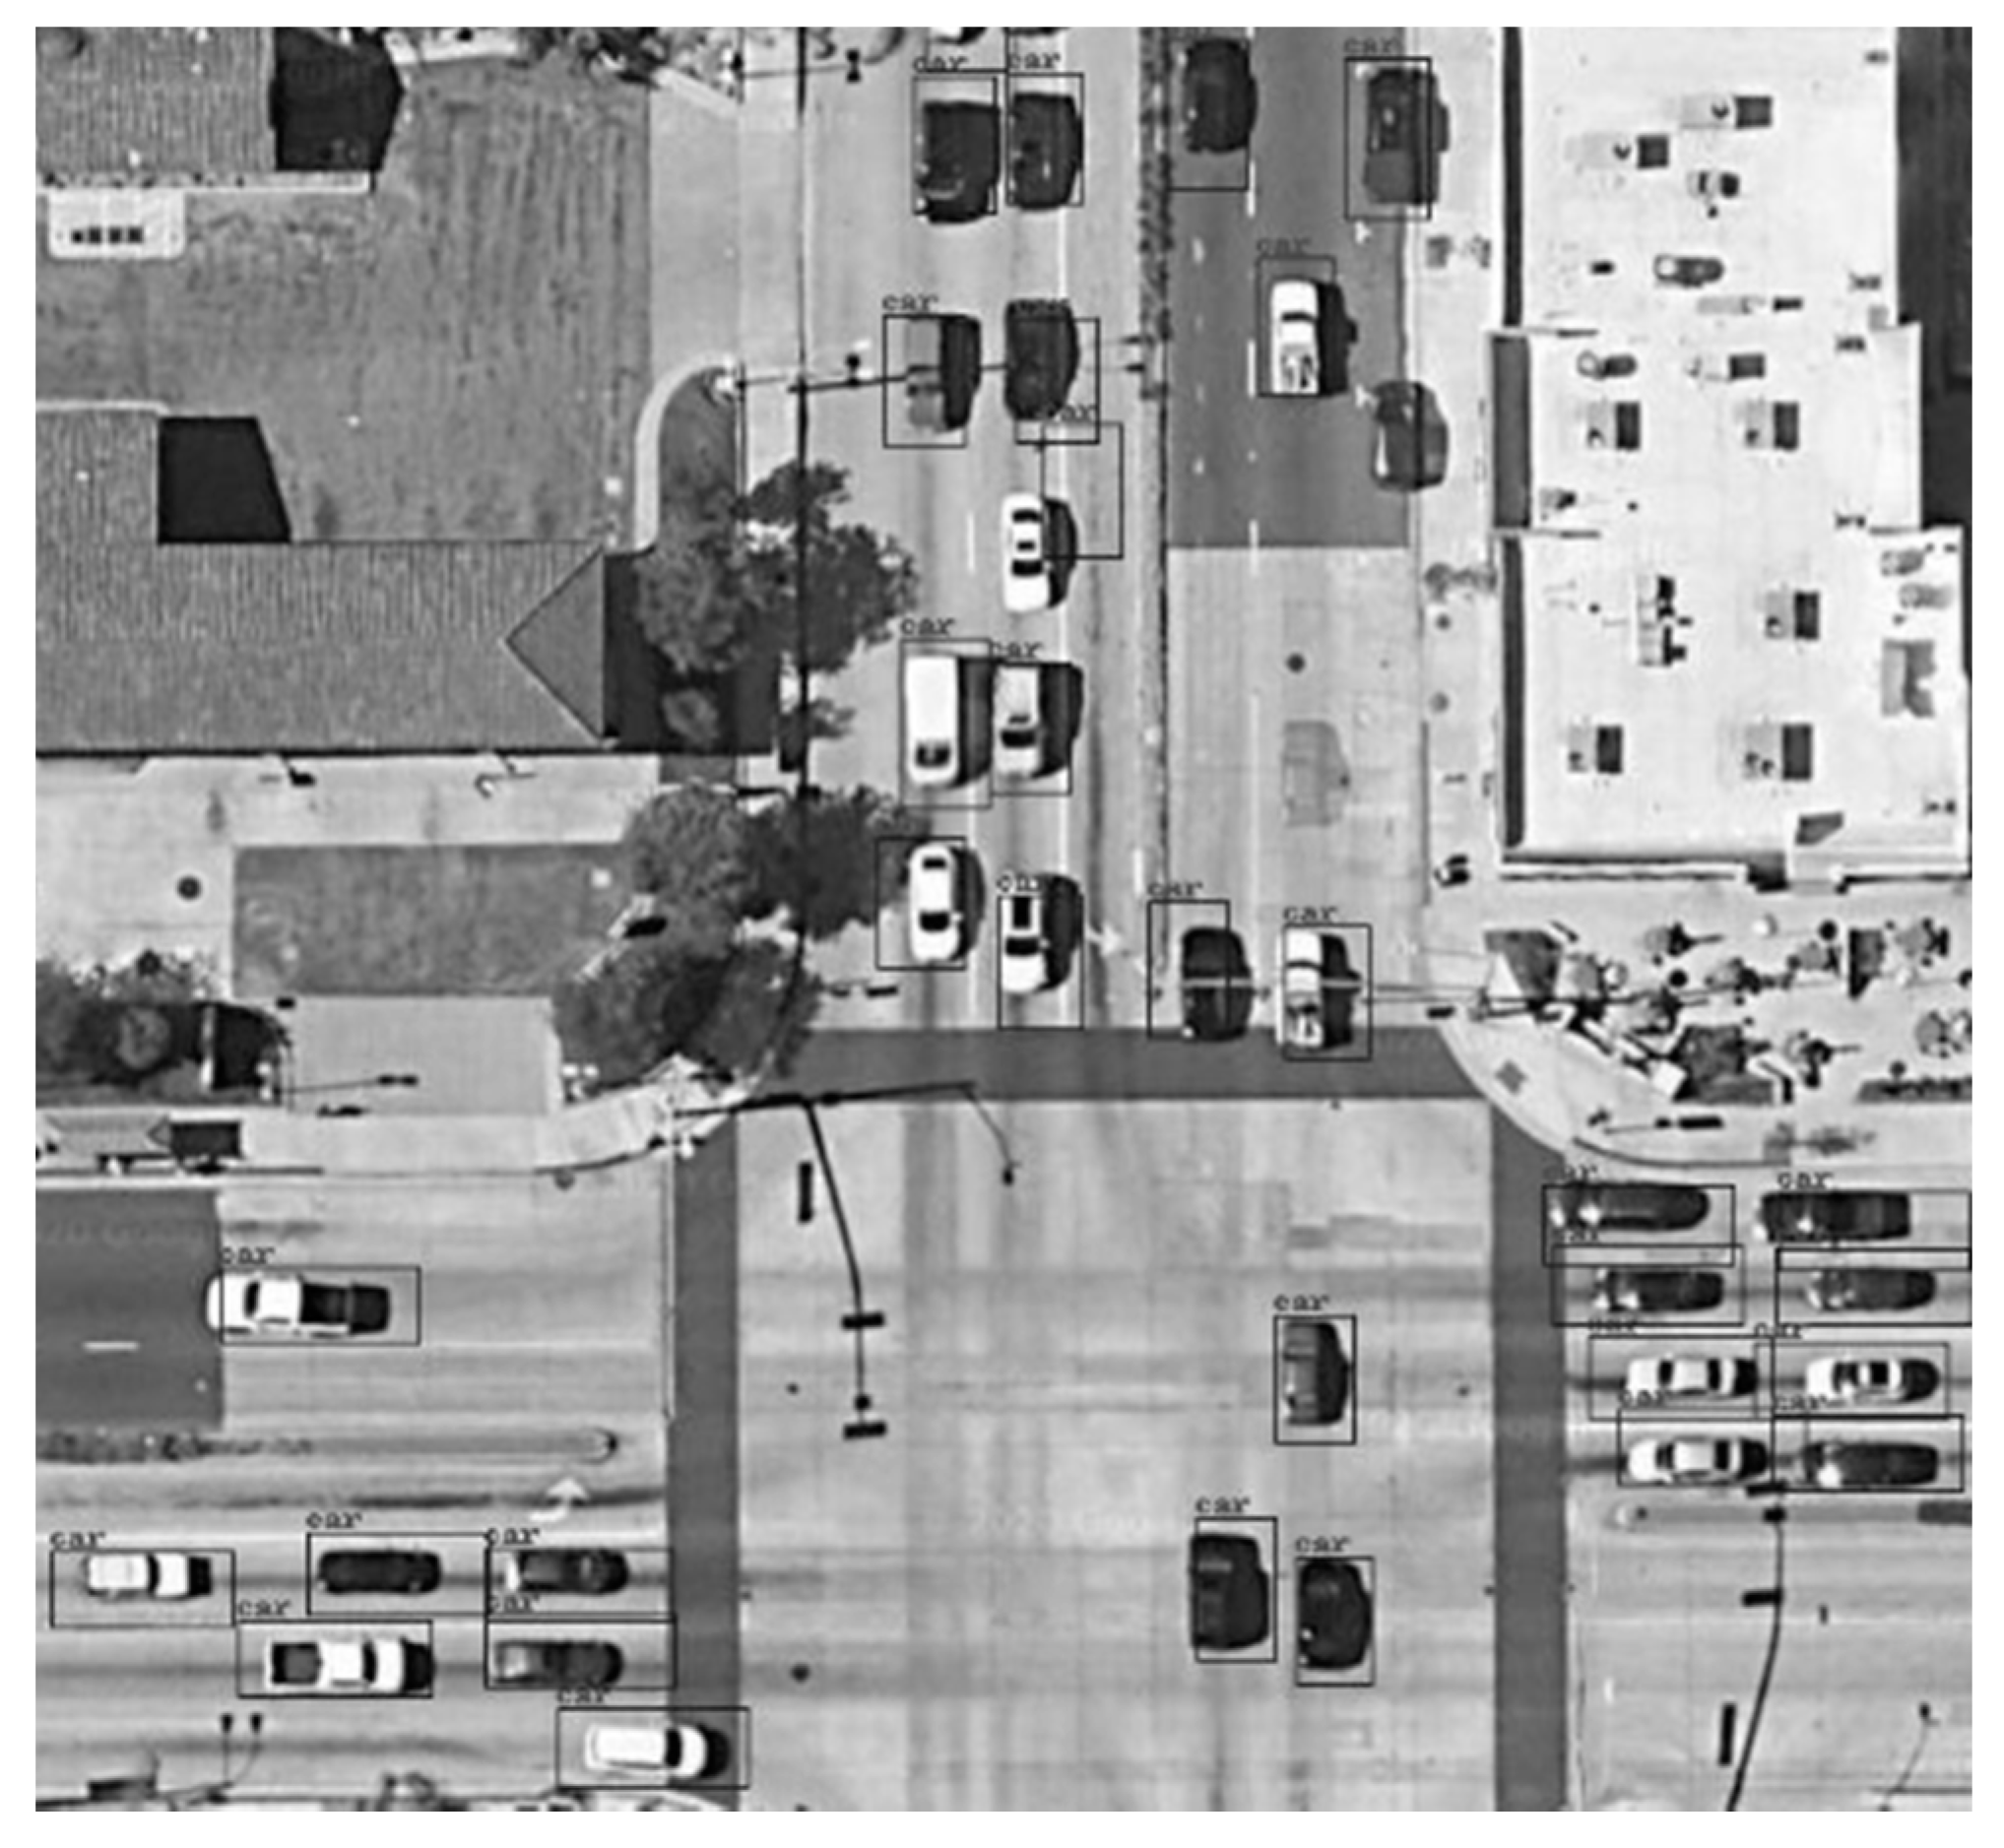
The simulated server node is predicted with the trained model. We tested the pictures in the test set and randomly selected two of them as the prediction effect to display. Because the remote sensing images displayed in Google Earth come from different satellites, the satellites have different heights, different angles, and different magnification of shooting features. Thus, for different regions of remote sensing images, there are different shooting effects and resolutions. We chose one clearer image shown in Figure 18 and a more blurred image shown in Figure 19. The two images are obtained in the same way as described above. The detection results of images with different definitions show that the experimental training model is suitable for remote sensing images of various resolutions, and that the image resolution does not affect the formation of the experimental model.
The detection results are shown in Figure 18 and Figure 19, and the vehicle target recognition degree reaches 86.9% in Figure 18 and 83.8% in Figure 19. Through the detection of vehicle targets, we can judge the current road congestion so as to form a traffic congestion monitoring system.
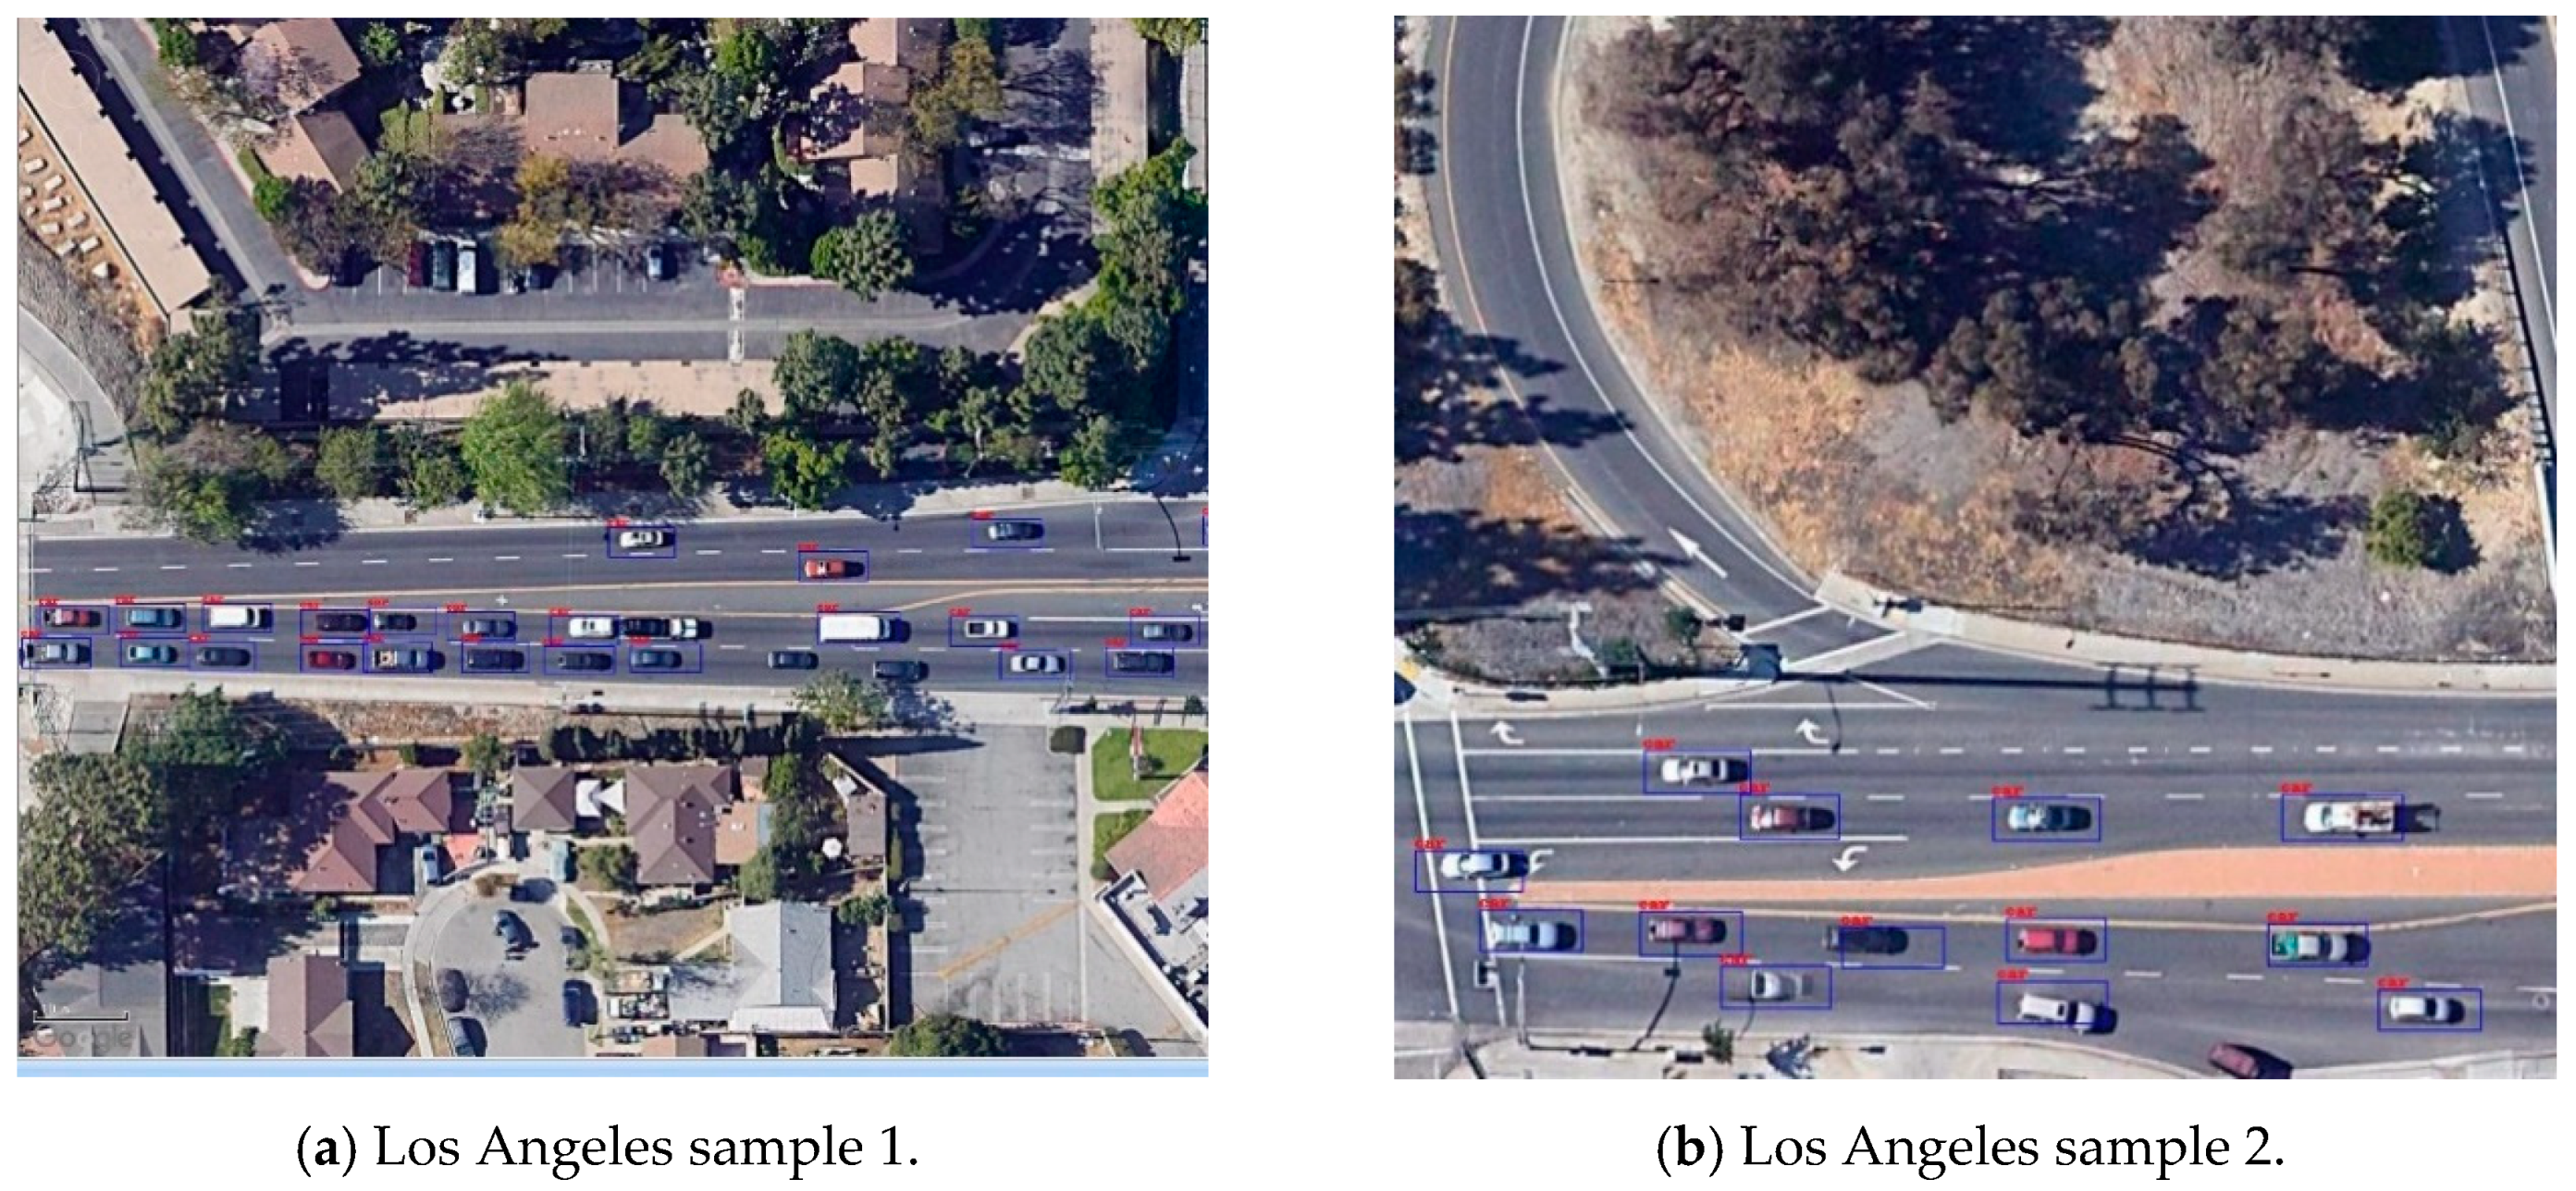
In order to further verify the general effect of the simulation experiments, we selected two images of Los Angeles as the results for display, as shown in Figure 20.
Remote sensing images of different regions may be taken by different satellites at different times, and the weather may be different when the images are taken; this will affect the brightness and clarity of remote sensing pictures. The image quality of each satellite is different, so the final prediction results are greatly affected by the spectral characteristics and color ratios of the remote sensing images themselves. Furthermore, different vehicle targets may be different colors, which will also affect the final judgment.
Therefore, in order to eliminate the influence of remote sensing image color on the final prediction results, we convert the images that are needed for training into gray-scale images for processing. Through the same training process, we can get more accurate results than before. This system is to judge the degree of congestion by calculating the number of vehicles on the road at a certain time, so the gray-scale of remote sensing image does not affect the final result. We can see the predicted results in Figure 21, and the accuracy is about 90 percent. However, we find that there are cases in the prediction results that are not vehicle targets but that are marked as targets.
According to the above conclusions, due to the monotonous color, the prediction algorithm may mistake an object which is similar to the vehicle model for the vehicle model. Because in the original images, some of the colors are different, the gray-scale images colors are not the same. Thus, we need to adjust the color difference and contrast of the gray-scale images. It can be seen from the latest prediction results shown in Figure 22 that, due to the reduction in color difference, the phenomenon of error recognition is eliminated; we find the maximum point of accuracy for prediction by increasing the number of training times so as to obtain the optimal result, which has a more than 90 percent accuracy. It is concluded that the training accuracy can be significantly improved if the images are processed with gray-scale and the images’ brightness and color difference are increased.
According to the detection results shown above, although the position of the detection frame deviates slightly from the position of the actual vehicle target, the detection frame basically does not mark non-existent vehicle targets. For the accuracy of the detection frame marking, the long-term federated learning of massive data through multiple nodes can gradually improve. The prediction model will also be gradually improved with the federated learning progresses and has a wider recognition ability to recognize more car types and more remote sensing image states.
We can infer the degree of congestion from the detection of vehicle targets. We can use an integrated approach [36] of the evaluation of traffic congestion degree proposed by Nannan Hao et al. to determine whether there is traffic congestion or not. We can also detect the same vehicle target through two remote sensing images with short intervals to calculate its driving speed during this period to judge the congestion. With the development of remote sensing technology and the addition of the LSTM neural network, calculating the speed of an automobile target will be more easily realized. According to the traffic operation grade division table which is shown in Table 1 from the indices system of urban road traffic congestion evaluation [37] and the calculated vehicle driving speed, we can judge the current congestion situation.
5.2. Discussion
The main research direction of this experiment is how to train remote sensing data on the premise of ensuring data privacy. In this experiment, the convolutional neural network MobileNet and the detection box algorithm SSD are combined for target detection, and the federated learning method is used to solve the data privacy problem. The addition of federated learning not only protects the safety of experimental data, but also improves the performance of the experiment, so that the experiment can achieve a higher accuracy with fewer iterations than training using normal methods. In order to better realize real-time traffic congestion monitoring based on remote sensing data, we propose to introduce the LSTM neural network and combine it with existing experiments. Vehicle detection based on remote sensing video streams is obtained to better judge the current road condition.
This system is committed to realizing the target detection function based on remote sensing data under the premise of data security. According to this principle, the system can be extended to many other application directions of remote sensing data. In military geology, the system can be used to detect military targets without divulging military secrets. In addition, the system can analyze remote sensing data in the country’s classified areas. The realization of this system solves the problem that the security of remote sensing data cannot be guaranteed effectively. In other aspects, we can also use the system to capture illegal parking and other phenomena to improve the appearance of the city and urban environment.
For the current progress of the study, traffic congestion monitoring based on general remote sensing images can be achieved and the application of federated learning in the training process has been highlighted, but there are still many areas for improvement. First, the simulation experiment is limited to static remote sensing images, and its improvement can be used to form target detection based on video streams through the LSTM network mentioned in the article. Secondly, due to the limitation of data acquisition authority, the experiment only selects general remote sensing images, and the results of the research can be realized in more precise remote sensing images such as multi-dimensional remote sensing images and hyperspectral remote sensing images. Thirdly, the method of judging the traffic congestion in the later period can be combined with the existing research to form a complete system of monitoring system for congestion evaluation. Finally, with the development of neural networks, more neural networks with better results and faster speeds have appeared one after another, which is more suitable for model training in the simulation experiment.
6. Conclusions
The traffic congestion monitoring system takes remote sensing data as the processing object and federated learning as the processing method to realize congestion monitoring on the premise of ensuring the privacy of remote sensing data. From the point of view of data security, the system uses the data training method of federated learning. In order to realize target detection on remote sensing data, we use the MobileNet convolutional neural network and the SSD target detection algorithm. Finally, the problem of data privacy when using remote sensing data for target detection is solved.
With the addition of federated learning, the system’s experiments on remote sensing image data sets in Los Angeles and Washington road achieved an accuracy of about 85 percent. The estimated time to process each image can be as low as 0.047 s.
The scope of future work includes updating the neural network model used and gradually implementing congestion detection based on remote sensing video streams, followed by using higher precision and more comprehensive remote sensing images as data sources to improve the recognition effect, and finally forming a complete congestion evaluation system.
Author Contributions
Data curation, C.X.; formal analysis, C.X.; methodology, C.X. and Y.M.; project administration, Y.M.; resources, Y.M.; visualization, C.X.; writing—original draft, C.X.; writing—review and editing, Y.M. All authors have read and agreed to the published version of the manuscript.
Funding
This research received no external funding.
Conflicts of Interest
The authors declare no conflict of interest.
References
- INRIX 2019 Global Traffic Scorecard. Available online: https://inrix.com/scorecard/ (accessed on 20 March 2020).
- Qureshi, K.N.; Abdullah, A.H.; Altameem, A. Road aware geographical routing protocol coupled with distance, direction and traffic density metrics for urban vehicular ad hoc networks. Wirel. Pers. Commun. 2017, 92, 1251–1270. [Google Scholar] [CrossRef]
- United States Infrared Satellite. Available online: https://www.wunderground.com/maps/satellite/regional-infrared (accessed on 20 February 2020).
- Zambanini, S.; Loghin, A.M.; Pfeifer, N.; Màrmol Soley, E.; Sablatnig, R. Detection of parking cars in stereo satellite images. Remote Sens. 2020, 12, 2170. [Google Scholar] [CrossRef]
- Scholtz, R.; Prentice, J.; Tang, Y.; Twidwell, D. Improving on MODIS MCD64A1 burned area estimates in grassland systems: A case study in kansas flint hills tall grass prairie. Remote Sens. 2020, 12, 2168. [Google Scholar] [CrossRef]
- Lary, D.J.; Alavi, A.H.; Gandomi, A.H.; Walker, A.L. Machine learning in geosciences and remote sensing. Geosci. Front. 2016, 7, 3–10. [Google Scholar] [CrossRef] [Green Version]
- Pelletier, C.; Valero, S.; Inglada, J.; Champion, N.; Gérard, D. Assessing the robustness of random forests to map land cover with high resolution satellite image time series over large areas. Remote Sens. Environ. 2016, 187, 156–168. [Google Scholar] [CrossRef]
- Boulze, H.; Korosov, A.; Brajard, J. Classification of sea ice types in Sentinel-1 SAR data using convolutional neural networks. Remote Sens. 2020, 12, 2165. [Google Scholar] [CrossRef]
- Daniel, L.; Lang, N.; van Doorn, N.S.; Aodha, O.M.; Perona, P.; Wegner, J.D. Geocoding of trees from street addresses and street-level images. arXiv 2020, arXiv:2002.01708. [Google Scholar]
- Jie, C.; Huang, H.; Peng, J.; Zhu, J.; Chen, L.; Li, W.; Sun, B.; Li, H. Convolution neural network architecture learning for remote sensing scene classification. arXiv 2020, arXiv:2001.09614. [Google Scholar]
- Alhichri, H.; Alajlan, N.; Bazi, Y.; Rabczuk, T. Multi-scale convolutional neural network for remote sensing scene classification. In Proceedings of the 2018 IEEE International Conference on Electro/Information Technology (EIT), Rochester, MI, USA, 3–5 May 2018; pp. 1–5. [Google Scholar]
- ENVI. Available online: https://www.harrisgeospatial.com/Software-Technology/ENVI (accessed on 10 November 2019).
- Wang, H. Research on Traffic Congestion Discrimination Method Based on Road Surveillance Video. Ph.D. Thesis, Nanjing University of Posts and Telecommunications, Jiangsu, China, 2015. [Google Scholar]
- Zhang, X.; Hu, S.; Zhang, H.; Hu, X. A real-time multiple vehicle tracking method for traffic congestion identification. KSII Trans. Internet Inf. Syst. 2016, 10, 2483–2503. [Google Scholar]
- Chen, Y. OBD-based traffic congestion operation monitoring and optimization technology for urban road intersections. Intell. Build. Smart City 2019, 8. Available online: http://www.doc88.com/p-14259454201308.html (accessed on 15 July 2020).
- Shenzhen institute of advanced technology. A Method for Determining Urban Traffic Congestion. C.N. Patent 201310684462.5, 9 April 2014.
- Sen, R.; Siriah, P.; Raman, B. RoadSoundSense: Acoustic sensing based road congestion monitoring in developing regions. In Proceedings of the 2011 8th Annual IEEE Communications Society Conference on Sensor, Mesh and Ad Hoc Communications and Networks, Salt Lake City, UT, USA, 27–30 January 2011; pp. 125–133. [Google Scholar] [CrossRef] [Green Version]
- Chen, P.; Chen, F.; Qian, Z. Road traffic congestion monitoring in social media with hinge-loss markov random fields. In Proceedings of the 2014 IEEE International Conference on Data Mining, Shenzhen, China, 14–17 December 2014; pp. 80–89. [Google Scholar] [CrossRef]
- Del Arco, E.; Morgado, E.; Ramiro-Bargueño, J.; Mora-Jiménez, I.; Caamaño, A.J. Vehicular Sensor Networks in congested traffic: Linking STV field reconstruction and communications channel. In Proceedings of the 2011 14th International IEEE Conference on Intelligent Transportation Systems (ITSC), Washington, DC, USA, 5–7 October 2011; pp. 606–613. [Google Scholar] [CrossRef]
- Mandal, K.; Sen, A.; Chakraborty, A.; Roy, S.; Batabyal, S.; Bandyopadhyay, S. Road traffic congestion monitoring and measurement using active RFID and GSM technology. In Proceedings of the 2011 14th International IEEE Conference on Intelligent Transportation Systems (ITSC), Washington, DC, USA, 5–7 October 2011; pp. 1375–1379. [Google Scholar] [CrossRef]
- Ober-Sundermeier, A.; Zackor, H. Prediction of congestion due to road works on freeways, ITSC 2001. In Proceedings of the 2001 IEEE Intelligent Transportation Systems. Proceedings (Cat. No.01TH8585), Oakland, CA, USA, 25–29 August 2001; pp. 240–244. [Google Scholar] [CrossRef]
- Athanasios, Z.K.; Waller, S.T. An Internet-based geographic information system that integrates data, models and users for transportation applications. Transp. Res. Part C 2000, 8, 427–444. [Google Scholar] [CrossRef]
- Wang, Z.; Wang, X.; Wang, G. Learning fine-grained features via a CNN tree for large-scale classification. Neurocomputing 2018, 275, 1231–1240. [Google Scholar] [CrossRef] [Green Version]
- Shao, H.; Liu, K.; Lin, C.; Lu, J. DotFAN: A domain-transferred face augmentation network for pose and illumination invariant face recognition. arXiv 2020, arXiv:2002.09859. [Google Scholar]
- Howard, A.G.; Zhu, M.; Chen, B.; Kalenichenko, D.; Wang, W.; Weyand, T.; Andreetto, M.; Adam, H. MobileNets: Efficient convolutional neural networks for mobile vision applications. arXiv 2017, arXiv:1704.04861. [Google Scholar]
- Wei, L.; Anguelov, D.; Erhan, D.; Szegedy, C.; Reed, S.E.; Fu, C.; Berg, A.C. SSD: Single shot multibox detector. In Proceedings of the 14th European Conference, Amsterdam, The Netherlands, 11–14 October 2016. [Google Scholar]
- Qiang, Y.; Liu, Y.; Chen, T.; Tong, Y. Federated Machine Learning: Concept and Applications. arXiv 2019, arXiv:1902.04885. [Google Scholar]
- TensorFlow Federated. Available online: https://www.tensorflow.org/federated/ (accessed on 8 February 2020).
- Taniar, D.; Safar, M.; Tran, Q.T.; Rahayu, W.; Park, J.H. Spatial network RNN queries in GIS. Comput. J. 2011, 54, 617–627. [Google Scholar] [CrossRef]
- Sundermeyer, M.; Schlüter, R.; Ney, H. LSTM neural networks for language modeling. Interspeech 2012, in press. [Google Scholar] [CrossRef]
- Toon, B.; Antonio, M.; Juan, A.; Enrique, O.; Peter, H. A graph CNN-LSTM neural network for short and long-term traffic forecasting based on trajectory data. Transp. Res. Part C Emerg. Technol. 2020, 112, 62–77. [Google Scholar] [CrossRef]
- Google Earth. Available online: https://earth.google.com/ (accessed on 8 February 2020).
- Maxar. Available online: https://www.maxar.com/products (accessed on 10 November 2019).
- PaddlePaddle. Available online: https://www.paddlepaddle.org.cn/ (accessed on 7 January 2020).
- RMSProp. Available online: http://www.cs.toronto.edu/~tijmen/csc321/slides/lecture_slides_lec6.pdf (accessed on 10 March 2020).
- Hao, N.; Feng, Y.; Zhang, K.; Tian, G.; Zhang, L.; Jia, H. Evaluation of traffic congestion degree: An integrated approach. Int. J. Distrib. Sens. Netw. 2017, 13, 155014771772316. [Google Scholar] [CrossRef] [Green Version]
- Beijing Local Standard. Indices System of Urban Road Traffic Congestion Evaluation. DB11/T 785-2011. Beijing Municipal Bureau of Quality and Technical Supervision. Available online: https://wenku.baidu.com/view/0aca73d128ea81c758f57856.html (accessed on 25 March 2020).
Figure 1.
The data processing flow between Geographic Information System for Transportation (GIS-T) and the traffic congestion monitoring system.
Figure 1.
The data processing flow between Geographic Information System for Transportation (GIS-T) and the traffic congestion monitoring system.

Figure 2.
Variation of standard convolution compared to MobileNet convolution.

Figure 3.
Variation of standard convolution compared to MobileNet convolution.

Figure 4.
Variation of standard convolution compared to MobileNet convolution.

Figure 5.
Variation of standard convolution compared to MobileNet convolution.

Figure 6.
The network architecture of the MobileNet Single Shot Multibox Detector (SSD).

Figure 7.
The federated learning processing.

Figure 8.
The structure of the Recurrent Neural Network (RNN).

Figure 9.
The structure of the Long Short-Term Memory (LSTM) neural network.

Figure 10.
Remote sensing image of an intersection in Washington, America.

Figure 11.
mAP and loss variation of the Los Angeles and Washington training data set.

Figure 12.
mAP and loss variation of the Los Angeles training data set when the size of each training set is 32.
Figure 12.
mAP and loss variation of the Los Angeles training data set when the size of each training set is 32.

Figure 13.
mAP and loss variation of the Los Angeles training data set when the size of each training set is 64.
Figure 13.
mAP and loss variation of the Los Angeles training data set when the size of each training set is 64.

Figure 14.
mAP and loss variation of the Los Angeles training data set when the rate of learning is 0.01.
Figure 14.
mAP and loss variation of the Los Angeles training data set when the rate of learning is 0.01.

Figure 15.
mAP and loss variation of the Los Angeles and Washington training data sets when exchanging models every 2000 iterations.
Figure 15.
mAP and loss variation of the Los Angeles and Washington training data sets when exchanging models every 2000 iterations.

Figure 16.
mAP and loss variation of the Los Angeles and Washington training data sets when exchanging models every 100 iterations.
Figure 16.
mAP and loss variation of the Los Angeles and Washington training data sets when exchanging models every 100 iterations.

Figure 17.
mAP and loss variation of the Los Angeles and Washington training data sets with general deep learning.
Figure 17.
mAP and loss variation of the Los Angeles and Washington training data sets with general deep learning.

Figure 18.
The detection result of a clear remote sensing image of Los Angeles.

Figure 19.
The detection result of a fuzzy remote sensing image in Washington.

Figure 20.
Two detection sample results of Los Angeles.

Figure 21.
The detection result of Los Angeles.

Figure 22.
The detection result of Los Angeles.


Table 1.
Section traffic operation grade division table.
| Level | Clear | Basically Clear | Mild Congestion | Moderate Congestion | Severe Congestion |
|---|---|---|---|---|---|
| Fast road | V > 65 | 50 < V ≤ 65 | 35 < V ≤ 50 | 20 < V ≤ 35 | V ≤ 20 |
| Arterial road | V > 40 | 30 < V ≤ 40 | 20 < V ≤ 30 | 15 < V ≤ 20 | V ≤ 15 |
| Minor arterial road | V > 35 | 25 < V ≤ 35 | 15 < V ≤ 25 | 10 < V ≤ 15 | V ≤ 10 |
Note: V represents the average speed of a section. The unit is km/h.
© 2020 by the authors. Licensee MDPI, Basel, Switzerland. This article is an open access article distributed under the terms and conditions of the Creative Commons Attribution (CC BY) license (http://creativecommons.org/licenses/by/4.0/).
Share and Cite
MDPI and ACS Style
Xu, C.; Mao, Y. An Improved Traffic Congestion Monitoring System Based on Federated Learning. Information 2020, 11, 365. https://doi.org/10.3390/info11070365
AMA Style
Xu C, Mao Y. An Improved Traffic Congestion Monitoring System Based on Federated Learning. Information. 2020; 11(7):365. https://doi.org/10.3390/info11070365
Chicago/Turabian StyleXu, Chenming, and Yunlong Mao. 2020. "An Improved Traffic Congestion Monitoring System Based on Federated Learning" Information 11, no. 7: 365. https://doi.org/10.3390/info11070365
Note that from the first issue of 2016, this journal uses article numbers instead of page numbers. See further details here.