Ambulatory Electrocardiographic Monitoring and Ectopic Beat Detection in Conscious Mice

 , , , and
Abstract
:1. Introduction
2. Materials and Methods
2.1. Mice
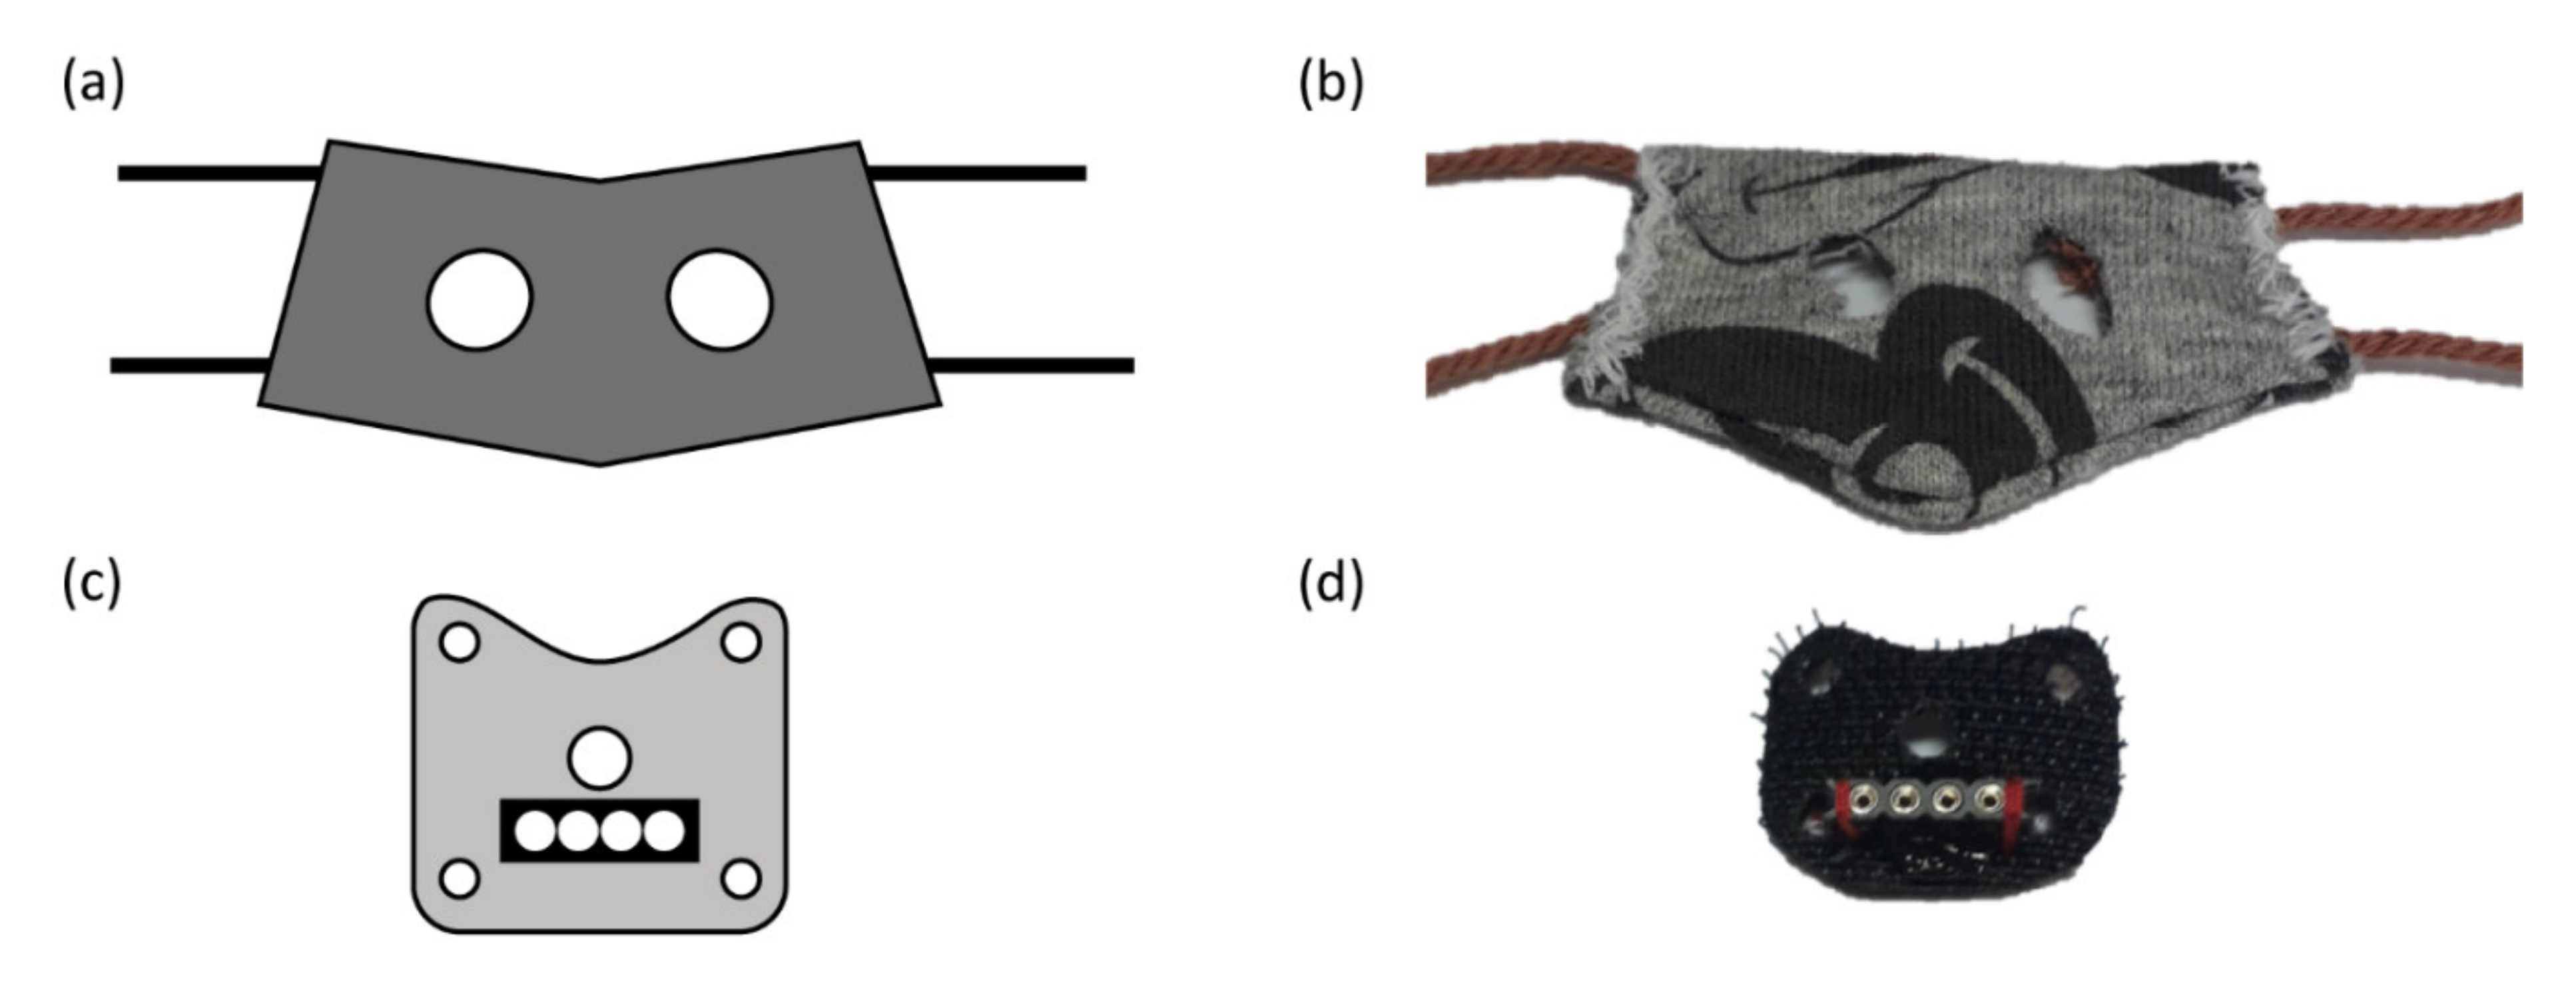
2.2. Surgery and Instrumentation
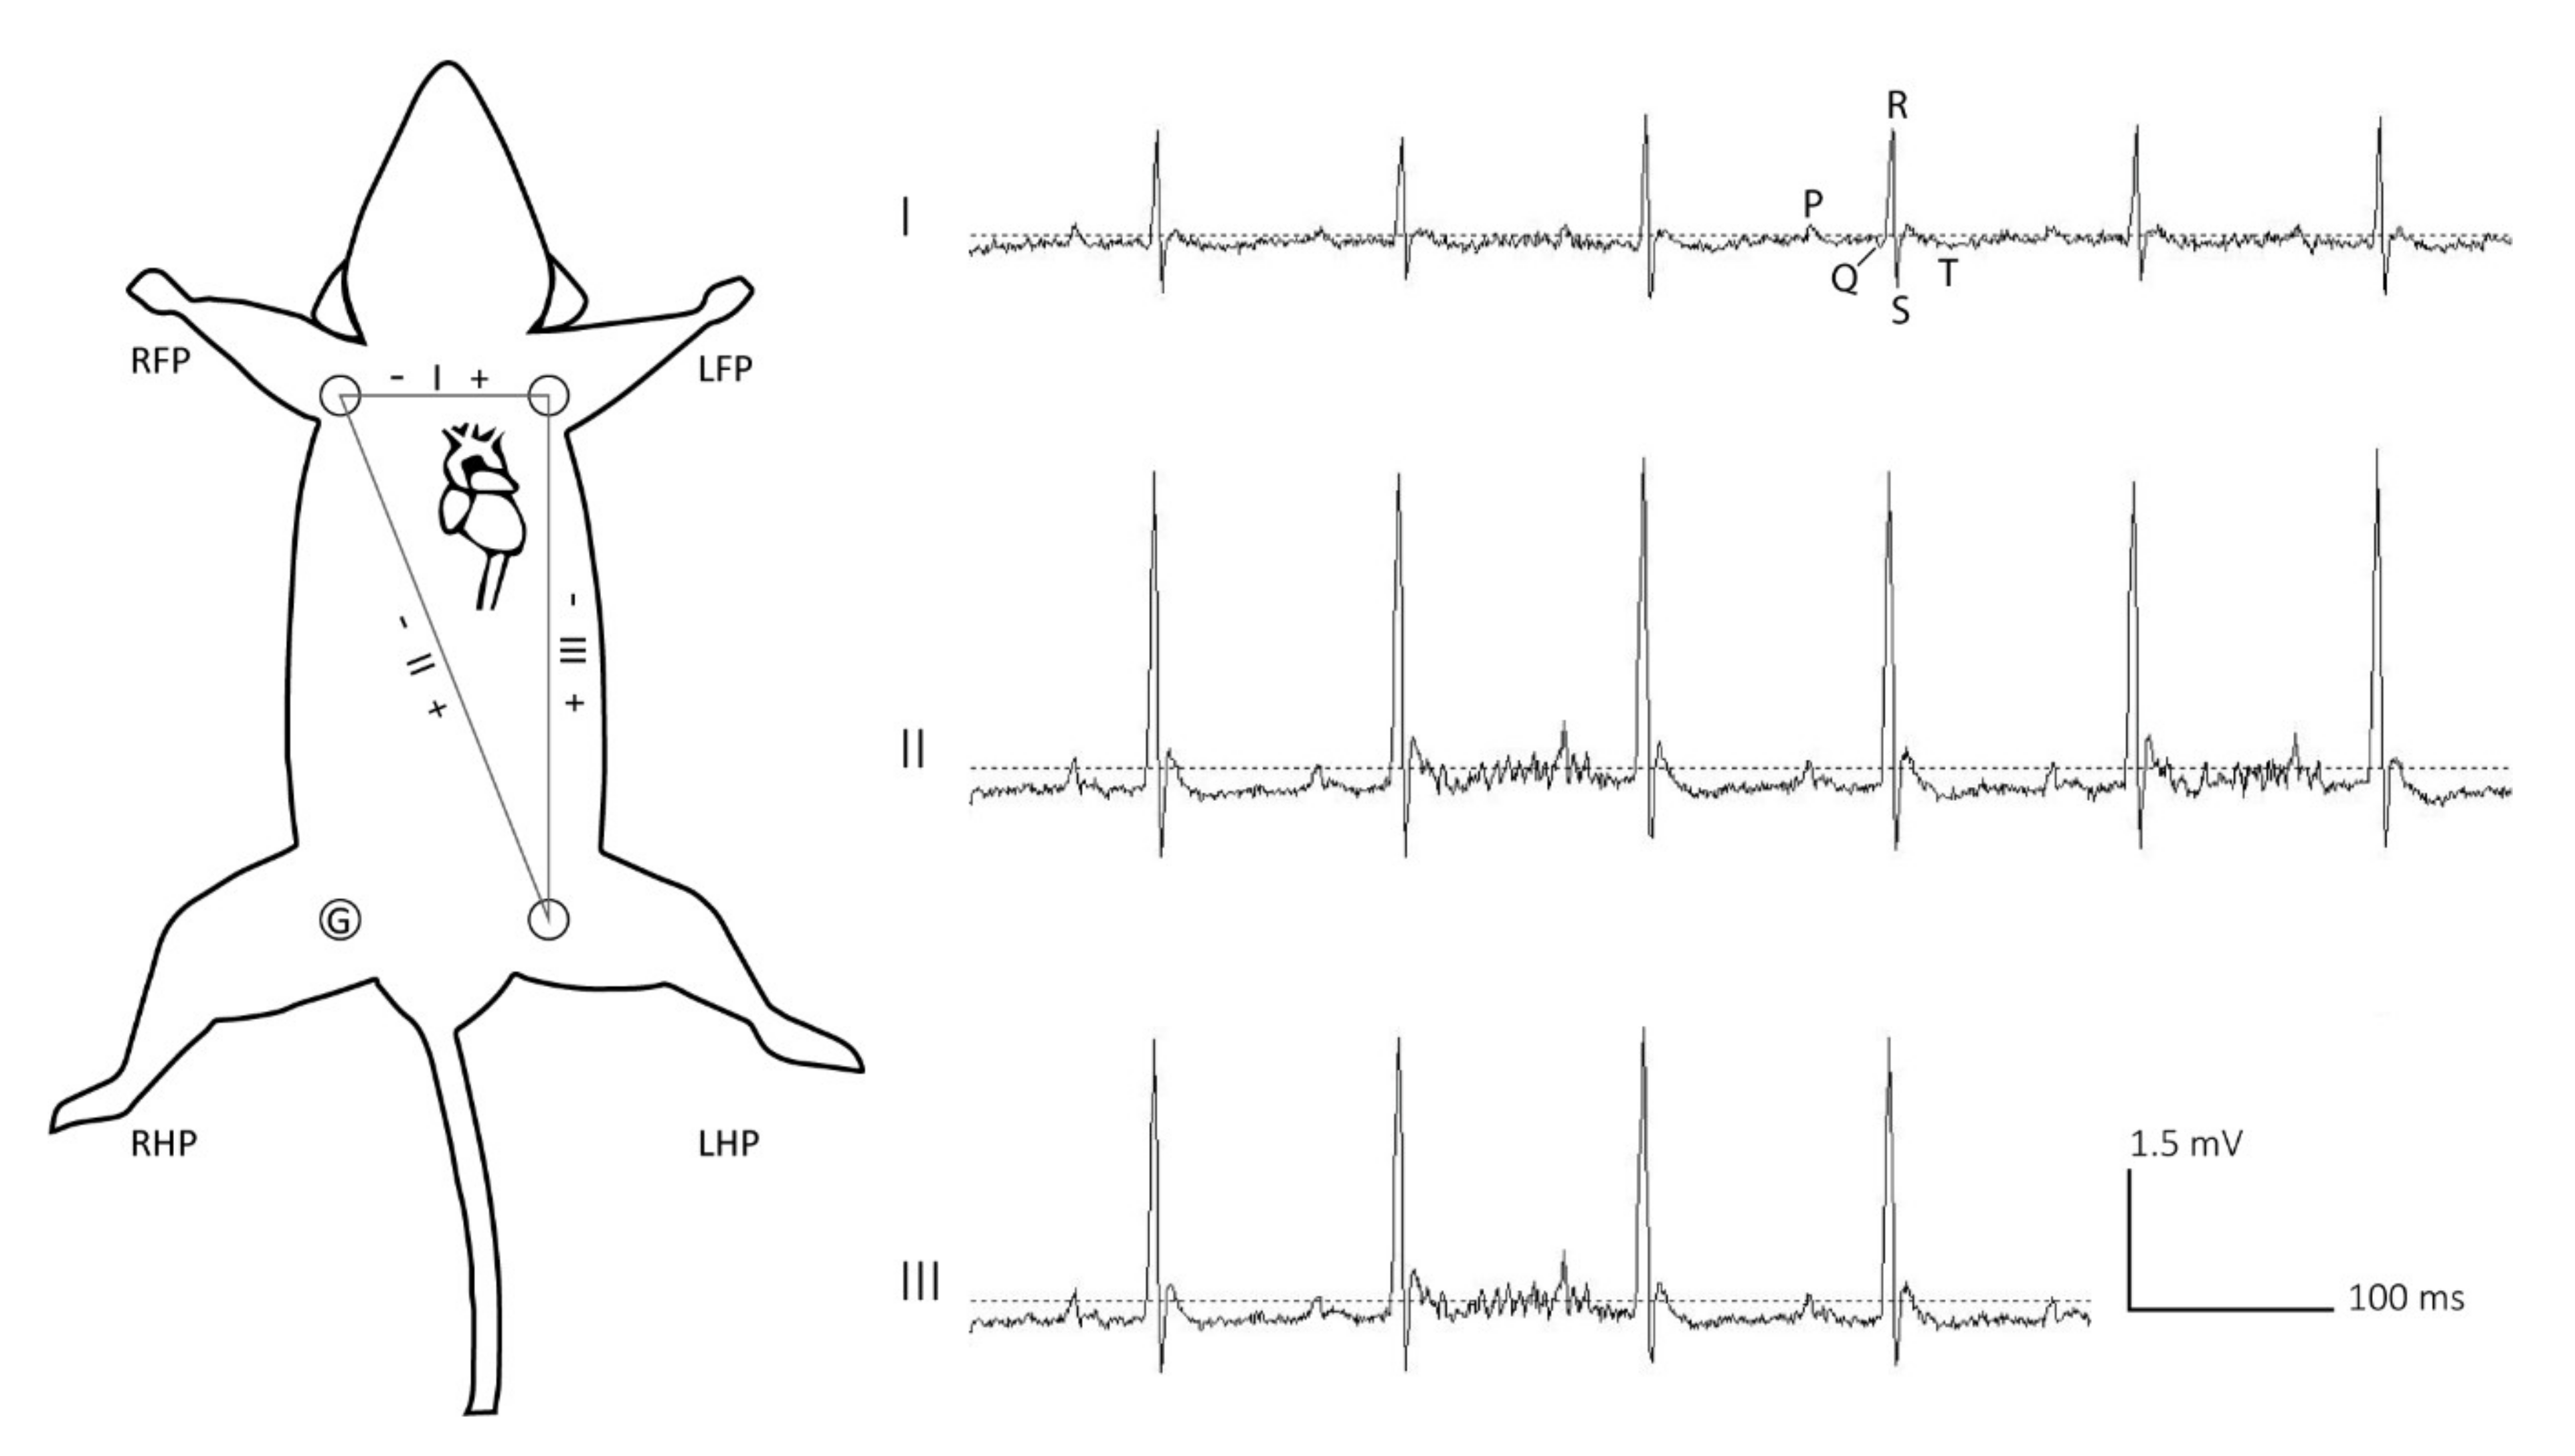
2.3. ECG Recording
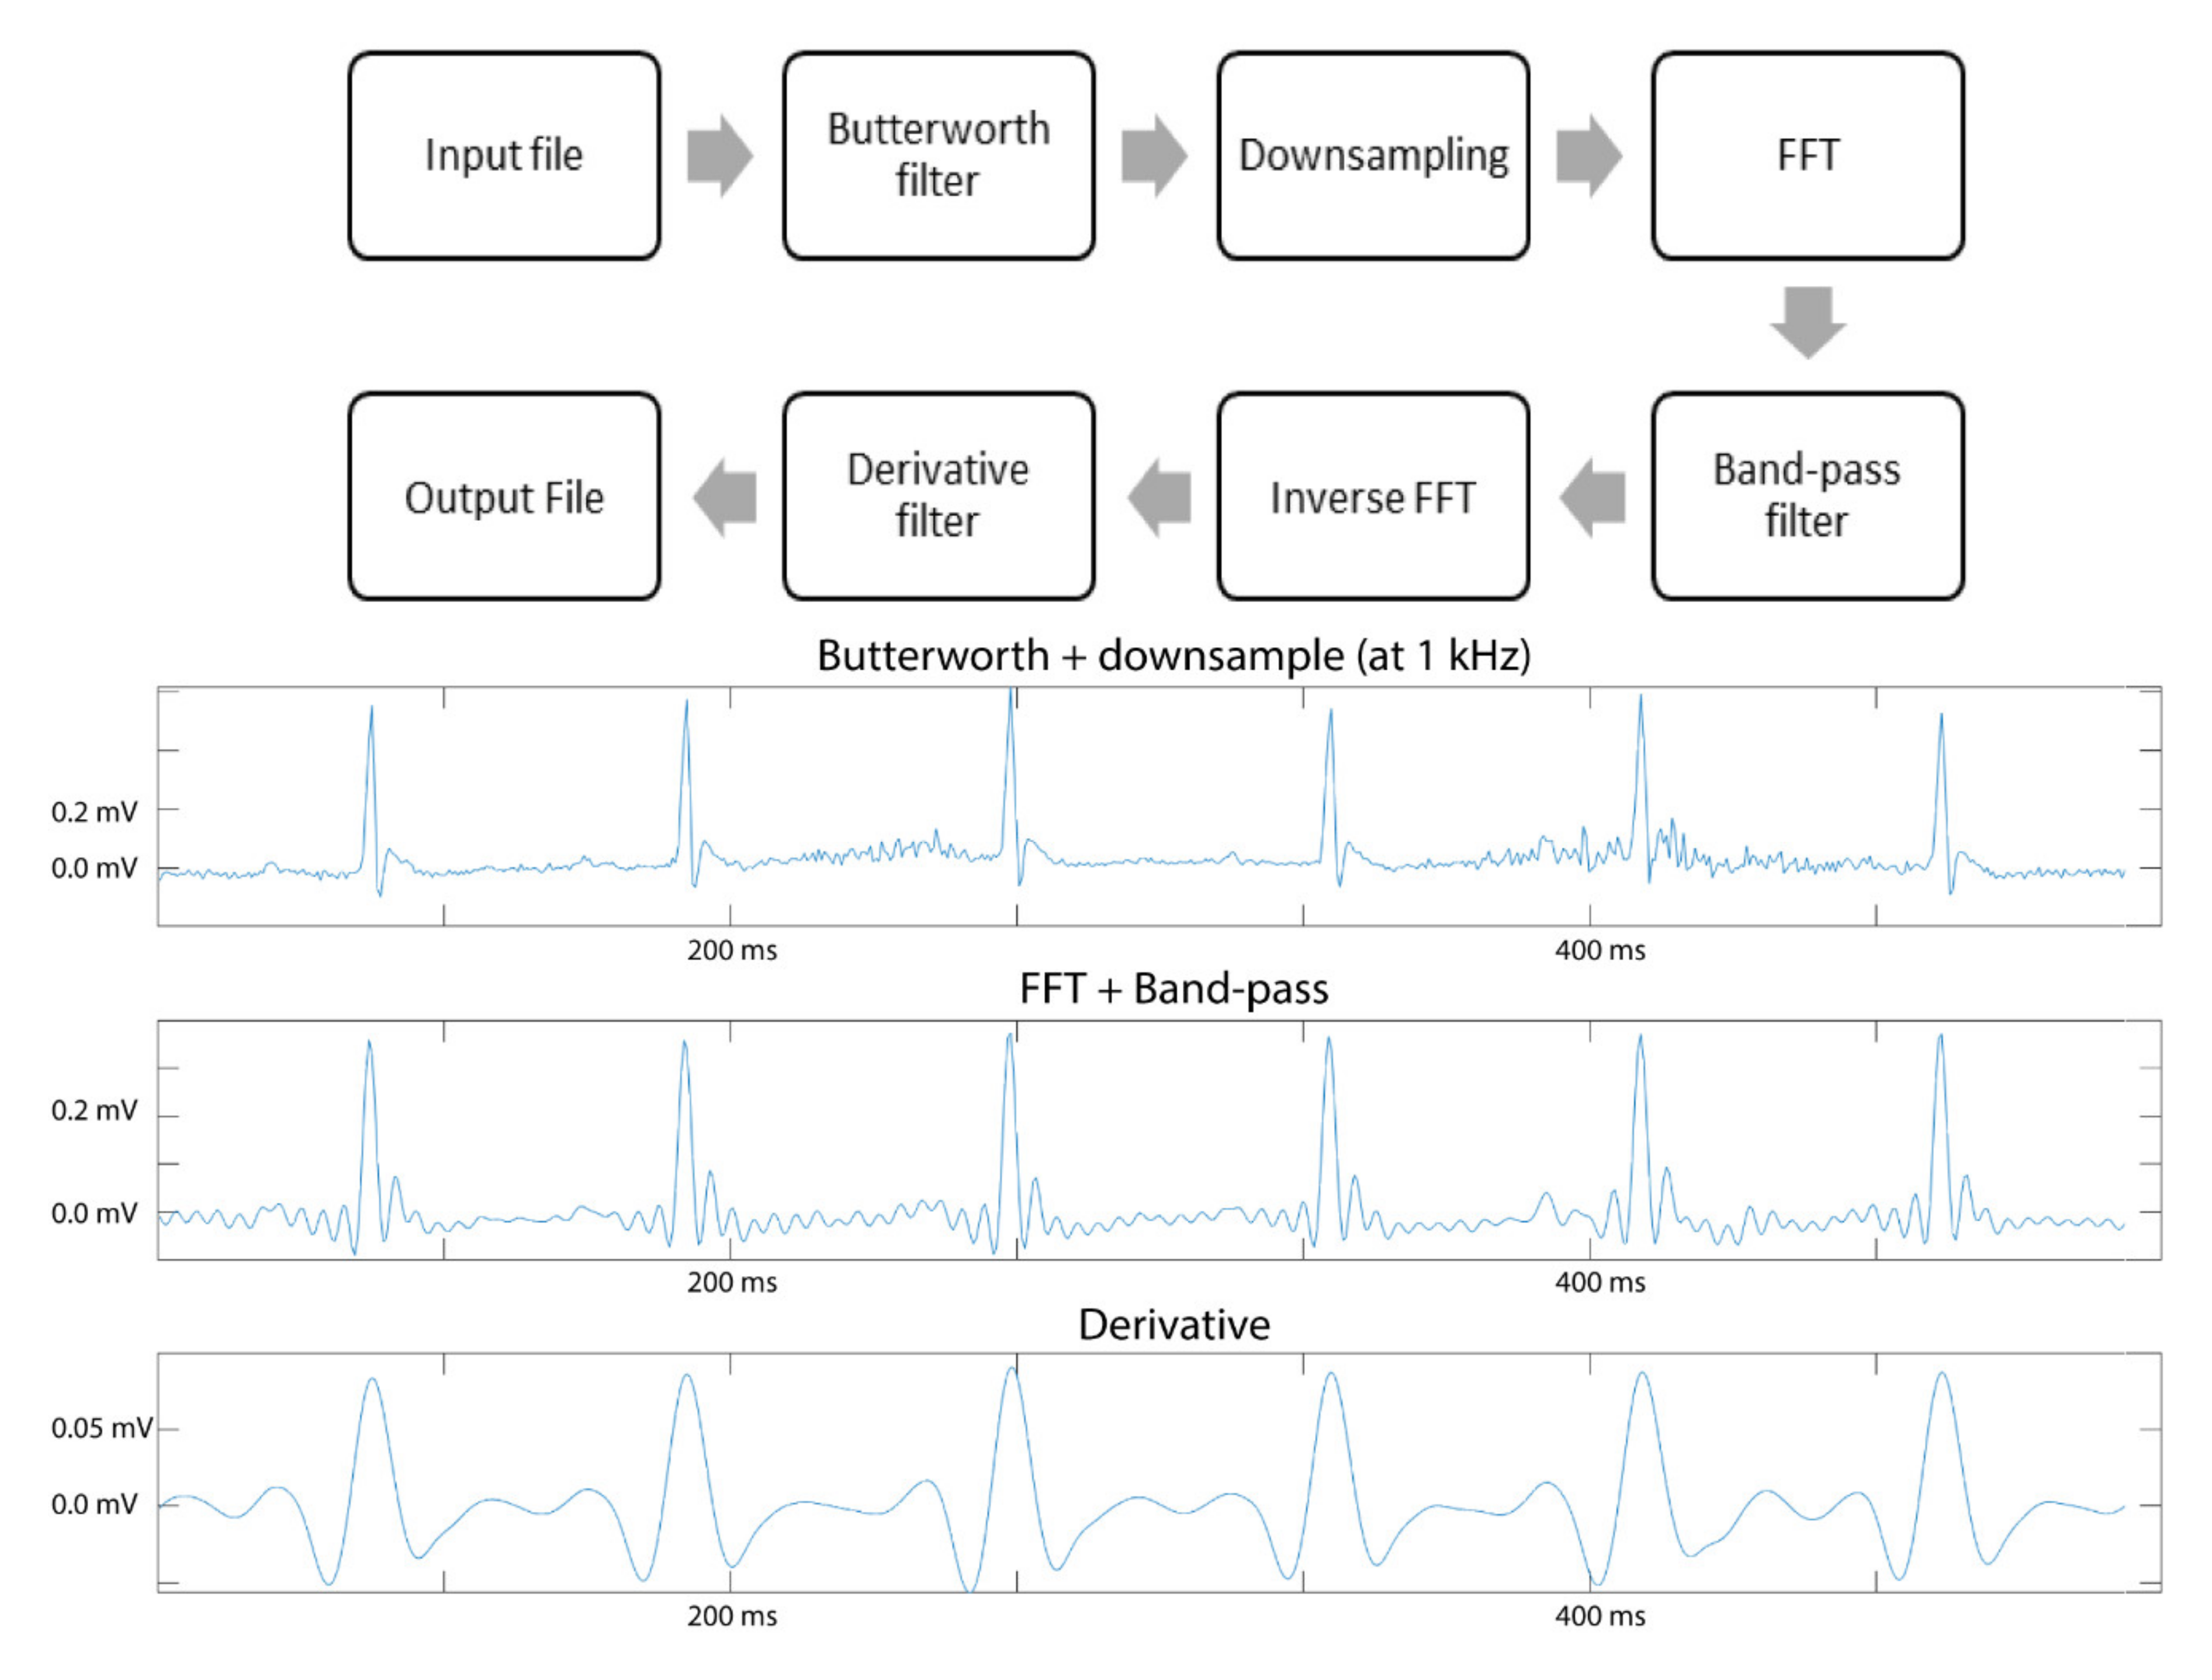
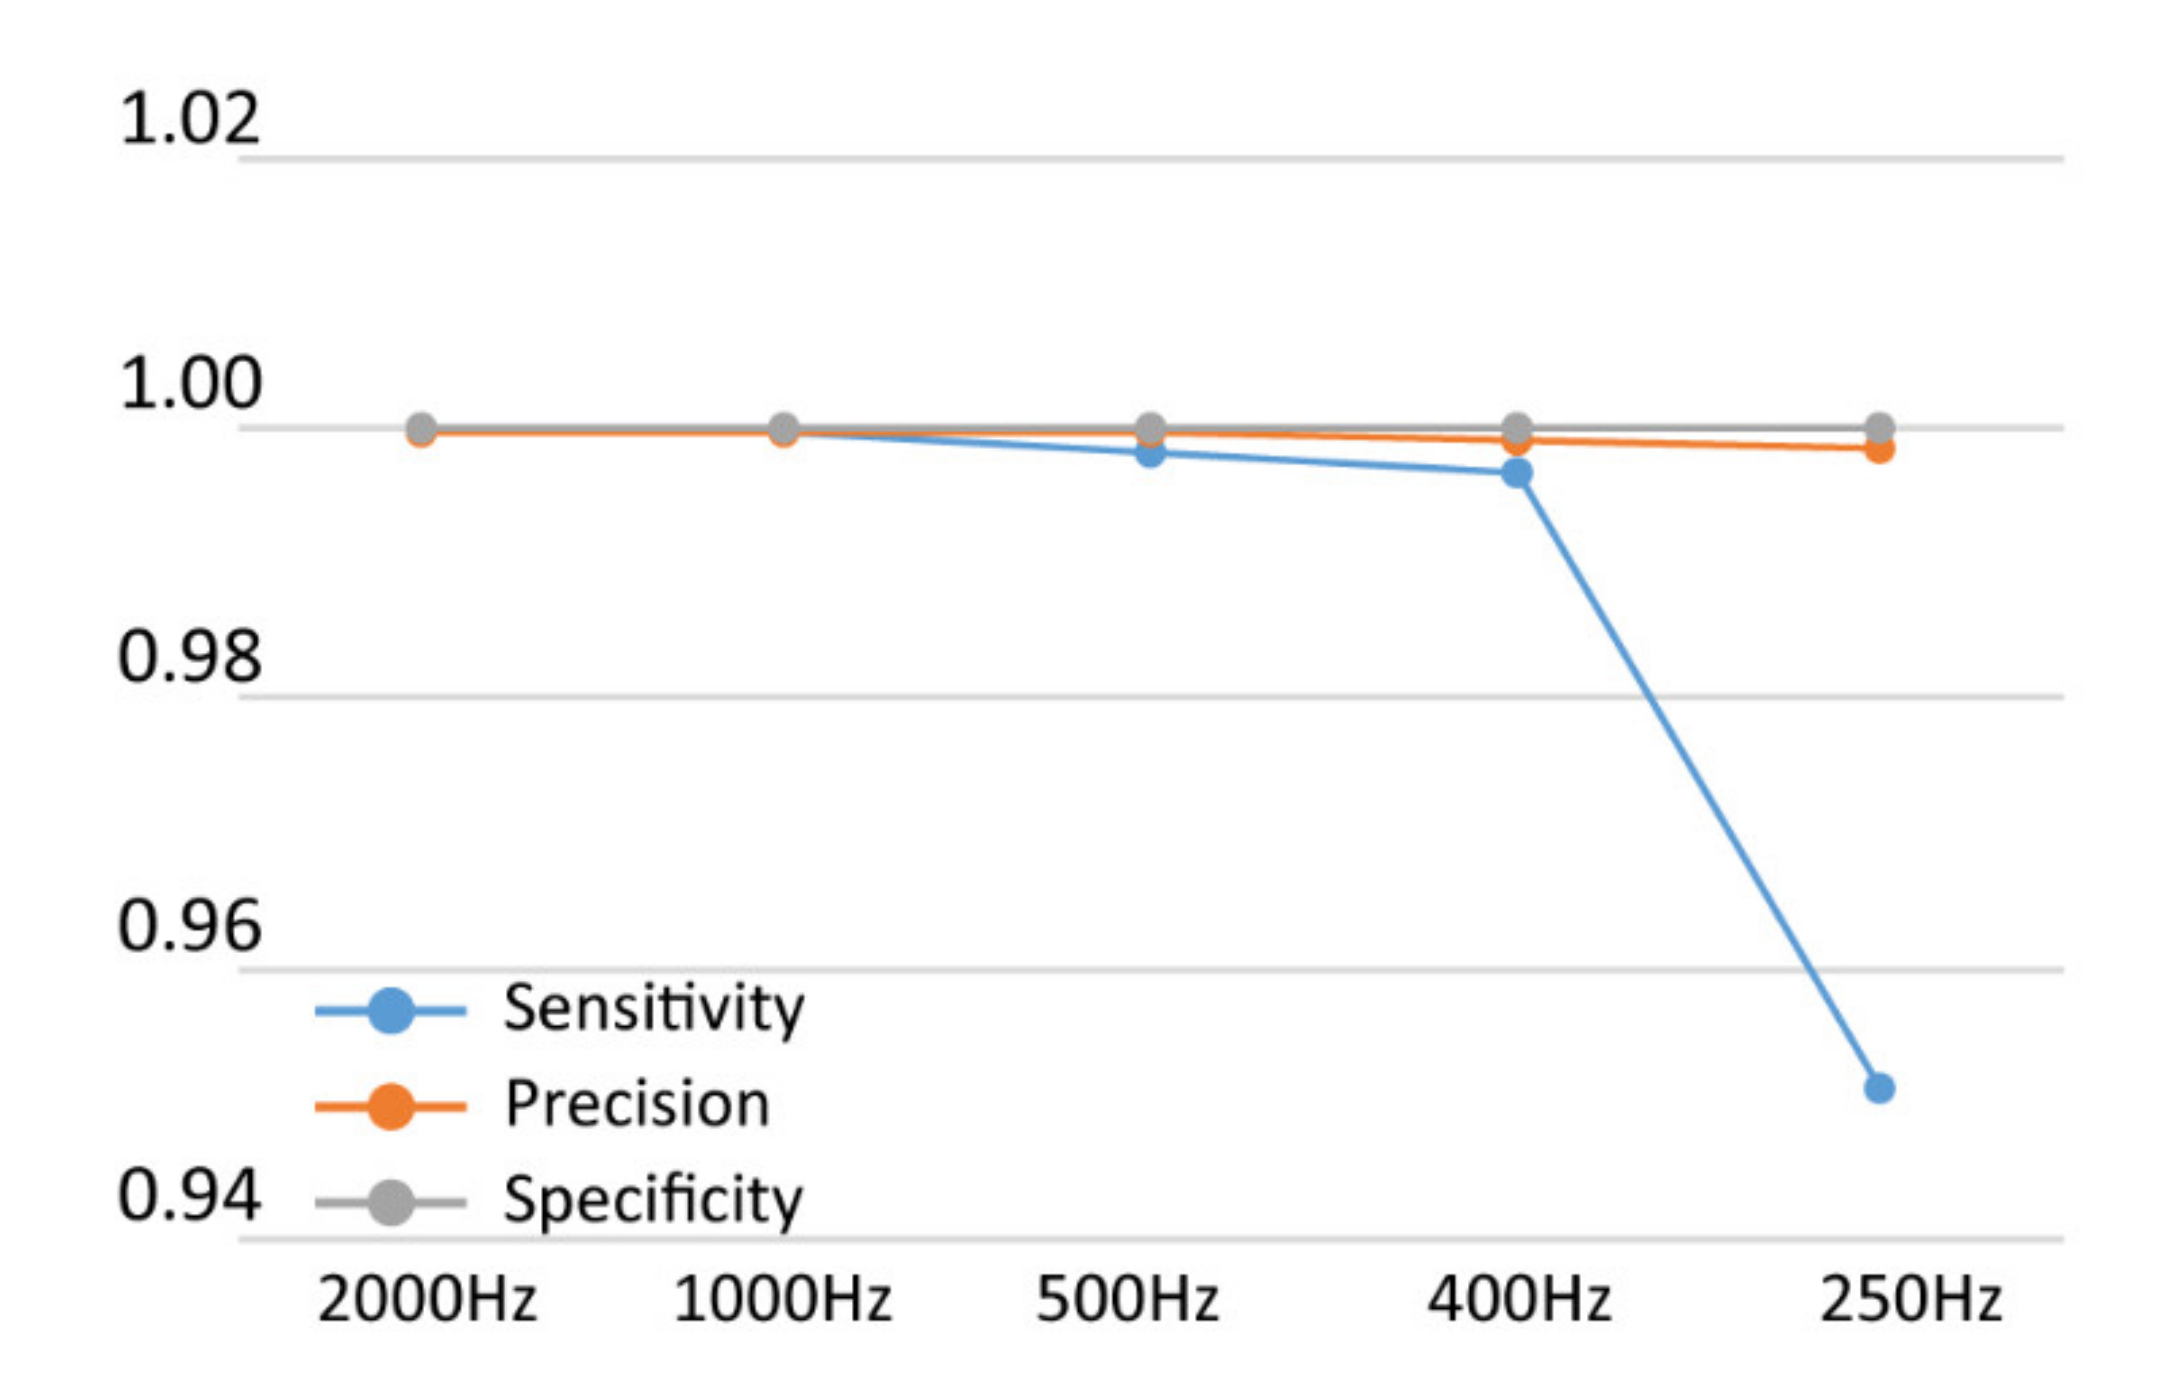
2.4. Pre-Processing ECG Trace
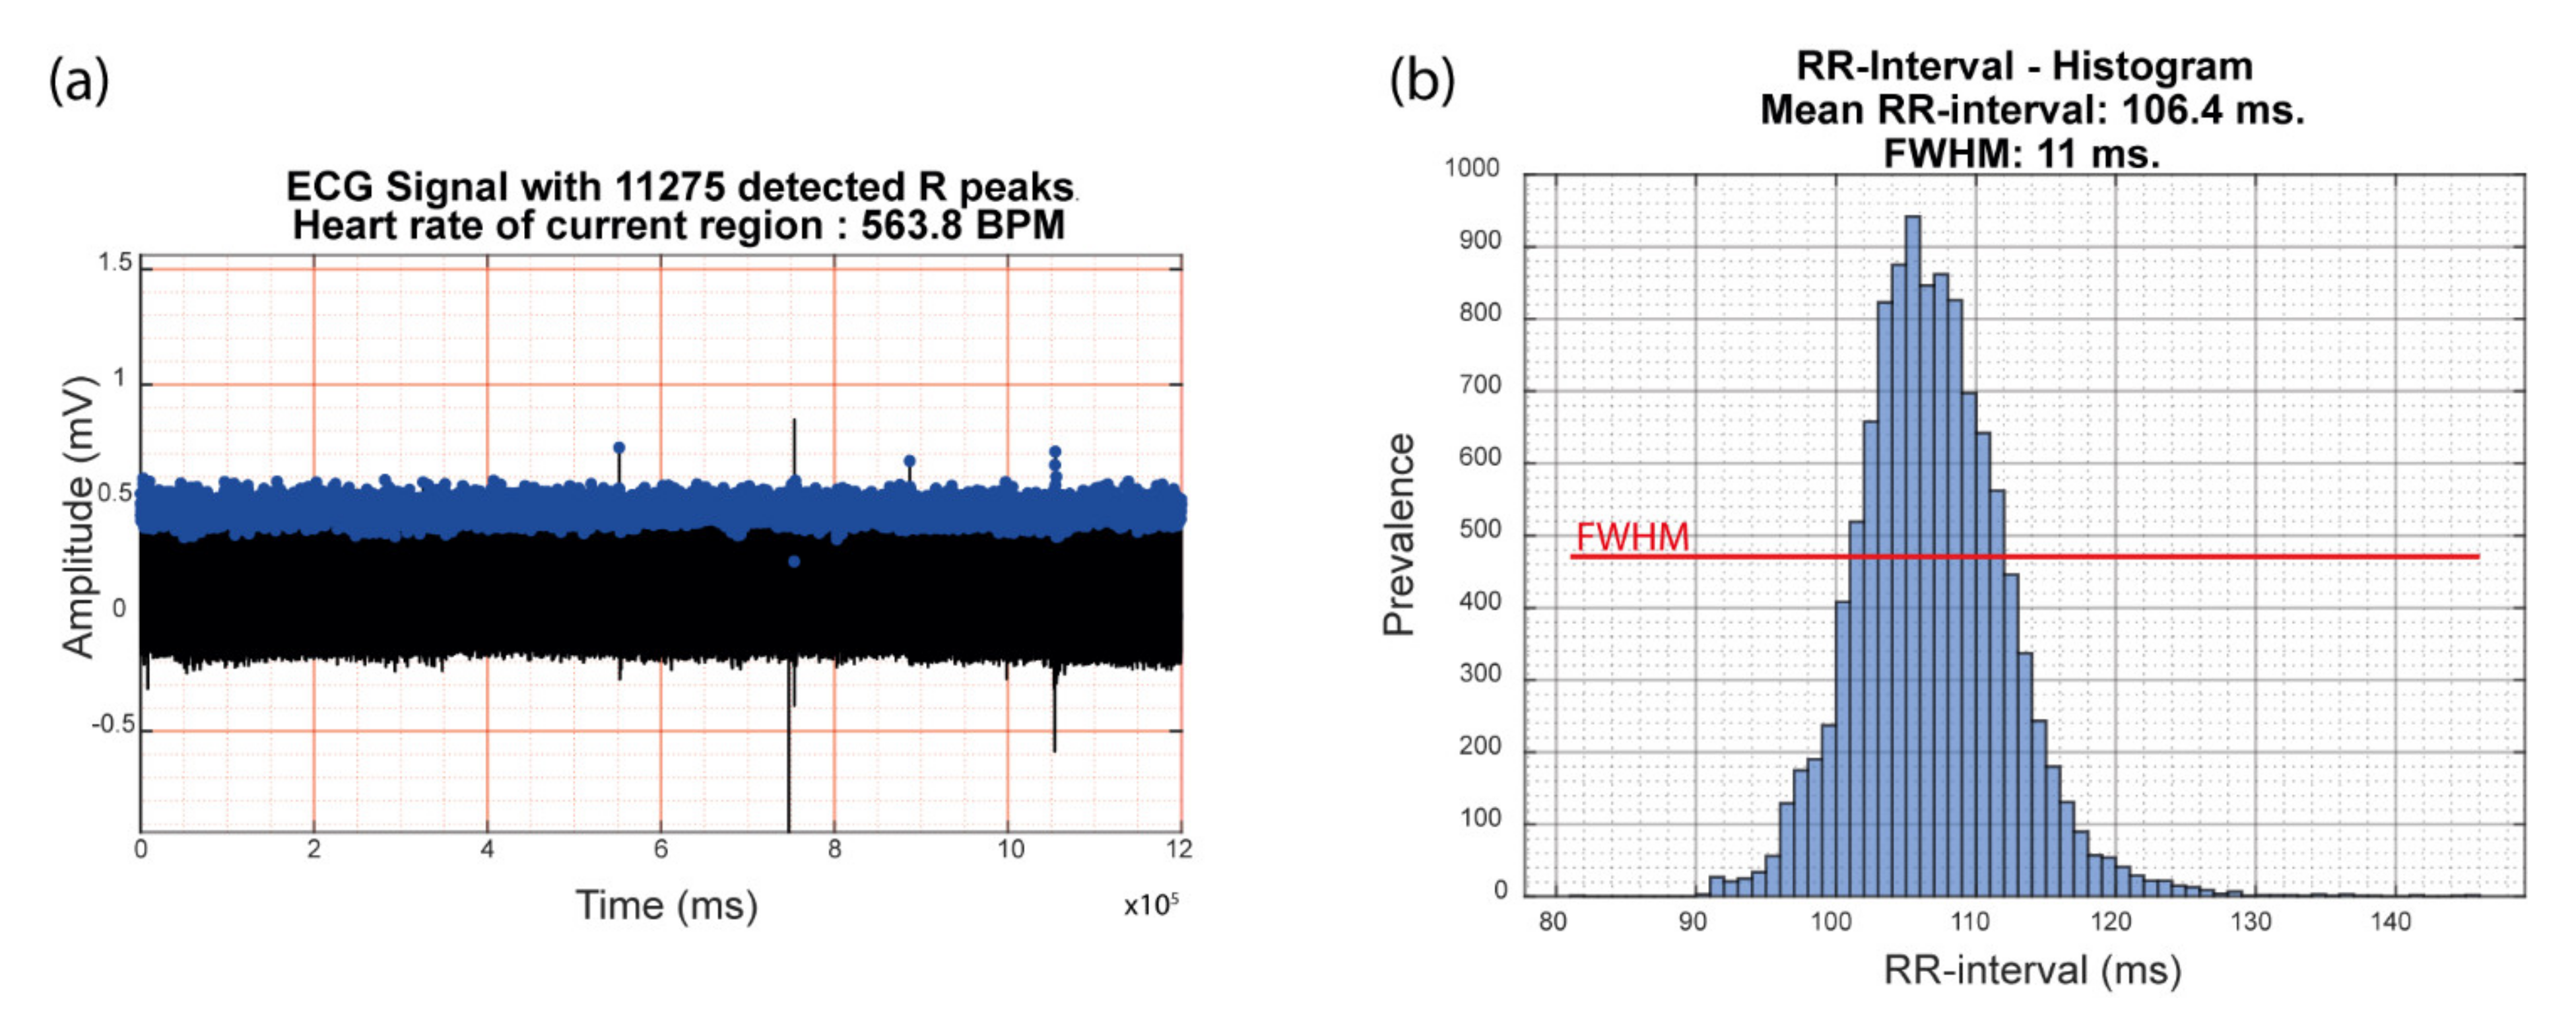
2.5. ECG Parameter Extraction
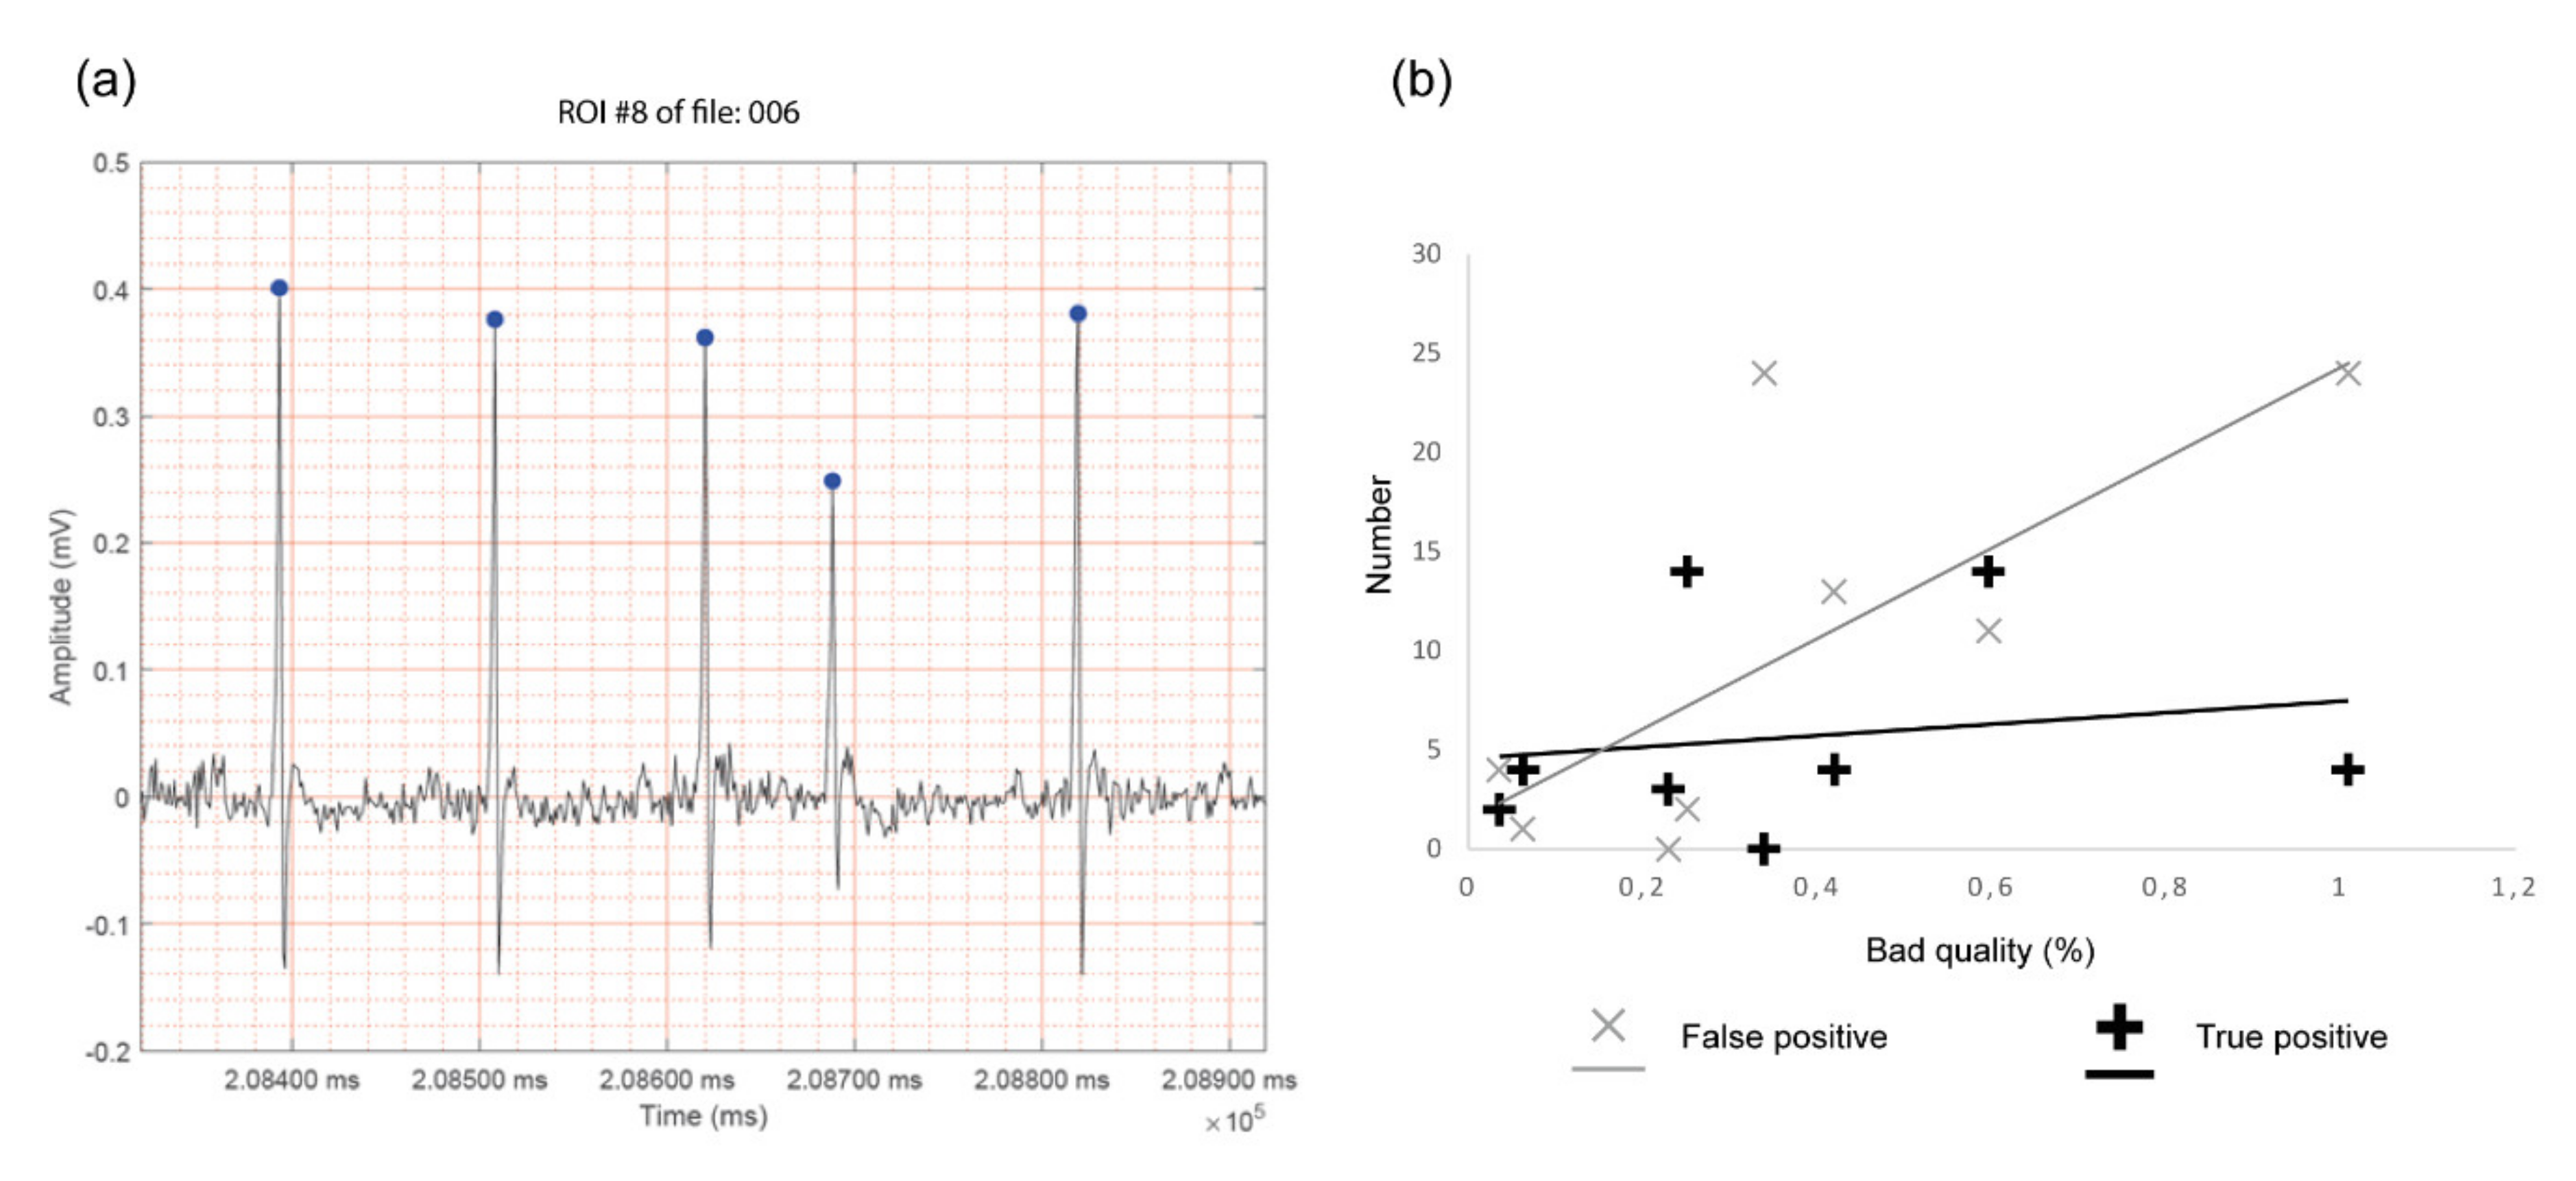
2.6. Ectopic Beat Detection
2.7. Statistics
3. Results
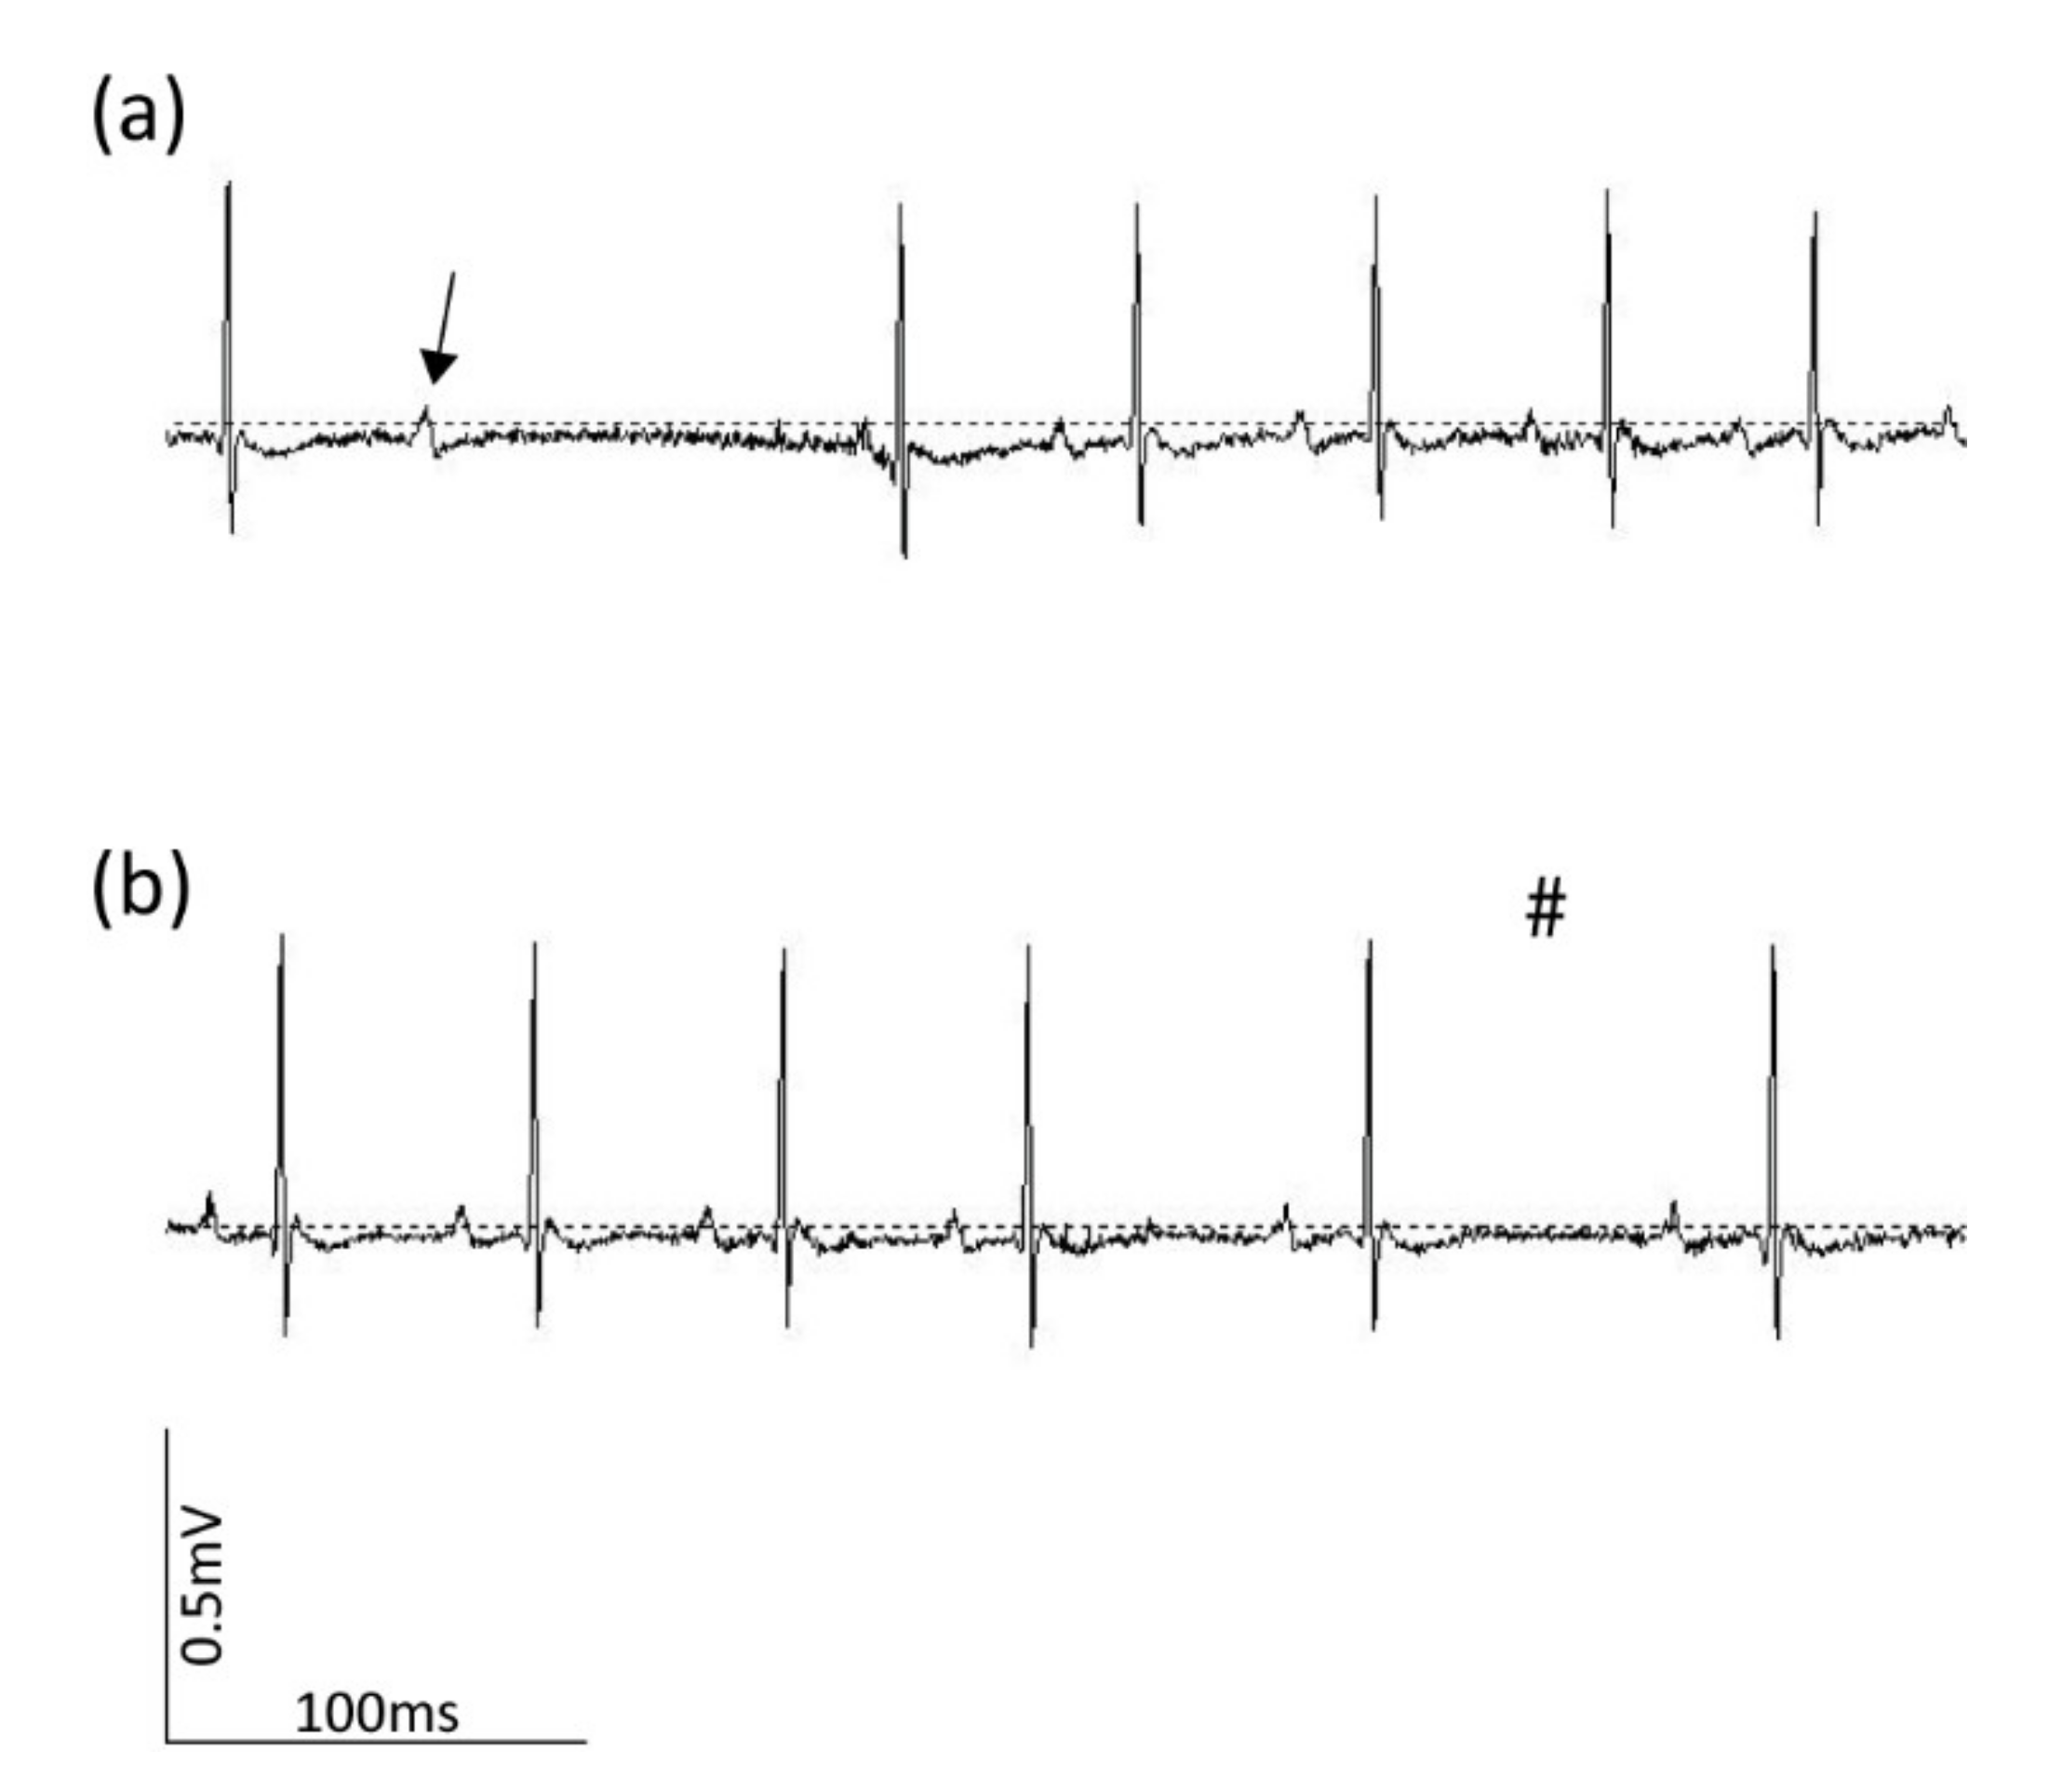
3.1. ECG Recording
3.2. ECG Parameter Extraction
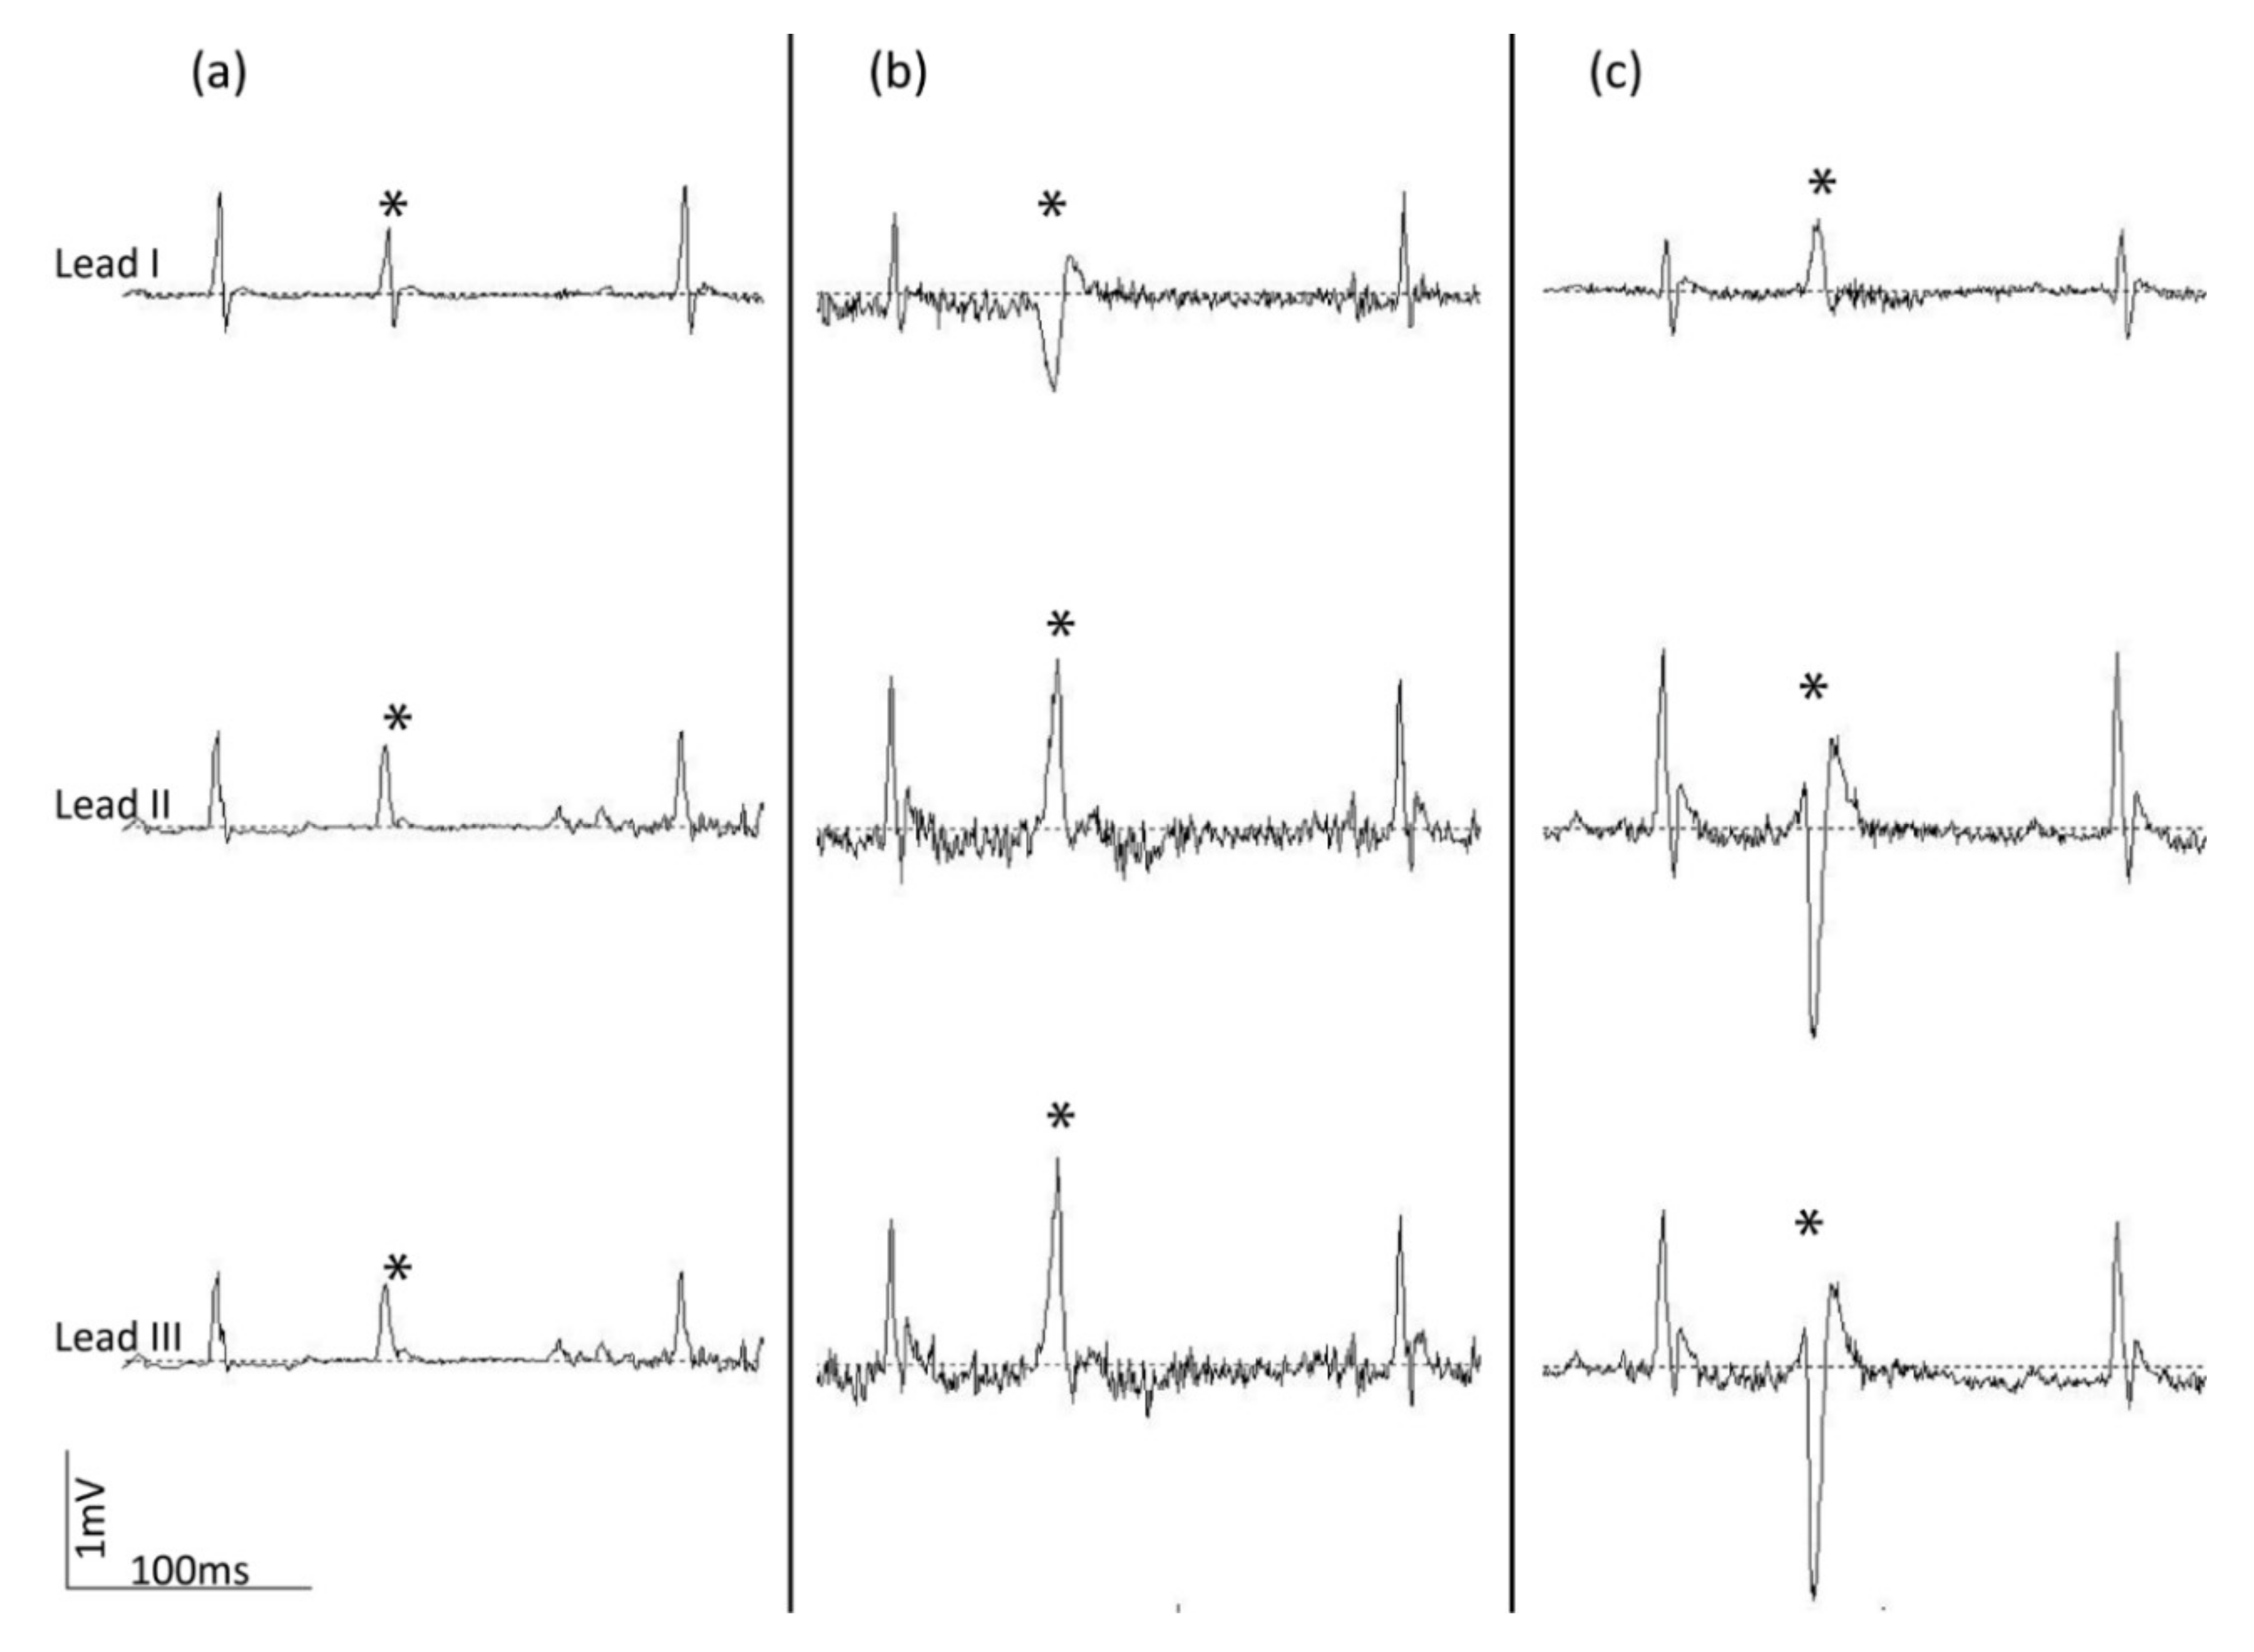
3.3. Ectopic Beat Detection
4. Discussion
5. Conclusions
6. Limitations
Author Contributions
Funding
Conflicts of Interest
References
- Townsend, N.; Wilson, L.; Bhatnagar, P.; Wickramasinghe, K.; Rayner, M.; Nichols, M. Cardiovascular disease in Europe: Epidemiological update 2016 (vol 37, pg 3232, 2017). Eur. Heart J. 2019, 40, 189. [Google Scholar] [CrossRef]
- Roth, G.A.; Abate, D.; Abate, K.H.; Abay, S.M.; Abbafati, C.; Abbasi, N.; Abbastabar, H.; Abd-Allah, F.; Abdela, J.; Abdelalim, A.; et al. Global, regional, and national age-sex-specific mortality for 282 causes of death in 195 countries and territories, 1980–2017: A Systematic Analysis for the Global Burden of Disease Study 2017. Lancet 2018, 392, 1736–1788. [Google Scholar] [CrossRef] [Green Version]
- Becker, D.E. Fundamentals of electrocardiography interpretation. Anesth. Prog. 2006, 53, 53–63. [Google Scholar] [CrossRef] [Green Version]
- Kligfield, P.; Gettes, L.S.; Bailey, J.J.; Childers, R.; Deal, B.J.; Hancock, E.W.; van Herpen, G.; Kors, J.A.; Macfarlane, P.; Mirvis, D.M.; et al. Recommendations for the standardization and interpretation of the electrocardiogram: Part I: The electrocardiogram and its technology a scientific statement from the American Heart Association Electrocardiography and Arrhythmias Committee, Council on Clinical Cardiology; the American College of Cardiology Foundation; and the Heart Rhythm Society endorsed by the International Society for Computerized Electrocardiology. J. Am. Coll. Cardiol. 2007, 49, 1109–1127. [Google Scholar] [CrossRef] [PubMed] [Green Version]
- Turakhia, M.P. 2017 ISHNE-HRS expert consensus statement on ambulatory ECG and external cardiac monitoring/telemetry. Heart Rhythm 2018, 15, 1276. [Google Scholar]
- Kusumoto, F.M.; Bailey, K.R.; Chaouki, A.S.; Deshmukh, A.J.; Gautam, S.; Kim, R.J.; Kramer, D.B.; Lambrakos, L.K.; Nasser, N.H.; Sorajja, D. Systematic Review for the 2017 AHA/ACC/HRS Guideline for Management of Patients With Ventricular Arrhythmias and the Prevention of Sudden Cardiac Death: A Report of the American College of Cardiology/American Heart Association Task Force on Clinical Practice Guidelines and the Heart Rhythm Society. J. Am. Coll. Cardiol. 2018, 72, 1653–1676. [Google Scholar] [CrossRef]
- Brignole, M.; Moya, A.; de Lange, F.J.; Deharo, J.C.; Elliott, P.M.; Fanciulli, A.; Fedorowski, A.; Furlan, R.; Kenny, R.A.; Martin, A.; et al. 2018 ESC Guidelines for the diagnosis and management of syncope. Eur. Heart J. 2018, 39, 1883–1948. [Google Scholar] [CrossRef]
- Meyer, M.L.; Soliman, E.Z.; Wruck, L.M.; Mosley, T.H.; Wagenknecht, L.E.; Poon, A.K.; Whitsel, E.A.; Alonso, A.; Heiss, G.; Loehr, L.R. Repeatability of ectopic beats from 48-hr ambulatory electrocardiography: The Atherosclerosis Risk in Communities (ARIC) Study. Ann. Noninvasive Electrocardiol. 2017, 22. [Google Scholar] [CrossRef]
- Wehrens, X.H.T.; Kirchhoff, S.; Doevendans, P.A. Mouse electrocardiography: An interval of thirty years. Cardiovasc. Res. 2000, 45, 231–237. [Google Scholar] [CrossRef] [Green Version]
- Merentie, M.; Lipponen, J.A.; Hedman, M.; Hedman, A.; Hartikainen, J.; Huusko, J.; Lottonen-Raikaslehto, L.; Parviainen, V.; Laidinen, S.; Karjalainen, P.A.; et al. Mouse ECG findings in aging, with conduction system affecting drugs and in cardiac pathologies: Development and validation of ECG analysis algorithm in mice. Physiol. Rep. 2015, 3. [Google Scholar] [CrossRef] [Green Version]
- Nerbonne, J.M. Mouse models of arrhythmogenic cardiovascular disease: Challenges and opportunities. Curr. Opin. Pharm. 2014, 15, 107–114. [Google Scholar] [CrossRef] [PubMed] [Green Version]
- Boukens, B.J.; Rivaud, M.R.; Rentschler, S.; Coronel, R. Misinterpretation of the mouse ECG: Musing the waves of Mus musculus. J. Physiol. 2014, 592, 4613–4626. [Google Scholar] [CrossRef] [PubMed]
- Ho, D.; Zhao, X.; Gao, S.; Hong, C.; Vatner, D.E.; Vatner, S.F. Heart Rate and Electrocardiography Monitoring in Mice. Curr. Protoc. Mouse Biol. 2011, 1, 123–139. [Google Scholar] [PubMed] [Green Version]
- Farmer, J.B.; Levy, G.P. A simple method for recording the electrocardiogram and heart rate from conscious animals. Br. J. Pharm. Chemother. 1968, 32, 193–200. [Google Scholar] [CrossRef] [PubMed] [Green Version]
- Lujan, H.L.; Janbaih, H.; Feng, H.Z.; Jin, J.P.; DiCarlo, S.E. Myocardial ischemia, reperfusion, and infarction in chronically instrumented, intact, conscious, and unrestrained mice. Am. J. Physiol. Regul. Integr. Comp. Physiol. 2012, 302, R1384–R1400. [Google Scholar] [CrossRef] [PubMed] [Green Version]
- Kramer, K.; Vanacker, S.; Voss, H.P.; Grimbergen, J.A.; Vandervijgh, W.J.F.; Bast, A. Use of telemetry to record electrocardiogram and heart-rate in freely moving mice. J. Pharmacol. Toxicol. Methods 1993, 30, 209–215. [Google Scholar] [CrossRef]
- Serhani, M.A.; El Kassabi, H.T.; Ismail, H.; Navaz, A.N. ECG Monitoring Systems: Review, Architecture, Processes, and Key Challenges. Sensors 2020, 20, 1796. [Google Scholar] [CrossRef] [Green Version]
- Sanjit, K.M. Digital Signal Processing: A Computer-Based Approach; McGraw-Hill: New York, NY, USA, 2001. [Google Scholar]
- Wu, V.; Barbash, I.M.; Ratnayaka, K.; Saikus, C.E.; Sonmez, M.; Kocaturk, O.; Lederman, R.J.; Faranesh, A.Z. Adaptive Noise Cancellation to Suppress Electrocardiography Artifacts During Real-Time Interventional MRI. J. Magn. Reson. Imaging 2011, 33, 1184–1193. [Google Scholar] [CrossRef] [Green Version]
- Thakor, N.V.; Zhu, Y.S. Applications of adaptive filtering to ECG analysis - Noise cancellation and arrhythmia detection. IEEE Trans.Biomed. Eng. 1991, 38, 785–794. [Google Scholar] [CrossRef]
- Mansier, P.; Clairambault, J.; Charlotte, N.; Medigue, C.; Vermeiren, C.; LePape, G.; Carre, F.; Gounaropoulou, A.; Swynghedauw, B. Linear and non-linear analyses of heart rate variability: A minireview. Cardiovasc. Res. 1996, 31, 371–379. [Google Scholar] [CrossRef]
- Malliani, A.; Pagani, M.; Lombardi, F.; Cerutti, S. Cardiovascular neural regulation explored in the frequency-domain. Circulation 1991, 84, 482–492. [Google Scholar] [CrossRef] [PubMed] [Green Version]
- Akselrod, S.; Gordon, D.; Ubel, F.A.; Shannon, D.C.; Barger, A.C.; Cohen, R.J. Power spectrum analysis of the heart-rate fluctuation—A quantitative probe of beat-to-beat cardiovascular control. Science 1981, 213, 220–222. [Google Scholar] [CrossRef] [PubMed]
- Oppenheim, A.V.; Schafer, R.W. Discrete-Time Signal Processing; Prentice Hall: Upper Saddle River, NJ, USA, 1999. [Google Scholar]
- Ang, W.T.; Krichane, M.; Sim, T. Zero phase filtering for active compensation of periodic physiological motion. In Proceedings of the 1st IEEE RAS-EMBS International Conference on Biomedical Robotics and Biomechatronics (BioRob 2006), Pisa, Italy, 20–22 February 2006. [Google Scholar]
- Behar, J.A.; Rosenberg, A.A.; Weiser-Bitoun, I.; Shemla, O.; Alexandrovich, A.; Konyukhov, E.; Yaniv, Y. PhysioZoo: A Novel Open Access Platform for Heart Rate Variability Analysis of Mammalian Electrocardiographic Data. Front. Physiol. 2018, 9, 1390. [Google Scholar] [CrossRef] [PubMed] [Green Version]
- Nabil, D.; Reguig, F.B. Ectopic beats detection and correction methods: A review. Biomed. Signal Process. Control 2015, 18, 228–244. [Google Scholar] [CrossRef]
- Nguyen, K.T.; Vittinghoff, E.; Dewland, T.A.; Dukes, J.W.; Soliman, E.Z.; Stein, P.K.; Gottdiener, J.S.; Alonso, A.; Chen, L.Y.; Psaty, B.M.; et al. Ectopy on a Single 12-Lead ECG, Incident Cardiac Myopathy, and Death in the Community. J. Am. Heart Assoc. 2017, 6, e006028. [Google Scholar] [CrossRef]
- Gunda, S.; Akyeampong, D.; Gomez-Arroyo, J.; Jovin, D.G.; Kowlgi, N.G.; Kaszala, K.; Tan, A.Y.; Koneru, J.N.; Kron, J.; Ellenbogen, K.A.; et al. Consequences of chronic frequent premature atrial contractions: Association with cardiac arrhythmias and cardiac structural changes. J. Cardiovasc. Electrophysiol. 2019, 30, 1952–1959. [Google Scholar] [CrossRef]
- Bikkina, M.; Larson, M.G.; Levy, D. Prognostic implications of asymptomatic ventricular arrhythmias—The Framingham heart-study. Ann. Inter. Med. 1992, 117, 990–996. [Google Scholar] [CrossRef]
- Abdalla, I.S.H.; Prineas, R.J.; Neaton, J.D.; Jacobs, D.R.; Crow, R.S. Relation between ventricular premature complexes and sudden cardiac death in apparently healthy men. Am. J. Cardiol. 1987, 60, 1036–1042. [Google Scholar] [CrossRef]


| Human AECG | Mouse ECG | ||||
|---|---|---|---|---|---|
| Needle Electrodes | Platform ECG System | Tethered ECG System | Telemetry | ||
| Conscious study subject | + | − | + | + | + |
| Long-term analysis | + | − | − | + | + |
| Unrestrained | + | − | − | +/− | + |
| Spatial resolution ectopic beat | + | + | + | + | − |
| File | TP | TN | FP | FN | Sensitivity | Precision | Specificity | |
|---|---|---|---|---|---|---|---|---|
| CUSTOM ALGORITHMS | 001 | 11780 | 1188216 | 2 | 2 | 0.999830 | 0.999830 | 0.999998 |
| 002 | 12413 | 1187556 | 16 | 15 | 0.998793 | 0.998713 | 0.999987 | |
| 003 | 11274 | 1188723 | 1 | 2 | 0.999823 | 0.999911 | 0.999999 | |
| 004 | 11209 | 1188758 | 18 | 15 | 0.998664 | 0.998397 | 0.999985 | |
| 005 | 10524 | 1189468 | 4 | 4 | 0.999620 | 0.999620 | 0.999997 | |
| 006 | 11580 | 1188405 | 8 | 7 | 0.999396 | 0.999310 | 0.999993 | |
| 007 | 10794 | 1189197 | 2 | 7 | 0.999352 | 0.999815 | 0.999998 | |
| 008 | 11085 | 1188871 | 25 | 19 | 0.998289 | 0.997750 | 0.999979 | |
| 009 | 13366 | 1186524 | 56 | 54 | 0.995976 | 0.995828 | 0.999953 | |
| 010 | 13411 | 1186489 | 45 | 55 | 0.995916 | 0.996656 | 0.999962 | |
| Mean values | 0.998566 | 0.998583 | 0.999985 | |||||
| PhysioZoo | 001 | 11773 | 1188209 | 11 | 9 | 0.999236 | 0.999067 | 0.999991 |
| 002 | 12417 | 1188484 | 3 | 11 | 0.999115 | 0.999758 | 0.999997 | |
| 003 | 11270 | 1187595 | 6 | 6 | 0.999468 | 0.999468 | 0.999995 | |
| 004 | 11222 | 1188730 | 3 | 2 | 0.999822 | 0.999733 | 0.999997 | |
| 005 | 10521 | 1189491 | 9 | 7 | 0.999335 | 0.999145 | 0.999992 | |
| 006 | 11574 | 1188412 | 7 | 13 | 0.998878 | 0.999396 | 0.999994 | |
| 007 | 10785 | 1189199 | 11 | 16 | 0.998519 | 0.998981 | 0.999991 | |
| 008 | 11072 | 1188864 | 29 | 32 | 0.997118 | 0.997388 | 0.999976 | |
| 009 | 13348 | 1186497 | 73 | 72 | 0.994635 | 0.994561 | 0.999938 | |
| 010 | 13410 | 1186419 | 53 | 56 | 0.995841 | 0.996063 | 0.999955 | |
| Mean values | 0.998197 | 0.998356 | 0.999983 | |||||
| p-values | 0.144 | 0.408 | 0.360 | |||||
© 2020 by the authors. Licensee MDPI, Basel, Switzerland. This article is an open access article distributed under the terms and conditions of the Creative Commons Attribution (CC BY) license (http://creativecommons.org/licenses/by/4.0/).
Share and Cite
Steijns, F.; Tóth, M.I.; Demolder, A.; Larsen, L.E.; Desloovere, J.; Renard, M.; Raedt, R.; Segers, P.; De Backer, J.; Sips, P. Ambulatory Electrocardiographic Monitoring and Ectopic Beat Detection in Conscious Mice. Sensors 2020, 20, 3867. https://doi.org/10.3390/s20143867
Steijns F, Tóth MI, Demolder A, Larsen LE, Desloovere J, Renard M, Raedt R, Segers P, De Backer J, Sips P. Ambulatory Electrocardiographic Monitoring and Ectopic Beat Detection in Conscious Mice. Sensors. 2020; 20(14):3867. https://doi.org/10.3390/s20143867
Chicago/Turabian StyleSteijns, Felke, Máté I. Tóth, Anthony Demolder, Lars E. Larsen, Jana Desloovere, Marjolijn Renard, Robrecht Raedt, Patrick Segers, Julie De Backer, and Patrick Sips. 2020. "Ambulatory Electrocardiographic Monitoring and Ectopic Beat Detection in Conscious Mice" Sensors 20, no. 14: 3867. https://doi.org/10.3390/s20143867