
Abstract
Increasing temperatures and shifting precipitation regimes define the Mediterranean Basin (MB) as one of the world's most sensitive climate change hot spots. Among various ecological effects, disruptions in the growth-climate response of Mediterranean forest species have been recently observed. Complex topographical and climatological factors, however, may result in contrasting patterns of recent tree growth, with their biotic and abiotic drivers often remaining debatable. Here, we compile dendrochronological evidence from 878 cases at 645 sites reported in 66 peer-reviewed publications to assess modern (post-1970) growth trends across the MB (30°–46° N and 10° W–40° E). This collection mainly reveals positive trends in temperate environments across the northwestern part of the Basin, whereas negative trends were often found at xeric sites in the southwestern and eastern regions. Although these response patterns are indicative for both beneficial as well as detrimental effects of climate change on pan-Mediterranean forest ecosystem function and productivity, our review is slightly biased by selective sampling efforts that focused on higher elevations and older trees within a few countries in the northwest. This imbalance emphasizes the need for more evenly distributed study sites and age classes that better reflect ecological rather than political and methodological criteria.
Export citation and abstract BibTeX RIS

Content from this work may be used under the terms of the Creative Commons Attribution 3.0 licence. Any further distribution of this work must maintain attribution to the author(s) and the title of the work, journal citation and DOI.
Introduction
The Mediterranean Basin (MB) has been defined as a major climate change hot spot (Giorgi 2006) in which increasing temperatures and modifications in precipitation regimes may have diverse impacts on terrestrial ecosystems (Luterbacher et al 2006). In fact, shifts in plant and animal species distribution (Parmesan et al 1999, Meshinev et al 2000, Peñuelas and Boada 2003, Petriccione 2003, Sanz-Elorza et al 2003, Lenoir et al 2008), species disappearance (Otero et al 2011, Stefanescu et al 2011), altered insect phenophases (Peñuelas et al 2002), fungal productivity decreases (Büntgen et al 2012), and reduced river floods (Frihy et al 1996) have been reported. Moreover, forest ecosystems have experienced losses in productivity (Kotar 1996, Tomé et al 1996, Jump et al 2006a); drought-induced dieback (Martίnez-Vilalta and Piñol 2002, Camarero et al 2011); phenological changes such as time shifts in the starting point of the growing season (Menzel and Fabian 1999) or advances in the timing of leaf expansion and flowering (Peñuelas and Filella 2001); and rapid genetic changes (Jump et al 2006b). Biome alterations related to climate change have been recorded not only in terrestrial but also in marine ecosystems (Chisholm et al 1995, Nieder et al 2000).
Long-term changes in the often-complex relationships between forest growth and climate variation across the MB have been documented by dendrochronological approaches (Lebourgeois et al 2012 and appendix 1 that includes 75 peer-reviewed publications). The vast majority of these studies have assessed the most traditionally used dendrochronological tree-ring variables: width (TRW), basal area increment (BAI), maximum latewood density (MXD), and isotopic compositions of C and O in wood or cellulose (δ13C, δ18O). TRW and BAI reflect radial growth due to cambial activity, whereas MXD from high-elevation sites best captures variations in summer temperature (Büntgen et al 2007). Some advantages of MXD over TRW records include a stronger common signal between trees (Esper et al 2010), reduced trends with age and reduced biological persistence (i.e., autocorrelation) (Büntgen et al 2008). By contrast, δ13C and δ18O are mainly related to drought stress in seasonally dry climates such as the MB (Warren et al 2001, Andreu-Hayles et al 2011). Other commonly considered variables are net primary productivity (NPP), which is usually estimated from TRW series (Rathgeber et al 2000); height increment (HI; in Levanič et al 2008); intrinsic water use efficiency (i.e., carbon gain per unit of water lost) derived from δ13C (WUE; in Linares et al 2009a); and mean and maximum vessel area (MVA, MAX; in Campelo et al 2010). Trends in interannual mean sensitivity (msx, relative TRW changes across consecutive years) have also been registered (Tardif et al 2003 and Andreu et al 2007), as have shifts in growth-climate associations (Carrer 2011).
Since we were mainly interested in gaining knowledge about the spatial complexity of trends and patterns in recent forest growth across the MB, we herein focus on those tree-ring variables that can be directly translated to growth, i.e., TRW and BAI. We therefore reviewed 66 dendrochronological peer-reviewed works published between 1996 and 2013, which report 878 positive, neutral or negative growth trends since 1970. We discuss the observed geographical patterns in all these trends in light of possible drivers of tree growth ranging from local to regional scales. The importance of denser tree-ring networks that follow ecological criteria is also stressed, and the general issue of free data access is highlighted.
Data and methods
Following a meta-knowledge approach (i.e., harvesting knowledge about knowledge; see Evans and Foster 2011), we compiled dendrochronological evidence of growth trends since 1970 from 66 peer-reviewed publications (appendix 1; publications dealing with variables other than TRW and BAI are also included in the appendixes and the supplementary material). The bibliographic search was performed using Internet search tools such as Web of Science, Scopus and Google Scholar. Using key terms such as 'Mediterranean' and 'tree-ring' and key prefixes such as 'dendro-', the search was limited to MB dendrochronological studies. In most of the papers (52), the title made direct reference to the Mediterranean location of the sampling site(s). To avoid double counting, meta-analyses of previously published data were generally dismissed, or the corresponding previous study was excluded. Apart from these TRW- or BAI-related publications, we also registered papers addressing dendrochronological variables not directly translated into tree growth or productivity in recent decades across the MB, like MXD and δ13C or δ18O (table S1). In total, 1076 cases in 75 publications were gathered; two of them were not yet published but had been submitted to a journal. The publications were obtained from 36 journals (appendix S2). The Mediterranean region is defined here as the area between 30° and 46° N and 10° W and 40° E. It comprises a wide variety of climatic types from dry North African regions to humid forests on the northern MB shore and areas bordering the Atlantic Ocean in the west to the Black Sea in the east. There is an altitudinal gradient ranging from −3 to 2600 m asl.
The 66 reviewed publications dealing with TRW or BAI included 645 locations in which 878 individual growth trends were reported. The number of trends is greater than the number of locations because multiple variables were studied in some locations. Regarding TRW, 48 peer-reviewed publications with 528 locations and 688 trends were registered; for BAI, there were 15 publications with more than 195 locations and 223 trends. When a publication referenced multiple sites, each site was treated independently. In publications comparing managed/natural (Martín-Benito et al 2010), experimental/control (e.g., Tognetti et al 2000) or infested/non-infested tree populations (Camarero et al 2003, Solla et al 2006, Linares et al 2010b), only the natural, control and non-infested cases were considered.
Geographic coordinates and the linear TRW or BAI trend sign—positive, negative or neutral—estimated from 1970 onward for each of the 878 cases were registered, along with other information (table S1). The trend sign was estimated by means of three different approaches depending on the type of data available. In 34% of the cases, we used statements about the trend sign provided in the 'results' and/or 'discussion' sections or visually estimated the sign from graphic representations of raw time series. In another 34% of the cases, a visual estimation of the trend sign from a graphic representation of the detrended series was used because neither raw data nor written information about the trend sign was provided. In these cases, no 'authentic' trend could be assessed because the detrended series did not contain any trend per se; instead, the trend sign was considered negative (positive) when most of the detrended values appeared to be generally lower (higher) than the steady mean value. In 32% of the cases, a third approach was applied in which the tree-ring trend was inferred from the trend in the reconstructed climatic series. These three approaches possess increasing degrees of uncertainty for inferring post-1970 trends; raw data logically enable a more accurate trend estimation than detrended series and reconstructed climate data.
Potential geographic patterns were assessed by means of the geographic coordinates registered for the 645 study sites. Using GIS, each location was positioned in a MB map with its corresponding dendrochronological trend sign colored in blue, green and red for negative, neutral and positive trends, respectively. A total of 30 sites were considered to have a neutral trend due to overlapping positive and negative trends in different variables. Specifically, three MB maps were produced (figure 1), each of which displayed a different environmental or climatic factor in the background: elevation, mean temperature and total precipitation for the period from April to September (i.e., AMJJAS, taken here as a general time window comprising the growing season in the MB) from CRUTS3.10 climatic data (Harris et al 2013). These three factors were used to capture potential topographic and/or climatic patterns influencing dendrochronological trends on a large scale.
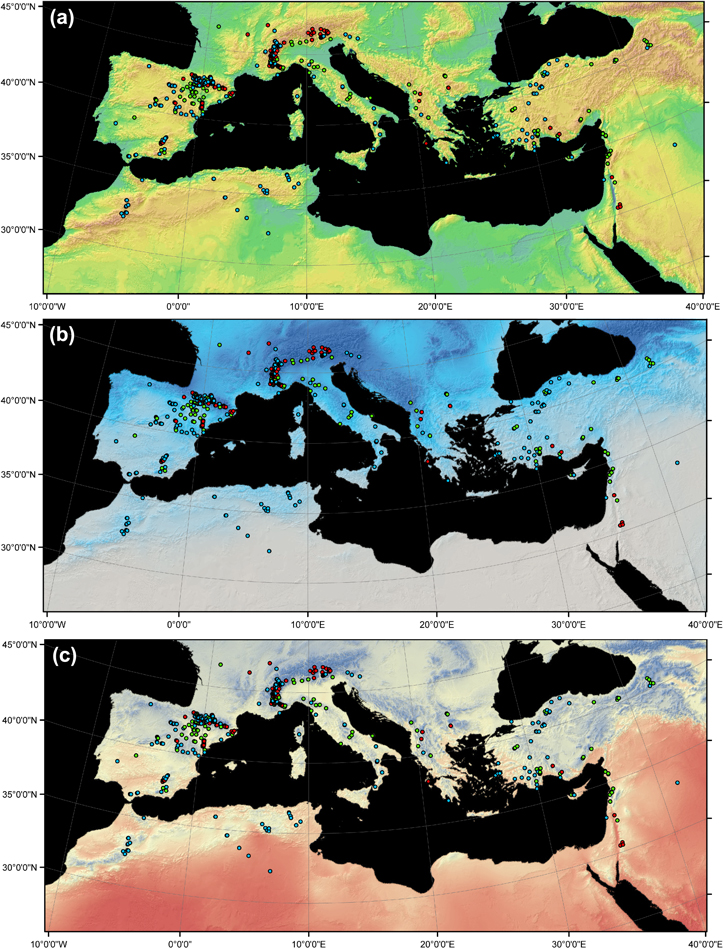
Figure 1. Map of the Mediterranean Basin (MB) showing the reviewed chronologies and the detected post-1970 trends for TRW and BAI. The map shows the geographical points with negative (blue) or positive (red) trends. Green dots correspond to neutral trends. The backgrounds of panels (a), (b) and (c) depict elevation, AMJJAS total precipitation and mean temperature, respectively. In (a), greenish and brownish colors indicate lower and higher altitudes, respectively; in (b), darker blue indicates rainier areas; in (c), colors from red to blue indicate warm to cold areas, respectively.
Download figure:
Standard image High-resolution imageWe also searched for geographical patterns in temperature, precipitation and drought across the MB in order to assess how differences in climate may have also contributed to differences in growth. Specifically, we assessed the signs of post-1970 trends of 255 series of AMJJAS mean temperature and Standardized Precipitation-Evapotranspiration Drought Index (SPEI; Vicente-Serrano et al 2010), by means of Mann–Kendall tests (Mann 1945) (figure S1). SPEI quantifies water deficit in a more accurate and objective way than using the precipitation information itself since it considers the diverse time scales of droughts (Vicente-Serrano et al 2010). Negative (positive) SPEI values correspond to dry (wet) conditions; hence, a negative SPEI trend relates with an increase in drought conditions. Apart from assessing trends in drought during the growing season, we also assessed the signs of post-1970 trends of total annual precipitation since trees can use soil moisture derived from precipitation occurring throughout the year, including the non-growing season (Teobaldelli et al 2004, Sarris et al 2013). Limiting the analysis of temperature to the growing season is appropriate since the evaporative demand is most influential on tree growth during the relatively warm growing-season months (Williams et al 2013). The temperature, precipitation and SPEI series were extracted from the CRUTS3.10 dataset, corresponding to a 0.5° resolution grid-box data covering the 878 cases. Mann–Kendall analyses were performed with the Kendall package of the R language version 2.11.1 (R Development Core Team 2011).
Lastly, cases with negative or positive growth trends were plotted in relation to the AMJJAS mean temperature and mean precipitation to detect potential climatic gradients that determine the spatial arrangement of both positive and negative growth trends in the MB (figure 3).
Results
The primary variables considered in the 1076 cases were TRW (63.9% of the cases), BAI (21.7%) and MXD (3.1%). The remaining 11.1% addressed other, less frequently recorded variables (see Introduction). In terms of the number of papers, most also considered TRW (69.3% of the publications), BAI (21.3%) and MXD (9.3%), as well as δ13C (10.6%) (the percentages add up to more than 100% because some studies addressed more than one variable).
Overall, 41 species from ten genera appear in the review: Pinus (61.6% of the cases), Abies (13.4%), Larix (8.1%), Quercus (5%), Cedrus (3.2%), Juniperus (3%), Picea (2.6%), Fagus (2.9%), Arbutus (0.1%) and Fraxinus (0.1%). The eight most studied species were Pinus sylvestris (212 cases), Pinus uncinata (139), Abies alba (126), Pinus cembra (116), Pinus nigra (97), Larix decidua (87), Pinus halepensis (66) and Quercus sp. (54). For all species except P. sylvestris, most of the studies measured TRW (table 1). When analyzing TRW cases exclusively, 36 species from ten genera are included: Pinus (55.2% of the cases), Larix (12.2%), Abies (10.3%), Quercus (7.6%), Cedrus (4.9%), Juniperus (4.2%), Fagus (2%), Picea (3.2%), Arbutus (0.15%) and Fraxinus (0.15%). Ten species from five genera appear in the BAI cases: Pinus (73% of the cases), Abies (25%), Juniperus (1%), Larix (1%) and Cedrus (0.5%). Species growing at higher altitudes (e.g., P. uncinata, P. sylvestris and L. decidua) had a higher percentage of positive trends than trees at lower altitudes (e.g., A. alba, P. halepensis, P. nigra, and Quercus sp.) (table 2).
Table 1. The eight most abundant species studied in the revisited papers and the percentage of cases addressing various tree-ring related variables. Variable abbreviations are TRW, tree-ring width; BAI, basal area increment; MXD, tree-ring maximum latewood density; δ, C or O isotope composition of tree-ring wood or cellulose; NPP, net primary productivity; msx, interannual mean sensitivity.
| Species | Percentage of cases addressing each variable | ||||||
|---|---|---|---|---|---|---|---|
| TRW | BAI | MXD | δ | NPP | msx | Others | |
| Abies alba | 50.79 | 38.1 | 6.35 | 1.59 | — | 3.17 | — |
| Larix decidua | 96.34 | 2.44 | — | — | — | — | 1.22 |
| Pinus cembra | 96.36 | 1.82 | — | — | — | — | 1.82 |
| Pinus halepensis | 62.90 | 3.23 | — | — | 33.87 | — | — |
| Pinus nigra | 64.95 | 11.34 | 1.03 | 11.34 | — | 9.28 | 2.06 |
| Pinus sylvestris | 24.53 | 68.40 | — | 0.94 | — | 6.13 | — |
| Pinus uncinata | 53.73 | — | 18.66 | 4.48 | — | 21.64 | 1.5 |
| Quercus sp. | 96.30 | — | — | — | — | — | 3.7 |
Table 2. The eight most abundant species in this paper and the percentage of cases showing each of the three trend signs. Bold characters refer to the highest percentage value of each species.
| Species | Trend sign (%) | ||
|---|---|---|---|
| Negative | Neutral | Positive | |
| Abies alba | 53.97 | 29.36 | 16.67 |
| Larix decidua | 32.93 | 1.22 | 65.85 |
| Pinus cembra | 30.91 | 34.55 | 34.55 |
| Pinus halepensis | 27.42 | 72.58 | 0.00 |
| Pinus nigra | 52.58 | 21.65 | 25.77 |
| Pinus sylvestris | 11.32 | 9.43 | 79.24 |
| Pinus uncinata | 32.84 | 8.21 | 58.96 |
| Quercus sp. | 25.96 | 64.81 | 9.26 |
From a geographical perspective, a higher proportion of positive tree-growth (i.e. TRW or BAI) trends were located in the wetter north-west MB, whereas negative trends were aggregated towards the south-western and eastern MB, where drier conditions prevail (figure 1(b)). Likewise, warmer areas, such as the Atlas region in Northern Africa, displayed negative trends, whereas cooler regions on the northern shore of the MB (e.g., the northern Iberian Peninsula and southern Alps) displayed more positive trends (figure 1(c)). These observations agree with the climatic perspective where positive trends post-1970 tend to be located in cooler, wetter areas of the MB, whereas more xeric, warmer sites often display negative growth trends (figure 3).
We also found a generally widespread post-1970 increase in AMJJAS mean temperatures and drought conditions across almost all reviewed sites, with the exception of a few neutral temperature or drought trends (figure S1) and even positive precipitation trends (figure 2) at some of the easternmost sites (northern Anatolia). In other words, recent increasing dry and warm conditions have occurred equally as much in warm and dry as in cool and wet areas of the MB.
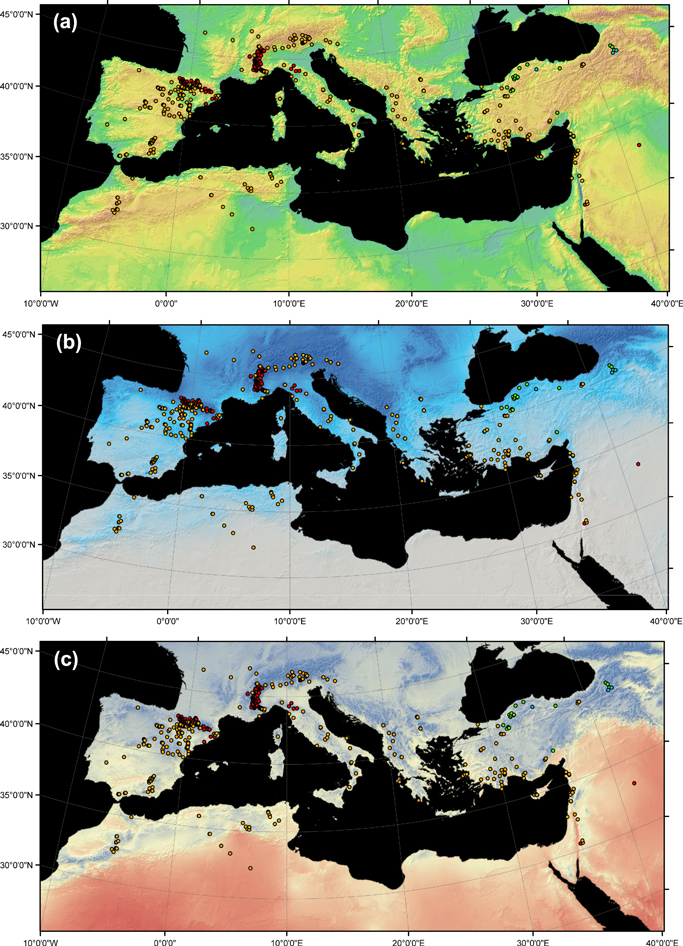
Figure 2. Map of the Mediterranean Basin (MB) showing the reviewed chronologies and the detected post-1970 trends for AMJJAS mean temperature and annual precipitation. Red (orange) dots indicate sites where increasing temperature and (or) decreasing precipitation trends are found in the corresponding 0.5° resolution grid-box CRU data. Green dots correspond to neutral trends in both temperature and precipitation, and blue dots correspond to positive trends in precipitation together with neutral trends in temperature. No negative trend in temperature was found across the MB sites revisited. The backgrounds of panels (a), (b) and (c) depict elevation, AMJJAS total precipitation and mean temperature, respectively. In (a), greenish and brownish colors indicate lower and higher altitudes, respectively; in (b), darker blue indicates rainier areas; in (c), colors from red to blue indicate warm to cold areas, respectively.
Download figure:
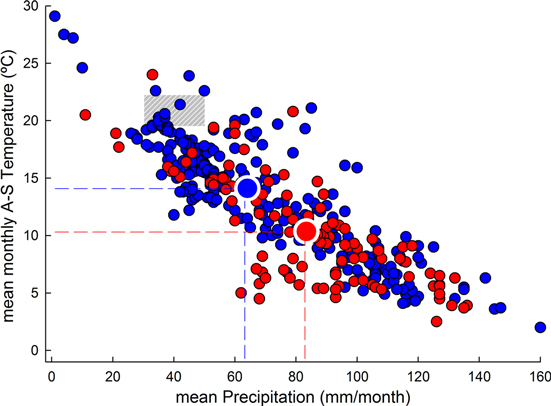
Standard image High-resolution imageThe mean (±SD) altitude of all reviewed cases was 1512 (±580) m asl. The mean (±SD) altitude of the TRW and BAI cases was 1687 ± 547 m and 1066 ± 394 m, respectively. Thus, the reviewed sites were geographically biased toward high-elevation areas such as the Alps, Pyrenees, Apennines, Balkans, the Anatolian and Iberian plateaus, and the Atlas Mountains (represented by brownish colors in figure 1(a)), and the included publications addressed trees growing in more mountainous and consequently colder and rainier environments than the average MB lowland conditions. In fact, based on AMJJAS mean temperature and mean precipitation data from CRUTS3.10 data averaged for the entire MB, most of the reviewed cases were located outside the 'average Mediterranean climatic envelope' (gray area in figure 3), reflecting the prevailing mountainous character of the studied sites.
Figure 3. Relationship between mean monthly precipitation and mean A-S temperature based on the reviewed tree-ring width (TRW) and basal area increment (BAI) studies. The area shaded gray highlights the range of mean A-S temperature and mean monthly precipitation (CRUTS3.10) for the area spanning 10°W−40°E and 46°−30°N, which includes the whole Mediterranean Basin (MB). Dashed red and blue lines indicate the A-S mean temperature and monthly mean precipitation averaged over all sites with TRW or BAI positive and negative trends, respectively.
Download figure:
Standard image High-resolution image
Discussion
Species-specific growth-climate relationships vary across environments in the MB due to the climatic, topographic and environmental diversity that defines this area. At a local scale, the complex topography (Giorgi and Lionello 2008) derives from luv-lee (e.g., Xoplaki et al 2000, Fox and Deil 2004) and slope aspects (e.g., Karschon et al 1979, Kutiel 1992) or effects of concave–convex micro-topography (e.g., Ruiz-Flaño et al 1992, Ozkan 2009). An intricate elevation gradient ranging from the depressions around the Israeli Sea of Galilee (−209 m asl) to the highest peaks of the Pyrenees (>3000 m asl) or Atlas and Alps (>4000 m) also contributes to the diversity in tree growth-climate relationships characteristic of the MB. At a broad scale, differences in the depth of the atmospheric boundary layer between neighboring areas can establish precipitation gradients across a particular region (Amit et al 2006). Subtropical atmospheric high pressures from the North African arid zone and westerly circulations from central-northern Europe, together with other influences such as the South Asian Monsoon in summer and the western Russian/Siberian High Pressure System in winter, shape the complex climate of the MB (Lionello et al 2006). Several studies have revealed distinct large-scale climate regions ranging from north to south (Carrer et al 2010) and east to west (Roberts et al 2012) in the MB, across a distance of more than 4000 km. This Mediterranean climatic diversity and environmental complexity at multiple scales may produce spatially contrasting growth-climate response patterns (Tardif et al 2003, Carrer et al 2010), that is, populations growing in different areas of the MB are expected to react differently to climate change. This review highlights the fact that the MB intricate topography and diverse climatic conditions produce varied and often opposite growth trends, even between neighboring sites (appendix 1 and references therein).
In spite of this complexity, our findings emphasize a broad-scale pattern; the distribution of recent positive trends in tree-ring variables related to growth or productivity is biased towards wetter, cooler areas of the MB located in the northwest. By contrast, negative growth trends are generally observed in more xeric, warmer areas in the southern and eastern regions of the MB. Recent increasing dry and warm conditions have occurred equally as much in warm and dry as in cool and wet areas of the MB. This indicates that, rather than due to differences in the temperature or drought trends between opposite areas of the MB, the aforementioned broad scale pattern of growth trends is due to significant differences between the climatology of the (wetter and cooler) north-western and the (drier and warmer) south-eastern MB regions; the post-1970 increases in drought and warm conditions had greater negative (positive) impact on tree growth in drier and warmer (wetter and cooler) areas of the MB. These observations may indicate that, in spite of the characteristic local climatic and topographic complexity, on a global scale, tree growth across the MB is limited by drought or low water availability during the growing season (e.g., Martínez-Vilalta and Piñol 2002, Camarero et al 2004, Jump et al 2006, Sarris et al 2007, Piovesan et al 2008, Linares et al 2011b, 2012, Sánchez-Salguero et al 2012). Water-use efficiency improvements appear to be insufficient to compensate for the negative effects of reduced water availability on growth (Andreu et al 2011). A reduction in forest productivity due to water limitations could have serious implications for the degree of carbon sequestration by Iberian forests, thereby affecting the terrestrial biosphere carbon cycle.
Most of the revisited cases were located outside the 'average Mediterranean climatic envelope' (figure 3), reflecting the mountainous (cooler and wetter) character of the studied sites. This is most likely the result of dendrochronologists' bias toward studying the most climate-sensitive trees, which usually grow in harsh, high-elevation environments (Fritts 2001). Furthermore, older trees tend to grow at higher altitudes, where there has been less anthropic pressure (i.e., logging) in recent decades; in addition, trees in these harsh environments tend to have low growth rates and long life spans (Bigler & Veblen 2009). Finally, most well-preserved European forests are located in mountains; thus, many of the dendrochronological studies and their findings compiled here are likely biased toward old, slow-growing trees living in high-elevation areas.
The last year of the TRW and BAI analyzed trends range from 1989 (Biondi and Visani 1996, Griggs et al 1996) to 2010 (Galván et al 2014; see table S1). These differences in the time span of the dendrochronological series must also be taken on account, since inferences about the trend's sign will have different consistency depending on the length of the covered time span.
Only a few of the reviewed papers differentiated growth trends by age class (e.g., Rozas et al 2009, Dorado-Liñán et al 2012a, Linares et al 2012), competition intensity (e.g., Martín-Benito et al 2009, Linares et al 2009a, 2010a) or health status (e.g., Camarero et al 2003, Solla et al 2006, Linares et al 2010b). The inclusion of these factors enables more explicit conclusions regarding growth trends of forests composed of trees with specific vitality, age or social status levels. Furthermore, apart from a few cases (e.g., Linares et al 2010a, Carrer et al 2011, Rozas and Olano 2012), the papers included in this review mainly used population-based approaches and discussed the mean trend of populations, but dendrochronologists cannot overlook the occurrence of different growth trends of individual trees in response to climate (Ettl and Peterson 1995, Galván et al 2014). However, the predominantly population-based approach of this review is suitable because our aim was not to disentangle individual responses or micro-site mechanisms but rather to identify regional patterns in tree growth across the MB.
The uneven distribution of sampled sites across the MB is emphasized; there were more publications on sites in northern countries. We first considered a potential geographical bias in our bibliographic search as a possible explanation for this pattern. A crosscheck of this potential bias was performed using the web tool JournalMap (http://www.journalmap.org) to enable geographically specified literature searches of general ecological studies. Studies performed in the MB addressing 'Mediterranean forests, woodlands and scrub' biomes (obtained from the 'Biome' tab of the website) were selected to generate an overview of the geographical distribution of ecological studies. The biased site distribution observed among dendrochronological studies was confirmed at a wider ecological scale; once again, there was an overrepresentation of publications on the MB's northern shore. Specifically, JournalMap returned 30 and 102 publications from the southern and northern shores, respectively. This bias can be explained by three factors. First, the lack of homogeneity in the degree of forest cover is an evident limitation in tracking tree growth behavior over the entire MB. An absence of cases on the southern shore of the Mediterranean Sea (i.e., Libya and Egypt) is apparent (figure 1) and in accord with the scarcity of forested areas in these regions (Sebukeera et al 2006). In addition, ecologists' study site selections are geographically biased toward protected areas, the temperate zone and countries with high gross national incomes (GNIs) and, therefore, greater scientific output (Martin et al 2012); southern European countries have higher GNIs than North African countries (World Bank 2012) and more land surface covered by protected areas (IUCN and UNEP 2013). Consequently, our review is likely biased toward an overrepresentation of the north shore of the Mediterranean, which is also wetter and cooler throughout the year overall. A higher abundance of samples from the southern MB shore would provide a more precise representation of the arrangement of negative and positive trends regarding temperature and precipitation (figure 2). Our results can be taken as a call for dendrochronologists, policy makers and funding organizations to improve dendrochronological research in currently understudied areas.
Concerning this geographic bias, searches for publications performed in particular areas of the world were complicated by the inability of search tools such as Web of Science, Scopus or Google Scholar to consider study location. Geographic information about the coordinates and characteristics of the study sites is not always provided; we excluded five papers for this reason. The ability to search the scientific literature not only thematically but also geographically and the availability of site coordinates would facilitate meta-analyses and explanations of environmental patterns (Karl et al 2013).
Various data sources were used to infer the post-1970 growth trend signs in this review: raw and detrended series and indirect inference of trend signs based on climatic reconstructions. Obtaining strictly raw data would have allowed us to perform appropriate statistical growth trend analyses. Furthermore, different authors usually make use of different detrending methods, depending on their specific research goals (e.g. interest in retaining high- over low-frequency signal or vice versa; see table S1). Different standardization methods also imply different degrees of flexibility when it comes to keep the variability of the dendrochronological series. The availability of raw data could allow applying a uniform detrending method over all the reviewed cases in order to obtain more comparable inferences about MB growth trends. Hence, it is important not only to make geographical information available but also to provide raw tree-ring series to enable secondary analyses with lower levels of uncertainty. In this sense, the International Tree-ring Data Bank (Grissino-Mayer and Fritts 1997) is a useful tool, but the dendro-scientific world must aspire to an even more globally distributed database.
Conclusions
Our work constitutes, to our knowledge, the first thorough literature review about the behavior of forest growth trends across the entire MB, which has been defined as a main climate change hot spot. Dendrochronological evidence from 878 post-1970 trend estimates of TRW and BAI at 645 sites reported in 66 peer-reviewed publications reveals positive growth trends in temperate environments across the northwestern part of the Basin, whereas negative trends were often found at xeric sites in the southwestern and eastern regions. We emphasize the need for more evenly distributed study sites and age classes that better reflect ecological rather than political and methodological criteria.
Acknowledgements
We thank three anonymous reviewers for their insightful comments which helped us to improve a preliminary version of the manuscript. We also thank Linda Feichtinger (WSL) for her assistance in R scripting, and Franco Biondi and Jordi Martínez-Vilalta for providing us with geographical information regarding their publications included in this review. UB was supported by the Czech project 'Building up a multidisciplinary scientific team focused on drought' (No. CZ.1.07/2.3.00/20.0248). We also acknowledge the support of projects 012/2008 and 387/2011 (OAPN, Spain).