
Abstract
Satellite-based measurements of the normalized difference vegetation index (NDVI; an index of vegetation greenness and photosynthetic capacity) indicate that tundra environments are generally greening and becoming more productive as climates warm in the Arctic. The greening, however, varies and is even negative in some parts of the Arctic. To help interpret the space-based observations, the International Polar Year (IPY) Greening of the Arctic project conducted ground-based surveys along two >1500 km transects that span all five Arctic bioclimate subzones. Here we summarize the climate, soil, vegetation, biomass, and spectral information collected from the North America Arctic transect (NAAT), which has a more continental climate, and the Eurasia Arctic transect (EAT), which has a more oceanic climate. The transects have broadly similar summer temperature regimes and overall vegetation physiognomy, but strong differences in precipitation, especially winter precipitation, soil texture and pH, disturbance regimes, and plant species composition and structure. The results indicate that summer warmth and NDVI increased more strongly along the more continental transect.
Export citation and abstract BibTeX RIS
1. Introduction
The Arctic and boreal regions north of 60°N are warming at about double the general planetary rate (Winton 2006). The enhanced Arctic warming, also called 'Arctic amplification', is attributed mainly to changes in the albedo of the Earth's oceans as large areas of white highly-reflective perennial sea ice are converted to dark heat-absorbing open water during summer (Serreze and Barry 2011). Observations from space using the Advanced Very High Resolution Radiometer (AVHRR) indicate that from 1982 to 2010 the amount of May–Aug open water within 100 km of the Arctic coast increased by about 30% for the Arctic as a whole, while the summer warmth index (sum of the monthly mean temperatures above 0 °C) for the Arctic tundra biome increased about 14% (Bhatt et al 2010). Several studies have documented a positive trend in tundra greening as measured by the AVHRR-derived normalized difference vegetation index (NDVI), (e.g., Myneni et al 1997, Jia et al 2003, Bunn et al 2007, Verbyla 2008, Bhatt et al 2010). The overall mean greenness of northern hemisphere tundra increased by about 8% (Bhatt et al 2010). The greening trend is expected based on a wide variety of experiments and observations that document increased tundra productivity with enhanced warming (Callaghan et al 2011, Lawrence et al 2008, Shaver et al 2000, Walker et al 2006). There is, however, considerable unexplained regional variation in the observed NDVI trends, and the climate drivers are not well understood (Bhatt et al 2010). There is a need for careful evaluation of the causes of the observed NDVI patterns and changes, which may be driven by local long-term non-equilibrium factors other than climate warming, such as recovery from glaciation, changes in snow cover, enhanced precipitation, or changes in disturbance regimes. If the warming trend continues, the resulting increases to tundra productivity will have major consequences for northern ecosystems, permafrost, wildlife and human use of the land (ACIA 2004).
The International Polar Year (IPY) Greening of the Arctic project was initiated to compare space-based measurements of NDVI with ground-based measurements of vegetation, soils, microclimate and surface spectral properties along two transects that traverse all five Arctic bioclimate subzones (Walker 2006) (figure 1). The locations of the two transects were chosen because both had a history of research that offered an opportunity to access areas along the full bioclimate gradient. Coincidentally, they also offered an opportunity to examine the consequences of climate change in a continental part of the Arctic (the NAAT) compared a relatively maritime part (the EAT). Here we address the questions: how do the physical environments, vegetation compositions and vegetation structures of zonal vegetation vary between and within the two transects, and how do these similarities and differences affect the NDVI as observed from space?

Figure 1. The North America Arctic transect (NAAT) and the Eurasia Arctic transect (EAT) within Arctic bioclimate subzones of the Circumpolar Arctic Vegetation Map (CAVM Team 2003). The inset map shows locations of study locations, and the global distribution of the subzones. The straight-line distances from the northernmost to southernmost locations on the transects are 1750 km for the NAAT and 1500 km for the EAT.
Download figure:
Standard image2. Methods
Study sites were selected in zonal situations at accessible locations within the five Arctic bioclimate subzones of the Circumpolar Arctic Vegetation Map (CAVM Team 2003, Walker et al 2005) (figure 1). We sampled zonal sites because such areas have vegetation that is the best expression of the regional climates. Zonal refers to vegetation and soils that develop on mesic fine-grained soils under the influence of the regional climate, without the confounding influences of extremes of snow, site moisture, soil chemistry and texture, or major disturbances (Alexandrova 1980, Razzhivin 1999, Vysotsky 1909).
The NAAT was established in 2001–6 and focused on vegetation associated with patterned-ground along the Arctic bioclimate gradient in northern Canada and Alaska (Walker et al 2008b). General descriptions of the study locations along the NAAT are in five main publications (Kade et al 2005, Raynolds et al 2008b, Vonlanthen et al 2008, Walker et al 2008b, 2011c). Vegetation was sampled on and between patterned-ground features and combined into 'zonal vegetation complexes' for each subzone.
The EAT was established in 2007–10 to study the ground- and space-based spectral characteristics of zonal vegetation in relationship to vegetation, biomass and environmental variables on the Yamal Peninsula and Franz Josef Land, Russia (Walker et al 2009b, 2011b). Descriptions of the study sites and sampling methods along the EAT are in data reports that are available online (Walker et al 2008a, 2009a, 2009c, 2011a). Given the funding and logistical constraints of the projects, sampling had to be confined to relatively small homogeneous areas at each sampling location.
Characterization of the physical environment, soils and vegetation along the transects was done through a combination of analysis of data from the study sites and information from the available literature reviewed in data reports cited above. Summer temperature trends along the transects were characterized using the summer warmth index: SWI = ΣTm, where Tm is the mean monthly temperatures that exceed 0 °C, expressed as thawing degree months (°C mo) (Walker et al 2008b).
For the NAAT, air (SWIa) and ground-surface (SWIs) temperatures were collected from stations established at each study location (Romanovsky et al 2008). For the EAT, long-term air-temperature data were available for the Russian meteorological stations at Hayes Island (Krenkel Station), Ostrov Belyy (Popova Station) and Kharasavey, but not for Vaskiny Dachi and Laborovaya (table 1). Mean (1982–2003) AVHRR-derived SWIs values (land-surface temperatures derived from the AVHRR thermal bands) were obtained for 5 × 3 km pixels containing each study location (figure 2) (Raynolds et al 2008a). Precipitation data were derived from the Global Precipitation Climatology Centre (GPCC) (Beck et al 2004), which are interpolated at 0.25° (about 25 km) resolution. Summer (JJA), winter (S–May) and total precipitation are based on monthly mean precipitation values available for the period 1951–2000.
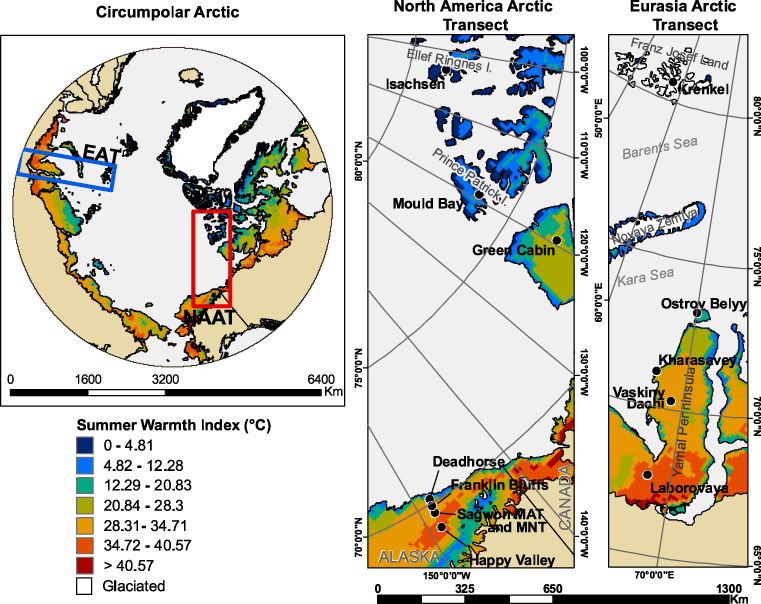
Figure 2. Mean summer warmth index (SWI) derived from 1 km AVHRR-NDVI. Based on Raynolds et al (2008a).
Download figure:
Standard imageTable 1. Descriptions of zonal Arctic tundra study sites along the North America Arctic transect (NAAT) and Eurasia Arctic Transect (EAT). Bioclimate subzones are according to CAVM Team (2003). Summer warmth index (SWI) is the sum of monthly mean air temperatures above freezing. SWIa are station air temperatures measured at 2 m height (varying lengths of record) and Walker et al (2008a); surface summer warmth (SWIs) are derived from AVHRR satellite data (means 1982–2003, 12.5 km pixels) (Raynolds et al 2008a). Precipitation is from the Global Precipitation Climatology Centre (Beck et al 2004). Soil textures are according to Soil Survey Staff (1993). Soil pH was measured with the saturated paste method. Vegetation descriptions are modified from Raynolds et al (2008b).
| Summer Warmth Index (°C mo) | Precipitation (mm) | |||||||||
|---|---|---|---|---|---|---|---|---|---|---|
| Location and site | Latitude, longitude | Bioclimate subzone | Air (SWIa) | Surface (SWIs) | Total | Summer JJA | Winter S–May | Geological setting, slope, elevation (m), parent material, surface geomorphology | Soil texture (pH) | Dominant vegetation |
| North America Arctic transect: | ||||||||||
| Isachsen-1 | 78.785°N, 103.551°W | A | 3 | 6.8 | 114 | 53 | 61 | Gentle hill backslope, 1°E, 35 m, hillslope colluvium derived from marine shale (Christopher Formation), small nonsorted polygons (15–25 cm diam.). | Clay, 5.8 | Small-nonsorted-polygon complex: dominantly cushion-forb, grass, moss, lichen tundra [Saxifrago–Parmelia omphalodes ssp. glacialis comm. (Vonlanthen et al 2008)] with biotic soils crusts in polygon centers [Puccinellia angustata–Papaver radicatum comm. (Vonlanthen et al 2008)]. |
| Mould Bay-1 | 76.226°N, 119.299°W | B | 4.6 | 6.5 | 104 | 47 | 66 | Broad hill crest,, 3°SE, 40 m, hillslope colluvium derived from mixed shales, sandstones and conglomerates (Beaufort Formation?), small nonsorted polygons (25–50 cm diam.). | Sandy loam, 7.8 | Small-nonsorted-polygon complex: dominately prostrate dwarf-shrub, herb, moss, lichen tundra [Dryas integrifolia–Luzula nivalis comm. (Vonlanthen et al 2008)] with biotic soil crusts in polygon centers [Hypogymnia subobscura–Lecanora epibryon comm. (Vonlanthen et al 2008)]. |
| Green Cabin-1 | 73.219°N, 119.559°W | C | 16.6 | 22.7 | 156 | 63 | 91 | Hill saddle, 1°NW, 54 m, hillslope colluvium derived from glacial drift (Thomson Formation, mid Pleistocene), nonsorted circles (0.75–1.0 m diam.) and small nonsorted polygons (10–20 cm diam.). | Sandy loam, 7.7 | Nonsorted circle complex: dominantly prostrate dwarf-shrub, herb, lichen tundra [Dryas integrifolia–Carex rupestris comm, (Vonlanthen et al 2008)]: with mostly bare soil and biotic soil crusts in the circles [Puccinellia angustata–Potentilla vahliana comm, (Vonlanthen et al 2008)]. |
| Howe Island | 70.315°N, 147.994°W | C | 14.8 | n/a | 165 | 55 | 78 | Island plain, flat, 3 m, calcareous sandy and gravelly alluvium Holocene), large ice-wedge polygons, small nonsorted polygons (20–30 cm diam), and nonsorted circles (0.8–1.2 m diam.), | Loam, 7.9 | Nonsorted circle complex: dominantly prostrate dwarf-shrub, moss tundra: [Dryas integrifolia–Salix ovalifolia comm. (Kade et al 2005)] with mostly bare soil and biotic soil crusts in circles [Mycobilimbia lobulata–Polyblastia sendtneri comm. (Kade et al 2005)]. |
| North America Arctic transect (cont'): | ||||||||||
| Deadhorse | 70.162°N, 148.464°W | D | 17.3 | 28.5 | 165 | 55 | 78 | Coastal plain, alluvial terrace, flat, 20 m, calcareous loess over gravel alluvium (Holocene), nonsorted circles (1–2 m diam.). | Loam, 8.0 | Nonsorted circle complex: dominantly moist nonacidic sedge, prostrate-shrub, moss tundra [Dryado integrifoliae–Caricetum bigelowii (Walker et al 1994)] with frost boil communities in centers [e.g., Junco biglumis–Dryadetum integrifoliae (Kade et al 2005)]. |
| Franklin Bluffs-1 | 69.674°N, 148.721°W | D | 24.2 | 32.7 | 179 | 61 | 86 | Coastal plain alluvial terrace, flat, 133 m, calcareous loess over gravel alluvium (Holocene), nonsorted circle (1–1.5 m diam.). | Loam, 7.4 | Nonsorted circle complex: dominantly moist nonacidic sedge, prostrate-shrub, moss tundra [Dryado integrifoliae–Caricetum bigelowii, (Walker et al 1994)] with frost boil communities in centers [e.g., Junco biglumis–Dryadetum integrifoliae pedicularetosum (Kade et al 2005)]. |
| Sagwon-nonacidic-2 | 69.433°N, 148.67°W | D | 26.5 | 35 | 179 | 61 | 86 | Hill shoulder, 1°E, 280 m, hillslope colluvium and calcareous loess over Gunsight Mountain glacial drift (Tertiary age?), nonsorted circles (0.5–1.0 m diam.) | Silt loam, 7.9 | Nonsorted circle complex: dominantly moist nonacidic sedge, prostrate-shrub, moss tundra [Dryado integrifoliae–Caricetum bigelowii (Walker et al 1994)] with frost boil communities in centers [e.g., Junco biglumis–Dryadetum integrifoliae pedicularetosum (Kade et al 2005)]. |
| Sagwon acidic | 69.426°N, 148.693°W | E | 26.5 | 35 | 200 | 72 | 100 | Gentle hill backslope, 6°N, 300 m, hillslope colluvium and calcareous loess over Gunsight Mountain glacial drift (Tertiary age?), small nonsorted circles (0.2–0.5 m diam.) between tussocks and earth hummocks (to 1 m diam.). | Silt loam, 5.3 | Dominantly moist acidic tussock tundra [Sphagno–Eriophoretum vaginati (Walker et al 1994)] with small nonsorted circles with biotic soil crusts [e.g., Anthelia juratzkana–Juncus biglumis comm. (Kade et al 2005)] and well vegetated earth hummocks [Cladino-Vaccinietum-vitis-idaea Carex bigelowii var. (Kade et al 2005)]. |
| Happy Valley-1 | 69.147°N, 148.848°W | E | 29.5 | 36.2 | 198 | 72 | 99 | Hill backslope, 9°W, 350 m, hillslope colluvium and calcareous loess over Anaktuvuk glacial drift (>250 000 kya), small nonsorted circles and earth hummocks small nonsorted circles (0.2–0.5 m diam.) between tussocks and earth hummocks (to 1 m diam.). | Silty clay loam, 5.1 | Dominantly moist acidic tussock tundra [Sphagno–Eriophoretum vaginati, (Walker et al 1994)] with small nonsorted circles with biotic soil crusts [e.g., Anthelia juratzkana–Juncus biglumis comm. (Kade et al 2005)] and well vegetated earth hummocks [Cladino-Vaccinietum-vitis-idaea Carex bigelowii var. (Kade et al 2005)]. |
| Eurasia Arctic transect: | ||||||||||
| Krenkel-1 | 80.583°N, 57.904°E | A | 1 | 1.9 | 282 | 56 | 211 | Hill backslope, 4°W, 30 m, hillslope colluvium derived from unconsolidated calcareous sandstone deposits (Mesozoic age), small nonsorted polygons (10–15 cm diam.). | Sandy loam, 6.2 | Cushion-forb, lichen, moss tundra: Papaver dahlianum spp. polare–Stellaria edwardsii–Cetrariella delisei–Ditrichum flexicaule- black soil crust (Walker et al 2011a). |
| Ostrov Belyy-1 | 73.328°N, 70.079°E | B | 11.5 | 11.5 | 234 | 74 | 154 | Coastal plain, gentle slope of marine terrace, 2°NE, 2 m, alluvial-marine sediments, marine terrace II (Upper Pleistocene to Holocene age), nonsorted circles (0.5–0.7 m diam.). | Loam, 4.6 | Nonsorted circle complex: (Inter-circle areas) Graminoid, prostrate dwarf-shrub, moss tundra: Carex bigelowii–Calamagrostis holmii-Salix polaris–Hylocomium splendens. (Nonsorted circles) Prostrate dwarf-shrub, crustose-lichen barren: Dryas integrifolia–Arctagrostis latifolia–Racomitrium lanuginosum–Ochrolechia frigida (Walker et al 2009c). |
| Kharasavey-1 | 71.179°N, 66.979°E | C | 15.5 | 28.7 | 298 | 89 | 192 | Coastal plain, marine terrace, flat, 16 m, alluvial-marine sediments, Marine terrace II, Karginsky-age, (about 20–40 kya), no patterned ground. | Silt loam, 4.5 | Graminoid, prostrate dwarf-shrub, moss tundra: Carex bigelowii–Calamagrostis holmii–Salix polaris–Dicranum elongatum–Cladonia spp. (Walker et al 2009a) |
| Vaskiny Dachi-1 | 70.276°N, 68.890°E | D | 29.6 | 277 | 100 | 186 | Stable hill crest in strongly eroded section of coastal plain with many landslides, flat, 45 m, marine terrace IV (Kazantsevskaya-age, about 130–117 kya), no patterned ground. | Silt loam, 4.5 | Sedge, dwarf-shrub, moss tundra: Carex bigelowii–Vaccinium vitis idaea–Hylocomium splendens (Walker et al 2008a). | |
| Vaskiny Dachi-2 | 70.295°N, 68.883°E | D | 29.6 | 277 | 100 | 186 | Stable hill shoulder in strongly eroded section of coastal plain with many landslides, 2°SW, 30 m, fluvial-marine sediments, marine terrace III (Middle-Wiechselian about 75–25 kya), no patterned ground. | Silt loam, 3.9 | Dwarf-shrub, graminoid, moss tundra: Betula nana–Calamagrostis holmii–Aulacomnium turgidum (Walker et al 2008a). | |
| Laborovaya-1 | 67.707°N, 67.999°E | E | 36.4 | 664 | 224 | 443 | Hill slope, 2° slope SW, 80 m, hillslope colluvium over glacial till (Ermakovsky-age, about 50–110 kya), no patterned ground. | Clay loam, 4.6 | Sedge, dwarf-shrub, moss tundra: Carex bigelowii–Betula nana–Aulacomnium palustre (Walker et al 2008a). | |
To answer the questions regarding how the vegetation composition varies along and between transects, we used the Braun–Blanquet approach to characterize vegetation composition at each site and to identify diagnostic taxa (plant taxa that are characteristic of each subzone or groups of subzones within the range of relevés sampled) (Westhoff and van der Maarel 1978). For the NAAT, we used a recent vegetation analysis of the 147 zonal relevés (study plots) (Walker et al 2011c). We applied the same techniques to the data from the 69 relevés along the EAT. We used the software JUICE 6.5 (Tichý 2002) to make frequency synoptic tables of the zonal vegetation along both transects following the methods described in Walker et al (2011c).
To examine differences in the floristic compositions of the sampled relevés within each bioclimate subzone of the transects, we combined the relevé data from the two transects into a single species matrix containing 202 relevés and 556 species, correcting any inconsistencies in species taxonomy between the transects and leaving out non-mesic relevés. We then grouped the relevés according the five bioclimate subzones and two transects (NAAT & EAT) within each subzone. We calculated similarity of the transect–subzone relevé groups based on Sørensen's similarity values using presence/absence species transformation. We used overall and pairwise PERMANOVA tests and derived average floristic similarity within and between all groups (Anderson 2001). PERMANOVA is a permutational ANOVA, which was developed for testing the simultaneous response of one or more variables to one or more factors in an analysis of variance (ANOVA). PERMANOVA was applied using the PRIMER program (version 6, PRIMER-E Ltd, Ivybridge, UK; www.primer-e.com). We determined the mean percentage within-group similarity for each of the ten subzone-transect relevé groups, and between-group similarity for each of the 45 unique NAAT-EAT pairs of relevé groups.
The diagnostic taxa identified in the synoptic tables commonly occurred within the relevés of a given subzone or combination of subzones but were not found widely outside that subzone or combination of subzones. These taxa provide further insights regarding the floristic differences between the subzones because they have rather limited distributions that are likely caused by ecological or historical factors. We examined the characteristics of the diagnostic taxa by first tallying the total number of diagnostic vascular plants, bryophytes and lichens in each subzone of each transect. We further examined the geographic affinities of the diagnostic vascular plants. The geographic affinities of the shared bryophytes and lichens were not categorized because of lack of good reference distribution maps for many species. We used species biogeographic distribution categories from earlier studies (Kade et al 2005, Schickhoff et al 2002, Vonlanthen et al 2008, Walker 1985, Walker 1990). Vascular plants were categorized according to three criteria (Walker 1985): (1) physiographic distribution (Arctic, Arctic-Alpine, Arctic-boreal, coastal), (2) geographic distribution (Circumpolar, North America, North America–Asia, Western North America–Asia–Europe, Eurasia, Asia), and (3) northern limit of distribution (Young 1971). Young's four zones are approximately equivalent to the following CAVM bioclimate subzones (CAVM Team 2003): Zone 1≈ subzone A; Zone 2 ≈ subzone B + C; Zone 3 ≈ subzone D; Zone 4≈ subzone E.
To examine the similarities and differences in vegetation structure, we studied trends in the biomass of plant functional types and the leaf area index (LAI). Biomass was sampled from 20 cm × 50 cm harvest plots in each relevé at the time of peak biomass in early to mid-August. The samples were then sorted according to six plant functional types (deciduous shrubs, evergreen shrubs, graminoids, forbs, mosses and lichens) (Walker et al 2009a). Biomass at the EAT sites was sampled at five random points within large 50 m × 50 m homogeneous areas of zonal vegetation. The mean of these five harvests provided an estimate of landscape-level zonal biomass. Biomass of the NAAT sites was sampled within repeating microhabitat categories associated with patterned-ground features (Raynolds et al 2008b). To calculate landscape-level biomass of vegetation complexes along the NAAT, the biomass of the vegetation types in each patterned-ground microhabitat was weighted by the percentage areas of vegetation units as they were portrayed on vegetation maps of 10 m × 10 m zonal plots, and then summed for each 100 m2 study area (Raynolds et al 2008b, 2012).
LAI is the area of plant leaves divided by the area of the land on which the vegetation grows. LAI was measured with a LAI-2000 plant canopy analyzer (LI-COR, Lincoln NE, USA). This is an optical device that measures the LAI based on the shadows cast by the erect plant material, so the LAI reported here includes photosynthetic leaves, stems and erect dead tissue. LAI data were collected at each field site along the NAAT between the years of 2000 and 2006 using the methods described in Walker et al (2011c). We collected LAI data for the NAAT sites in 2002–06 and for all the EAT relevés and transects in 2007–10.
The spectral properties of the transect sample locations were examined from space using NDVI data from the AVHRR sensor aboard the NOAA satellites. The NDVI is an index of vegetation greenness that has been used extensively in the Arctic as an index of a variety of key biophysical properties, including LAI, biomass and CO2 flux (Stow et al 2004, Tucker 1976, Tucker and Sellers 1986, Bhatt et al 2010, Raynolds et al 2012). AVHRR-NDVI values for the sites were determined from bi-monthly AVHRR composites for the pixels encompassing each site. We used a circumpolar AVHRR-NDVI dataset with pixels ≈1 km2 from the Circumpolar Arctic Vegetation Map (figure 3) (CAVM Team 2003). The dataset portrays the maximum value of NDVI reached in each pixel during two summers of data, 1993 and 1995, and is nearly cloud- and snow-free (especially important in the high Arctic) and has high spatial resolution compared to other available circumpolar AVHRR-NDVI data sets.

Figure 3. Summer maximum NDVI/biomass for the circumpolar Arctic, the NAAT and EAT derived from a data set first developed for the Circumpolar Arctic Vegetation Map (CAVM Team 2003) with data from the NAAT and EAT transects (Raynolds et al 2006).
Download figure:
Standard imageGround measurements of NDVI were obtained at each biomass plot using a hand-held PS-2 portable spectrometer manufactured by Analytical Spectral Devices, Inc, Boulder, CO. We analyzed the relationships among biomass, SWI, AVHRR-NDVI and LAI for both transects using regression equations available in Microsoft-Excel: Mac 2011.
3. Results and discussion
3.1. Physical environment
The NAAT and EAT have distinctly different climates, geological histories and surficial deposits (table 1). The more continental climate of the NAAT is due to the presence of perennial sea ice in much of the Beaufort Sea, whereas the EAT has a more maritime climate, strongly influenced by the North Atlantic current. At the northern end of the transects, the EAT subzone A location at Krenkel has a colder summer climate and a much wetter winter climate (SWIa = 1 °C mo, Sep–May precipitation= 211 mm) than the NAAT subzone A location (Isachsen, SWIa = 3 °C mo, Sep–May precipitation = 58 mm). The EAT has more than double the winter precipitation in all subzones and also higher summer precipitation, particularly at Laborovaya (subzone E) which has double the summer precipitation of Happy Valley and Sagwon MAT.
There are also major physiographic and geologic differences (table 1, column 9). The Canada portion of the NAAT is situated on three islands in the Canadian Arctic Archipelago, with soils derived from a wide variety of parent materials. The five locations in northern Alaska are less variable; all are situated near the Dalton Highway and have fine-grained silty-loam to sandy-loam mineral soils derived mainly from Sagavanirktok River loess (Walker et al 2008b). The EAT transect has one major discontinuity; the Hayes Island (Krenkel Station, bioclimate subzone A) location is in the Franz Josef Land Archipelago, about 850 km north of the next nearest EAT location at Ostrov Belyy. The soils at Krenkel are derived from sandy bedrock, alluvial and marine sediments. Four EAT locations—Ostrov Belyy, Kharasavey Vaskiny Dachi and Laborovaya—are on or adjacent to the Yamal Peninsula, which is a relatively homogeneous plain, composed of five Quaternary-age coastal marine, alluvial marine, and alluvial terraces that were formed during marine transgressions/regressions of the past 200 000 years (Syitoch 2003). Most of the peninsula is thought to have been unglaciated during the late glacial maximum, but the southernmost site at Laborovaya was last glaciated about 50–110 kya (Ingólfsson et al 2008). The most important substrate difference between the EAT and NAAT for the vegetation is that soils along the EAT are mainly acidic sands and clays (pH 3.9–4.8), whereas soils along the NAAT are strongly basic (pH 7.4–8.0) except at the northern end (Isachsen, pH 5.8) and near the southern end (Happy Valley and Sagwon acidic sites, pH 5.1 and 5.3) (table 1).
The transects also have distinctly different permafrost and disturbance regimes. On the Yamal Peninsula, tabular ground ice up to 20 m thick is common (Streletskaya and Leibman 2003), which contributes to extensive landslides, especially in the central part of the Yamal Peninsula (Leibman and Kizyakov 2007). A 200–300 yr successional sequence following landslide events results in willow communities that are widespread and much more productive than (and quite unlike) the zonal tundra communities that they replace (Ukraintseva 2008). Most relevant for this study, are the differences in land-use by the indigenous people. The EAT is heavily used by Nenets reindeer herders that migrate annually across the Yamal Peninsula to summer grazing pastures (Stammler 2005). As of the 2002 census, there were about 5000 indigenous nomadic Nenets reindeer herders on the Yamal Peninsula, and as of 2008 there were 310 000 reindeer (Forbes et al 2009, Yu et al 2011, Kumpula et al 2011). The NAAT does not receive such intensive grazing pressure, but large wild populations of caribou and muskoxen are the basis of subsistence for native hunters (Griffith et al 2002, Johnson et al 2005, Joly et al 2011, Vors and Boyce 2009).
3.2. Vegetation composition
An overview of the species composition of relevés sampled in each subzone along the two transects is in the synoptic tables of the online appendix S1 (available at stacks.iop.org/ERL/7/015504/mmedia). Both transects have large groups of diagnostic taxa in subzones A and E and relatively few diagnostic taxa in the middle subzones (shaded cells in appendix S1, available at stacks.iop.org/ERL/7/015504/mmedia). The diagnostic taxa are diagnostic for subzones of a given transect when compared to other locations along the same transect. Relevés in subzone A of the NAAT have 32 diagnostic taxa (five highly diagnostic), and those in subzone A of the EAT have 37 (19 highly diagnostic).
Lists of diagnostic taxa that are shared between the relevés of both transects of each subzone are in appendix S2 (available at stacks.iop.org/ERL/7/015504/mmedia). The analysis of the geographic affinities provides further insights to the causes of the between-group similarities (table 2). The floristic information for the 51 NAAT and 26 EAT diagnostic vascular plants is in appendix S3 (available at stacks.iop.org/ERL/7/015504/mmedia). Four subzone A diagnostic taxa occur in both the NAAT and EAT (Draba subcapitata/micropetala aggr., Saxifraga cernua, Cerastium arcticum and Stereocaulon rivulorum, see appendix S2 available at stacks.iop.org/ERL/7/015504/mmedia). Most of the diagnostic taxa in subzone A are bryophytes or lichens (25 of 32 for the NAAT and 27 of 37 for the EAT). All of the diagnostic vascular plants in subzone A (7 for the NAAT and 10 for the EAT) are circumpolar species that have their northern limit in the extreme north (floristic zone 1 of Young 1971), and all are very small, low-growing cushion forbs or grasses.
Table 2. Numbers of diagnostic vascular plants, bryophytes and lichens in each subzone and combinations of subzones for the NAAT and EAT. Right side of table shows geographic distribution for the vascular plants. Categories used for of vascular-plant distribution follow Walker (1985) and are explained in the methods.
| Vascular-plant distribution | ||||||||||||||||
|---|---|---|---|---|---|---|---|---|---|---|---|---|---|---|---|---|
| Physiographic region | Geographic range | Northern limit | ||||||||||||||
| Transect and bioclimate subzones | Vascular plants | Bryophytes | Lichens | Total diagnostic taxa | Arctic | Arctic-alpine | Arctic-boreal | Coastal | Circumpolar | N. Amer.–Asia | N. Amer. | West. N Amer.–Asia–Eur | 1 | 2 | 3 | 4 |
| NAAT | ||||||||||||||||
| Subzone A: | 7 | 4 | 21 | 32 | 4 | 2 | 1 | 7 | 7 | |||||||
| Subzone B: | 5 | 4 | 1 | 10 | 4 | 1 | 4 | 1 | 4 | 1 | ||||||
| Subzone C: | 3 | 0 | 0 | 3 | 2 | 1 | 1 | 1 | 1 | 1 | 1 | 1 | ||||
| High Arctic (A +B + C) | 6 | 2 | 1 | 9 | 4 | 1 | 1 | 6 | 6 | |||||||
| Subzone D | 14 | 2 | 1 | 17 | 6 | 6 | 2 | 6 | 6 | 2 | 8 | 6 | ||||
| Middle Arctic (B +C + D) | 3 | 0 | 1 | 4 | 3 | 3 | 1 | 2 | ||||||||
| Subzone E | 8 | 8 | 8 | 24 | 1 | 7 | 7 | 1 | 1 | 5 | 2 | |||||
| Low Arctic (D + E) | 5 | 0 | 0 | 5 | 3 | 1 | 1 | 4 | 1 | 1 | 3 | 1 | ||||
| Total | 51 | 20 | 33 | 104 | 24 | 14 | 12 | 1 | 38 | 8 | 4 | 1 | 21 | 15 | 13 | 2 |
| EAT | ||||||||||||||||
| Subzone A: | 10 | 13 | 14 | 37 | 4 | 4 | 1 | 1 | 10 | 10 | ||||||
| Subzone B: | 0 | 2 | 1 | 3 | ||||||||||||
| Subzone C: | 2 | 1 | 4 | 7 | 1 | 1 | 1 | 1 | 1 | 1 | ||||||
| High Arctic (A +B + C) | 0 | 0 | 2 | 2 | ||||||||||||
| Subzone D | 1 | 0 | 1 | 2 | 1 | 1 | 1 | |||||||||
| Middle Arctic (B +C + D) | 2 | 0 | 3 | 5 | 2 | 2 | 1 | |||||||||
| Subzone E | 9 | 1 | 2 | 12 | 9 | 7 | 1 | 1 | 1 | 5 | 3 | |||||
| Low Arctic (D + E) | 0 | 2 | 1 | 3 | ||||||||||||
| Yamal Peninsula (B, C, D, E) | 2 | 3 | 5 | 10 | 2 | 1 | 1 | 1 | 1 | |||||||
| Total | 26 | 22 | 33 | 81 | 8 | 5 | 12 | 1 | 22 | 3 | 0 | 1 | 12 | 3 | 7 | 3 |
Both transects also have a large group of diagnostic taxa in subzone E (24 for the NAAT, and 12 for the EAT). Of these, seven are shared diagnostic taxa (Betula nana ssp. nana/exilis aggr., Ledum palustre, Empetrum nigrum, Pleurozium schreberi, Salix pulchra/phylicifolia aggr., Petasites frigidus, and Pedicularis lapponica) (appendix S1 available at stacks.iop.org/ERL/7/015504/mmedia). Most of the diagnostic vascular plants in subzone E are Arctic-boreal species (7 of 8 for the NAAT, and 9 of 9 for the EAT), which are typically found in acidic boreal forests and Low Arctic tundra (subzones D and E). All are circumpolar, and most have their northern limit in the Low Arctic (7 of 8 on the NAAT, and 8 of 9 on the EAT) (table 3). Many of the diagnostic species are erect shrubs (e.g., Betula nana ssp. nana/exilis aggr., Ledum palustre, Empetrum nigrum, Salix pulchra/phylicifolia aggr. Vaccinium uliginosum ssp, uliginosum/microphyllum aggr.). The similarity at the ends of the transects is caused in part by the abundance of circumpolar species at both ends. Bioclimate subzone A has a small total area (about 2% of the total Arctic) and only about 50 total vascular-plant species with mostly circumpolar distributions. Subzone E has a great deal of taxonomic similarity across the Arctic because of its proximity of the circumboreal forest and the acidic boreal understory flora that spread northward with treeline during previous warm intervals (Yurtsev 1994).
Table 3. Floristic-similarity matrix. Values are per cent similarity calculated in PERMANOVA (Permutational ANOVA) analysis (PRIMER), with presence–absence species transform. Top value within each column (*) is the within-group similarity (mean similarity of all pairs of relevés within the given transect–subzone group). Other values are between-group similarities (mean similarity of all pairs of relevés, with one of the pair coming from the column group and one from the row group, all significant at p < 0.01). Cells with values in bold nonitalics are between-transect similarities within subzones. Cells with values in italic are within-transect similarities of subzone relevé-groups of the NAAT, and cells with bold italic values are within-transect similarities of subzone relevé groups of the EAT.
| Subzone A | Subzone B | Subzone C | Subzone D | Subzone E | |||||||
|---|---|---|---|---|---|---|---|---|---|---|---|
| NAAT | EAT | NAAT | EAT | NAAT | EAT | NAAT | EAT | NAAT | EAT | ||
| Subzone A | NAAT | 49* | |||||||||
| EAT | 21 | 71* | |||||||||
| Subzone B | NAAT | 38 | 27 | 41* | |||||||
| EAT | 9 | 10 | 13 | 44* | |||||||
| Subzone C | NAAT | 10 | 13 | 18 | 6 | 25* | |||||
| EAT | 13 | 12 | 16 | 40 | 5 | 66* | |||||
| Subzone D | NAAT | 8 | 16 | 14 | 10 | 16 | 12 | 41* | |||
| EAT | 10 | 12 | 13 | 38 | 5 | 50 | 12 | 56* | |||
| Subzone E | NAAT | 5 | 7 | 7 | 22 | 4 | 35 | 12 | 38 | 54* | |
| EAT | 6 | 9 | 10 | 34 | 4 | 46 | 11 | 52 | 42 | 65* | |
The relatively few diagnostic taxa in subzones B, C, and D of the transects reflects the greater level of similarity of the floras of these subzones (table 2). In subzone B, there are 10 diagnostic vascular plants in the NAAT and 3 in the EAT; in subzone C there are 3 (NAAT) and 7 (EAT), and in subzone D there are 17 (NAAT) and 2 (EAT) (table 3). The 17 diagnostic vascular taxa in subzone D of the NAAT are nearly all species with restricted Beringian (North American–Asia) or North American distributions and are basiphilous species that grow in the calcareous loess soils of northern Alaska (appendix S2 available at stacks.iop.org/ERL/7/015504/mmedia). There are also three diagnostic taxa that are widespread in the middle part of the NAAT (Dryas integrifolia, Salix arctica and Saxifraga oppositifolia). D. integrifolia is often a dominant plant especially in subzone C.
Table 3 provides the results of the analysis of floristic similarity between groups of relevés within each combination of subzone and transect when the floristic data from the two transects were combined into a single species matrix. Within-group similarity (*) is greater for the EAT subzone relevé groups (44–71% similarity) than for the NAAT subzone groups (25–54%). Contributing factors for this are the larger number of relevés in the NAAT, sometimes coming from more than one location and from more heterogeneous sites with patterned ground. The bold nonitalics in table 3 show the within-subzone similarity of NAAT and EAT relevés. The NAAT and EAT relevés were most similar in subzone E (42% similar), somewhat similar at the northern end (21%), and least similar in the middle (B, 13%; C, 5%; and D, 12%) (bold nonitalics in table 3). In most cases, relevés in a given subzone within a transect are most similar to relevés in adjacent subzones and increasingly dissimilar to those in more distant subzones. For example, relevés in NAAT subzone A are most similar (38%) to those in NAAT subzone B and ≤10% similar to those in all other NAAT subzones. EAT Subzone A has generally low similarity (≤12%) to all other EAT subzones probably because of the extreme climate, unique geology, and its isolation 850 km from the next nearest EAT location. Interestingly, EAT subzone A has markedly higher similarity to NAAT subzones A (21%) and B (27%) than to any of the subzones in the EAT (≤16%); a contributing factor is likely the circumpolar flora that is shared between these extreme High Arctic locations. NAAT subzone B, C, D and E locations have relatively low floristic similarity to each other (4–18%) because of their varied locations on the mainland and scattered islands with different substrates. This is particularly pronounced for NAAT Subzone E, which has low similarity (4–12%) with all other NAAT subzones—it is the only NAAT subzone with acidic soils and an oligotrophic, dominantly boreal flora. This is in contrast to EAT subzones B, C, D and E, which all have relatively high similarity to each other (34–52%) because of relatively homogeneous substrates and similar local floras across the length of the Yamal Peninsula (table 1).
3.3. Biomass
Total aboveground biomass on zonal sites is summarized in figure 4 (tabular summary is in appendix S4, available at stacks.iop.org/ERL/7/015504/mmedia). Figure 5 shows photographs of vegetation at the main study sites to give some impression of the visual differences in the physiognomy of the vegetation. The NAAT has generally lower landscape-level biomass in all subzones than the EAT (figures 4 and 6), and the differences are greatest in subzones B and C (figure 4). Figures 4 and 6 indicate that the NAAT subzone A location has higher biomass than the EAT subzone A location. Subzone A has low biomass on both transects (171 g m−2 at Isachsen of the NAAT and 108 g m−2 at Krenkel Station of the EAT) (appendix S4 available at stacks.iop.org/ERL/7/015504/mmedia). However, we do not include the biomass of the dead moss, dead lichen and biological soils crusts in the data presented here because of contamination by eolian mineral material in several of the dead-moss fractions and the difficulty of separating biological soil crusts from the underlying substrate. If the crusts were included, the biomass at Krenkel would be much higher. Biological soil crusts are common in the High Arctic, but they usually occur more locally, often in association with well-irrigated snowflush areas, such as those at Devon Island, where the effects of crusts on soil temperatures, nutrient regimes and plant processes have been documented (Bliss and Gold 1999, Gold 1998). The crusts on Hayes Island are much more abundant, occurring on most surfaces (figure 7). They covered 20–67% of the ground surface in our biomass harvest plots, and obviously constituted a large portion of the total biomass (Walker et al 2011a). Normally, the biomass of biological soil crusts is hard to determine because of the difficulty of separating the crusts from the substrate. We did not attempt to determine the biomass of the crusts along the NAAT or at most sites of the EAT. At Krenkel, however, we devised a method to separate the crusts from the soil. The sandy soils lent themselves to a measurement of the biomass because the sand particles could be separated from the crusts using the floatation method outlined in appendix S6 (available at stacks.iop.org/ERL/7/015504/mmedia). We estimated 98 g m−2 mean soil crust biomass at the zonal site and 221 g m−2 at the sandy site. This was nearly equal to the non-crust aboveground biomass on the zonal site (108 g m−2) and was more than double the non-crust biomass on the sandy site (95 g m−2). This is important with reference to figure 6, because if the biological soil crusts were considered, they would raise the biomass at the cold extreme of the EAT regression line considerably higher in comparison to the more continental NAAT subzone A site at Isachsen. We also recorded much higher than expected NDVI with the hand-held spectrometer (average NDVI = 0.43 at the Krenkel zonal site and 0.49 for the sandy site) (appendix S5 available at stacks.iop.org/ERL/7/015504/mmedia). The EAT hand-held NDVI values in subzone A values are higher than at all NAAT sites in subzones A, B and C (appendix S5 available at stacks.iop.org/ERL/7/015504/mmedia). The unexpectedly high hand-held NDVI values of the EAT subzone A sites may be due to the continuously wet condition of the crusts at this location. A study of desert soil crusts reported an NDVI of 0.32 for wet crusts, triple that of dry desert soil crusts (Karnieli et al 2001). A combination of the large component of biological soil crusts and the continuously wet soil conditions contributed to the high hand-held NDVI readings at Krenkel.
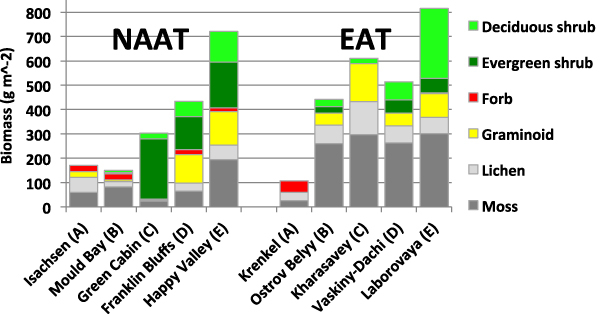
Figure 4. Total aboveground biomass of zonal vegetation at the Eurasia Arctic transect sites and the most representative zonal sites along the North America Arctic transect. Biomass of all the NAAT sites is reported in appendix A4 (available at stacks.iop.org/ERL/7/015504/mmedia). Values exclude biomass of dead moss, dead lichen, detached dead and biological soil crusts. Bioclimate subzones (A–E) are shown for each site.
Download figure:
Standard image
Figure 5. Zonal vegetation at representative sites along the North America and Eurasia Arctic transects.
Download figure:
Standard image
Figure 6. Total aboveground biomass versus summer warmth index (SWIs) along the North America Arctic transect (NAAT) and the Eurasia Arctic transect (EAT).
Download figure:
Standard image
Figure 7. Krenkel Site-2, EAT subzone A, Hayes Island, Franz Josef Land, Russia. Note the sparse cover of vascular plants and extensive black biological soil crusts, which cover the lighter colored alluvial-marine sands and which form the majority of the total biomass at this site. Also note the deep snow remaining in drainages on 7 Aug 2011, and the small ice cap in the upper left corner of the photo, indicative of the very cold and snowy climate(1 °C mean July temperature, and 211 mm mean snow water equivalent). See table 1 for comparison with the NAAT subzone A location at Isachsen, Canada.
Download figure:
Standard imageFurther south, there are also structural dissimilarities in the vegetation of the two transects, particularly in the central part of the transects in subzones B, C and D. Along the EAT, relevés in these three subzone have similar biomass (442–610 g m−2), large components of moss (261–297 g m−2), lichens (69–136 g m−2) and deciduous shrubs (22–74 g m−2), and relatively small evergreen shrub components (0–52 g m−2) compared to the NAAT sites.
The relationship between AVHRR-NDVI and SWI (figure 8, appendix S4 available at stacks.iop.org/ERL/7/015504/mmedia) is similar to the relationship between aboveground biomass and SWI (figure 6) with generally lower NDVI along the NAAT at comparable summer temperatures. There are likely multiple causes of the lower biomass and NDVI in the central part of the NAAT (subzone C and D). The NAAT has less than half the total precipitation at equivalent EAT sites. The more continental climate, extensive well-developed patterned-ground features, and calcareous soils all contribute to lower biomass on zonal sites of the NAAT at equivalent summer temperatures. Compared to acidic tundra, nonacidic tundra generally has high cover of bare soil, a large component of erect dead sedge leaves such as Carex bigelowii, relatively low biomass of deciduous shrubs, and high biomass of the prostrate evergreen shrubs (Bockheim et al 1998, Gough et al 2000) (Hobbie et al 2005, Walker et al 1998, 2001, 2003). Most of the shrub biomass in nonacidic tundra is composed of the evergreen shrub Dryas integrifolia, which has abundant non-green dead leaves and stems; whereas the biomass of the sandy acidic soils of the EAT has relatively large components of moss and deciduous shrubs. Numerous studies at several spatial scales in northern Alaska have shown that the NDVI of nonacidic tundra is lower than that of acidic tundra (e.g., Raynolds et al 2006, Shippert et al 1995, Walker et al 1995, 1998).
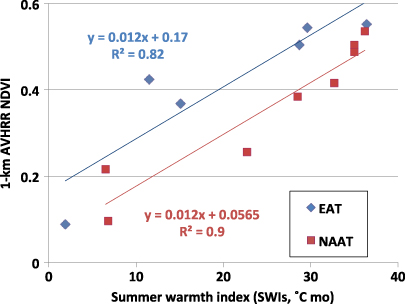
Figure 8. 1 km AVHRR-NDVI versus summer warmth index (SWIs) along the North America Arctic transect (NAAT) and the Eurasia Arctic Transect (EAT).
Download figure:
Standard image3.4. LAI versus biomass
The LAI values are close to zero at the Isachsen, Mould Bay (NAAT) and Krenkel (EAT) sites (figure 9). The very low LAI values in these extreme northern areas are partially caused by the position of the optical sensor on the instrument used for measurement (LAI-2000, Li-Cor), which is located 2 cm above the ground surface when the instrument arm sits flat on the ground, so it is unable to record leaf area of plant canopies that are less than 2 cm tall. Much of the biomass in high Arctic tundra is in the moss and lichen layer, including the biological soil crusts discussed in the last section, so most of the 'LAI' of this layer is usually not recorded. Compared to the NAAT, the EAT has a greater proportion of the total biomass in the moss and lichen layer of subzones B, C, D and E (figure 4), so the recorded LAI values are also comparatively low. At the higher biomass levels in subzone E, the NAAT LAI is about 70% greater than that of the EAT. The higher LAI in subzones D and E of the NAAT is partly caused by a greater proportion of graminoids (figure 4), which have a large component of erect dead leaves that contributes to the higher LAI, when measured by the LAI-2000 (which cannot distinguish live from dead tissue or photosynthetic from non-photosynthetic) (figure 9) but relatively low NDVI (figures 6 and 8). Intensive reindeer grazing along the EAT likely contributes to this pattern. Numerous studies have shown that during summer, the reindeer preferentially graze the sedges, dwarf shrubs and forbs, leaving the mosses (Bråthen and Oksanen 2001, Pajunen et al 2008, Kitti et al 2009). This very likely opens up the canopies for further moss growth (Bråthen and Oksanen 2001, Yu et al 2011). On the other hand, when erect willows (Salix spp.) are already taller than the reindeer browse line (1.8 m), evidence from the EAT tundra reveals that annual shrub growth has increased in recent decades (Forbes et al 2010). Although the LAI values do not accurately record the true photosynthetic leaf area of low-statured tundra sites, they do demonstrate how some rather subtle differences in vegetation structure can impact instrumental measurement of biophysical properties of the vegetation.

Figure 9. Leaf area index versus total aboveground biomass along the North America Arctic transect (NAAT) and the Eurasia Arctic Transect (EAT).
Download figure:
Standard image3.5. Application of the data to determine spatial and temporal variation of Arctic NDVI and biomass
AVHRR-NDVI is highly correlated with aboveground biomass along both transects (r2 = 0.96 for the EAT and 0.91 for the NAAT) (Raynolds et al 2012). The NDVI-biomass regressions for both transects are closely parallel and separated by a difference of only about 0.04 AVHRR-NDVI units despite major differences in topography, geology, precipitation regimes, soil, disturbance regimes, vegetation composition and structure. The close correspondence between the AVHRR-NDVI and zonal aboveground biomass along both transects gives us increased confidence that the AVHRR satellites are providing data that can be used to map the distribution of tundra biomass (e.g., Epstein et al 2012).
The ground and satellite information from the transects also help to explain temporal differences that have been noted in the NDVI of North America and parts of Eurasia (Bhatt et al 2010). For example, during the period 1982–2008 the maximum NDVI (MaxNDVI) reached each summer in the tundra areas adjacent to the Beaufort Sea near the NAAT increased 14%; this corresponds to a 32% reduction in the May–Aug sea ice within 50 km of the Beaufort sea coast and a 16% increase in the summer warmth index of the tundra land surfaces during the same time period. This contrasts with the tundra areas adjacent to the Kara Sea in the vicinity of the EAT, where the MaxNDVI has increased about 1% (some local areas showed negative trends), corresponding to a 40% reduction in sea ice and a 4% decline in the SWIs. The decline in summer land temperature along the EAT is inconsistent with general patterns observed across most of the Arctic, where land-surface temperatures and MaxNDVI have generally increased strongly (Bhatt et al 2010). One possible explanation for the reduced SWI and very slight positive to negative NDVI trend in the vicinity of the EAT comes from our preliminary analysis of snow water equivalent trends using SSM/I satellite data, which indicate large increases in springtime (Mar–Apr) snow in parts of West Siberia. Ground observations along the EAT indicate much greater winter precipitation and a delayed snowmelt compared to the NAAT, which may be causing the decline in total thawing degree months. Structural differences in the vegetation of the two transects also likely affect the NDVI temporal trends. The large component of moss along the EAT may be contributing to the relatively small changes in NDVI by providing a strong buffer to temperature changes in rooting zone of plants, whereas less moss, more open plant canopies, and richer soils along the NAAT create ecosystems that respond more readily to warming.
4. Conclusions
The two transects have broadly similar summer temperature regimes and overall vegetation physiognomy, but strong differences in the soil pH, disturbance regimes and precipitation, especially winter precipitation. These site differences cause important differences in the relative abundance of the major plant functional types and total aboveground plant biomass. The transects are floristically and structurally most similar at the ends of the transects (bioclimate subzones A and E), where they share similar soil pH and a large groups of circumpolar plant species. They are most different in the middle subzones (B, C and D), where there are strong contrasts in soil pH and basiphilous versus acidophilus floras.
Important differences in productivity and NDVI are associated with acidic (EAT) versus nonacidic (NAAT) soils and relatively maritime (EAT) versus more continental (NAAT) climates of the transects. Much of the difference in biomass and NDVI of the two transects appear to be caused by differences in the biomass of the moss layer, which is much greater along the EAT, and evergreen shrubs, which are more abundant along the NAAT transect. The relative continentality of the NAAT is due largely to more abundant sea ice for much of the year, but this could change rapidly as the sea ice melts.
Our experience in zonal habitats across the Arctic indicates that it is feasible to monitor changes in zonal vegetation biomass and composition along the full Arctic climate gradient. The research sites are permanently marked and could provide a baseline against which to measure future vegetation change.
The methods of sampling biomass, NDVI and LAI could be refined further to better sample the dead mosses and lichens and to include biological soil crusts. Additional data collected along a third transect or at other under-sampled areas of the Arctic would help provide a more complete analysis of vegetation-NDVI relationships in the Arctic.
Acknowledgments
Olga Afonina, Aleksei Potemkin and Mikhael Zhurbenko verified and identified the bryophytes and lichens. Chien-Lu Ping and Gary Michaelson provided chemical and physical analysis of the soils. Vladimir Romanovsky provided climate data for the NAAT. Numerous other investigators and field assistants helped with the data collection, analysis of results and conceptual discussions along the NAAT, including Milan Chytrý, Ronnie Daanen, Grizelle Gonzalez, William Gould, Jamie Hollingsworth, Elina Kaarlejärvi, Anja Kade, Alexia Kelley, Lindsey Kiesz, Julie Knudson, William Krantz, Nadya Matveyeva, Katie Mohrmann, Corinne Munger, Pavel Orekhov, Rorik Peterson, Mariah Phelps, Galina Popova, Yuri Shur, Charles Tarnocai, Ina Timling and Daniel Walker. We furthermore thank VECO Polar Resources (now CH2MHill) and Aklak Air for logistical support along the NAAT, and Parks Canada and the Innuvialuit community for supporting our study on their lands. The authors also acknowledge the generous support of the US National Science Foundation grants OPP-0120736 and ARC-0425517 and National Atmospheric and Space Administration grants NNG6GE00A and NNX09AK56G to DAW, a German Research Foundation grant to F J A Daniëls, and a Swiss National Science Foundation grant PBBE2-108513 to CMV. MK was supported from grant AV0Z60050516 from the Czech Academy of Science.