

Abstract
Contemporary drought impact assessments have been constrained due to data availability, leading to an incomplete representation of impact trends. To address this, we present a novel method for the comprehensive and near-real-time monitoring of drought socio-economic impacts based on media reports. We tested its application using the case of the exceptional 2018/19 German drought. By employing text mining techniques, 4839 impact statements were identified, relating to livestock, agriculture, forestry, fires, recreation, energy and transport sectors. An accuracy of 95.6% was obtained for their automatic classification. Furthermore, high levels of performance in terms of spatial and temporal precision were found when validating our results against independent data (e.g. soil moisture, average precipitation, population interest in droughts, crop yield and forest fire statistics). The findings highlight the applicability of media data for rapidly and accurately monitoring the propagation of drought consequences over time and space. We anticipate our method to be used as a starting point for an impact-based early warning system.
Export citation and abstract BibTeX RIS

Original content from this work may be used under the terms of the Creative Commons Attribution 4.0 license. Any further distribution of this work must maintain attribution to the author(s) and the title of the work, journal citation and DOI.
1. Introduction
Droughts are among the costliest disasters worldwide given their large spatiotemporal extent, indirect impacts and cascading effects (Grillakis 2019, Wens et al 2019). Due to climate change, more frequent and longer-lasting meteorological, hydrological and soil moisture droughts are anticipated in Europe (Spinoni et al 2018, Samaniego et al 2018, Marx et al 2018, IPCC 2018, Grillakis 2019). Within this context, the European drought of 2018, which persisted until 2019 (Drouard et al 2019, JRC 2019), is of particular interest. For some (Toreti et al 2019, Mastrotheodoros et al 2020), it may be considered a new reference for droughts in Central Europe given the extent of ecosystem damage and crop yield losses.
Despite their severe social and economic losses, drought consequences remain largely unexplored. This is due to the difficulties involved in quantifying their impacts (Spinoni et al 2019, Hall and Leng 2019) as droughts have a slow onset, lagged effects and non-structural impacts (Dai 2011). Additionally, given their interconnectedness, impacts may even occur outside the hazard-affected area (Bachmair et al 2015) and are often amplified by compound hazards (Aghakouchak et al 2018). As a result, drought risk management often lacks reliable information on this.
Existing drought impact assessments are constrained due to data availability. They are either too focused on specific impact types or, if comprehensive, too time-consuming. Empirical impact assessments generally focus on crop yields (Zhang et al 2017, Webber et al 2018, Kukal and Irmak 2018) or vegetation indexes (Fang et al 2019), which are immediately observable and easier to quantify. More comprehensive databases, such as the European Drought Impact Inventory (EDII) (Stahl et al 2016) or the U.S. Drought Impact Reporter (DIR) (NDMC 2019), are sparse. Despite their advancements, these initiatives are often project-based and rely on the manual classification of impacts based on news, reports and academic sources. Furthermore, the impact data used in these studies are limited in terms of temporal and spatial homogeneity. This restricts their validation as the dataset completeness varies to a significant degree. Hence, the most limiting weakness in existing drought impact databases, almost across the board, is the difficulty involved in validating the results. In virtually all drought impact assessment studies that target multiple sectors, validation is not performed. This dampens the generation of specific policy recommendations, and thus, only high-level policy statements can be made with confidence.
Systematic and accurate knowledge of the socioeconomic cross-sectoral impacts of drought is, therefore, considered a missing link for managing drought risk (Stahl et al 2016, Pendergrass et al 2020). Only through such, it is possible to move from hazard to drought impact forecasting (Sutanto et al 2019). Thus, efforts to collect and validate standardised and near-real-time impact information are imperative for establishing response measures and long-term adaptation strategies (Bachmair et al 2016).
We, therefore, propose a method for the near-real-time assessment of multi-sectoral drought impacts. More specifically, we developed a simple yet systematic and reproducible method, which allows to rapidly assess socio-economic impacts based on the text mining of media statements. A focus is given to the corollary impacts on livestock, agriculture, forestry, recreation, fires, waterborne transportation and energy distribution. Given the wide geographical coverage of newspaper articles, we are able to assess localised (i.e. district-specific) impacts across large areas. To validate our results, we (1) evaluated the automatic impact classification system, (2) assessed spatial biases and (3) validated impact results against a series of independent data (e.g. soil moisture, precipitation, crop yields).
To our knowledge, this is the first study that reports, with demonstrated accuracy, an approach for the near-real-time monitoring of drought effects. The generated database contains an unprecedented level of spatial and temporal detail. We anticipate our method to provide the foundation for an impact-based early warning system, providing targeted information for responding to and preparing for droughts. Such a system will substantially improve drought risk management in the future.
The proposed framework is illustrated through the case of the 2018/19 German drought. This event was chosen as a case study because it affected about 90% of the German territory (Mühr et al 2018), placing the country third in the world in terms of disaster impacts in 2018 (Eckstein et al 2019).
2. Methods
2.1. Newspaper sample selection
Similar to other efforts (e.g. U.S. DIR; EDII), media reports were used to assess the 2018/19 German drought impacts. Data were collected from a news aggregator database (genios.de), considering articles published between 1 April 2018 and 31 August 2019. A total of 21 890 news were retrieved using the search terms drought* OR dryness* (Dürre and Trockenheit in German). To improve the efficiency of the analysis while at the same time ensuring data coverage and geographical equity, only the newspapers with the highest absolute number of drought articles were selected. Hence, one newspaper with national circulation, as well as one regional newspaper for each of the 16 German states were included (Sup. table 1). This reduced the sample to 5074 articles. Articles with a similarity higher than 90% and that differed by a maximum of 30 characters were considered identical and thus only one was kept. In the end, 3010 articles were considered.
2.2. Classification scheme
The collected news articles were classified according to their: (1) reference, including newspaper name and article date; (2) location of the impact at the scale 1 (state) and/or 3 (district) of the European Union Nomenclature of Territorial Units for Statistics (NUTS), or name of rivers; and (3) impact class according to Sup. table 2.
In order to classify the articles and extract relevant information, a series of natural language processing tools were used. First, the 3010 articles were converted from pdf files into plain text and tokenised into sentences with lowercase letters. Then, article dates and impact locations were extracted by searching for date patterns and the locations mentioned. We then removed stop words and conducted a word frequency and co-occurrence analysis (i.e. an analysis of words that appear together in the same sentence). This allowed us to identify 25 drought impact classes. Hence, instead of using pre-established categories and keywords for coding, they were defined inductively. This reduced bias in the search strategy as we did not rely on a predetermined set of articles or classes (Grames et al 2019). Consequently, impact classes that are rarely considered (e.g. positive and recreation impacts) were included and others were deemed irrelevant (e.g. aquaculture).
In the next step, a classification system was created to estimate if each sentence was related to any of the considered impact classes. Similar to the definition of the impact classes, the combination of keywords (Sup. table 2) used for classifying the articles was defined based on the analysis of word frequencies and their co-occurrence network. By doing so, we avoided omitting synonymous keywords. Regular expression matching (i.e. and, or, not operators) was used to identify sentences where these keywords occurred and tag them as related to a given impact class. All coding was done in R.
2.3. Validation
All 3010 articles were read to validate the automatic classification and account for missing impacts. The classification codes were modified iteratively during this process. After a careful analysis, 1117 articles were disregarded as no impacts and/or location were mentioned or they reported about hypothetical situations or past droughts (Sup. figure 1 (available at stacks.iop.org/ERL/15/1040a9/mmedia)). Furthermore, 136 false positives (i.e. articles that were in the sample but focused on topics other than droughts) were identified. 210 articles that reported about drought impacts on fisheries, water supply and water quality were not considered as these impacts are usually localised and, thus, reported mainly by local newspapers. After manually tagging the articles, the accuracy of the automatic classification was calculated by considering all 3010 articles.
To account for any bias in the newspaper publishing style and to verify the sample reliability, a normalization was carried out using the absolute number of all articles published in each newspaper during the covered period. This allowed us to verify whether the sample was sensitive to the reporting of drought or whether a high number of articles was due to the newspaper publishing tradition. Furthermore, bias regarding the newspapers' geographical coverage (e.g. the Nordbayerischer Kurier reports mainly about northern Bavaria) was investigated by performing a global ordinary least squares (OLS) linear regression.
Spearman's rho correlation coefficients were calculated between the impact occurrences in each state and: (1) the accumulated drought magnitude (DM), which was derived from the monthly soil moisture index at 0–25 cm (Zink et al 2016). Details on how to compute the DM are provided by Samaniego et al (Samaniego et al 2013). DM values were computed for each state and month; (2) the difference (Δ) in % in grain yields per ha, Δ of cultivated areas (ha) and Δ of harvest quantities for 2018 and 2019 when compared to the previous years (BMEL 2018, 2019a). In 2018, the German Federal Ministry of Food and Agriculture (BMEL) computed Δ using the 2015–2017 harvests and the 2018 harvest (Sept 2017–Aug 2018). In 2019 BMEL derived Δ based on 2012–2018 and 2019 data (Sept 2018–Aug 2019). Barley, rye, oat, triticale and winter and summer wheat are considered, while corn and corn-cob-mix are disregarded; (3) the population's interest in droughts obtained using Google Trends as proposed by Kim et al (Kim et al 2019); (4) the number of forest fire occurrences (BZL 2019); and (5) the accumulated precipitation between April 2018 and August 2019. Additionally, temporal correlations were determined by comparing the DM and the number of MIS.
The probability of detection (POD) and false alarm rate (FAR) were used for the quantitative comparison of the DM and the Δ in grain yields per ha versus our agriculture and crop loss media impact data in 2019. The POD (perfect = 1) represents the fraction of observed drought impacts that is correctly detected, whereas the FAR (perfect = 0) describes the fraction of impacts that is not confirmed by the observations. To compute these metrics, the observed data and computed impacts at the NUTS 1 level were normalised to a common scale considering equal intervals.
2.4. Data analysis
The final sample contained 1547 unique articles that contained specific details about the location and consequences of the 2018/19 German drought (Sup. figure 1). An article was converted into several media impact statement (MIS) entries when it (1) stated impacts in several districts or federal states, or (2) mentioned several impact subcategories. The resulting inventory was analysed and summarised according to the MIS spatial and temporal distribution.
3. Results
3.1. Impacts of the 2018–19 drought event in Germany over time
Based on the text mining of 5074 journal articles, 4839 MIS about the 2018/19 drought consequences in Germany were identified. The MIS consist of news articles that contain details about the type and location of the drought impacts. They were collected from 17 newspapers and automatically classified into 25 categories using keywords derived from a textual analysis (Sup. table 2). They were then mapped according to the NUTS 1 and 3 scales (Sup. figure 2).
Figure 1 shows the MIS monthly distribution, whereas Sup. table 3 provides information regarding their subcategories. Most of the MIS occurred in July 2018 (n = 976) followed by June 2018 (n = 788). Overall, the forestry (32.3%) and agriculture (29.0%) sectors had the highest number of MIS. Still, corollary effects such as drought-aggravated fires (6.5%), pests (7.7%) and recreation (7.0%) were also reported.

Figure 1. Number of MIS per category. The 'Others' class corresponds to the sum of positive impacts, conflicts and environmental problems (see Sup. table 1).
Download figure:
Standard image High-resolution imageWith regard to agriculture, the harvest of cereal, barley and rapeseed started earlier as a result of the compound effects of the soil moisture drought and a heatwave (Drouard et al 2019). Therefore, crop losses (n = 269, 48.9%) and early harvesting MIS (n = 95, 61.3%), occurred mostly between June and July 2018 (BMEL 2019a). During winter, economic loss and financial aid MIS were predominant (n = 182, 79.1% of all agriculture MIS between November and January). The drought also generated positive impacts for selected farmers. Particularly, fruit growers and winemakers had an above-average harvest (Erfurt et al 2019).
June and July 2018 coincided with a peak in MIS about feed shortages (n = 184, 43.7%). To cope with this, the government permitted the mowing and, in some cases, the growing of catch crops in ecological conservation areas (BMEL 2019b). Still, a shortage of feed was widely reported, even during winter. As a consequence, livestock was sold, leading to a drop in market prices for meat. Furthermore, due to the heatwave in July 2018, milk production plummeted. Most of the statements about reduced productivity of livestock farming were published in August, September and October 2018 (n = 50, 49.0%).
Even though the 2018 meteorological drought supersedes the 2019 event in terms of intensity, in 2019 the soil moisture drought in the lower layers was greater than in 2018 (see Sup. figure 3). As a result, clear differences can be observed regarding the affected sectors in each year (figure 2). Indeed, while agriculture MIS were predominant in 2018 (n = 1043, 32.4% of all 2018 MIS), in 2019 the number of forestry MIS was higher (n = 677, 41.8% of all 2019 MIS). When considering both years, forestry (n = 1562) surpassed agriculture (n = 1402). This can be expected given that droughts have long-term effects on forests (Julio Camarero et al 2018), whereas agriculture impacts tend to be immediate. A quarter (n = 373, 23.9%) of the forestry sector MIS were secondary impacts due to pests (e.g. bark beetles) and diseases (e.g. fungi) that were amplified due to the drought. In addition to the reduced tree growth caused by the dry conditions, drought-induced forest fires were also widespread, especially in July 2018 (n = 137, 43.8%).
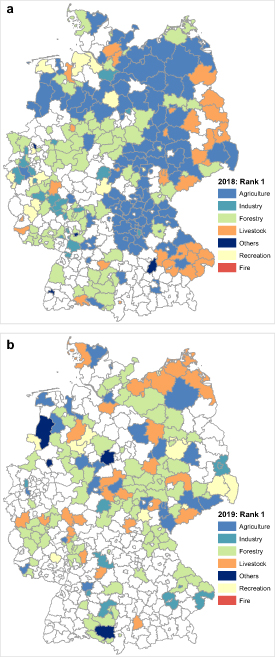
Figure 2. Most frequent MIS in each district in: a 2018 and b 2019. Only MIS at the NUTS 3 scale are included. Ties were not considered.
Download figure:
Standard image High-resolution imageSince hydrological droughts (i.e. reduced streamflow) take longer to develop, energy, industry and transport MIS were reported later, especially in October 2018 (n = 67). These MIS refer mainly to restrictions in the transportation of goods and impairment of ferries due to low water levels. This led to cascading effects, including an increase in energy prices in autumn (Erfurt et al 2019).
With regard to recreation, 51.6% (n = 175) of the MIS were reported during July and August 2018. They are mostly related to restrictions in the use of fireworks during festivals to reduce the risk of forest fires. Additionally, in some districts, barbecuing in parks was banned and the use of water for watering lawns and filling private swimming pools was forbidden. In 2019, recreational MIS corresponded mainly to restrictions on forest visitors due to the risk of falling branches.
3.2. Spatial distribution of the impacts
When considering the spatial distribution of the MIS (figures 3, 4 and Sup. Material 1), the east of Germany had the highest number of MIS as well as a large diversity of impact categories. The MIS have a clear heterogeneous regional distribution (figure 3(a)). For instance, energy and transportation MIS were concentrated in Rhineland-Palatinate, North Rhine-Westphalia and Hamburg. This can be explained by the density of industries in those states and the location of important ports on the Rhine (n = 37, 41.6% of all MIS on transportation that contain river locations), Elbe (n = 22, 24.7%), Danube and Oder (both with n = 5, 5.6%). As expected, in the city-states of Berlin and Hamburg impacts related to agriculture were relatively low (Sup. figures 4 and 5). MIS on abrupt tree growth reductions, dieback of trees as well as forest and wildfires were widely spread across the country. In both southwest and northwest Germany, forestry was the most affected sector (figure 4). It accounted for more than 50% of all MIS in Saarland, Baden-Württemberg and Rhineland-Palatinate.

Figure 3. Geographic distribution of the MIS. a Statements by category. The circle sizes indicate the number of MIS in each district. Positive MIS, conflicts and environmental problems were ignored. b Absolute number of all MIS. In both maps, only data at the NUTS 3 scale are included.
Download figure:
Standard image High-resolution image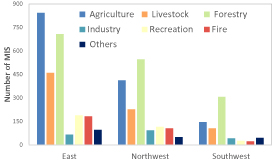
Figure 4. Sum of MIS in each region sorted by impact categories.
Download figure:
Standard image High-resolution image3.3. Economic impacts
In terms of statements about economic impacts, agriculture was the sector with most MIS (n = 309, 52.8% of all economic loss MIS) (Sup. table 3). The economic visibility of drought-induced agricultural impacts has previously been reported (Stahl et al 2016). This relevance is also reflected in the high number of drought-related crop yield studies (Zhang et al 2017, Webber et al 2018, Kukal and Irmak 2018) and drought monitoring systems that target agriculture (e.g. Monitoring Agricultural Resources and the Weekly Weather and Crop Bulletin). The seemingly high agriculture-related economic losses are partly explained by the high economic value of the sector. Another contributing factor could be the minor role drought insurance plays in Germany, where only 0.1% of arable land is insured (VVaG 2018). Conversely, the higher visibility of these economic losses might be attributed to the strong and well-organised farming associations that push their agenda into the media spotlight.
In comparison, the number of economic loss MIS about forestry was lower (n = 168, 28.7% of all economic loss MIS). However, impacts will still be felt for years to come (BMEL 2019b, Schuldt et al 2020). This is because drought effects on forests may last longer as they reduce forest productivity, slow down tree growth and deteriorate their vigour (Peltier et al 2016). Experimental results show that some species recover from drought after 1–5 years, while others might maintain reduced growth rates for decades (Yin and Bauerle 2017). For instance, pines, which are the second most widespread species in Germany (BMEL 2015), exhibited a great drought legacy in Spain with long-lasting effects on forest productivity (Julio Camarero et al 2018). In addition, the drought-weakened trees are more susceptible to pests (Bennett et al 2015), which can further exacerbate economic losses.
Even though impacts on the transport and industry sector were high due to impaired industrial production and interruptions to waterborne transportation (Erfurt et al 2019), the number of MIS was low (n = 24, 4.1%). This suggests that other methods are need to assess the magnitude of drought-related economic impacts.
3.4. Validation and evaluation
To validate the obtained MIS results we (1) evaluated the accuracy of the automatic classification system; (2) verified spatial biases caused by the newspaper sample selection and its geographical distribution; and (3) validated our results against a series of independent data, including official statistics on fires and crop losses, as well as, soil moisture, precipitation and population interest in droughts data.
The automatic classification of the MIS was accurate in 95.6% of the cases, with an average standard deviation of 3.1% for the 25 impact subcategories (table 1 and Sup. table 4). 96.6% of the false positives were correctly identified. Most of the misclassifications correspond to generic articles where impacts are described but no specific location is provided. Overall, MIS subcategories such as impaired production of power plants and conflicts over water allocation presented the highest levels of accuracy (99.4% and 99.1%, respectively). Conversely, MIS about recreation and crop losses were overestimated (accuracy of 90.4% and 87.7%, respectively).
Table 1. Automatic classification accuracy (%) for different MIS classes. Accuracy results for all MIS sub-categories is given in Sup. table 4. The 'Others' class corresponds to the aggregation of positive impacts, conflicts and environmental problems (see Sup. table 1).
| Class | False positive articles (n = 136) | Generic articles (n = 1117) | Articles with other impacts (n = 210) | Included articles (n = 1547) | All articles (n = 3010) |
|---|---|---|---|---|---|
| Agriculture | 98.7 | 89.2 | 99.4 | 96.3 | 94.0 |
| Livestock | 98.8 | 93.6 | 99.2 | 96.7 | 95.8 |
| Forestry | 98.4 | 93.4 | 99.1 | 95.4 | 95.1 |
| Industry | 97.2 | 97.9 | 99.0 | 98.6 | 98.3 |
| Recreation | 77.2 | 91.9 | 93.3 | 90.2 | 90.4 |
| Fires | 86.8 | 88.2 | 96.7 | 92.6 | 91.0 |
| Others | 95.1 | 97.9 | 98.1 | 96.8 | 97.2 |
| Mean accuracy (%) | 96.6 | 93.8 | 98.7 | 96.3 | 95.6 |
| SD | 5.0 | 5.5 | 1.6 | 2.6 | 3.1 |
Spatial biases regarding the newspaper sample were analysed by normalising the data according to the total number of articles published and the amount of drought-related news. In states where the hazard was deemed high (e.g. Saxony-Anhalt), there was an overreporting of the 2018/19 event in comparison to the total number of articles (Sup. table 1). Thus, the higher number of articles in the selected newspapers is not due to their publishing behaviour, but it is sensitive to drought occurrences. Additionally, following the OLS regression model, the regional coverage of the newspapers can explain only 19% of the impacts spatial variability. The OLS model tends to underestimate the MIS numbers in central and northeast Germany (Sup. figure 6), meaning that these areas have more MIS than would be expected if the regional coverage was the single factor responsible for the MIS results.
Correlation analyses were performed to investigate the strength of the relationships between the MIS and independent official impact data (figure 5). The estimated Spearman correlation coefficients (figure 6) show that our media-based impact inventory is well correlated with most of the independent information. For instance, the difference (Δ) in grain yield per ha in 2019 when compared to previous years is strongly correlated to the sum of all agriculture (r = .80, p < 0.01) (figure 5(c)), crop losses (r = .82, p < 0.01), economic loss (r = .76, p < 0.01) and drought aid MIS (r = .80, p < 0.01) (figure 6(a)). For the spatial validation of the crop losses MIS in 2019 against the grain yield per ha, the POD was 0.92 and the FAR was 0.00. As expected, the higher the area with grain cultivation in 2019, the greater the number of reported agriculture MIS (r = .82, p < 0.01) (figure 5(e)). For instance, in states where agriculture is not prominent (e.g. Saarland—SL, with 20 000 ha of grain cultivated areas in 2019) the number of agriculture MIS was low. Conversely, in states where there is a higher cultivated area (e.g. Saxony Anhalt—ST, with 568 000 ha of cultivated areas in 2019), the number of MIS was higher. Weak or moderate correlations were identified for some of the grain yield statistics in 2018 (figure 6(a)). This is because the official data (BMEL 2018) considers the financial year of 2018, which starts in September 2017, and our data was collected from April 2018 onwards. Furthermore, crop yield reductions may not necessarily be due to drought (Bachmair et al 2016) and can be a result of other natural hazards (e.g. storms, hail).
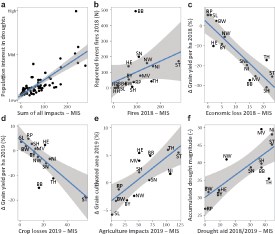
Figure 5. Scatter plots between the number of MIS (x-axis) and independent information (y-axis) with a 95% confidence interval. The y-axis corresponds to: a Population interest in droughts calculated using Google Trends. b Sum of forest and wildfires reported in 2018 (BZL 2019). c Difference (Δ) in % of grain yield per ha in the 2018 financial year when compared to 2015–2017 (BMEL 2018). The grains included are barley, rye, oat, triticale and winter and summer wheat. d Δ in % of grain yield per ha in the 2019 financial year when compared to 2012–2018 (BMEL 2019b). e Δ in % of areas cultivated with grain in the 2019 financial year when compared to 2012–2018 (BMEL 2019b). f Accumulated drought magnitude from April 2018 to August 2019, computed based on the soil moisture index. The state acronyms used are shown in the Sup. figure 1.
Download figure:
Standard image High-resolution image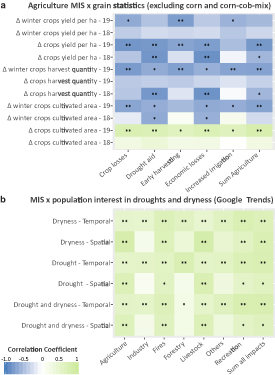
Figure 6. Heatmaps illustrating the Spearman correlation coefficients between MIS and agriculture, and between MIS and population interest in droughts and dryness data. a Relationship between agriculture MIS and grain crop statistics at NUTS 1. The grains included are barley, rye, oat, triticale and summer wheat. The data refers to the difference (Δ) in % of cultivation areas, harvest and yield when compared to the average of previous years (BMEL 2018, 2019a). b Relationships between different MIS classes and population interest in droughts calculated using Google Trends. *denotes correlations significant at the 0.01 level and **at the 0.05 level, both 2-tailed.
Download figure:
Standard image High-resolution imageConcerning the hydro-meteorological data, a strong correlation was found between the sum of all 2018/19 MIS and the accumulated precipitation (r = −73, p < 0.01). Overall, the higher the DM (y-axis), the higher the number of agriculture MIS (x-axis) and the lower the grain yield per ha (y-axis) (figure 8).The DM correlates well with the drought aid (r = .77, p < 0.01) (figure 5(f)), agriculture (r = .55, p < 0.01), and livestock MIS (r = .79, p < 0.01). Also, moderate temporal correlations were obtained between the DM and agriculture, crop losses and livestock MIS (figure 7). For the spatial validation of the agriculture MIS in 2019 against the DM, the POD was 0.70 and the FAR was 0.22.
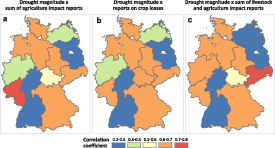
Figure 7. Temporal correlation between drought magnitude and the: a sum of all agriculture MIS; b crop losses MIS; and c sum of both agriculture and livestock MIS.
Download figure:
Standard image High-resolution image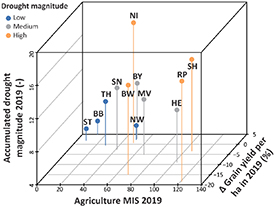
Figure 8. Relationship between the computed agriculture MIS (x), the observed drought magnitude (y), and the Δ of grain yield per ha (z) in 2019. The drought magnitude was classified considering equal intervals in low, medium and high.
Download figure:
Standard image High-resolution image
When considering the wider population's interest in droughts, as measured by the number of online searches (Kim et al 2019), these searches were strongly correlated with the sum of all MIS (r = .80, p < 0.01) (figure 6(b)). Weak to moderate correlations were found between drought interest and forestry and energy MIS, whereas strong correlations were obtained for recreation (r = .80, p < 0.01). This was expected as population interest tends to be higher when issues directly affect their daily activities. The number of forest and wildfire MIS is well correlated with the reported fire occurrences in 2018 (r = .75, p < 0.01, figure 5(b)).
4. Discussion and conclusion
Assessing drought impacts is challenging due to the complexity of the processes involved, lagged effects, limitations in data availability, and the concurrence of cascading and compound effects. Against this background, we developed a method to determine a series of socio-economic drought impacts in near-real-time based on text mining of newspaper articles. Our study provides robust solutions for some of the main issues in drought impact analysis, namely: (1) classification of the impacts, (2) spatial and temporal stratification detail, (3) validation, and (4) near-real-time impact assessment.
With regard to the impacts classification, our method represents a feasible alternative for categorising drought impacts in a more generalizable and reproducible way, as they are classified automatically. One of the recurring issues in impact assessments is that there is no consistently used standard typology or classification approach (Kallis 2008, Stahl et al 2016). Hence, existing assessments rely on the manual and subjective sorting of the impacts using text-based information. This limits the reproducibility of the results as well as the sample size. To improve this, we developed a classification scheme derived from text mining tools. Thus, instead of predefining classes, they were developed inductively based on an analysis of the words frequency and co-occurrence. This allowed reducing the subjectivity and to avoid missing important impacts (Kirilenko and Stepchenkova 2012). Our classification was accurate in 95.6% of the cases. Even when misclassifications occurred, these were mainly related to hypothetical impacts (e.g. risk of forest fires) and not to an entirely distinct impact class. Thus, our approach has the potential to outperform existing methodologies and to facilitate the efficient deployment of personnel for assessing drought impacts.
Due to the automation involved, our method makes it possible to stratify the gathered MIS data with an unprecedented level of detail at the NUTS 3 scale. To reduce the spatial bias, we considered a national newspaper as well as one for each state. This allowed a more uniform distribution of the impacts when compared to other databases (e.g. EDII). Despite the regionality of each newspaper, the OLS results showed that the MIS are weakly correlated to the spatial coverage of the newspapers (Sup. figure 6). This implies that the newspaper sample's spatial bias was low. In addition to the high level of spatial stratification detail, our method enables researchers to assess the impacts on a daily basis.
As mentioned before, the largest caveat in drought impact assessments is the difficulty of validating the results against independent data. Existing studies that perform validation restrict it to comparisons of the obtained impact data with hazard indexes (Bachmair et al 2015, 2016, Blauhut et al 2015, Stagge et al 2015, Sutanto et al 2019) and a few use vulnerability data (Blauhut et al 2016). Nevertheless, the direct comparison of hazards with impacts is problematic, as vulnerability and exposure factors play a key role in defining the magnitude of the consequences. Hence, in addition to comparing our MIS results with hydro-meteorological data (i.e. DM and accumulated precipitation), we also validated it against crop yield statistics, population interest in droughts and forest fire occurrences. Overall, the MIS are strongly correlated with independently collected data (figures 5, 6 and 7). Furthermore, the POD and FAR results indicate that our results perform well. This suggests that, the proposed method can provide reliable impact information.
In terms of near-real-time assessment, our method can form the foundation for an impact-based early warning system, which would be crucial for farmers and forest managers by complementing drought hazard seasonal forecasts. For this, our monitoring approach would need to be coupled with hydro-meteorological drought indices using, for example, machine-learning algorithms (Sutanto et al 2019). Within this context, lag-times between hazard data and the MIS impacts would need to be investigated. Since the key drivers of droughts often affect extensive areas, efforts should be made towards a transnational system for drought impact prediction. The proposed framework offers a unique avenue to move towards such a system. In this context, the MIS could be complemented by government reports and citizen-generated data.
With regard to the 2018/19 drought event in Germany, our results show that the impacts were diverse and interconnected with other hazards. The compound effects of drought, heatwaves, pests and storms greatly contributed to the overall impacts (de Brito and Kuhlicke 2020). For instance, the forests were damaged in January 2018 by Cyclone Friederike (Munich 2020). This, in combination with the bark beetle plague, fungi blight and the Fabienne storm in September 2018 (Koucká Knížová et al 2020) led to an irreversible loss of growth and vigour, which resulted in over 105 million square metres of forest being logged (BMEL 2019c). Hence, further studies should analyse the concurrence of cascading and interacting drought effects. The method used here provides the necessary data for conducting such studies.
Despite its advancements, some caveats should be considered when applying the proposed framework and interpreting the obtained results. First, the article publishing date was used as the MIS date. Thus, articles that reported on previous damage had to be manually excluded (n = 32). Second, the selection of newspapers greatly affects the results geographical distribution. Therefore, attention should be paid to the selection of spatially uniform data by assuring that all investigated regions are equally covered. A third limitation refers to the use of newspapers as a data source. The media narratives can change due to seasonality (e.g. 'Sommerloch' or a lack of other news to report during summer (Engelmann 2010)). Likewise, crisis such as COVID-19 may affect the news that is reported, influencing the MIS temporal distribution. Hence, the media framing should be taken into account when interpreting the results. Despite these drawbacks, reliable impact data were obtained for our case study, both in terms of spatial and temporal precision.
The generalisation of the proposed method so that it can be used for other case studies is technically straightforward. However, although actionable newspaper datasets are available (e.g. Nexus, genius.de), we recommend performing a careful assessment of the classification codes accuracy before implementing our approach. Furthermore, it is worth noting that our method is not designed to replace reports issued by official institutions or to substitute crop yield estimates. Instead, it offers complementary information to existing systems while providing a broader perspective in terms of space, time and impact types.
Possible future developments include the consideration of seasonal patterns. Also, the time lags between drought hazard indicators and the reported impacts need to be investigated. This is a complex task given that different lag times occur for different impact types (Turco et al 2017, Kolus et al 2019). Still, a greater understanding of these spatio-temporal relationships could support the development of impact functions for forecasting drought impacts. Finally, the results obtained can provide 'ground truth' for drought risk indicators, paving the way for forecasting future impacts. In this context, the developed database can help to identify which hazard and vulnerability indicator thresholds trigger impacts on the society, economy and ecosystem. This would form the basis for the design of an impact-based drought forecasting system.
Acknowledgments
The authors would like to thank Friedrich Boeing for providing the drought magnitude data and for his insightfull comments.
Author contributions
M.M. de B. and C.K. designed the study. M.M. de B. collected the data, performed data analysis and wrote the initial version of the paper. A.M. provided hazard data and assisted in the results validation. All authors contributed to interpreting results and discussion.
Data availability
The impact database and codes used to perform the analysis reported herein are available from the corresponding author upon reasonable request. All the information used in this study to validate the results can be obtained from the following open sources. Monthly soil moisture data are available for Germany at www.ufz.de/index.php?en=40990. Precipitation data are provided by the German Weather Service at https://opendata.dwd.de/climate_environment/CDC/. Information about the population's interest in drought and dryness is provided by Google Trends at https://trends.google.com/. Forest fire data are provided by BZL (BZL 2019) and crop yield statistics by BMEL (BMEL 2018, 2019a).