Evaluation of CO2 Storage in a Shale Gas Reservoir Compared to a Deep Saline Aquifer in the Ordos Basin of China


1
School of Environmental Studies, China University of Geosciences, Wuhan 430074, China
2
Computational Fluid Dynamics Laboratory, Washington University in St. Louis, 1 Brookings Dr., St. Louis, MO 63130, USA
*
Author to whom correspondence should be addressed.
Energies 2020, 13(13), 3397; https://doi.org/10.3390/en13133397
Submission received: 20 May 2020
/
Revised: 17 June 2020
/
Accepted: 28 June 2020
/
Published: 2 July 2020
(This article belongs to the Special Issue Advances in Enhanced Oil and Gas Recovery)
Abstract
:As a new “sink” of CO2 permanent storage, the depleted shale reservoir is very promising compared to the deep saline aquifer. To provide a greater understanding of the benefits of CO2 storage in a shale reservoir, a comparative study is conducted by establishing the full-mechanism model, including the hydrodynamic trapping, adsorption trapping, residual trapping, solubility trapping as well as the mineral trapping corresponding to the typical shale and deep saline aquifer parameters from the Ordos basin in China. The results show that CO2 storage in the depleted shale reservoir has merits in storage safety by trapping more CO2 in stable immobile phase due to adsorption and having gentler and ephemeral pressure perturbation responding to CO2 injection. The effect of various CO2 injection schemes, namely the high-speed continuous injection, low-speed continuous injection, huff-n-puff injection and water alternative injection, on the phase transformation of CO2 in a shale reservoir and CO2-injection-induced perturbations in formation pressure are also examined. With the aim of increasing the fraction of immobile CO2 while maintaining a safe pressure-perturbation, it is shown that an intermittent injection procedure with multiple slugs of hug-n-puff injection can be employed and within the allowable range of pressure increase, and the CO2 injection rate can be maximized to increase the CO2 storage capacity and security in shale reservoir.
1. Introduction
The capture of anthropogenic carbon dioxide (CO2) from industrial or other emission sources and its long-term storage in geological formations to limit its emission into the atmosphere is referred to as geological carbon storage (GCS) [1]. GCS is regarded as one of the most effective technologies to reduce the greenhouse gas emissions from the combustion of fossil fuels. Besides the conventional CO2 storage sites in the deep saline aquifers, depleted oil and gas reservoirs, and un-minable coal [2,3], the depleted shale reservoir is also rapidly becoming a new and potentially promising CO2 storage option because of the booming production of the unconventional shale gas [4,5].
Interest in CO2 storage in shale reservoirs has grown recently because shale is widely reported to possess higher affinity to CO2 than CH4 and has huge potential for CO2 adsorption trapping. For example, Heller and Zoback [6], Kang et al. [7], and Zhang [8] all tested the CO2/CH4 adsorption capacity of shale from different places in the world and demonstrated that the CO2 adsorption capacity to shale was greater than that of CH4 under surface condition. Several feasibility studies for CO2 storage in shale reservoirs have demonstrated that CO2 can be trapped in the shale matrix and at the same time can significantly enhance the methane recovery by CO2/CH4 competitive adsorption [9]. Liu et al. [10] indicated that 95% of injected CO2 can be permanently sequestered in the Devonian and Mississippian New Albany shale with gas adsorption being the dominant storage mechanism. A large storage capacity of CO2 in shale reservoirs has also been evaluated and it was estimated that the CO2 storage capacity of the Marcellus shale in the eastern United States alone could store between 10.4 and 18.4 Gt of CO2 between now and 2030 [11].
In GCS, it is very important to study the CO2 plume evolution and migration as well as different phase transformations due to various trapping mechanisms for the sake of security. In a shale reservoir, there is one more trapping mechanism for CO2 compared to those in the deep saline aquifers, and that is the adsorption trapping of CO2 to the surface of the host rock simultaneously promoting the desorption of the in-place CH4 [12]. It is important to recall here the other well-known trapping mechanisms, namely the hydrodynamic trapping, solution trapping, mineral trapping and residual or capillary trapping. Furthermore, although all these trapping mechanisms may take effect within a given reservoir, they occur at different time scales. Moreover, only a few of these mechanisms contribute significantly to plume immobilization in time scales comparable to the injection times or arguably even over the duration of the site stewardship. On shorter time scales, hydrodynamic trapping, residual, and adsorption trapping are the dominant mechanisms that play an important role in plume immobilization and reservoir [13,14,15,16]. In the long-term, a significant amount of CO2 will be trapped through dissolving into the formation water (solubility trapping) and finally being permanently stored in mineral phase by reacting with the host rock (mineral trapping), which gradually begins to contribute to CO2 plume immobilization in shale reservoirs [12].
The physical understanding of CO2 storage mechanisms in shale reservoirs is still in very preliminary stage; not all of the above listed trapping mechanisms have been considered in the previous studies [10,12,17,18]. Furthermore, CO2 plume evolution and spatial and time scales of phase transformations also depend on the CO2 injection strategy to some extent. Juanes et al. [15] have explored the impact of relative permeability hysteresis on CO2 storage in deep saline aquifers and found that the injection of water slugs alternating with CO2 injection can increase the effectiveness of storage by increasing the CO2 trapped in the residual phase and reducing the CO2 leakage risk caused by the free and mobile phase. Kim et al. [17] also suggested the huff-n-puff injection scheme as a good viable option for CO2 storage and shale gas recovery in the Barnett shale. The huff-n-puff injection is also called the cyclic injection, in which the CO2 is not continuously injected but is divided into several stages, and each stage includes gas injection and a soaking process. However, the effect of different CO2 injection strategies on CO2 storage in a shale reservoir and shale gas recovery has not been thoroughly investigated; it is the goal of this paper to address this problem in detail.
Due to the complexity of the underground environment and very slow reaction rate of alumino-silicate minerals with ambient CO2 under storage conditions, numerical models and simulations are of great significance in the assessment of CO2 migration in a shale reservoir for long-term storage. In this study, CO2 storage in Yanchang shale in the Ordos basin of China is investigated by numerical simulation. The dual-porosity, dual-permeability modeling approach is employed to establish the one-stage hydraulic fractures in a shale reservoir. It includes Darcy and diffusive flow, hysteresis effects, CO2 dissolution, CO2–water–shale reactions as well as CO2/CH4 sorption and desorption. The CO2 storage performance in a shale reservoir is compared to that in a deep saline aquifer from the Shenhua CO2 Capture and Storageproject in the northern part of the Ordos Basin. The effect of various CO2 injection schemes, namely the high-speed continuous injection, low-speed continuous injection, huff-n-puff injection and water/gas alternating injection, on the phase transformation of CO2 in the shale reservoir and CO2-injection-induced pressure perturbations in the reservoir formation are analyzed.
The complexity of the underground environment mainly shows in the heterogeneity and anisotropy of the porous and fractured reservoirs, which are also important factors impacting the evolution of CO2 in different phases [19,20,21]. Considering the calculation efficiency, the geological and hydrological properties are reasonably homogenized and simplified. We believe that this study can not only obtain some generic findings about the effectiveness of CO2 storage and the CO2 plume migration in a shale reservoir, but can also provide guidance for the risk assessment for CO2 storage in shale reservoir.
2. Geological Background
The Ordos basin, with an area of 370,000 km2, is the second largest sedimentary basin containing abundant oil and gas resources in the Northern China. It is a typical cratonic basin with low porosity and permeability, which developed into a large stable basin during the Paleozoic period. The tectonic movement during the basin development was dominated by regional uplift and subsidence leading to the uplifts and depressions type terrain in the basin. The basin is divided into six substructures, the Shanbei Slope characterized by a huge monoclonal structure located in the middle of the basin and surrounded by the Yimeng Uplift in the north, the Jinxi Flecture Belt in the east, the Weibei Uplift in the south, the Tianhuan depression and the western margin thrust belt in the west. Most of the gas and oil resources are distributed in the Shanbei Slope, not only for the conventional oil and natural gas but also for the shale gas. Three sets of black shale in the Ordos basin are the Ordovician Pingliang shale, the carboniferous-permain shale and the Triassic Yanchang shale. However, the Yanchang shale has been demonstrated to have the most potential for shale gas exploitation because of its high TOC (Total Organic Carbon) content (an important indicator of a shale gas reservoir) and the actual drilling of 1000~3000 m3 of gas and 2~5 tonnes of oil per day with hydraulic fracturing.
In addition to the huge amount of oil/gas reserves in the Shannbei slope, it is also a favorable structural unit for the geological storage of CO2 in China due to its relatively stable tectonic environment with rare regional faults. In 2010, the first Chinese full-chain CO2 capture and geological storage demonstration project—the Shenhua Project—was launched in the northeast of the Shannbei Slope and 0.302 million tonnes (Mt) of CO2 was injected at the end of 2015 [22]. Five sets of reservoir-caprock assemblages exist in the Shenhua saline aquifer. From top to bottom, they are the Liujiagou, Shiqianfeng, Shihezi, Shanxi and Majiagou assemblage, respectively (Figure 1). The main target formations for CO2 storage are saline aquifers with low porosity, low permeability and high heterogeneity. The average porosity of the target reservoir is 9.3%, which varies in the range of 7~20%, while the average permeability is 5.615 mD with the range 0.5~10 mD.
3. Material and Methods
3.1. Governing Equations for Different Trapping Mechanisms
3.1.1. Multi-Component Adsorption
It has been widely reported that CO2 is preferentially adsorbed to organic shale by a factor 2~5 times greater than that for CH4. Adsorption trapping is a dominant mechanism for CO2 storage in a shale reservoir. To calculate the competitive adsorption and desorption of CO2 and CH4, the extended Langmuir isotherm described by Equation (1), which has been shown to give a reasonable correlation with binary gas sorption of CH4 and CO2 in the Yanchang shale, is applied in the present model.
where is the adsorbed moles amount of component i per unit mass of rock, is the maximum adsorbed moles amount of component i per unit mass of rock, is the constant parameter in Langmuir isotherm, is the adsorbed molar fraction of component i in the gas phase, and P is the pressure.
3.1.2. Dissolution
Henry’s law is preferred to calculate the dissolution of CO2 in the formation water as follows (Equation (2)):
where . is the aqueous molar fraction of CO2; is the fugacity of CO2 in the aqueous phase, which can be calculated from Peng and Robinson’s equation-of-state; is the Henry’s constant at reference pressure ; is the partial molar volume of CO2 at infinite dilution; and R and T are the universal gas constant and temperature, respectively.
3.1.3. Trapping and Relative Permeability Hysteresis
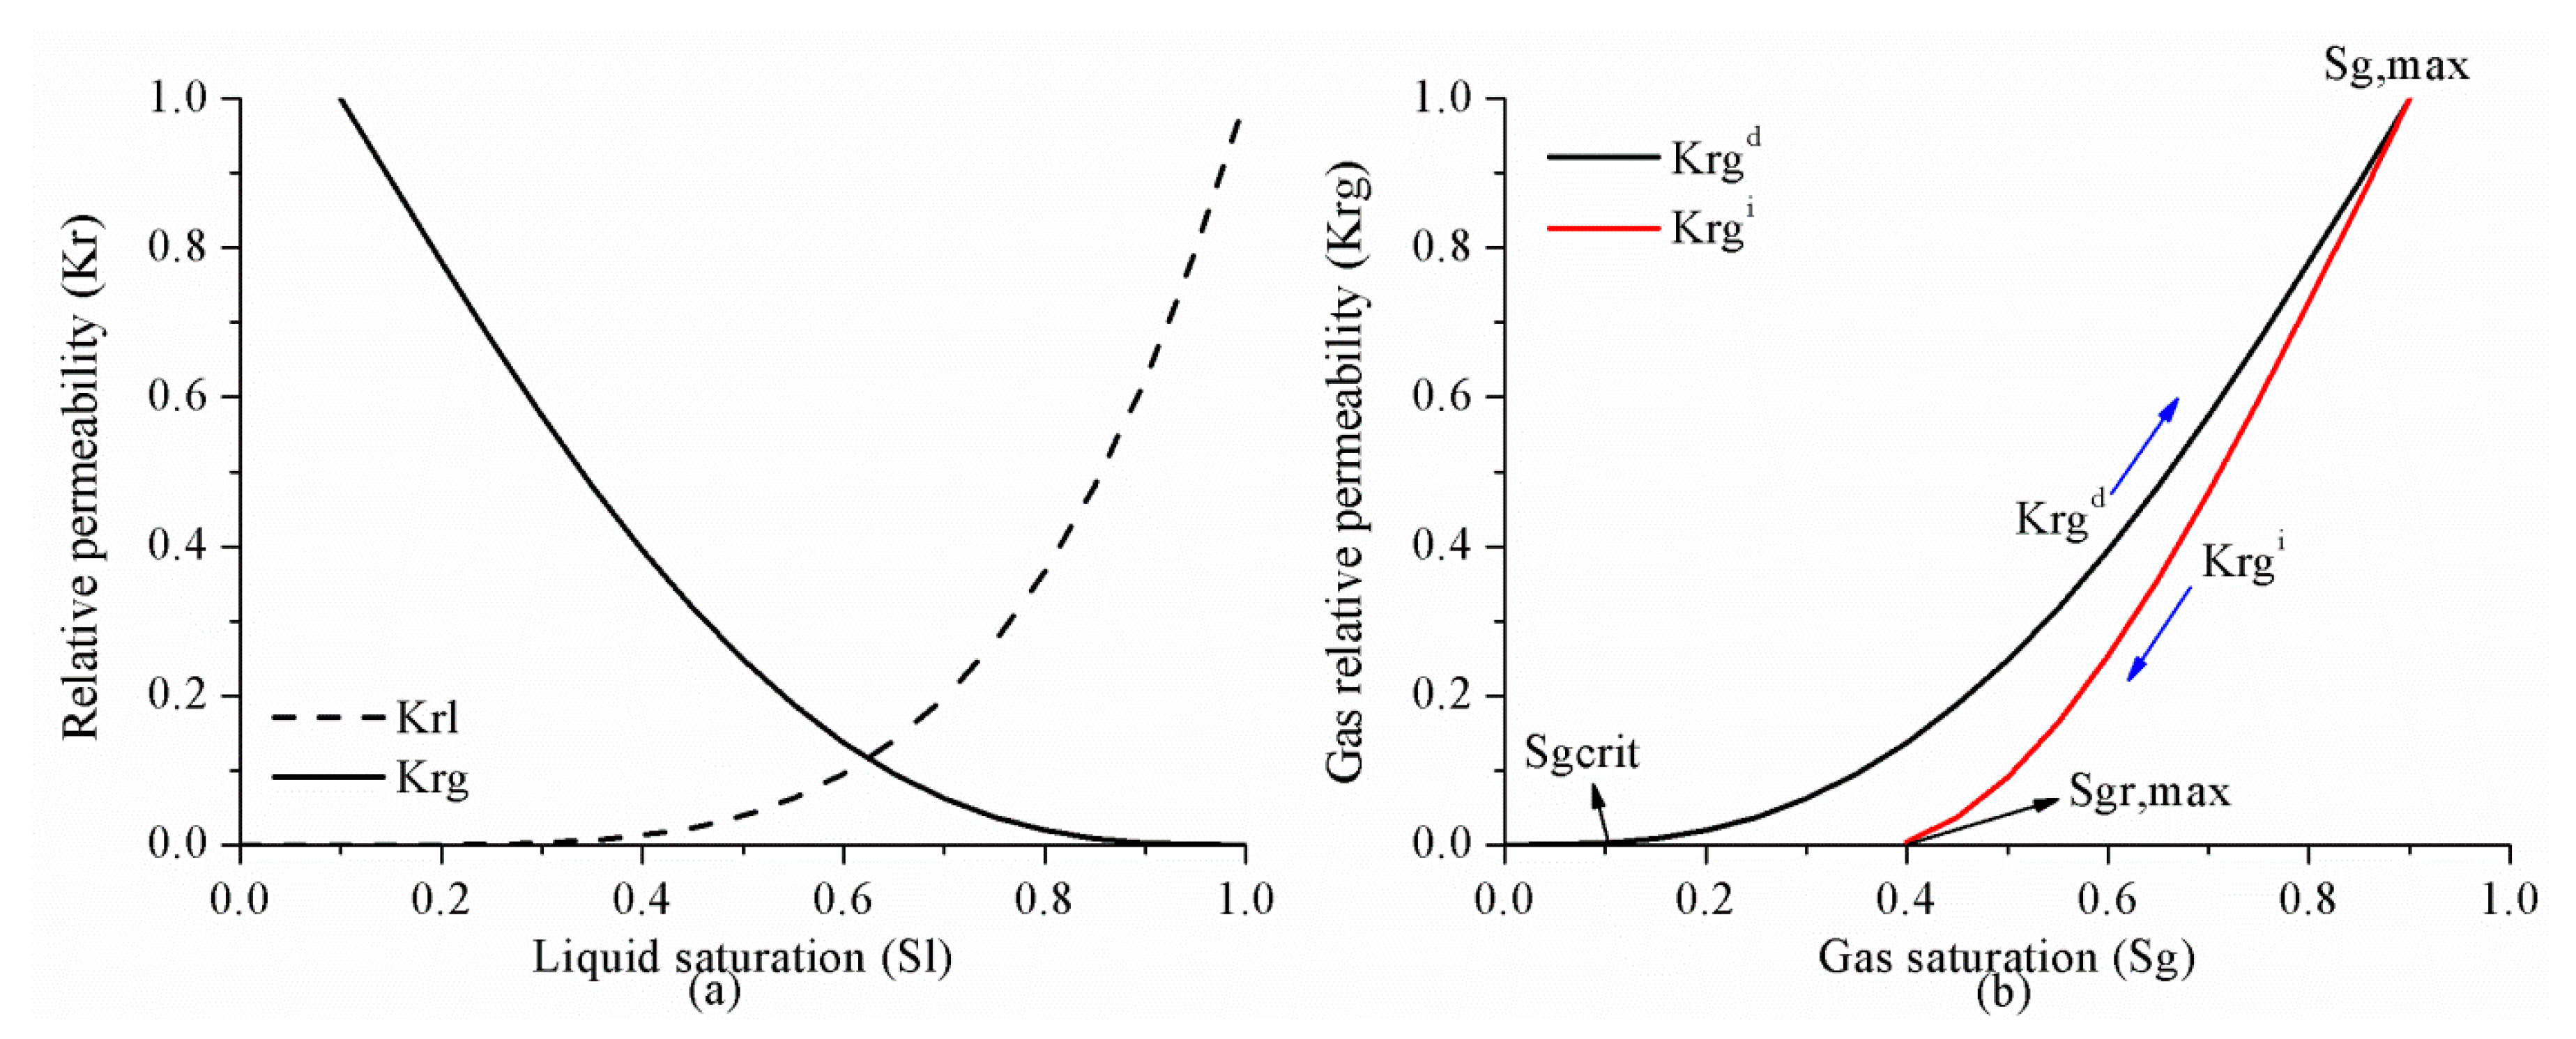
To characterize the trapped saturation and relative permeabilities of the non-wetting phase after a flow reversal, several empirical models of hysteresis have been developed [25,26,27] among which Land’s model has been demonstrated to reliably predict the residual CO2 saturation in consolidated porous media [28]. As a result, the Land’s model is used in this paper to calculate the residual trapping. During CO2 storage in the subsurface, the reservoir goes through a process from drainage to imbibition, as shown in Figure 2. Once the injection started, the drainage process begins with gas saturation increasing. The imbibition process follows when the injection stops and gas saturation decreases, resulting in the residually trapped gas saturation, Sgr, which is computed from Equation (3). The relative permeability of gas on the drainage to imbibition scanning curve can be found in the reference [29].
where is the critical gas saturation and is assumed as 0.05, C is Land’s parameter calculated by the simulator so as to be internally consistent with the inputs , Sg,max (maximum gas saturation, assumed 0.9) and Sgr,max (maximum residual gas saturation, assumed as 0.4).
Corey’s model is employed to simulate the relative permeability variation with saturation, as given in Equations (4)–(6):
where and are the relative liquid and gas permeability on the drainage curve, while and stand for the irreducible liquid and gas saturation and are assumed as 0.1 and 0.0, respectively.
3.1.4. CO2-Water-Rock Reactions
The mineral dissolution and precipitation reactions are described by a kinetic rate law as given in Equation (7), where is the rate, is the reactive surface area for mineral β and is the activity product of mineral reactions β, and the is the chemical equilibrium constant. and for different minerals are available in the literature [30,31]. The data presented in Liu et al. [12] has been adopted in this study.
The B-dot model [32] was employed to calculate ionic activity coefficients (Equation (8)), where , and are temperature dependent parameters, is the ion size parameter, I is the ionic strength, and are concentration (mol/kg H2O) and electrical charge of species i. I can be calculated using Equation (9).
3.2. Model Description
To evaluate the effect of CO2 storage in shale reservoirs by comparing with a realistic CCS storage site in the deep saline aquifer, the YC shale (short for Yanchang shale) from the southern part of the Shannbei slope and the LJG sand (short for the Liujiagou sand) in the Shenhua CCS project were chosen as the target reservoir in this study. For numerical simulation, the advanced general equation-of-state compositional simulator GEM [33] was employed. For comparison and simplification, simplified 2-D homogeneous models with a burial depth of 925 m and thickness of 30 m vertically were established both for the shale and sand reservoir. Besides, a one-stage hydraulic fracturing horizontal well with a half-length of 165 m was located in the middle of the model for the shale (Figure 3a) and a vertical well without fracturing for the sand reservoir. The classical dual porosity dual permeability method was adopted to describe the fractured shale reservoir, the conductivity of the hydraulic fracture was discretized into 16 mD·m according to the actual hydraulic fracture width in the Yanchang shale gas exploitation site [34], while the conventional single porosity-permeability system was employed for the sand. The 2-D model was discretized into 19 × 25 grids in a horizontal plane with a volume of 30 m × 30 m × 30 m in total. The grids for the hydraulic fracture were refined to accurately describe the fluid flow between matrix and fracture for the shale reservoir. During the calculation, the dynamic time step adjusting method was employed.
There are also several geological and geochemical property differences for the sand and shale, which are summarized in Table 1. Typical rock compressibility values at depths of interest for CO2 storage range from 10−11 to 5 × 10⁻⁹ Pa−1(10−8~5 × 10⁻⁶ kPa−1), but always increase with rock permeability [35]. As a result, the compressibility was assumed to be higher for the sand than the shale reservoir in this study.
Figure 3b shows the mineral composition of the Yanchang shale. As indicated by Zhang [8], the shale in the Yanchang area is mainly composed of clay, quartz, feldspar, calcite and pyrite. Clay minerals are the major mineral constituent with a content of 43.54~55.38%. The major clay minerals are chlorite, kaolinite, illite and mixed-layer illite and smectite (illite/smectite). Quartz occupying a content of 21.34~25.2% ranks in second place. The topmost Liujiagou sand was chosen for comparison, the mineral composition of which was employed in the model [36]. Quite different from shale, sand is rich in quartz and feldspar mineral, and Figure 3b shows a different mineral composition of sand and shale used in this study. Based on the available previous research and other empirical information [37,38,39], ankerite, dawsonite, magnesite and dolomite were chosen as the secondary minerals. The initial volume fraction of all the secondary minerals is assumed to be zero and a threshold mineral volume fraction of 10−6 is also assigned. The precipitation begins when the non-existing minerals’ volume fraction exceeds the threshold value; the volume fraction is updated at each time step according to user-defined specific surface area.
The density and viscosity of CO2 are calculated from the Peng and Robinson equation [40] and Jossi, Stiel, and Thodos correlations [41], respectively. A validation of the geochemical modeling of water–rock interactions with mineral compositions listed in Figure 3b was performed with TOUGHREACT [42] prior to the final reactive transport simulation. TOUGHREACT is a widely used non-isothermal multiphase reactive transport simulator for geochemical reactions modeling during CO2 storage in subsurface to obtain the initial chemical composition of formation water.
3.3. Simulation Cases and Validation
For comparison, the burial depth of the shale and the sand were both assumed at 925 m corresponding to the initial temperature of 34.15 °C and pressure of 9250 kPa with the thermal and pressure ingredient of 0.016 °C/m and 10 MPa/km [24], respectively. However, the CO2 storage in shale is initialized after the depletion of shale gas production when the reservoir pressure is reduced due to the gas exploitation, which was assumed to be 7500 KPa at the beginning of CO2 storage. Similarly, there remain only brine and CH4 in the reservoir before CO2 injection at the end of the shale gas production, while the initial CH4 saturation in the matrix and fracture was 40% and 10%, respectively. CO2 should be displayed as in supercritical phase; however, both GEM and TOUGREACT are unable to distinguish CO2 to be either in the supercritical or in subcritical phase from the gas phase. As a result, all the supercritical CO2 is considered as a single non-wetting phase, that will henceforth be referred to as “gas” CO2. CO2 is continually injected at a maximum bottom-hole pressure of 22 MPa for 30 years, which means that the bottom-hole pressure of the injector shown in Figure 3a should be kept stable at 22 MPa during the whole period of CO2 injection. The entire simulation duration is set at 500 years for both scenarios.
The effect of CO2 storage in a shale reservoir and a deep saline aquifer was first compared. For the sand case (case 1 shown in Table 2), the gas diffusion, dissolution, drainage and imbibition, and CO2-water-rock reactions are modeled. However in the shale case (case 2), the gas adsorption effect is also included in the simulation. To validate the ability of geochemical reactions modeling in GEM, the sand case was also built using TOUGHREACT. As shown in Figure 4, the obtained gas saturation and pH curve variation with the time at the injection cell are in good agreement for both simulators. The slight difference in gas saturation at the early and late stage of the simulation for TOUGHREACT and GEM may be due to differences in the geochemical reaction model. The different choice of the geochemical reaction model can significantly influence the CO2 mineral trapping efficiency both in capacity and velocity. To explore the effect of different CO2 injection schemes on CO2 plume migration and phase transformation, three additional cases are considered, as shown in Table 2. Case 2 and case 3 are used to analyze the impact of CO2 injection rate by maintaining the same injected CO2 volume but changing the injection period. Case 2, case 3 and case 4 are considered to analyze the influence of continuous injection (case 2), huff-n-puff injection (case 4) and water alternating gas injection (case 5) on the CO2 storage in shale reservoirs. The boundary of the simulation domain was assumed to be open in all simulations.
4. Results and Discussion
4.1. Comparison of CO2 Storage in Shale and Deep Saline Aquifer
The cumulative levels of CO2 trapped with different mechanisms for the YC shale and LJG sand at the same CO2 injection rate are compared and plotted in Figure 5. It can be observed that with a total amount of 1861.55 Mmoles (1861.55 × 106 moles) of CO2 injected in 30 years, 656.59 Mmoles was in the free phase, 474.66 Mmoles was adsorbed, 102.03 Mmoles was trapped in residual phase, 179.12 Mmoles was dissolved in the formation water, and the remaining 458.06 Mmoles was trapped as mineralized CO2 in shale at 500 years. For sand, 1075.36 Mmoles was in the free phase, 279.44 Mmoles was trapped through hysteresis, 155.88 Mmoles was in dissolution phase, and the rest 353.82 Mmoles was stored through CO2–water–shale reactions. Within a timescale of <200 years, sand reservoir possesses priority in trapping CO2 not only in the free gas phase and residual phase but also in the dissolution phase as well as the mineral phase. As time goes on, the superiority of sand trapping of CO2 in the stable chemical phase is overwhelmed by shale.
Figure 5 also displays the CO2 plume distribution at 30 years and 500 years for the sand and shale reservoir. Due to the high permeability of LJG sand compared to the YC shale, both CO2 and pressure migrate faster along the horizontal plane, and this phenomenon is discussed in detail later. However, the pressure perturbation induced by CO2 injection in the shale reservoir was constrained close to the stimulation zone. Once injection stopped, the in-place groundwater invaded the gas in the pores and micro-fractures and created the accumulation of CO2 in residual phase. The larger CO2 plume in the sand reservoir increases the interfacial area for subsequent residual trapping, dissolution and even the reaction with minerals (Figure 5a,b).
Although both reservoirs experience a pressure reduction response to injection stoppage, the pressure variation is neglected within the CO2 plume for the sand reservoir and the fluid flow is dominated by diffusion in horizontal plane. However, there is nearly a 17-MPa pressure difference between the injection site and the margin of the CO2 plume in shale; both advection and diffusion control the CO2 migration. As a result, the CO2 plume still expands outward for the shale but remains nearly unchanged for the saline aquifer after injection stops. It leads to wider CO2 plume at 500 years for shale than for the sand reservoir. The pressure perturbation caused by CO2 plume evolution combined with the transformation of the adsorbed phase into the dissolved phase causes the phenomenon of shale having more chemical trapping of CO2 in the longer term.
The various CO2 storage mechanisms have different operating time frames, among which the hydrodynamic and adsorption trapping take effect immediately after the CO2 injection, while the residual gas, dissolution and particularly the mineral trapping mechanisms are a slow process, and can occur over a time scale of centuries to millennia. Instead, these three mechanisms play an essential role in increasing the security and safety of CO2 geological storage [3]. In addition, different trapping mechanisms are strongly coupled and are competitive with each other, and different phases of CO2 in the reservoir inter-convert dynamically. To improve CO2 storage security as well as efficiency, the CO2 injection strategy should be optimized based on the idea of expanding CO2 plume and decrease in the percentage of CO2 in the free gaseous phase.
4.2. Effect of CO2 Injection Rate on CO2 Storage in Shale
As stated previously, to enhance the CO2 storage security in a shale reservoir by constraining the capacity of free and mobile-phase CO2 and to maintain a relatively gentle pressure perturbation, the CO2 injection strategy should be precisely designed and optimized. The effects of the CO2 injection rate on the overall performance of the sequestration project are investigated firstly. We do so by comparing case 2 and case 3. The same amount of CO2 is injected in both cases, but over a period of 30 years in case 2 and over a period of 60 years in case 3.
The cumulative CO2 in different phases for both cases (case 2 and case 3) is shown in Figure 6a,b. By comparing the deviation of the cumulative CO2 stored in different phases for case 2 and case 3 at 500 years shown in Table 3, the change in residual trapping is most dramatic with the change in the injection rate. It can be seen from Table 3 that there was a 19.52% reduction in the residual trapping of CO2 due to a decrease in the CO2 injection rate. In addition, case 3 also has more CO2 in the mobile free phase than case 2; the deviation is 38.56 Mmoles at 500 years. More CO2 exists in the free phase to promote its horizontal migration. This result is also supported by the profile of the gas saturation in the fractures of the shale reservoir as shown in Figure 6c–h. This profile clearly shows that the free-phase CO2 migrates further horizontally at higher CO2 injection rate especially during the period of CO2 injection.
4.3. Effect of Huff-N-Puff Injection and Water Alternating Gas Injection
Finally, we investigate the performance of the CO2 sequestration project using the huff-n-puff injection scheme and the injection of alternating slugs of water and CO2 scheme, which are widely used in the oil/gas industry to enhance oil and gas production. We compare the results of case 2, case 4 and case 5. In all the three cases, CO2 is injected at a rate of 4000 m3/day over a period of 30 years. In case 2, the injection of CO2 is continuous. In case 4, CO2 is first injected for 15 years, then the well is shut-down and soaked for five years, and, finally, the well is opened again and injected for another 15 years. In case 5, the injection scheme is as follows: CO2 is first injected at a rate of 4000 m3/day for 15 years, water is then injected at a rate of 50 m3/day for 5 years, and finally the CO2 is injected at the rate of 4000 m3/day for another 15 years.
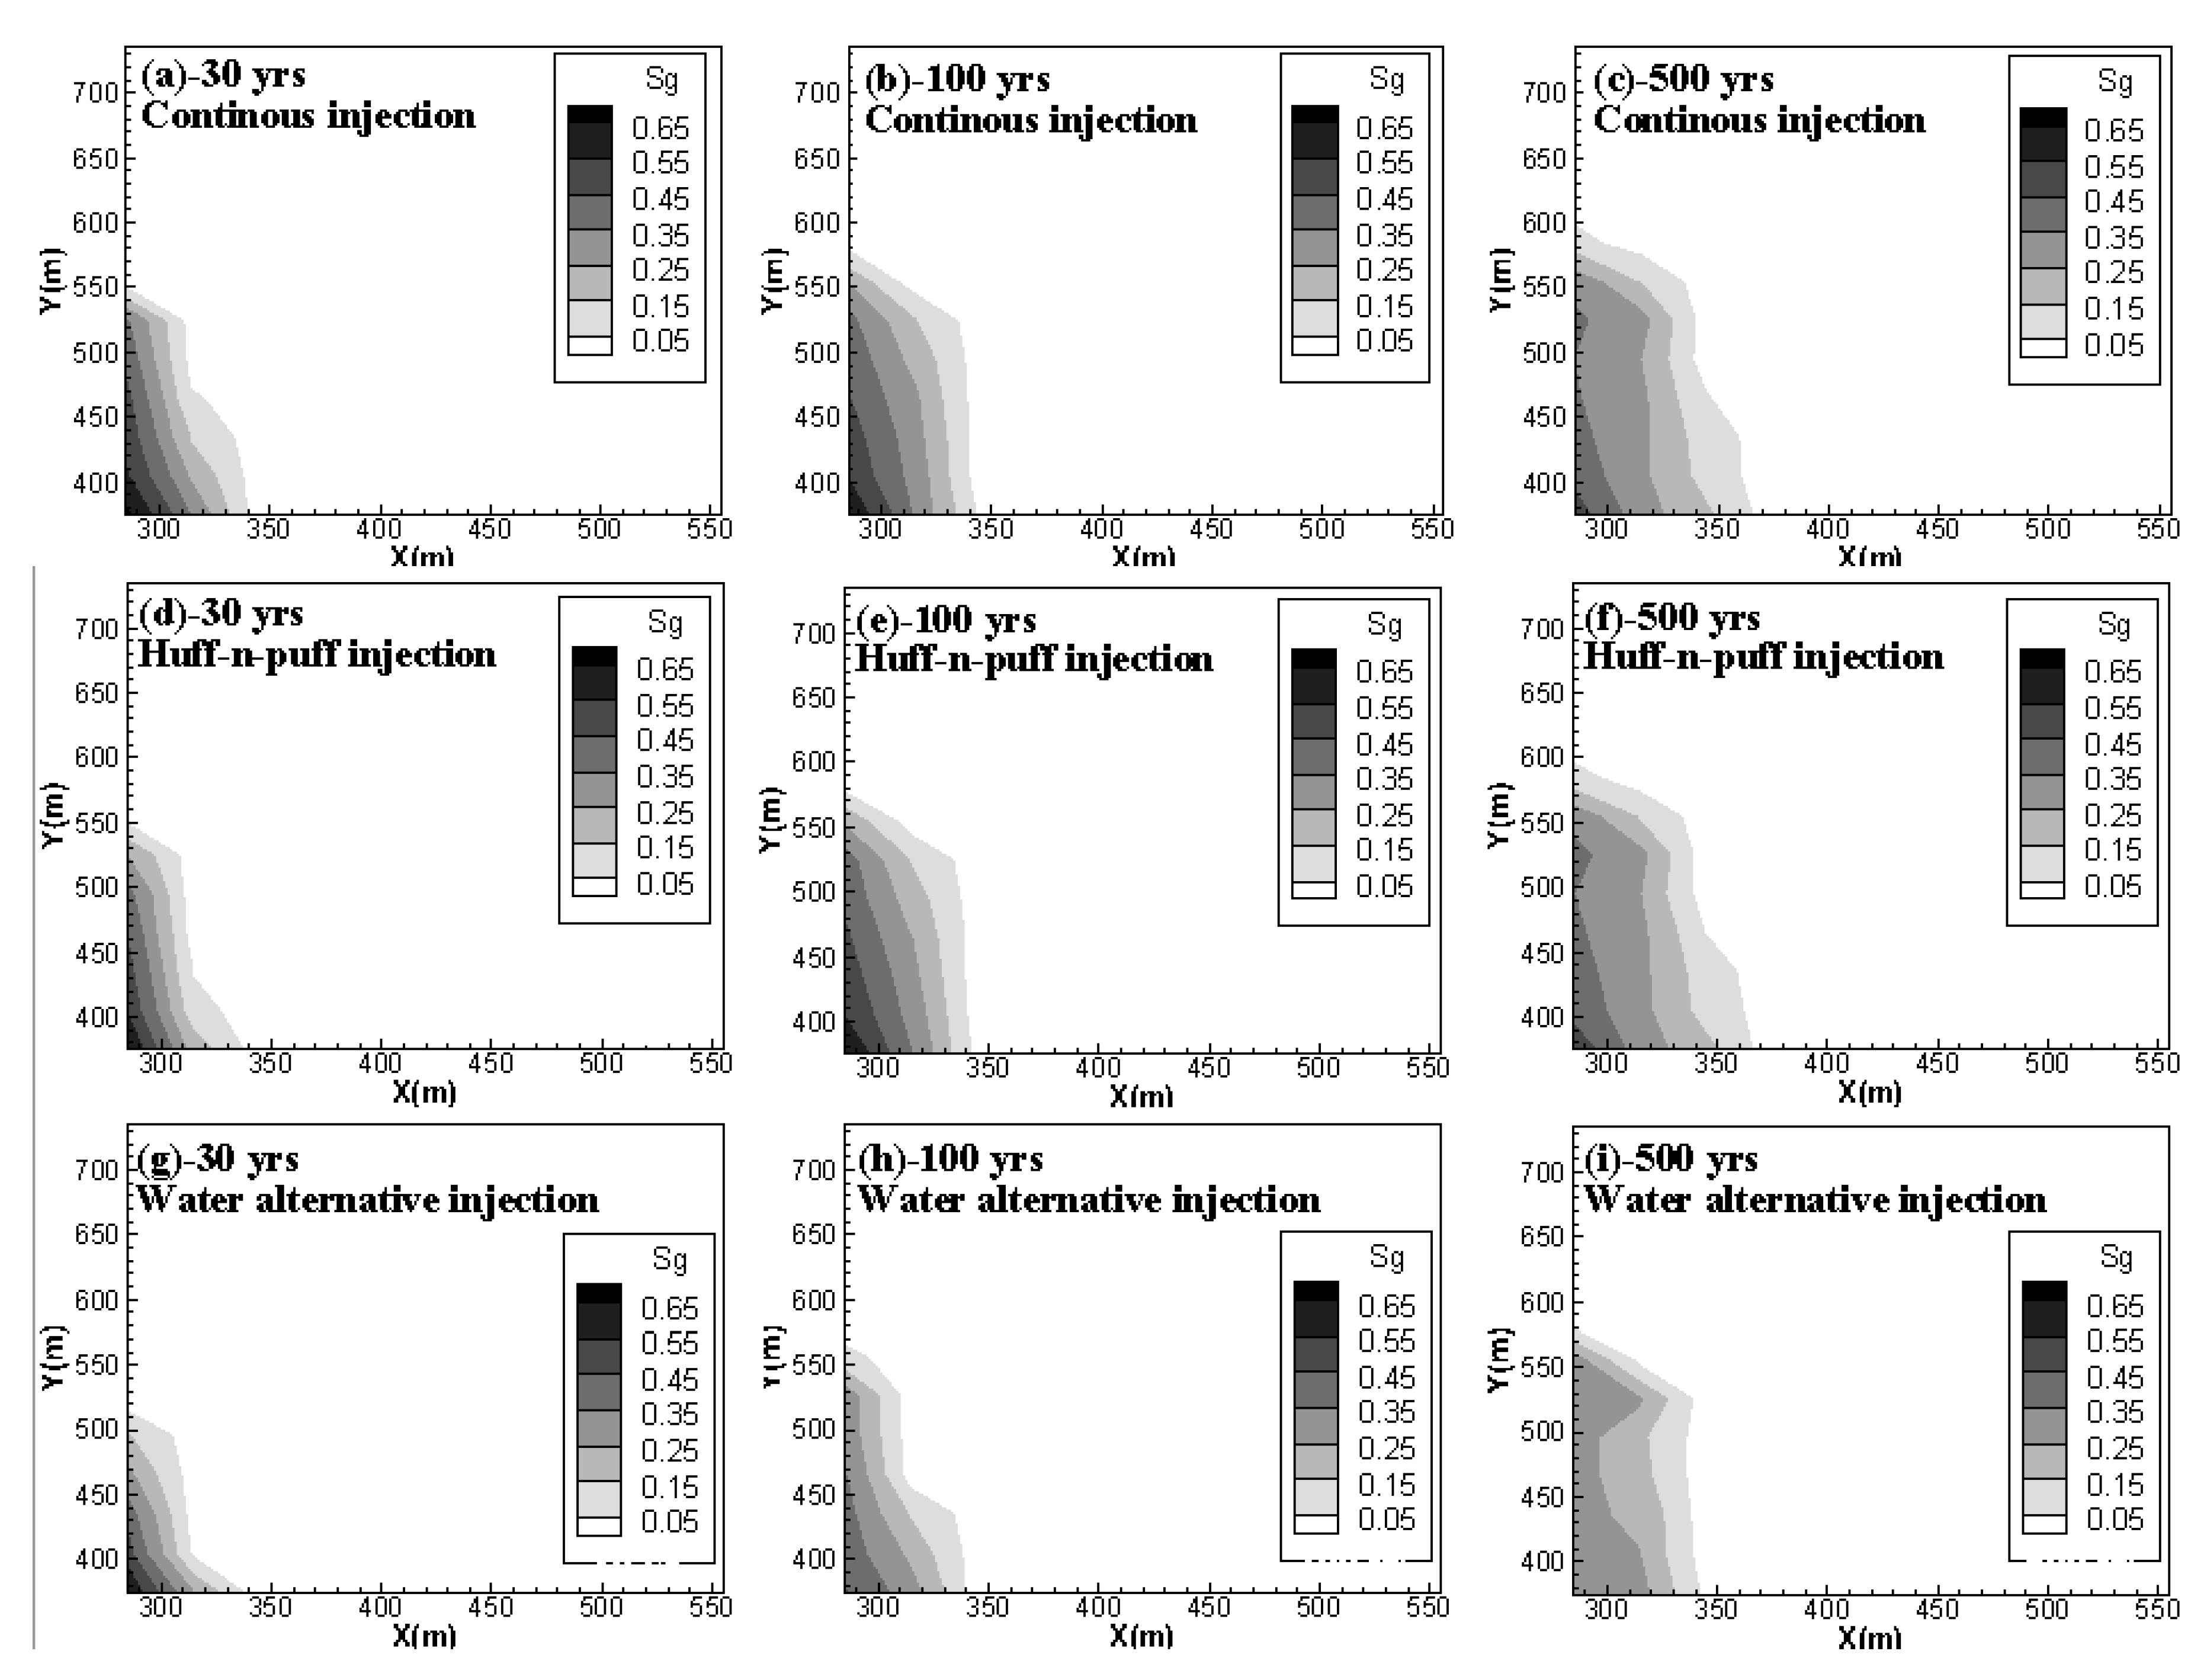
As shown in Figure 7, for the huff-n-puff injection scheme, the addition of CO2 soaking time has a limited impact on the performance of CO2 storage in a shale reservoir compared to the continuous injection, especially for long-term CO2 storage. However, at the beginning, the amount of free CO2 increases while the immobile CO2 in residual as well as the dissolved phase decreases for the huff-n-puff injection scheme, which is not beneficial for the storage safety of CO2. On the other hand, the water alternating gas injection scheme can somehow reduce the free-phase CO2 as well as the adsorbed-phase CO2 by enhancing the CO2 dissolution into the formation water and trapping it in the micro-pores in the residual phase within the timescale of 300 years. However, with the continual ex-solution of CO2 from formation water in the longer term, the CO2 reaction with the host rock is also prohibited.
Figure 8 shows the free-phase CO2 distributions for case 2, case 4 and case 5 at 30 years, 100 years and 500 years. It can be observed that, for case 2 and case 4, although the addition of soaking time for CO2 injection can hinder the gaseous CO2 migration in the horizontal direction, once injection stops, the migration rate is accelerated and the mobile CO2 can even move faster than in the case of the continuous injection scheme. The gaseous CO2 front in Y direction at 500 years arrives at 600 m for the huff-n-puff scenario but only at nearly 580 m for the continuous injection scenario. On the other hand, the water alternating gas injection scheme (case 5) can apparently decrease the capacity of mobile CO2 during the whole period of CO2 storage.
4.4. Pressure Perturbation Induced by CO2 Injection
The performance of CO2 storage in the subsurface is highly dependent on the pressure evolution in the formation. The adsorptive behavior of gas onto an organic substrate is largely dependent on pressure. Although there are different types of adsorption models that can be used to describe the CO2 adsorptive behavior to shale, for example the Langmuir model used for the New Albany shale [43] and the Devonian shale from the Kentucky [5], and the BET-type adsorption of CO2 onto Barnett shale [44], they all show that the CO2 adsorption capacity is a function of ambient pressure. The CO2 dissolution into the formation water is also largely impacted by pressure. Xu et al. [45] indicate that the pressure variation in the reservoir can affect the dissolution of CO2 into the formation brine. As the volume of dissolved CO2 changes, the original chemical equilibrium between CO2 (aq.), H2CO3, and HCO3− can be re-established and the mineral reactions will also change accordingly.
Furthermore, pressure variation is also a cause for the change in residual trapping. The non-wetting gas to invade the smaller pores is driven by the higher formation pressure, and the snap-off also results in the increase in macroscopic trapping that occurs readily in smaller pores during imbibition. On the other hand, the gravity effect impacts the displacement pattern of water by CO2 for low capillary entry pressure. Compared with high-viscosity fluid, the low-viscosity gas can form more stable paths when penetrating the high permeability regions of the porous medium, and only the largest pores can be invaded to lead to reduced snap-off during an eventual imbibition process [15].
Figure 9 shows the pressure variation at observation point #1 (X = 275 m, Y = 375 m), which is located at the injection site for case 1, case 2, case 3, case 4 and case 5. The drastic pressure build-up induced by CO2 injection in the LJG sand is larger and more lasting compared with the YC shale, which displayed with a rapid speed of pressure up and down (Figure 9a). The higher permeability not only enhances the fluid penetration into the rock pores and fractures, but also increases the pressure transmission through the reservoir. The pressure perturbation was constrained within the stimulation zone for the shale reservoir; however, the pressure variation was extended to the whole simulation domain for the sand cases and decreased very slowly responding to the injection well shut-in. The significant pressure deviation between the injecting site and the surrounding area was the cause of CO2 plume expansion within the shale reservoir and also increased the interfacial area for subsequent CO2 dissolution and mineral trapping.
The pressure build-up in case 3 at the injection point is smaller than in case 2, which significantly weakens the residual trapping, as shown in Table 3. The pressure decrease also leads to the release of CO2 from the formation water, which, combined with gas desorption causing more CO2, exists in the free phase. Considering pressure perturbation induced by the three CO2 injection schemes (as shown in Figure 9b), although the water alternating gas injection scheme can increase the CO2 storage security in a shale reservoir by trapping more CO2 in the immobile phase, it induces large pressure build-up during water injection.
4.5. Implication to CO2 Storage Safety and Stability
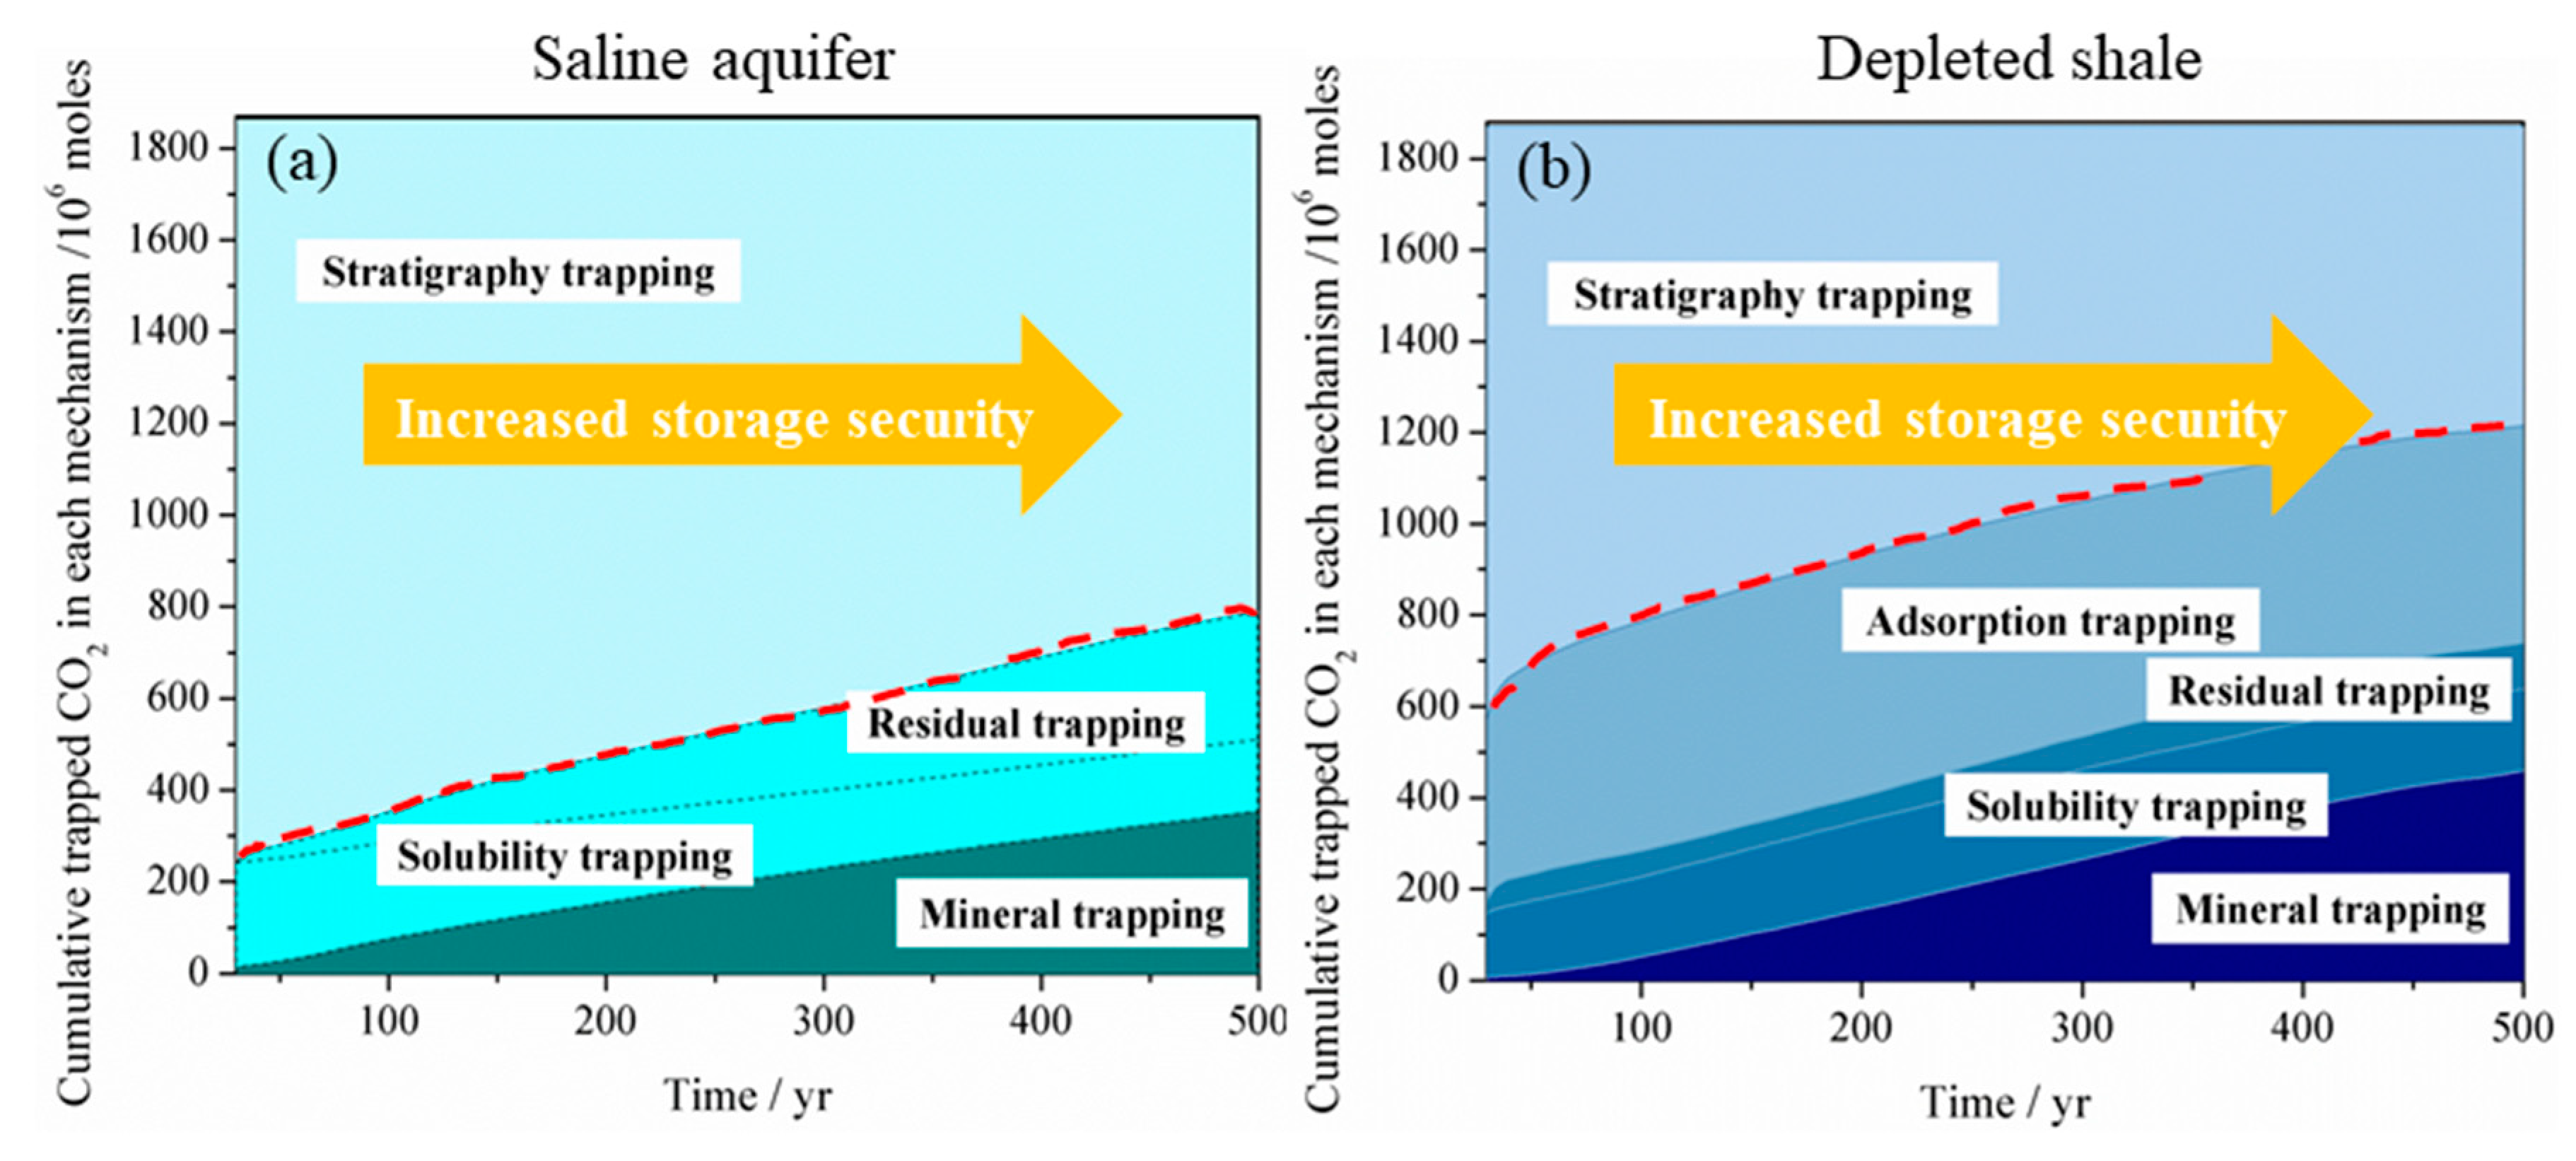
Due to the high diffusivity of gaseous or supercritical CO2, the free-phase CO2 is generally believed to be in the unstable phase, which can easily migrate into the preferential pathways, such as natural or artificial fracture, unfolded fault and abandoned wells and leak from the storage site. Bachu et al. [3] state that the residual-gas trapping, dissolution, and mineralization of CO2 are essential mechanisms in increasing the security and safety of geological storage of CO2 in a saline aquifer after cessation of injection as less and less CO2 remains in the free, mobile phase over time. It is similar for CO2 storage in a shale reservoir. Figure 10 compares the CO2 storage security evolution with time for LJG sand and YC shale. It can be seen that the CO2 storage security increases with time both for shale and sand because more and more CO2 gets stored as a trapped phase over time. Although LJG sand possesses the advantage in trapping more CO2 in the residual, dissolution as well as mineral phase in the short term, this merit is overwhelmed by YC shale as time goes on. Besides, more than 20% of gaseous CO2 is trapped in the adsorbed phase; the overall unstable mobile-phase CO2 in the YC shale reservoir is significantly less than the LJG sand, which indicates that shale shows superiority in security of CO2 storage over saline aquifer.
In addition, the pressure perturbation induced by CO2 injection is also a very important indicator of storage security. The storage of industrial-scale CO2 into a deep saline aquifer can cause large and lasting pressure perturbations that can potentially increase the risk of the leakage of CO2 through a fracture in caprock through the overlying aquifer and cause pollution. It can also result in fault activation inducing seismicity [46,47]. As stated previously, the pressure build-up in a saline aquifer is more severe than in a shale reservoir and is longer lasting with time. However, the pressure perturbation in a shale reservoir is also highly dependent on the CO2 injection rate and stimulation of the fractured zone.
Economically, CO2 storage in a deep saline aquifer is a relatively non-profitable project since it requires heavy investment in well drilling, manufacturing, maintenance and monitoring etc. In case of the low-porosity and low-permeability Shenhua saline aquifer considered in this paper, the extra hydraulic fracturing is also needed to stimulate the reservoir. The high drilling costs primarily contribute to the huge economic cost of a GCS projects. It is estimated that the drilling cost for a vertical well at depth of 2200 m can be as high as USD 4.86 million according to the International Oil Drilling Investment Estimate method and related drilling costs classification. However, the storage of CO2 in the depleted shale reservoir can avoid the costs in constructing drilling wells.
5. Conclusions
This study presents a comprehensive analysis of the potential of CO2 storage in a shale reservoir based on the geological parameters of Yang Chang (YC) shale in the Ordos basin of China by taking into account the Darcy and diffusive flow, gas sorption/desorption, hysteresis effects, CO2 dissolution, and CO2–water–shale reactions. The advantage and disadvantage of CO2 storage in YC shale are analyzed by comparing them with the CO2 storage in LJG sand (saline aquifer) from the Shenhua GCS project in China. To enhance CO2 storage security in shale by constraining the capacity of free and mobile-phase CO2 and to maintain a relatively gentle pressure perturbation, different injection strategies, including the low rate continuous injection, high rate continuous injection, huff-n-puff injection and the water alternate injection are compared. The results can be summarized as follows:
- From the point of view of CO2 phase transformation, CO2 storage in shale can be safer than in saline aquifer by trapping more CO2 in immobile phases, including adsorbed, residual, dissolution and mineral phase with lesser percentage remaining in free mobile phase in longer-term. Although, the saline aquifer has the advantage in trapping more CO2 in the residual, dissolution and mineral phase in the short term.
- The pressure perturbation induced by CO2 injection in the saline aquifer is longer lasting and generally larger than in the shale reservoir. The pressure build-up in shale can be rapidly released when CO2 injection is stopped.
- Although the water alternating injection scheme can significantly increase the dissolution and residual phase of CO2 in short to middle term, the pressure build-up caused by water injection is more drastic than other schemes. For the aim of increasing the fraction of immobile CO2 while maintaining a safe pressure-perturbation, the intermittent injection procedure with multiple slugs of huff-n-puff injection can be employed to replace the continuous CO2 injection. Within the allowable range of pressure increase, the CO2 injection rate can be maximized to increase the CO2 storage capacity and security in a shale reservoir.
Author Contributions
D.L. conceived, designed, simulated and wrote the manuscript. Y.L. and R.A. reviewed and also we responsible for the guidance and a number of key suggestions which do a great favor to improve the manuscript. All authors have read and agreed to the published version of the manuscript.
Funding
This work was funded by the National Natural Science Foundation of China [rant number: 41572233] and the China Postdoctoral Sciences Foundation funded project [grant number: 2018M632943].
Conflicts of Interest
The authors declare no conflict of interest.
References
- Bachu, S. Sequestration of CO2 in geological media: Criteria and approach for site selection in response to climate change. Energy Convers. Manag. 2000, 41, 953–970. [Google Scholar] [CrossRef]
- Bachu, S.; Adams, J.J. Sequestration of CO2 in geological media in response to climate change: Capacity of deep saline aquifers to sequester CO2 in solution. Energy Convers. Manag. 2003, 44, 3151–3175. [Google Scholar] [CrossRef]
- Bachu, S.; Bonijoly, D.; Bradshaw, J.; Burruss, R.; Holloway, S.; Christensen, N.P.; Mathiassen, O.M. CO2 storage capacity estimation: Methodology and gaps. Int. J. Greenh. Gas Control 2007, 1, 430–443. [Google Scholar] [CrossRef] [Green Version]
- Busch, A.; Alles, S.; Gensterblum, Y.; Prinz, D.; Dewhurst, D.N.; Raven, M.D.; Stanjek, H.; Krooss, B.M. Carbon dioxide storage potential of shales. Int. J. Greenh. Gas Control 2008, 2, 297–308. [Google Scholar] [CrossRef]
- Nuttal, B.C.; Eble, C.; Bustin, R.M.; Drahovzal, J.A. Analysis of Devonian black shales in kentucky for potential carbon dioxide sequestration and enhanced natural gas production. Greenh. Gas Control Technol. 2005, 7, 2225–2228. [Google Scholar]
- Heller, R.; Zoback, M. Adsorption of methane and carbon dioxide on gas shale and pure mineral samples. J. Unconv. Oil Gas Resour. 2014, 8, 14–24. [Google Scholar] [CrossRef] [Green Version]
- Kang, S.M.; Fathi, E.; Ambrose, R.J.; Akkutlu, I.Y.; Sigal, R.F. Carbon dioxide storage capacity of organic-rich shales. Spe J. 2011, 16, 842–855. [Google Scholar] [CrossRef] [Green Version]
- Zhang, J. Study of Continental Shale Gas Adsorption and Desorption Effect in Fuxian Area of Ordos Basin; Southwest Petroleum University: Chengdu, China, 2013. [Google Scholar]
- Schepers, K.C.; Nuttall, B.; Oudinot, A.Y.; Gonzalez, R. Reservoir Modeling and simulation of the Devonian Gas Shale of Eastern Kentrucky for Enhanced Gas Recovery and CO2 Storage. Soc. Pet. Eng. 2009. [Google Scholar] [CrossRef]
- Liu, F.; Ellett, K.; Xiao, Y.; Rupp, J.A. Assessing the feasibility of CO2 storage in the New Albany Shale (Devonian–Mississippian) with potential enhanced gas recovery using reservoir simulation. Int. J. Greenh. Gas Control 2013, 17, 111–126. [Google Scholar] [CrossRef]
- Tao, Z.; Clarens, A. Estimating the carbon sequestration capacity of shale formations using methane production rates. Environ. Sci. Technol. 2013, 47, 11318–11325. [Google Scholar] [CrossRef]
- Liu, D.; Li, Y.; Agarwal, R.K. Numerical simulation of long-term storage of CO2 in Yanchang shale reservoir of the Ordos basin in China. Chem. Geol. 2016, 440, 288–305. [Google Scholar] [CrossRef]
- Benson, S.; Cook, P.; Anderson, J.; Bachu, S.; Nimir, H.B.; Basu, B. Capter 5—Underground geological storage. In IPCC Special Report on CO2 Capture and Sequestration; Cambridge University Press: New York, NY, USA, 2005. [Google Scholar]
- Hesse, M.A.; Orr, F.M.; Tchelepi, H.A. Gravity currents with residual trapping. J. Fluid Mech. 2008, 611, 35–60. [Google Scholar] [CrossRef]
- Juanes, R.; Spiteri, E.J.; Orr, F.M.; Blunt, M.J. Impact of relative permeability hysteresis on geological CO2 storage. Water Resour. Res. 2006, 42, 395–397. [Google Scholar] [CrossRef]
- Saadatpoor, E.; Bryant, S.L.; Sepehrnoori, K. New Trapping Mechanism in Carbon Sequestration. Transp. Porous Media 2010, 82, 3–17. [Google Scholar] [CrossRef]
- Kim, T.H.; Cho, J.; Lee, K.S. Evaluation of CO2 injection in shale gas reservoirs with multi-component transport and geomechanical effects. Appl. Energy 2017, 190, 1195–1206. [Google Scholar] [CrossRef]
- Liu, D.; Agarwal, R.; Li, Y. Numerical simulation and optimization of CO2 enhanced shale gas recovery using a genetic algorithm. J. Clean. Prod. 2017, 164, 1093–1104. [Google Scholar] [CrossRef]
- Xu, X.; Chen, S.; Zhang, D. Convective stability analysis of the long-term storage of carbon dioxide in deep saline aquifer. Adv. Water Resour. 2006, 29, 397–407. [Google Scholar] [CrossRef]
- Green, C.P.; Ennis-King, J. Steady dissolution rate due to convective mixing in anisotropic porous media. Adv. Water Resour. 2014, 73, 65–73. [Google Scholar] [CrossRef]
- De Paoli, M.; Zonta, F.; Soldati, A. Dissolution in anisotropic porous media: Modelling convection regimes from onset to shutdown. Phys. Fluids 2017, 29, 026601. [Google Scholar] [CrossRef]
- Li, X.; Li, Q.; Bai, B.; Wei, N.; Yuan, W. The geomechanics of Shenhua carbon dioxide capture and storage (CCS) demonstration project in Ordos Basin, China. J. Rock Mech. Geotech. Eng. 2016, 8, 948–966. [Google Scholar] [CrossRef]
- Jiao, Z.; Surdam, R.C.; Zhou, L.; Stauffer, P.H.; Luo, T. A feasibility study of geological CO2 sequestration in the Ordos Basin, China. Energy Procedia 2011, 4, 5982–5989. [Google Scholar] [CrossRef] [Green Version]
- Liu, D.; Li, Y.; Song, S.; Agarwal, R. Simulation and analysis of lithology heterogeneity on CO2 geological sequestration in deep saline aquifer: A case study of the Ordos Basin. Environ. Earth Sci. 2016, 75, 1–13. [Google Scholar] [CrossRef]
- Blunt, M.J. An Empirical Model for Three-Phase Relative Permeability. Spe J. 1999, 5, 435–445. [Google Scholar] [CrossRef]
- Carlson, F.M. Simulation of Relative Permeability Hysteresis to the Nonwetting Phase. In Proceedings of the Spe Technical Conference and Exhibition, San Antonio, TX, USA, 4–7 October 1981. [Google Scholar]
- Land, C.S. Calculation of Imbibition Relative Permeability for Two and Three-Phase Flow from Rock Properties. Soc. Pet. Eng. J. 1968, 8, 149–156. [Google Scholar] [CrossRef]
- Land, C.S. Comparison of Calculated with Experimental Imbibition Relative Permeability. Soc. Pet. Eng. J. 1971, 11, 419–425. [Google Scholar] [CrossRef]
- Lenhard, R.J.; Oostrom, M. A Parametric Model for Predicting Relative Permeability-Saturation-Capillary Pressure Relationships of Oil–Water Systems in Porous Media with Mixed Wettability. Transp. Porous Media 1998, 31, 109–131. [Google Scholar] [CrossRef]
- Zhang, W.; Li, Y.; Xu, T. Long-term variations of CO2 trapped in different mechanisms in deep saline formations: A case study of the Songliao Basin, China. Int. J. Greenh. Gas Control 2009, 3, 161–180. [Google Scholar] [CrossRef] [Green Version]
- Liu, D.; Agarwal, R.; Li, Y.; Yang, S. Reactive transport modeling of mineral carbonation in unaltered and altered basalts during CO2 sequestration. Int. J. Greenh. Gas Control 2019, 85, 109–210. [Google Scholar] [CrossRef]
- Bethke, C.M. Geochemical Reaction Modeling; Oxford University Press: New York, NY, USA, 1996. [Google Scholar]
- Nghiem, L.; Sammon, P.; Grabenstetter, J.; Ohkuma, H. Modeling CO2 storage in aquifers with a fully-coupled geochemical EOS compositional simulator. Soc. Pet. Eng. 2004. [Google Scholar] [CrossRef]
- Duan, H.; Fang, H.; Zhao, C.; Bai, J.; Feng, Q. Study on adaptability of shale gas network fracturing in Fuxian, Ordos Basin. Sci. Technol. Eng. 2013, 13, 8434–8439. [Google Scholar]
- Vilarrasa, V.; Bolster, D.; Dentz, M.; Olivella, S.; Carrera, J. Effects of CO2 compressibility on CO2 storage in deep saline aquifers. Transp. Porous Media 2010, 85, 619–639. [Google Scholar] [CrossRef] [Green Version]
- Yang, G.; Li, Y.; Atrens, A.; Liu, D.; Wang, Y.; Jia, L.; Lu, Y. Reactive transport modeling of long-term CO2 sequestration mechanisms at the Shenhua CCS demonstration project, China. J. Earth Sci. 2017, 28, 457–472. [Google Scholar] [CrossRef]
- Gaus, I.; Azaroual, M.; Czernichowski-Lauriol, I. Reactive transport modelling of the impact of CO2 injection on the clayey cap rock at Sleipner (North Sea). Chem. Geol. 2005, 217, 319–337. [Google Scholar] [CrossRef]
- Gallo, Y.L.; Trenty, L.; Michel, A.; Vidal-Gilbert, S.; Parra, T. Long-Term Flow Simulations of CO2 Storage in Saline Aquifer. In Proceedings of the GHGT8 Conference, Trondheim, Norway, 18 June 2006. [Google Scholar]
- Carroll, S.A.; Mcnab, W.W.; Torres, S.C. Experimental Study of Cement—Sandstone/Shale—Brine—CO2 Interactions. Geochem. Trans. 2011, 12, 1–19. [Google Scholar] [CrossRef] [Green Version]
- Peng, D.; Robinson, D.B. A new two-constant equation of state. Ind. Eng. Chem. Fundam. 1976, 15, 59–64. [Google Scholar] [CrossRef]
- Jossi, J.A.; Stiel, L.I.; Thodos, G. The viscosity of pure substances in the dense gaseous and liquid phases. AIChe J. 1962, 8, 59–63. [Google Scholar] [CrossRef]
- Xu, T.; Apps, J.A.; Pruess, K. Reactive geochemical transport simulation to study mineral trapping for CO2 disposal in deep arenaceous formations. J. Geophys. Res. Solid Earth 2003, 108, B2. [Google Scholar] [CrossRef]
- Strapoc, D.; Mastalerz, M.; Schimmelmann, A.; Drobniak, A.; Hasenmueller, N.R. Geochemical constraints on the origin and volume of gas in the New Albany Shale (Devonian–Mississippian), eastern Illinois Basin. AAPG Bull. 2010, 94, 1713–1740. [Google Scholar] [CrossRef]
- Vermylen, J.P. Geomechanical Studies of the Barnett Shale; Stanford University: Stanford, CA, USA, 2011. [Google Scholar]
- Xu, R.; Rong, L.; Jin, M.; Di, H.; Jiang, P. Effect of mineral dissolution/precipitation and CO2 exsolution on CO2 transport in Geological Carbon Storage. Acc. Chem. Res. 2017, 50, 2056–2066. [Google Scholar] [CrossRef]
- Birkholzer, J.; Zhou, Q.; Tsang, C. Large-scale impact of CO2 storage in deep saline aquifers: A sensitivity study on pressure response in stratified systems. Int. J. Greenh. Gas Control 2009, 3, 181–194. [Google Scholar] [CrossRef] [Green Version]
- Liu, D.; Agarwal, R.; Li, Y. Numerical simulation and optimization of CO2-enhanced water recovery by employing a genetic algorithm. J. Clean. Prod. 2016, 133, 994–1007. [Google Scholar] [CrossRef]
Figure 1.
Geological map and oil/gas resources distribution in the Shannbei slope of the Ordos basin, China (Modified from [23,24]).

Figure 2.
(a) Corey’s model and (b) Land’s trapping model.

Figure 3.
(a) Schematic of the computational model and (b) the mineral composition of the Yanchang (YC) shale and Liujiagou (LJG) sand.
Figure 3.
(a) Schematic of the computational model and (b) the mineral composition of the Yanchang (YC) shale and Liujiagou (LJG) sand.

Figure 4.
Comparison of the gas saturation and pH change with time in the injection cell using the two numerical programs—GEM and TOUGHREACT.
Figure 4.
Comparison of the gas saturation and pH change with time in the injection cell using the two numerical programs—GEM and TOUGHREACT.

Figure 5.
(a,b) Cumulative CO2 storage under different mechanisms in shale and sand; (c,e) free CO2 distribution for case 1 (YC shale) at 30 years and 500 years; (d,f) free CO2 distribution for case 2 (LJG sand) at 30 years and 500 years.
Figure 5.
(a,b) Cumulative CO2 storage under different mechanisms in shale and sand; (c,e) free CO2 distribution for case 1 (YC shale) at 30 years and 500 years; (d,f) free CO2 distribution for case 2 (LJG sand) at 30 years and 500 years.

Figure 6.
(a,b) Cumulative CO2 storage under different mechanisms at different CO2 injection rates; (c,e,g) free CO2 distribution for case 2 at 30 years, 100 years and 500 years; and (d,f,h) free CO2 distribution for case 3 at 30 years, 100 years and 500 years.
Figure 6.
(a,b) Cumulative CO2 storage under different mechanisms at different CO2 injection rates; (c,e,g) free CO2 distribution for case 2 at 30 years, 100 years and 500 years; and (d,f,h) free CO2 distribution for case 3 at 30 years, 100 years and 500 years.

Figure 7.
Cumulative CO2 storage in different storage mechanisms using various CO2 injection schemes. (a): gas phase;(b): adsorbed phase; (c): dissolved and residual phase; (d): mineral phase)
Figure 7.
Cumulative CO2 storage in different storage mechanisms using various CO2 injection schemes. (a): gas phase;(b): adsorbed phase; (c): dissolved and residual phase; (d): mineral phase)

Figure 8.
Free CO2 distributions for case 2, case 4 and case 5 at 30, 100 and 500 years. (a,b,c) compares the gas phase CO2 distribution of continuous injection scenario at 30 yrs, 100 yrs and 500 yrs, respectively; (d,e,f) shows the gas phase CO2 distribution of huff-n-puff injection scenario at 30 yrs, 100 yrs and 500 yrs; (g,h,i) gives gas phase CO2 distribution of water alternative injection scenario at 30 yrs, 100 yrs and 500 yrs.).

Figure 9.
Pressure evolution at observation point # 1 (X = 275 m, Y = 375 m) for different cases. (a) compares the pressure perturbation of continuous injection scenario of shale and sand and also the influence of injection rate; (b) shows the pressure build-up of continuous injection scenario, huff-n-puff injection scenario and water alternate injection scenario of shale reservoir).

Figure 10.
Storage security of CO2 in (a) a deep saline aquifer and (b) in a depleted shale reservoir.
Figure 10.
Storage security of CO2 in (a) a deep saline aquifer and (b) in a depleted shale reservoir.


Table 1.
Properties of Yanchang shale and the Shenhua saline aquifer used in the simulation.
| Properties | YC Shale | LJG Sand | |
|---|---|---|---|
| Matrix | Fracture | ||
| Pressure | |||
| Temperature/(°C) | 34.15 a | 56 c | |
| Porosity/(%) | 10 a | 9.3 c | |
| Gas Diffusivity/(m2/s) | 1.00 × 10⁻⁹ b | 1.00 × 10⁻⁹ b | |
| Rock density/(kg/m3) | 2249 a | 2249 a | |
| Permeability/(mD) | 2.53 × 10⁻⁴ a | 3.300 × 10⁻³ a | 5.615 c |
| Salinity(%) | 3 | ||
| TOC/(%) | 5 a | / | |
| Compressibility/(1/Pa) | 4.5 × 10⁻¹⁰ c | 4.5 × 10⁻⁹ c | 2.5 × 10⁻⁹ d |
| Maximal adsorbed gas(CO2) /(cm3/g) | 1.258 a | / | / |
| Langmuir adsorption constant(CO2) /(1/Pa) | 1.295 × 10⁻⁷ a | / | / |
| Maximal adsorbed gas(CH4) /(cm3/g) | 0.224 a | / | / |
| Langmuir adsorption constant(CH4) /(1/Pa) | 6.702 × 10⁻⁸ a | / | / |
Table 2.
Simulation cases.
| Case Description | Description | Lithology | |||
|---|---|---|---|---|---|
| Gas Adsorption | CO2 Injection Rate/(m3/day) * | CO2 Injection Period /(year) | CO2 Injection Scheme | ||
| Case1 | / | 4000 | 30 | Continuous injection | LJG sand |
| Case2 | 4000 | 30 | Continuous injection | YC shale | |
| Case3 | 2000 | 60 | Continuous injection | YC shale | |
| Case4 | 4000 | 30 | Huff-n-puff injection | YC shale | |
| Case5 | 4000 | 30 | Water alternating gas injection | YC shale | |
* 4000 m3/day ≈ 0.09 kg/s.
Table 3.
Comparison of CO2 amount in different phases for case 2 and case 3.
| Cumulative CO2 Trapped under Different Mechanisms/(106 moles) | |||||
|---|---|---|---|---|---|
| Case | Hydrodynamic Trapping | Adsorbed Trapping | Residual Trapping | Dissolution Trapping | Mineral Trapping |
| Case2 | 656.59 | 474.66 | 102.03 | 179.12 | 458.06 |
| Case3 | 695.15 | 472.18 | 82.11 | 177.39 | 443.53 |
| Deviation | 5.87% | −0.52% | −19.52% | −0.97% | 3.17% |
© 2020 by the authors. Licensee MDPI, Basel, Switzerland. This article is an open access article distributed under the terms and conditions of the Creative Commons Attribution (CC BY) license (http://creativecommons.org/licenses/by/4.0/).
Share and Cite
MDPI and ACS Style
Liu, D.; Li, Y.; Agarwal, R. Evaluation of CO2 Storage in a Shale Gas Reservoir Compared to a Deep Saline Aquifer in the Ordos Basin of China. Energies 2020, 13, 3397. https://doi.org/10.3390/en13133397
AMA Style
Liu D, Li Y, Agarwal R. Evaluation of CO2 Storage in a Shale Gas Reservoir Compared to a Deep Saline Aquifer in the Ordos Basin of China. Energies. 2020; 13(13):3397. https://doi.org/10.3390/en13133397
Chicago/Turabian StyleLiu, Danqing, Yilian Li, and Ramesh Agarwal. 2020. "Evaluation of CO2 Storage in a Shale Gas Reservoir Compared to a Deep Saline Aquifer in the Ordos Basin of China" Energies 13, no. 13: 3397. https://doi.org/10.3390/en13133397
Note that from the first issue of 2016, this journal uses article numbers instead of page numbers. See further details here.