the Creative Commons Attribution 4.0 License.
the Creative Commons Attribution 4.0 License.
 | 27 Nov 2019
Validity and limitations of simple reaction kinetics to calculate concentrations of organic compounds from ion counts in PTR-MS
W. Joe F. Acton
William J. Bloss
Martin Breitenlechner
Leigh R. Crilley
Sébastien Dusanter
Marc Gonin
Valerie Gros
Frank N. Keutsch
Astrid Kiendler-Scharr
Louisa J. Kramer
Jordan E. Krechmer
Baptiste Languille
Nadine Locoge
Felipe Lopez-Hilfiker
Dušan Materić
Sergi Moreno
Eiko Nemitz
Lauriane L. J. Quéléver
Roland Sarda Esteve
Stéphane Sauvage
Simon Schallhart
Roberto Sommariva
Ralf Tillmann
Sergej Wedel
David R. Worton
Kangming Xu
Alexander Zaytsev
In September 2017, we conducted a proton-transfer-reaction mass-spectrometry (PTR-MS) intercomparison campaign at the CESAR observatory, a rural site in the central Netherlands near the village of Cabauw. Nine research groups deployed a total of 11 instruments covering a wide range of instrument types and performance. We applied a new calibration method based on fast injection of a gas standard through a sample loop. This approach allows calibrations on timescales of seconds, and within a few minutes an automated sequence can be run allowing one to retrieve diagnostic parameters that indicate the performance status. We developed a method to retrieve the mass-dependent transmission from the fast calibrations, which is an essential characteristic of PTR-MS instruments, limiting the potential to calculate concentrations based on counting statistics and simple reaction kinetics in the reactor/drift tube. Our measurements show that PTR-MS instruments follow the simple reaction kinetics if operated in the standard range for pressures and temperature of the reaction chamber (i.e. 1–4 mbar, 30–120∘, respectively), as well as a reduced field strength E∕N in the range of 100–160 Td. If artefacts can be ruled out, it becomes possible to quantify the signals of uncalibrated organics with accuracies better than ±30 %. The simple reaction kinetics approach produces less accurate results at E∕N levels below 100 Td, because significant fractions of primary ions form water hydronium clusters. Deprotonation through reactive collisions of protonated organics with water molecules needs to be considered when the collision energy is a substantial fraction of the exoergicity of the proton transfer reaction and/or if protonated organics undergo many collisions with water molecules.
- Article
(3067 KB) - Full-text XML
-
Supplement
(5201 KB) - BibTeX
- EndNote


During the last 20 years, PTR-MS developed to be a relevant and widely applied technique that resulted in major advances in the field of atmospheric sciences (e.g. Lelieveld et al., 2001; Kirkby et al., 2011; Park et al., 2013; Tröstl et al., 2016). Since the conception of PTR-MS, there has been awareness for the potential of this technique to provide quantitative measurements for compounds that cannot be calibrated (e.g. Hansel et al., 1999). However, in practice, this potential cannot be fully exploited without reliable and applicable methods to retrieve the mass-dependent transmission of PTR-MS instruments. For example, Cappellin et al. (2012) demonstrated the quantitative properties of a PTR-TOF8000 instrument by assuming a theoretical transmission based on the duty cycle of the time-of-flight mass analyser. However, new-generation instruments substantially gained sensitivity by using advanced ion optics between the reactor and mass analyser at the cost of the transmission of the whole system being less well constrained – especially in the lower mass range. In addition, poor tuning and/or ageing of the ion detection system can cause deviations from the expected behaviour at the high mass range (Müller et al., 2014). So, fast and robust methods for retrieving the transmission are needed for quantitative measurements. Another requirement is the knowledge of the reaction rate constant for proton transfer between protonated water and the compound to be quantified. Proton transfer reactions typically occur at collisional rates, which can be calculated using quantum chemical methods (e.g. Su, 1994; Zhao and Zhang, 2004). Sekimoto et al. (2017) developed a method to estimate the reaction rate constant from the molecular composition rather than from molecular polarizability and dipole moment. Such attempts are promising and may further increase the stand-alone quantitative capacity of PTR-MS by exploiting parameters that are directly measured (i.e. the molecular composition of the ion to be quantified).
There are valuable and highly cited publications that explore best practices in PTR-MS measurements (e.g. Blake et al., 2009; De Gouw and Warneke, 2007; Yuan et al., 2017), including methods to calibrate and retrieve the transmission (Taipale et al., 2008). However, many of these methods are slow and labour intensive and typically not included in an automated workflow. Therefore, calibrations and transmission retrievals are not performed frequently enough, and as a consequence the long-term accuracy of PTR-MS measurements is often limited. As a result, PTR-MS is mainly used in campaign-scale deployments, and there are only a few long-term studies that cover more than 1–2 months of measurements (e.g. Holzinger et al., 2006), and to the best of our knowledge there is only one group performing multi-year PTR-MS measurements (Taipale et al., 2008).
In the context of the European-funded ACTRIS program (https://www.actris.eu/, last access: 30 October 2019), we aim at establishing PTR-MS as a technique for long-term monitoring of trace gases. This requires a standard operation protocol (SOP) that includes effective calibrations and assures the highest possible and controllable data quality. Despite more than 2 decades of PTR-MS measurements there are no comprehensive inter-comparison studies and no SOPs that are widely used within the PTR-MS-user community. The quality of PTR-MS data largely depends on the skills and knowledge of the operator. In order to set first steps towards a widely accepted SOP, we organized the PTR-MS Intercomparison Campaign at CABauw (PICAB), which was performed in September 2017 at the CESAR observatory (http://www.cesar-observatory.nl/, last access: 30 October 2019), a rural site near the village of Cabauw in the central Netherlands. The campaign was conducted under the auspices of the European infrastructure program ACTRIS-2 and attracted nine groups from Europe and the United States with a total of 11 PTR-MS instruments, including latest developments of the technology such as PTR3 (Breitenlechner et al., 2017) and Vocus (Krechmer et al., 2018) instruments.
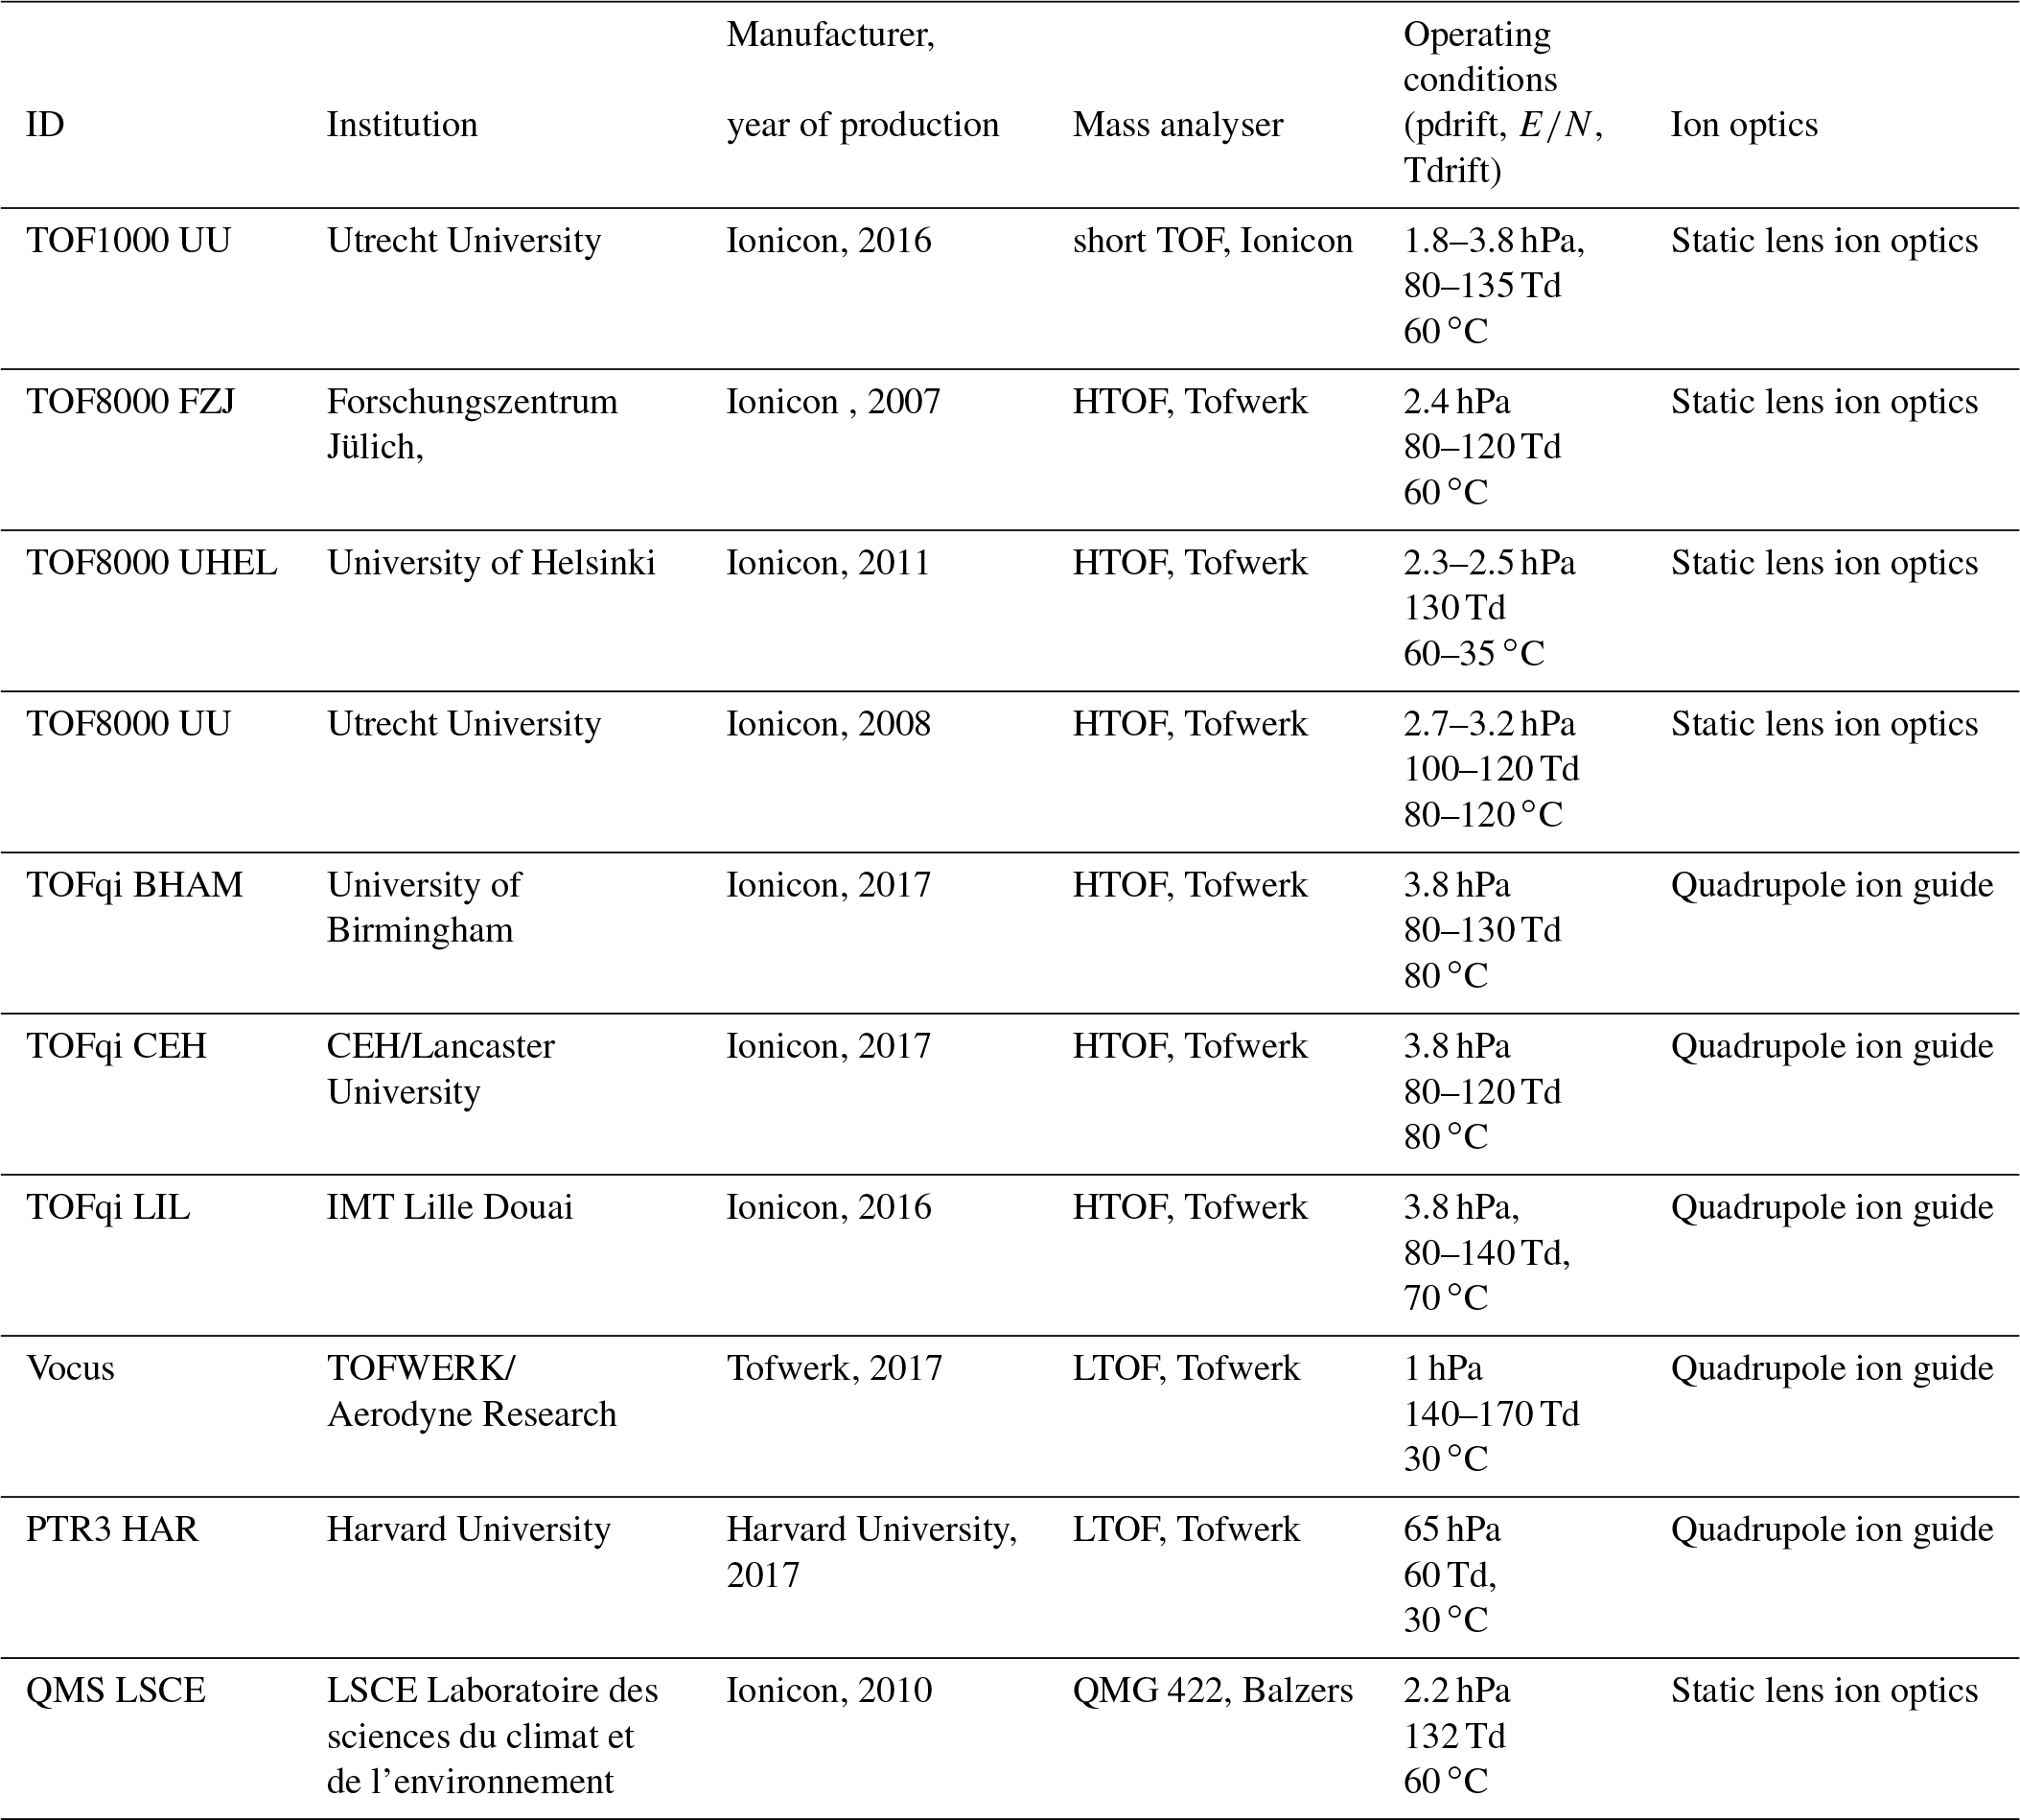
In this work, we investigate the power and limitations of a simple-reaction-kinetics-based calibration approach, drawing on the results obtained with a novel calibration method based on injections of a gas standard from a sample loop. These calibrations have been applied several times on all instruments participating in the campaign. Table 1 gives an overview of the 10 instruments which were used for this study. Details about the experimental setup are given in the method section. In addition, we frame methods on how to retrieve compound-specific measured sensitivities and the instrument specific transmissions from the gas standard injections, as well as how to calculate the expected compound-specific sensitivities using a simple reaction kinetics model. In the results section we discuss the wide range of measured sensitivities before exploring in depth the agreement between measured and expected sensitivities. We were able to constrain limitations of the method. Several artefacts and clear directions for future work became apparent from the analysis.
Table 1Overview of the PTR-MS instruments participating in the inter-calibration exercise.
2.1 The calibration unit
The calibration unit is depicted in Fig. 1. The core piece is a 250 µL sample loop connected to a six-port valve allowing well-defined gas standard injections into the PTR-MS instruments. A small flow (∼10 mL min−1) of carrier gas transports the content of the sample loop (i.e. a multi-component gas standard containing approximately 1 µmol mol−1 per compound in N2) to a T connection where it is mixed into a larger flow (0.2–2 L min−1) of dry or humidified carrier gas. The small flow is tuned to produce a pulse duration of approximately 1 s. The larger flow is used for diluting the gas standard to ∼5 nmol mol−1 for the Vocus, to ∼2 nmol mol−1 for the PTR3 (additional extra dilution), and to ∼50 nmol mol−1 for all other instruments. In order to avoid wall loss, the sample loop, six-port valve, and dilution system are operated at approximately 80 ∘C, and all materials in contact with the gas standard are either stainless steel with Sulfinert® coating (Restek Inc.) or Teflon PFA. The sample loop approach allows one to perform full calibrations very quickly (within 1–2 s). Multiple calibrations in a row can be performed to assess the quality of the calibrations directly and/or to explore different operating conditions (e.g. humidified or dry gas, E∕N settings).
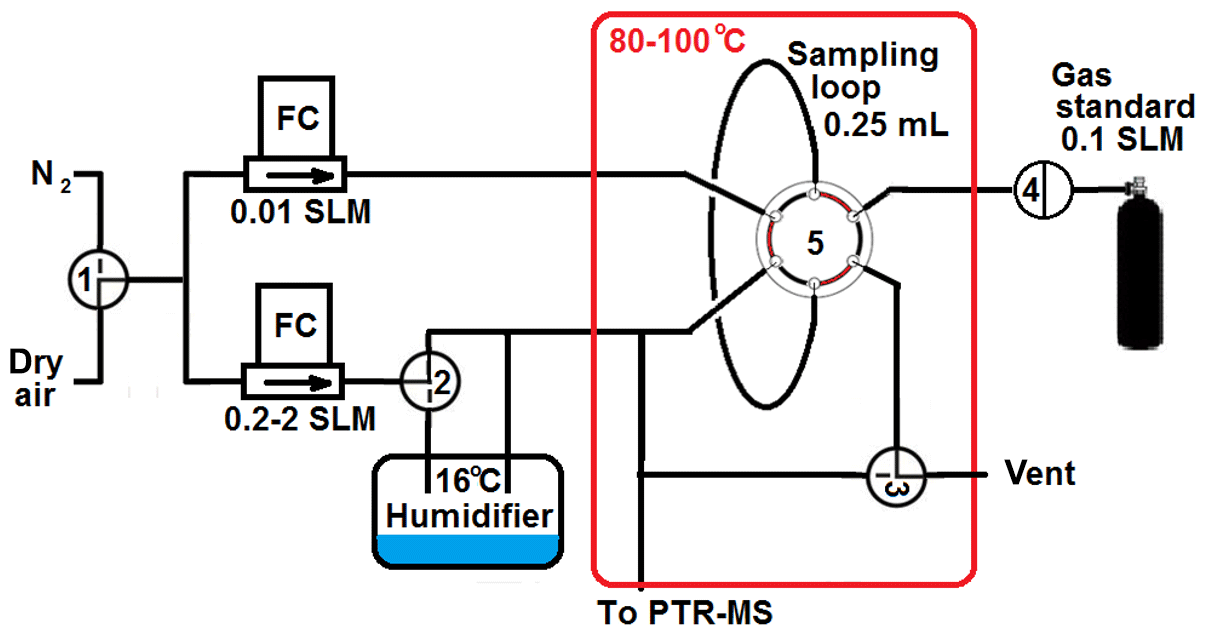
Figure 1Schematic of the semi-automated calibration unit. Manual three-way valves allow selection of dry air or nitrogen as carrier gas (valve 1), dry or humidified carrier gas (valve 2), and sample loop injections or dynamic mixing of carrier gas and gas standard (valve 3). Valve 4 (PFA solenoid) and valve 5 (Valco 6 port with Restek Sulfinert® coating) are controlled to provide a sequence of 10 injections in 1 min.
After dilution the mixing ratios are large enough to ensure good counting statistics but also small enough to avoid saturation effects. In Fig. S1 in the Supplement, we show the standard addition protocol. In essence, the sequence consisted of 50 sample loop injections, i.e. 5 sets of 10 injections using dry nitrogen, dry air, humidified air, humidified nitrogen, and dry nitrogen as carrier gas, respectively. On selected instruments and occasions, calibrations were performed sequentially at different E∕N values to investigate their effect on the calibrations. During the campaign, we used two different gas standards produced by Apel Riemer Environmental, Inc., USA (AR), which was used until 22 September 2017, and the National Physical Laboratory, UK (NPL), which was used from 23 September onwards. Both gas standards contained compounds that are entirely detected at their protonated mass as well as a few compounds that partially fragment during protonation (e.g. monoterpenes, siloxanes, and isoprene). The compounds in the gas standards cover the mass-to-charge (m∕Q) range 33–373 Th. Details on the gas standards are given in Tables S1 and S2. Figure 2 shows an example of the raw signal (in counts per second, cps) during the 50 injections of the calibration on the TOFqi LIL instrument on 21 September 2017, which is representative for all calibrations and instruments. The 16 compounds in the gas standard produce 22 ions which are all shown in the panels of Fig. 2. The different colours indicate the carrier gas. The reproducibility was tested by totalling the signal of individual injections and calculating the standard deviation of the 10 injections using the same carrier gas. This analysis showed that the reproducibility was typically 1 % unless counting statistics were the limiting factor (see percent values printed in the charts of Fig. 2).

Figure 2Raw count signal of the main ions produced by the organic compounds in the gas standard during the 50 sample loop injections. For example, the top right chart shows the signal at 71.049 Th originating from protonated methyl vinyl ketone (MVK, C4H6O). In the top left of the chart an identifier code (including the integer m∕Q value of the detected ion) is printed in black and the number below the identifier indicates the maximum volume mixing ratio (in nmol mol−1) that is expected during an injection. The different colours correspond to the injections in different carrier gases (with dry nitrogen, dry air, humidified air, humidified nitrogen, and dry nitrogen corresponding to red blue purple green, and yellow, respectively). The percent values printed at the right edge of each chart indicate the reproducibility of the 10 injections of each set.
2.2 Data processing
All basic data processing of PTR-MS instruments with a time-of-flight (TOF) mass analyser was done with PTRwid (Holzinger, 2015). For the subsequent analyses we used the raw data output files that provide time series of ion signals (in cps) for all ions that were auto-detected in the mass spectrum. These raw data closely correspond to the raw data obtained from PTR-MS instruments using a quadrupole mass spectrometer (QMS), allowing TOF and QMS instruments to be directly compared.
2.2.1 Retrieving the transmission
We modelled the transmission as a combination of three functions with a total of five parameters. We developed an algorithm to retrieve the five parameters from gas standard injections as shown in Fig. 2. The three functions optimized the transmission in the medium, low, and high m∕Q range, respectively.
The characteristics of the mass spectrometer in the medium m∕Q range (59–122 Th) are approximated according to Eq. (1):
where M corresponds to m∕Q, and a is a parameter between 0 and 2 describing the characteristics of the mass analysers in the medium m∕Q range. To optimize this parameter, we used the signal of compounds in the gas standard that are detected in the range 59–122 Th. For TOF instruments a is expected to be around 0.5, because the kinetic energy of the ions is proportional to the square of their velocity, whereas QMS instruments should exhibit little to no mass-dependent discrimination in this m∕Q range, and thus a is expected to be close to 0.
The retrieval algorithm calculates an initial value for the parameter a, by calculating a linear fit of the function , where Sm is the measured sensitivity (see below). The condition for the initial value for a ( in the range 0 to 2) is that the linear fit function of f(M) produces a zero slope. For fragmenting compounds (e.g. isoprene) we added the measured sensitivity of the fragment to the sensitivity of the protonated ion (used in the algorithm).
A high masses pass filter according to Eq. (2):
where M corresponds to m∕Q, ML is the m∕Q around which the high masses pass filter becomes active, and wL is the filter slope at ML. This filter is used to model the reduced transmission in the low m∕Q range that mostly results from the ion optics between the drift tube/reactor and mass analyser. The parameters ML and wL are optimized by optimizing the agreement between Sm and Sexpd (see below) for all compounds in the gas standard that are detected below 60 Th.
The retrieval algorithm optimized the parameters a, ML, and wL in a two-step loop. In step 1 the parameters ML and wL were optimized as described above, with the condition that f2 (. In step 2, the parameter a was optimized to maximize the agreement between measured and expected sensitivities for compounds detected in the range 59–138 Th. For fragmenting compounds (isoprene, monoterpenes) we added the measured sensitivity of the fragment and the protonated ion.
A low masses pass filter according to Eq. (3):
where M corresponds to m∕Q, MH is a parameter that sets the m∕Q around which the low masses pass filter becomes active, and wH is the filter slope at MH. This filter is used to model the reduced transmission in the high m∕Q range, which can be changed by ageing of the microchannel plate or secondary electron multiplier in TOF and QMS analysers, respectively. In order to optimize the parameters MH and wH we use all compounds in the gas standard that are detected above 120 Th.
The retrieval algorithm optimized the parameters MH and wH by maximizing the agreement between measured and expected sensitivities for compounds detected above 120 Th, with the condition that . For fragmenting compounds (monoterpenes, hexamethylcyclotrisiloxane (D3), octamethylcyclotetrasiloxane (D4), and decamethylcyclopentasiloxane (D5)) we added the measured sensitivity of the fragment and the protonated ion.
Finally, the transmission is calculated by multiplying Eqs. (1), (2), and (3) and a normalization step to set the transmission at 59 Th to 1 (Eq. 4). We chose to normalize to 59 Th (protonated acetone) because the transmission around this m∕Q is high for all mass analysers used in this study; besides that it is an arbitrary choice:
Note that the algorithm considers H3O+ and H2OH3O+ as primary ions that both protonate with the same efficiency. However, the protonation efficiency of hydronium water clusters is reduced for many compounds, and therefore we expect the best results for measurements with low contributions of water hydronium clusters to the total primary ion signal.
For the PTR3, the number of species which can be used for this approach is limited to those where deprotonation reactions are negligible and the protonation efficiencies for hydronium and hydronium water clusters are similar (more details in Appendix A). Therefore, only six species were taken into account for retrieving the transmission for this instrument as shown in Fig. A2: acetone, methyl vinyl ketone (MVK), methyl ethyl ketone (MEK), and the three siloxanes. For this study we used the first 10 injections with dry N2 as carrier gas to retrieve the transmissions and the remaining 40 injections using dry and humidified air and N2 for validation. A few example retrievals are shown in Figs. S2 and S3.
2.2.2 Retrieving and calculating sensitivities
We report three types of sensitivity.
First, the measured sensitivity is calculated from the calibrations in the field. The measured sensitivity Sm is often reported in units of counts per second per parts per billion (cps ppb−1)1 and can be expected from every single injection according to Eq. (5):
where C(x) is the total signal (counts) of compound x measured during an injection, qV is the total flow provided by the calibration unit in moles s−1, and n is the amount of substance of compound x in the sample loop in moles. C(x) is calculated by totalling the signal of x during an injection and subtracting a baseline signal that is recorded before and after the injection2, and n(x) is calculated according to Eq. (6):
where c(x) is the fraction of compound x in the gas standard in mol mol−1, Vl is the volume of the sample loop in m3, Tl and pl are the temperature and pressure in the sample loop in K and Pa, respectively. The parameter R corresponds to the gas constant (8.31 J mol−1 K−1).
The measured sensitivity Sm(x) is a direct proxy of the statistical uncertainty. Together with the instrumental background this quantity determines the precision and the limit of detection.
The normalized sensitivity (SN) is calculated similarly. The only difference is the multiplication by a dimensionless factor N that normalizes to a reagent ion flux of 106 cps and corrects for the transmission:
If we consider H3O+ and H2OH3O+ as primary ions, the factor N is calculated according to Eq. (8):
where F(H3O+) and F(H2OH3O+) are the fluxes3 of the H3O+ and H2OH3O+ primary ions in cps. The functions τ (...) in Eq. (8) are the transmission efficiencies at the m∕Q of reagent and product ions, respectively, as defined in Eqs. (1) to (4).
The normalized sensitivity (SN) is a useful quantity that can be related to fundamental kinetic parameters in the PTR-MS. Different instruments that operate under similar conditions (i.e. pressure, temperature, humidity, and electrical field across the drift tube) should retrieve similar normalized sensitivities.
Based on simple reaction kinetics (including the requirements of insignificant reagent ion depletion), the expected sensitivity can be calculated according to Eq. (10):
where t is the residence time and F the flux of the reagent ions (H3O+ + H2OH3O+) in the reaction chamber (drift tube); pR, TR, and nR are pressure, temperature, and gas density in the reaction chamber; the constants p0=101 325 Pa, T0=273.15 K, and molecules cm−3 are pressure, temperature, and number density of air under normal conditions, respectively. The reaction rate constant, k(x), is in the range 1.85– cm3 s−1 molecule−1 for all compounds present in the gas standards. The values that were used in this study are given in Table S3. Note that the expected sensitivity can be directly compared to the normalized sensitivity (SN) if we use F=106 cps for the reagent ion flux. For the PTR3 HAR instrument the residence time, t, is given by the flow through the reaction chamber and has been estimated to be 3.5±0.5 ms for all calibration measurements. For the other instruments, the residence time has been calculated according to Eq. (11):
where d is the length, and E the electrical field strength across the length of the reaction chamber4. The constant K is the mobility of H3O+ ions and K0 is the reduced mobility of H3O+ ions for which we used a value of 2.7 cm2 V−1 s−1 (Dotan et al., 1976).
The normalized and expected sensitivities, SN and Sexpd, can be directly compared and provide a measure on how well ionization in the PTR-MS is constrained by basic reaction kinetics, which is important to assess the accuracy of concentrations for compounds that are not calibrated frequently with a gas standard.
Note that Eqs. (10) and (11) are analogous to methods presented by Hansel et al. (1995) that calculate the volume mixing ratio of volatile organic compounds (VOCs) based on kinetic conditions in the drift tube.
For the PTR3 HAR, higher water hydronium clusters need to be considered and deprotonation is a non-negligible process for several species present in the calibration standard5. A conceptual framework for calculation of sensitivities taking this process into account is presented in Appendix A. Figure A1 shows that calculation for compounds with high proton affinity – where deprotonation is negligible – leads to accurate (within 20 %) predictions. For species which show significant deprotonation rates, on the other hand, calculated sensitivities have increasing uncertainties and water dependencies.
3.1 Retrieved transmissions
All transmissions shown in Fig. 3 have been retrieved from the first 10 injections that used dry N2 as carrier gas. Transmissions obviously vary between instruments but also over time for individual instruments. However, instruments that were operated under constant conditions (e.g. TOF8000 UHEL, and QMS LSCE) exhibited little variation in transmission over time. We find that typically “flatter” transmissions (smaller parameter a in Eq. 1) were retrieved when the instruments were (deliberately) operated at lower E∕N (thin lines in Fig. 3). Considering that higher water clusters of the hydronium ion (H3O+(H2O)n, with n>1) could provide significant fractions of the primary ion signal at lower E∕N (which is not accounted for in our algorithm), we would expect to retrieve “steeper” transmissions (larger parameter a in Eq. 1) in the range 20–50 Th. However, we do not observe this effect, so we conclude that we did not miss a significant fraction of the primary ion signal. On the other hand, flatter transmissions were also retrieved from gas standard injections that used humidified carrier gas. An example is shown in Fig. S3. This suggests that several compounds in the gas standard must be detected with lower sensitivity than expected. The cause for reduced sensitivities includes slower proton transfer with hydronium clusters, as reported for benzene (Warneke et al., 2001), as well as more complicated ion chemistry involving back reaction of protonated compounds with water vapour as has been reported for formaldehyde (Hansel et al., 1997). Together with evidence presented below we suggest that the flattening of transmission with lower E∕N is caused by slower proton transfer with hydronium clusters.
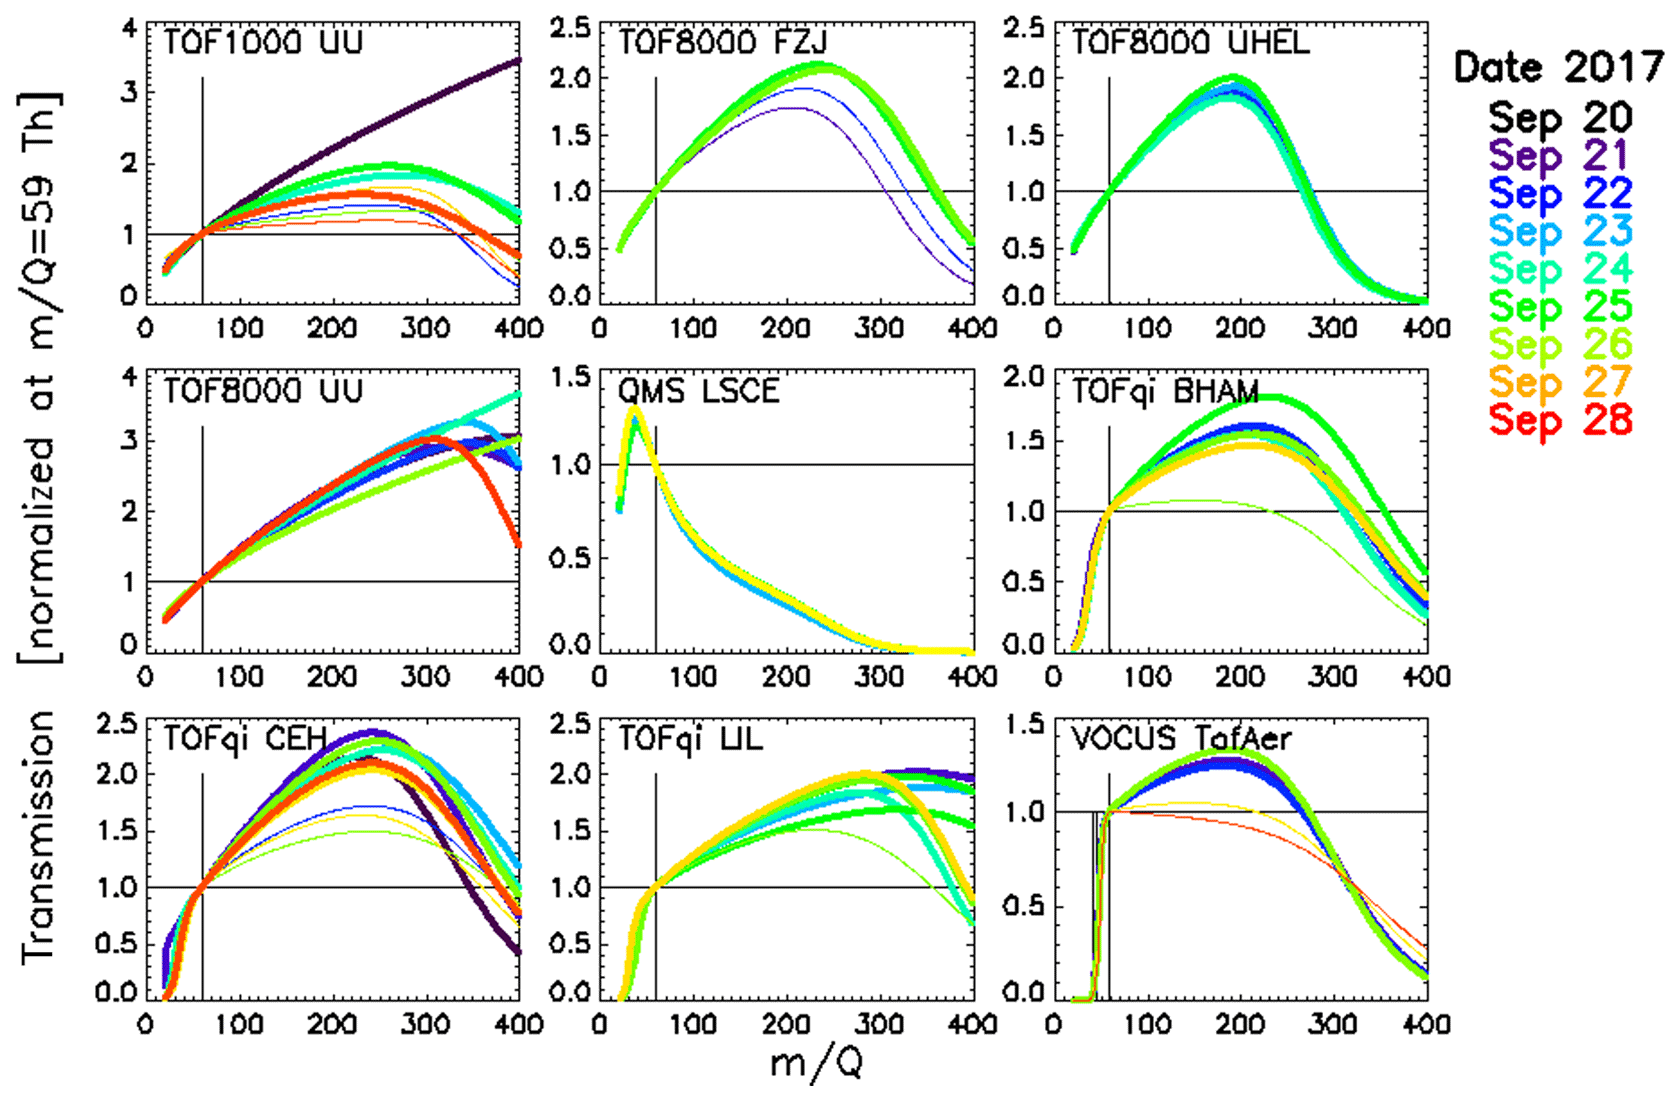
Figure 3Retrieved transmission for all PTR-MS instruments (except the PTR3 instrument). Thin lines represent measurements at E∕N below 150 Td for the Vocus and below 100 Td for all other instruments. The colours indicate the date of the measurements.
3.2 Measured and expected sensitivities
Figure 4 shows that the measured sensitivities for all instruments and compounds in the gas standards cover the range 1–2×10⁵ cps ppb−1. Note that identifying the best instrument was not the purpose of this study. Some instruments were deliberately operated outside the optimal range in terms of tuning (sensitivity) or energetics in the drift tube/reactor (E∕N). In general, we note that the large difference in sensitivity for the PTR-MS instruments is rooted in different tuning and ion optics, or innovative concepts that further boost the sensitivity of the Vocus and PTR3 instruments. For many compounds the PTR3 instrument is at least 1 order of magnitude more sensitive than any other instrument. This is due to the very different conditions under which the PTR3 instrument is operated: the PTR3 instrument gains sensitivity by allowing for longer reaction times and a higher pressure in the reaction chamber rather than by boosting the primary ion signal. As a result, reagent ions undergo approximately 1000 times more collisions with the analyte gas molecules compared with the other instruments. While this concept overall leads to greatly enhanced sensitivities, it also complicates quantification: deprotonation reactions of the form → limit the sensitivity for a broader range of species, while in other instruments this is only the case for formaldehyde and a few other compounds with proton affinities just slightly above that of water. Furthermore, the PTR3 is operated at a reduced electric field strength of 60±5 Td; therefore, the primary ion distribution is dominated by water hydronium clusters. Thus, ligand switching reactions with internal proton transfer dominate over direct proton transfer from the hydronium ion. Both effects lead to relatively poor and uncertain sensitivities for compounds having a low proton affinity and/or low dipole moment, both preventing efficient ligand switching reactions. This explains that the measured sensitivities of the different compounds cover several orders of magnitude for the PTR3 instrument, whereas for all other instruments the measured sensitivities are typical within 1 order of magnitude (Fig. 4). The lower sensitivity of the QMS LSCE instrument for higher m∕Q values is a property of the quadrupole mass analyser that is used in this instrument. Figure 4 reveals lower-than-expected sensitivities in the Vocus instrument for methanol, acetonitrile, acetaldehyde, 3F-benzene, and 3Cl-benzene. For the three lighter compounds the reason is a very sharp high mass pass filter6 that suppresses virtually the entire signal of protonated methanol at Th, and therefore we exclude Vocus methanol data from further analysis. The filter reduces protonated acetonitrile (42 Th) and acetaldehyde (45 Th) by about 90 %; however, this should be accounted for by the retrieved transmissions.
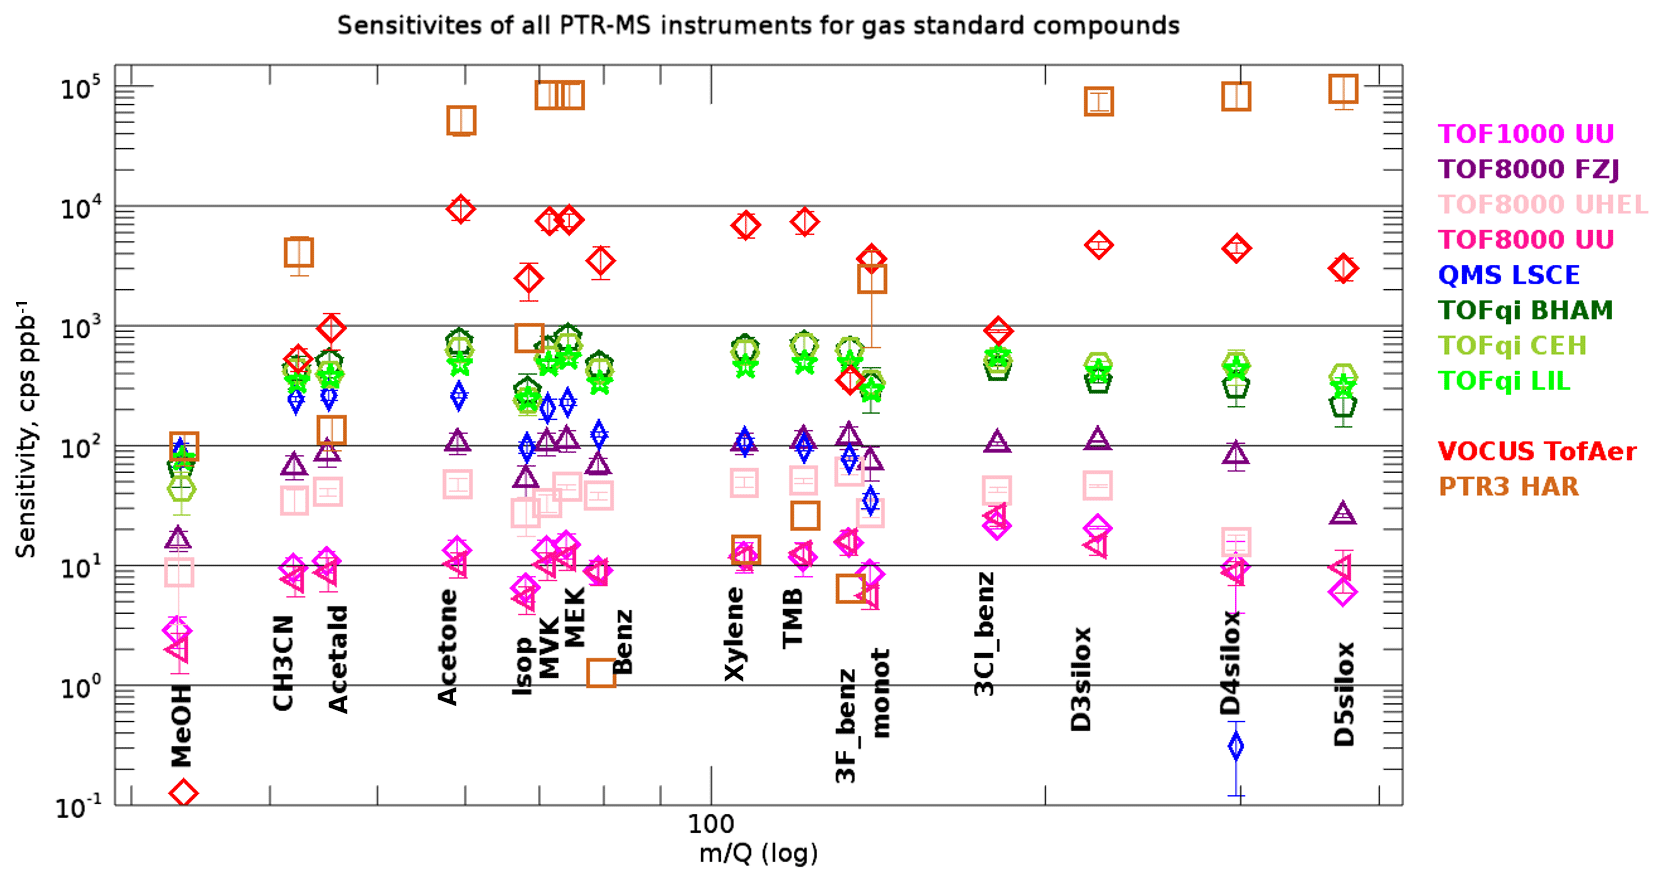
Figure 4Mean measured sensitivities for all compounds in the gas standards and all PTR-MS instruments. The error bars represent the standard deviation of all calibrations with dry N2 or air. The measured sensitivities cover more than 4 orders of magnitude. The compounds (protonated mass in parenthesis) from left to right are methanol (33 Th), acetonitrile (42 Th), acetaldehyde (45 Th), acetone (59 Th), isoprene (69 Th)/methylbutenol (87 Th, main fragment on 69 Th), methyl vinyl ketone (71 Th), methyl ethyl ketone (73 Th), benzene (79 Th), xylene (107 Th), trimethylbenzene (121 Th), trifluorobenzene (133 Th), 3-carene/α-pinene (137 Th), trichlorobenzene (181 Th), D3 siloxane (223 Th), D4 siloxane (297 Th), and D5 siloxane (371 Th).
Further insights can be obtained from looking at the ratio of measured to expected sensitivity, which should be unity if the reaction kinetics are accounted for correctly and if there are no additional losses. Figure 5 shows this ratio for all compounds in the gas standard and for all instruments. Data from all injections using dry carrier gas (N2 or air), except those that were used to retrieve the transmissions, are included in Fig. 5. For many compounds the ratio deviates much less than ±30 % from unity; the boundary of this range is indicated by the black horizontal lines in Fig. 5. In principle, this demonstrates the potential of PTR-MS to quantify organic compounds without calibration. However, some limitations emerge from the data shown in Fig. 5.
Above 150 Th spreading between instruments becomes larger. The likely reason for this is that transmissions are less constrained in this range. Most calibrations were done with the NPL gas standard that contained only two compounds above Th (D4 and D5 siloxanes). There are indications that these two compounds are sticky (note that Fig. 2 shows a poorer reproducibility of these compounds), and thus these results are vulnerable to surface artefacts. Moreover, the combination of Eqs. (1), (2), and (3) may not be the best choice to replicate the real behaviour of all of the mass analysers used. The latter is clearly the case for quadrupole mass analysers, when considering the D4 siloxane ratio for the QMS LSCE instrument (low blue point at 300 Th in Fig. 5). Many instruments show a dipole between D4 and D5 siloxanes (D4 low and D5 high), because the ratios measured to expected sensitivity were inconsistent with the spectrum of retrievable transmissions (dictated by Eqs. 1–3). Such a case is shown in Fig. S2a, where the algorithm minimized the error by distributing the inconsistency between D4 (too low) and D5 (too high), whereas Fig. S2b shows a case with ratios consistent with possible transmissions.
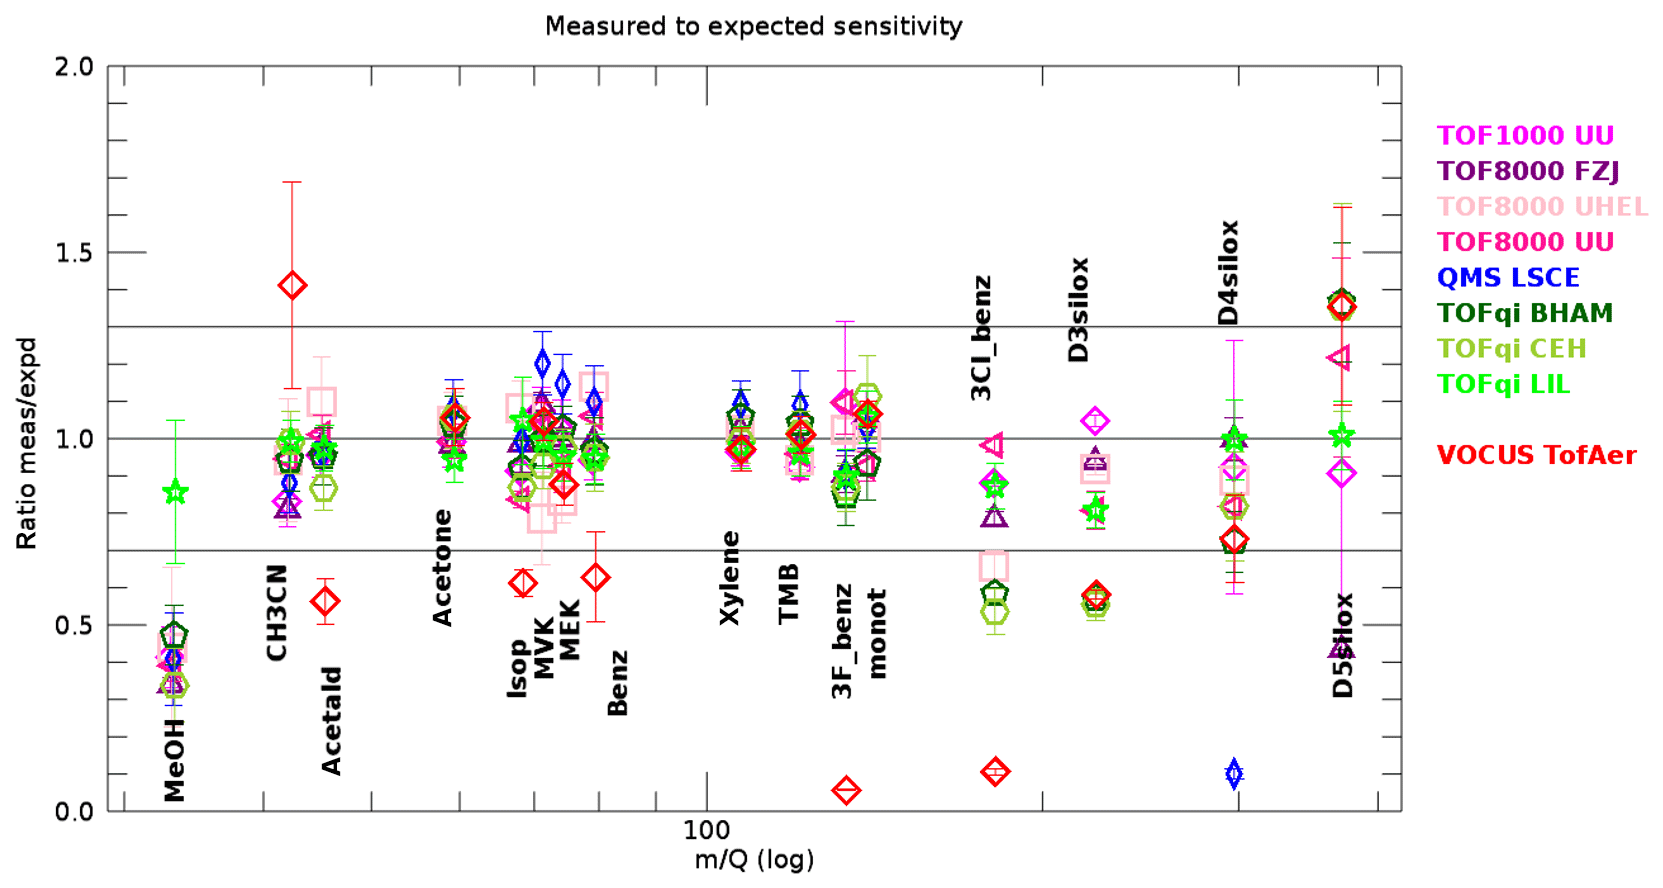
Figure 5The ratio between measured and expected sensitivities as retrieved from dry injections that were not used for transmission retrievals. The data for most compounds and most instruments are well within ±30 %. The error bars represent the standard deviation of all gas standard injections with dry N2 or air as carrier gas, except those that were used to calculate the transmission . Compounds as in Fig. 4.
These issues are likely resolvable with an improved gas standard that contains more compounds in the range 150–400 Th.
Methanol is detected with a lower sensitivity than expected in most instruments. A close inspection revealed that injections using humidified carrier gas clearly produced higher signals, and the injections using dry carrier gas exhibited significant tailing. Both features are visible in the top left chart of Fig. 2. We suggest that this issue is caused by wall effects in the instruments and/or their inlet lines and that the issue is less pronounced under humidified conditions. A similar issue, but less pronounced, was observed for MVK and MEK for the TOF8000 UHEL instrument. These features demonstrate that surface effects in the PTR-MS instruments and their inlet systems can jeopardize quantitative detection of organic compounds.
For the Vocus instrument the ratio measured to expected sensitivity was biased high for acetonitrile and low for acetaldehyde, isoprene, benzene, 3F-benzene, and 3Cl-benzene. The high bias of acetonitrile may be an artefact of the transmission algorithm that tried to compensate for the inconsistency caused by lower-than-expected sensitivity of acetaldehyde. Correcting the bias would further decrease the ratio obtained for acetaldehyde. With respect to other instruments, the Vocus is unique because the reaction chamber contains approximately 30 % of water vapour. Therefore we suggest that lower-than-expected sensitivities of these compounds are the result of reactions of protonated compounds with water vapour. The higher E∕N compared to other instruments is another factor that helps to overcome the energy barrier for these reactions and makes deprotonation more efficient.
3.3 Can PTR-MS quantify uncalibrated organic compounds?
The results shown in Fig. 5 suggest that, in principle, PTR-MS is able of quantifying compounds without calibration based on simple reaction kinetics and a correctly retrieved transmission, if surface effects and unknown fragmentation can be excluded. However, in addition to the aforementioned reservation, the dependence of the retrieved transmissions on E∕N is another concern. In this section, we will further discuss to what extent PTR-MS is capable of performing quantitative measurements of uncalibrated compounds. The results from all gas standard measurements and all instruments are shown in Fig. 6 for acetone as an example. Similar figures for the other compounds are provided in Figs. S4–S18. First-row panels in Fig. 6 show the ratio of primary ions H2OH3O+ to H3O+ as well as operating conditions of the instruments, and the second-row panels show the measured sensitivities for acetone as displayed in Fig. 4. The third-row panels in Fig. 6 show that the normalized sensitivities, SN, are within 1 order of magnitude (6–50 cps ppb−1). This demonstrates that the reagent ion signal is the primary factor that determines the sensitivities of individual PTR-MS instruments. The bottom-row charts in Fig. 6 show that measured and expected sensitivities typically agree within less than 10 % (standard deviation) for all instruments, with some exceptions visible for measurements that used humidified carrier gas.
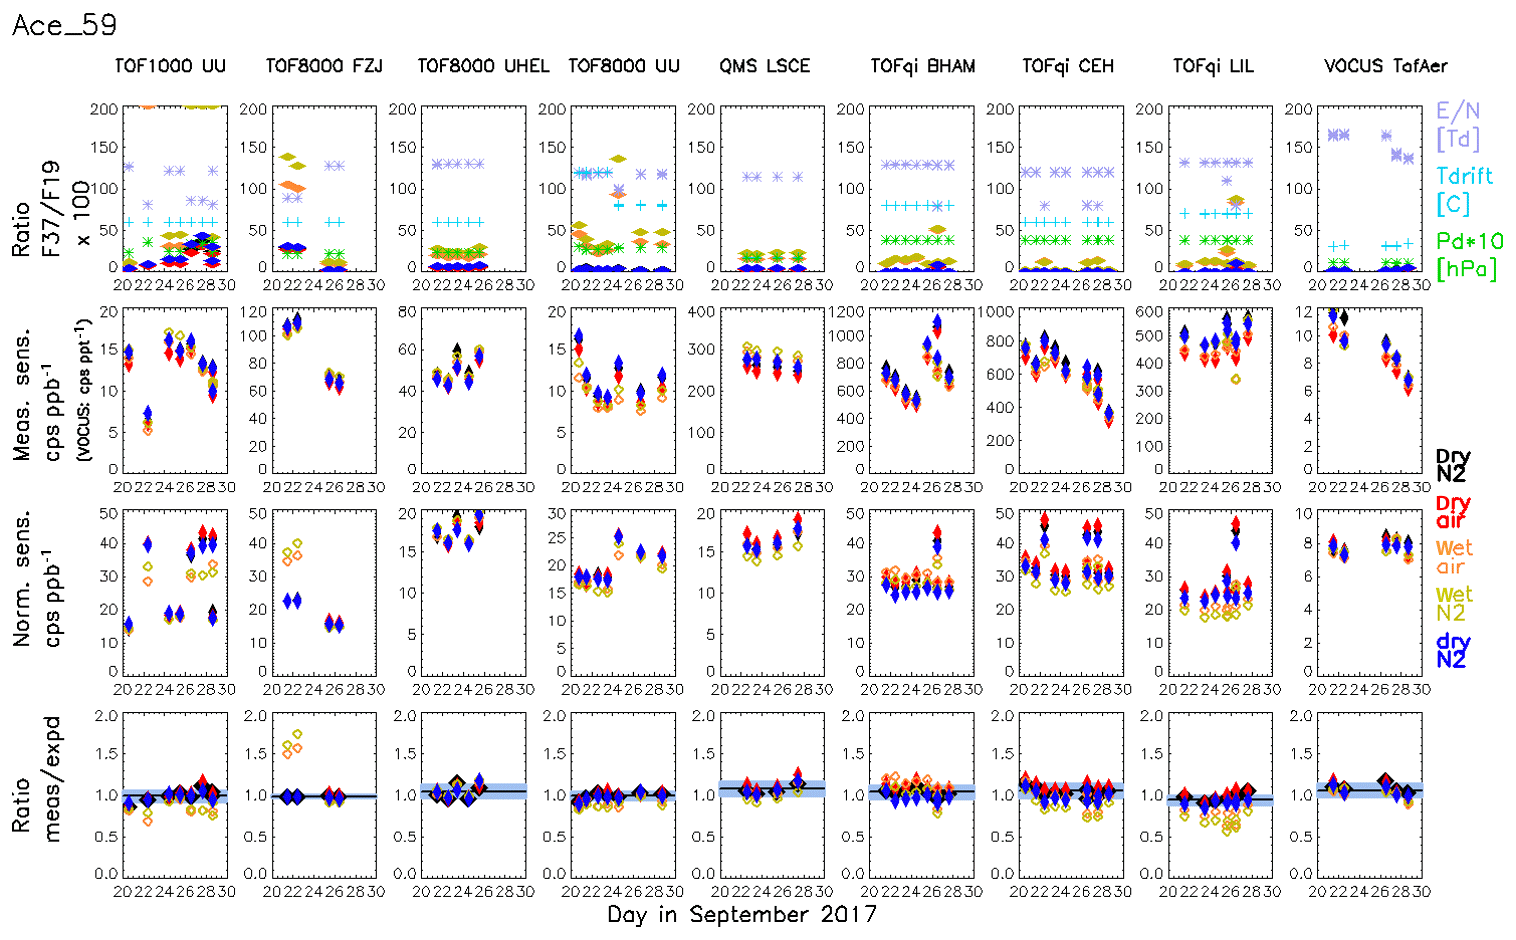
Figure 6Summary for all measurements of acetone following our calibration protocol. Individual instruments are shown in the columns. The first-row panels show the ratio of primary ions H2OH3O+ to H3O+ (transmission corrected) as well as operating conditions of the instruments (temperature, degree, pressure in the drift tube, hPa, and E∕N, Td, i.e. 1017 Vm2). The second-row panels show the measured sensitivity of acetone for all instruments. The third-row panels show the normalized sensitivity, i.e. the measured sensitivity normalized to a transmission-corrected primary ion signal (sum of H3O+ + H2OH3O+) of 106 counts per second. The fourth-row charts show the ratio of the measured to expected sensitivity. The median ratio and the standard deviation of all ratios using dry carrier gas are plotted as black vertical line and grey shade, respectively. The colours and markers represent the different carrier gases. Humidified injections are depicted with open markers (orange and yellow-green for air and nitrogen, respectively); filled markers depict calibrations in dry carrier gas (black, red, and blue for nitrogen, air, and nitrogen, respectively).
The data shown in Fig. 5 represent idealized conditions because the dry carrier gas suppresses the production of water hydronium clusters. Such conditions cannot be achieved in many common applications of PTR-MS. Therefore, we show the ratio of measured to expected sensitivities for the humidified calibrations in Fig. 7. The main message is that for many compounds the ratio is still within ±30 % of unity; however, the spreading between instruments is larger compared with dry gas standard injections. For some instruments the spreading between individual measurements is increased as well (error bars in Fig. 7 compared with error bars in Fig. 5). A closer inspection of Fig. 7 reveals the following.
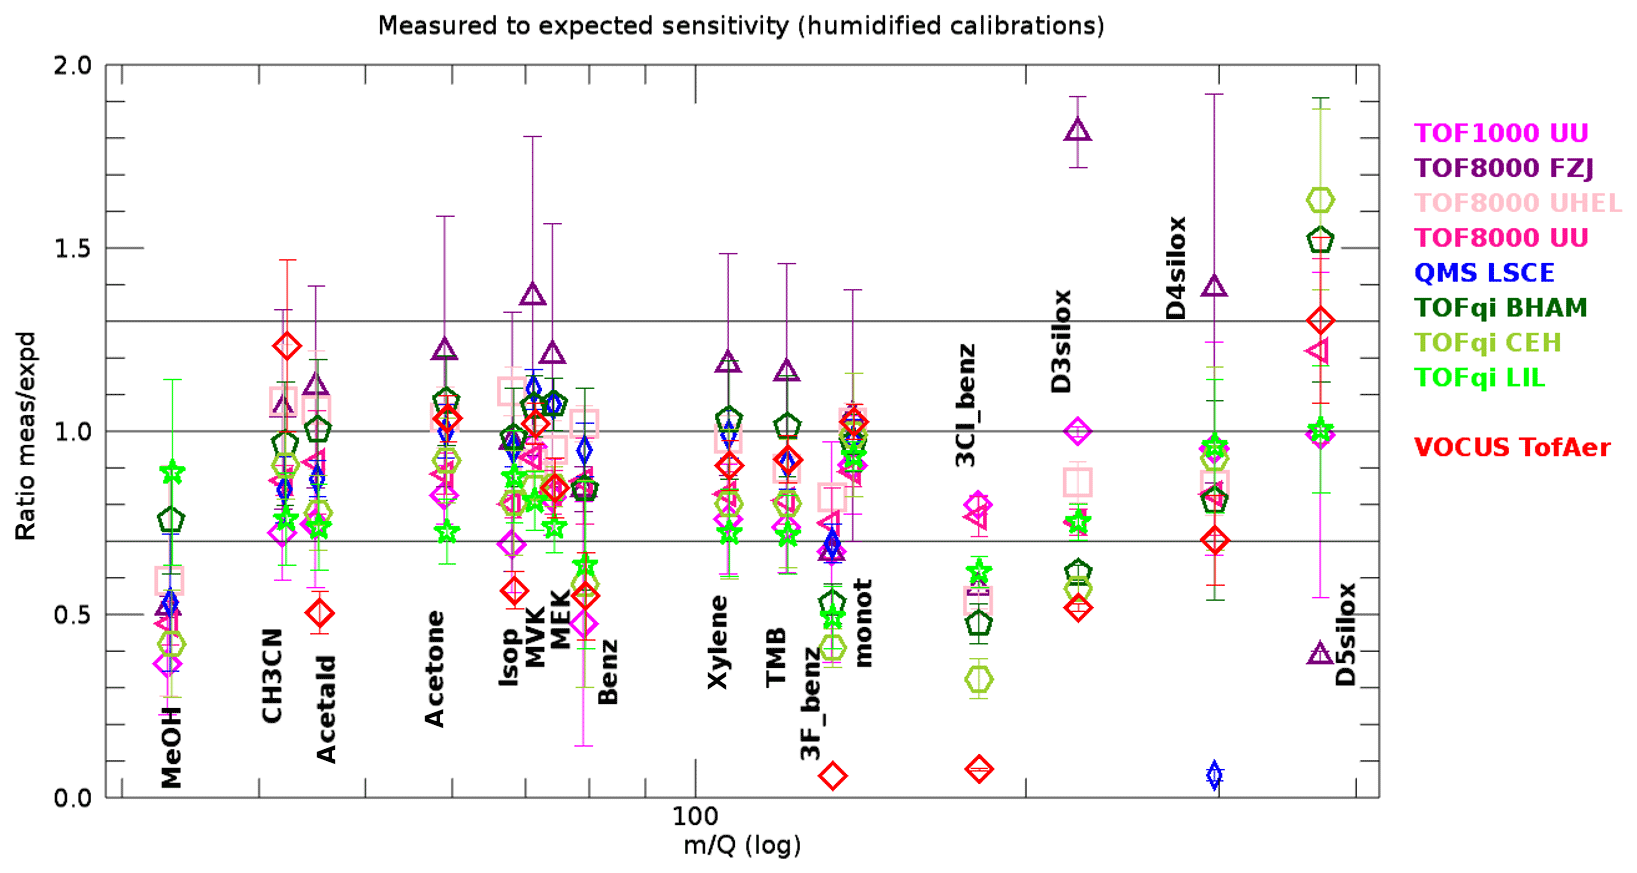
Figure 7Measured versus expected sensitivities retrieved from humidified injections for all compounds in the gas standard and all PTR-MS instruments. The error bars represent the standard deviation of all gas standard injections with humidified N2 or air as carrier gas. Compounds as in Fig. 4.
We observe no significant changes for the Vocus instrument. This is expected because the humidified carrier gas does not add significant extra humidity to the 30 % water vapour that is present in the reactor anyway. Besides the Vocus, the instruments TOF8000 UU, TOF8000 UHEL, QMS LSCE, and TOFqi BHAM also produce very similar results with dry and humidified carrier gas. These instruments were operated at relatively high E∕N values in the range 100–135 Td (except one measurement with TOFqi BHAM). The chosen operating conditions for these instruments resulted in relatively low levels of water hydronium clusters, so that the expected sensitivities produced accurate results. The results for methanol even improved slightly, showing that the surface effects are eased a bit under humid conditions. The same holds for MVK and MEK measured with TOF8000 UHEL.
The ratios for benzene and 3F-benzene are lower. This is likely due to the well-documented fact that these compounds are not efficiently protonated by water hydronium clusters (Warneke et al., 2001).
The instruments TOFqi LIL, and to a lesser extent TOFqi CEH, were biased low by typically 10 %–30 % for all compounds except the siloxanes (D3, D4, and D5) and methanol for TOFqi LIL.
For the instruments TOF1000 UU and TOF8000 FZJ, the spread between individual gas standard measurements is much increased. A closer inspection revealed that measured and expected sensitivities were generally consistent for measurements done at E∕N levels above 100 Td. However, measurements at E∕N levels below 100 Td revealed significant inconsistencies between measured and expected sensitivities. This has also been the case for other instruments during occasional measurements at low E∕N (see deviations from unity in bottom row charts of Fig. 6, and Fig. S4–S18). We note that the inconsistency at low E∕N results in sensitivities that are measured lower than expected, except for the TOF800 FJZ instrument where the opposite was observed.
Points 3 and 4 warrant further discussion. Figure 8 summarizes the results of a comparison of dry and humidified gas standard injections. The panels in Fig. 8 show the ratios of different parameters measured with humidified versus dry carrier gas. Data printed in red, yellow, and blue are the ratios of (i) the primary ion signal (H3O+ + H2OH3O+) corrected by the transmission , (ii) the uncorrected H3O+ signal, and (iii) the measured sensitivities, respectively. The latter has been calculated as the mean measured sensitivity of a core set of compounds (acetonitrile, acetaldehyde, acetone, isoprene, MVK, MEK, xylene, trimethylbenzene (TMB), and monoterpene) that all exhibited very similar trends (see Figs. S4–S18). For all instruments that performed gas standard measurements at E∕N levels below 100 Td we observed that the measured sensitivity decreased for the core set compounds when the carrier gas was humidified. The likely cause is a reduced reaction speed with water hydronium clusters, which could be taken into account in more advanced models to calculate the expected sensitivity. At humidified conditions and an E∕N around 80 Td, less than a few percent of the primary ions are present as H3O+ (de Gouw et al., 2003), which is the likely reason for very low measured sensitivities of benzene (Fig. S9) and 3F-benzene (Fig. S13). Note that only the TOF1000 UU instrument measured low fractions of H3O+ as expected (ratios F37∕F19 are in the range 6–9 for humidified injections at 80 Td); in all other instruments the cluster distribution was not preserved during the transfer from the drift tube into the mass spectrometer (F37/F19 always lower than 1.5; see top panels in Fig. 6).
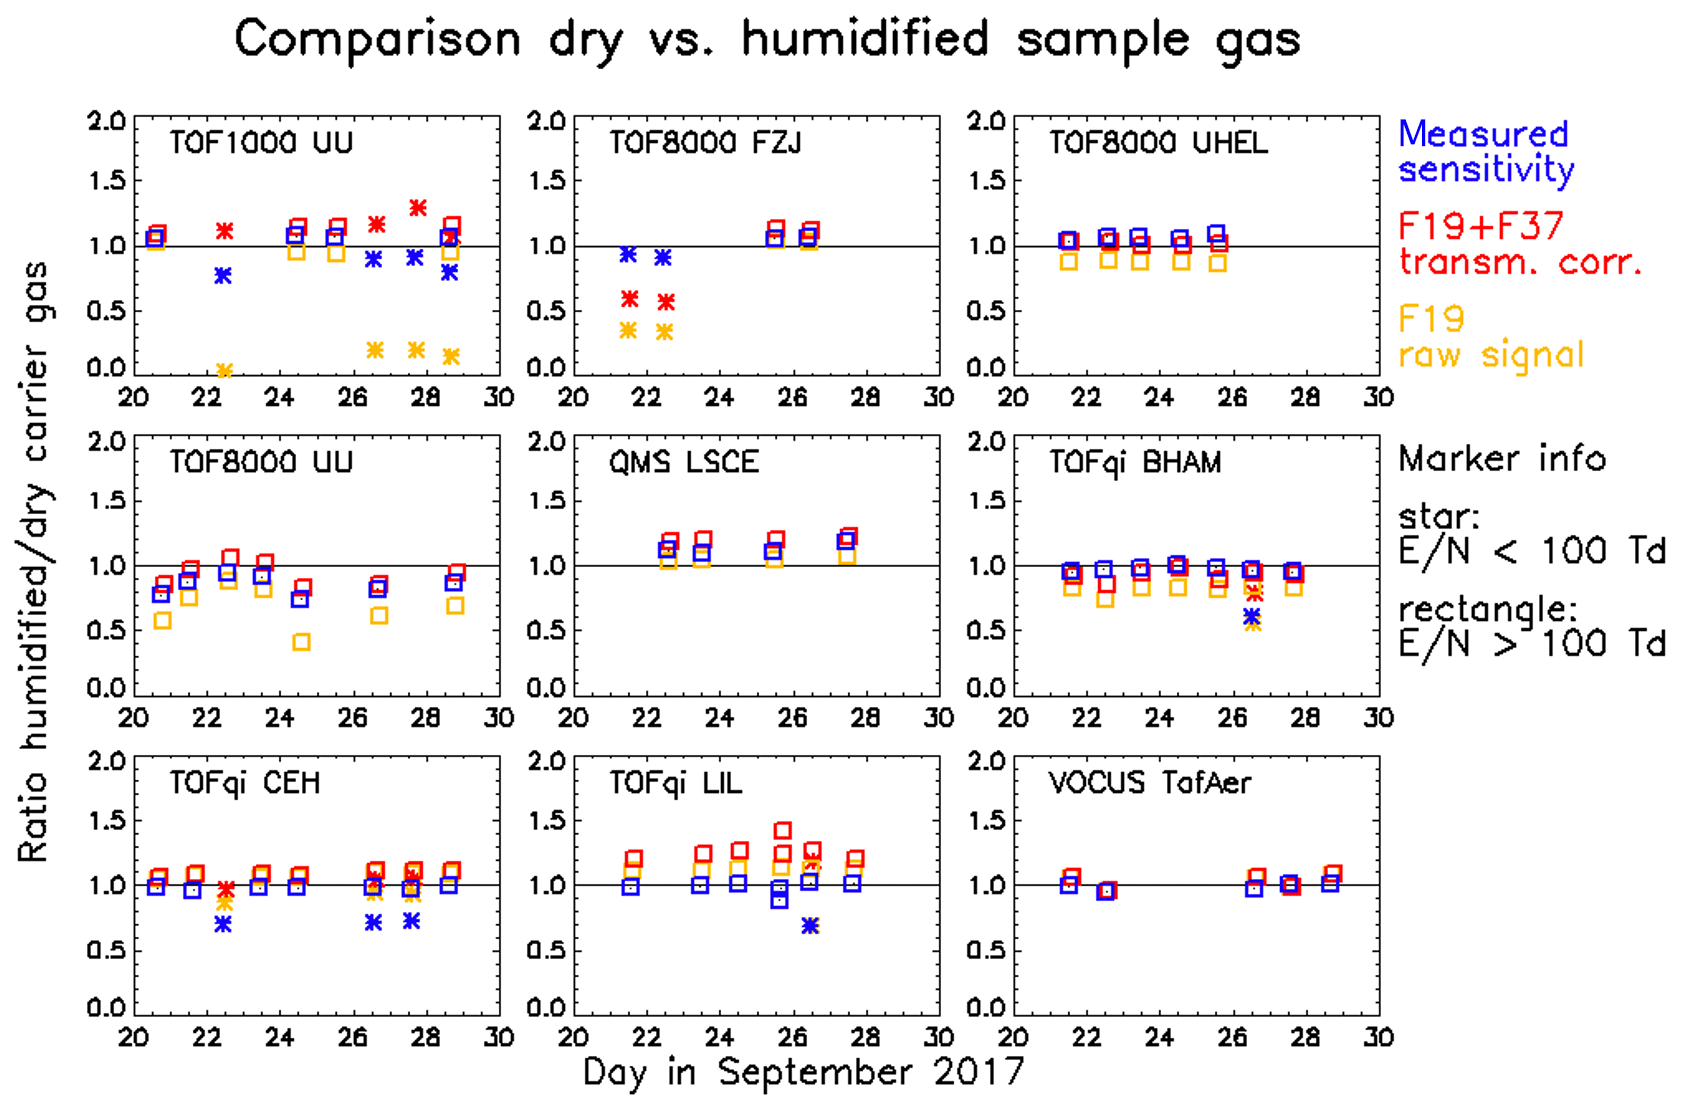
Figure 8Comparison of gas standard injections using humidified and dry carrier gas. The ratios obtained for humidified versus dry injections are shown for (i) the mean measured sensitivity of a core set of compounds (blue), (ii) the transmission-corrected primary ion signal (red), and (iii) the raw H3O+ signal (yellow). The symbols separate measurements done at E∕N levels above (rectangles) or below (stars) 100 Td.
The ratio of measured to expected sensitivity is not sensitive to the humidity of the sample if both the measured sensitivity and the transmission-corrected primary ion signal vary in the same way; i.e. the blue and red data overlap in Fig. 8. For the reasons discussed above, this is not the case for measurements at low E∕N. Another process that causes separation of red and blue data is best visible in the TOFqi LIL chart of Fig. 8. This chart clearly shows that the cause is not a change in the sensitivity, but that for unknown reasons the primary ion signal is recorded higher during humidified measurements. Since the uncorrected H3O+ signal (yellow data in Fig. 8) is recorded higher in the TOFqi LIL instrument as well, we reject the possibility that this may be caused by an artefact in the transmission retrieval. Instead, we think that for unknown reasons primary ions are extracted to the mass analyser more efficiently under humidified conditions. The TOFqi CEH instrument shows a similar but less pronounced effect. An opposite effect was observed for the TOF8000 FZJ instrument: during humidified low E∕N measurements the primary ion signal was recorded lower for unknown reasons, but the measured sensitivity did not decrease correspondingly.
In response to the question posed in this section we state the following.
Quantitative detection (better than ±30 %) is possible for E∕N values above 100 Td if artefacts associated with the transmission of primary ions can be ruled out. The reasons for the artefacts are not explored in this study, but they may be associated with ion optics in the interface between the drift tube and mass spectrometer or with surface ageing (coating) in this region. These artefacts can be detected by comparing gas standard additions using dry and humidified carrier gas, respectively. A required condition is that most of the primary ion signal is present as H3O+ ion, which may require controlling water leakage from the ion source. Alternatively, higher E∕N values can be applied to suppress the formation of water hydronium clusters.
Backward reactions can significantly reduce the sensitivity for compounds with a proton affinity relatively close to that of water. This effect is well known and studied for formaldehyde (Hansel et al., 1997) but can also affect the detection of other compounds in instruments/setups that allow for many collisions of protonated compounds with water molecules as it is the case for the PTR3 instrument (low E∕N and high drift tube pressure; see Appendix A) and to a lesser extent for the Vocus instrument (due to high levels of water vapour in the reaction chamber).
Reliable quantification for E∕N values below 100 Td becomes more complicated because increasing fractions of the primary ions are present in the form of water hydronium clusters. For a number of compounds, this resulted in reduced sensitivities up to 50 % (see Figs. S4–S18), and even larger reductions were observed for benzene and 3F-benzene.
We note that an improved kinetic ion chemistry model that accounts for the cluster distribution, different reaction rates with clusters, the humidity, and the back reaction can expand the limits of quantitative operation of PTR-MS. In this study we did not explore dissociative proton transfer reactions because in traditional PTR-MS applications that focus on volatile organic compounds fragmentation of compounds is the exception rather than the rule (e.g. Lindinger et al., 1998). However, there are indications that this changes dramatically in new fields of application such as the analysis of semi-volatile organic compounds, condensed organics, and dissolved organics (Holzinger et al., 2010; Eichler et al., 2015; Materic et al., 2017). A recent intercomparison study (Gkatzelis et al., 2018) revealed that operating PTR-MS at lower E∕N values strongly reduces the fragmentation of these compounds, which likely will make measuring at lower E∕N an appropriate choice, especially if the disadvantages of that can be compensated for with an improved reaction kinetic model. Finally, we note that the mentioned new fields of applications mostly concern compounds in the range 150–400 Th, which highlights the need to better constrain the transmission in this m∕Q range.
We provided an analysis of more than 70 measurements following our calibration protocol on 10 different PTR-MS instruments over a 10 d period in September 2017. We outlined a simple reaction kinetics model and found that this model accurately predicts the sensitivities if no artefacts interfere and the instruments were operated at E∕N levels above 100 Td. We observed three different artefacts: (i) surface retention of methanol (stickiness) in all instruments and to a lesser extent for MVK and MEK in one instrument, (ii) reduced detection of primary ions under humidified conditions at low E∕N in one instrument, and (iii) enhanced detection of primary ions under humidified conditions in two instruments featuring a quadrupole transfer system between the drift tube and TOF analyser. These artefacts caused errors of order −50 %, +50 %, and −20 %, respectively. At lower E∕N the accuracy of the simple reaction kinetics model is limited because higher fractions of water hydronium clusters are present. Deprotonation reactions can be of concern if the collision energy approaches the exoergicity of the proton transfer reaction and/or protonated compounds undergo many collisions with water molecules. These conditions are of concern for the detection of formaldehyde in all instruments, benzene and 3F-benzene in the Vocus instrument, and several additional compounds in the PTR3 instrument. The used gas standards do not contain sufficient compounds to constrain the transmission in the m∕Q range 150–400 well enough. New fields of applications such as the detection of semi-volatile organic compounds, condensed, and dissolved organics mostly concern organics with molecular weights above 150 Da; therefore, it is desirable to develop gas standards with a good coverage of this m∕Q range. Moreover, reduced fragmentation will warrant the operation at lower E∕N levels for these new applications. Therefore, more advanced reaction kinetics models will be useful developments. However, overall we can conclude that PTR-MS is capable of measuring uncalibrated compounds with an accuracy of ±30 %, and conditionally no unknown fragmentation occurs and deprotonation reactions are of minor significance; i.e. the proton affinity of the analyte is high.
The data can be permanently accessed at http://www.projects.science.uu.nl/atmosphereclimate/Data.php (last access: 20 November 2019; IMAU, 2019).
In the PTR3, the reaction time of primary ions is defined by the gas flow through its reaction chamber, estimated to be 3.5±0.5 ms. Together with a pressure of 65 mbar, primary ions undergo approximately 1000 times more collisions with the analyte gas compared to all other instruments described in this paper. While this concept overall leads to greatly enhanced sensitivities, it also complicates quantification: back reactions (deprotonation) of the form → H3O+ + R are observed for a broader range of species. The PTR3 is operated at a reduced electric field strength of 60±5 Td; therefore, the primary ion distribution is dominated by water clusters. Operation at higher E∕N would push the equilibrium further towards deprotonation, which is not desirable. The observed mass spectrum does not necessarily reflect the true cluster distribution in the reaction chamber, since it is influenced by electric fields in the transfer region towards the mass spectrometer (de Gouw et al., 2003). We use equilibrium constants experimentally obtained by Lau et al. (1982) to obtain the primary ion cluster distribution. The effective ion temperature is calculated following de Gouw et al. (2003), using drift velocities vdrift calculated with ion mobilities from Dotan et al. (1976) for individual hydronium water clusters:
mion,mB, and mH2O are the masses of individual water clusters, the mean molecular mass of the buffer gas (air), and the molecular mass of water, respectively; kB is the Boltzmann constant.
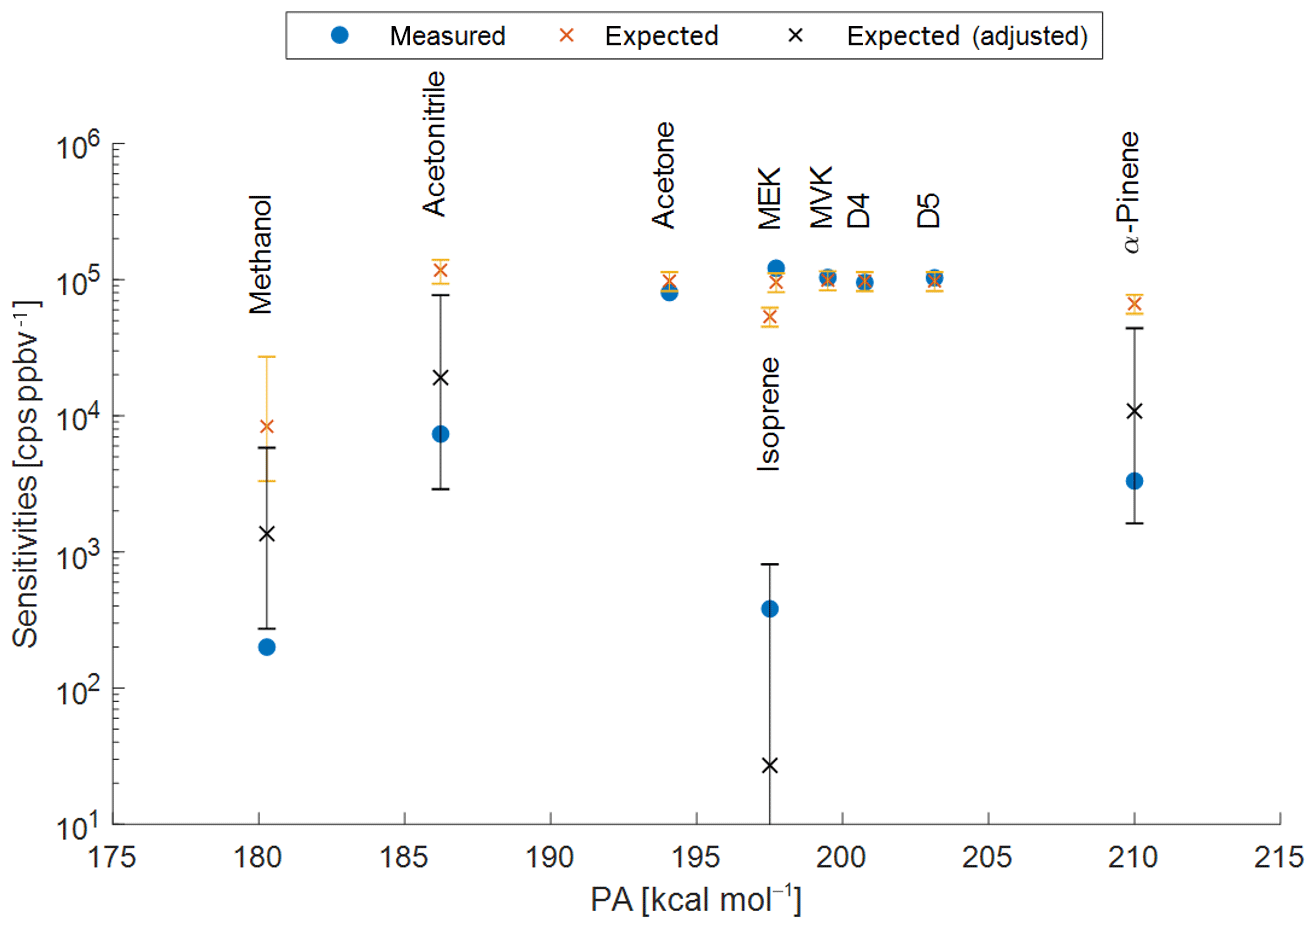
Figure A1Measured (blue points) and expected sensitivities for the PTR3 plotted versus the respective proton affinities (PA). Orange crosses represent expected sensitivities taking into account the back reaction with water vapour and assuming ionization of the respective species with all water clusters H3O+ ⋅ (H2O)n; n=0–6. The black crosses are adjusted to react only with the lowest water clusters n=0–k with k=2 for methanol, acetonitrile, and α-pinene; k=1 for isoprene. The error bars represent the combined uncertainties of the expected values resulting from uncertainties of the water vapour partial pressure (1.2±0.6 mbar), temperature (30±5 ∘C), and reduced electric field strength (60±5 Td) in the reaction chamber. The proton affinities of D4 and D5 siloxanes are unknown, shown for reference only and assumed to be >200 kcal mol−1.
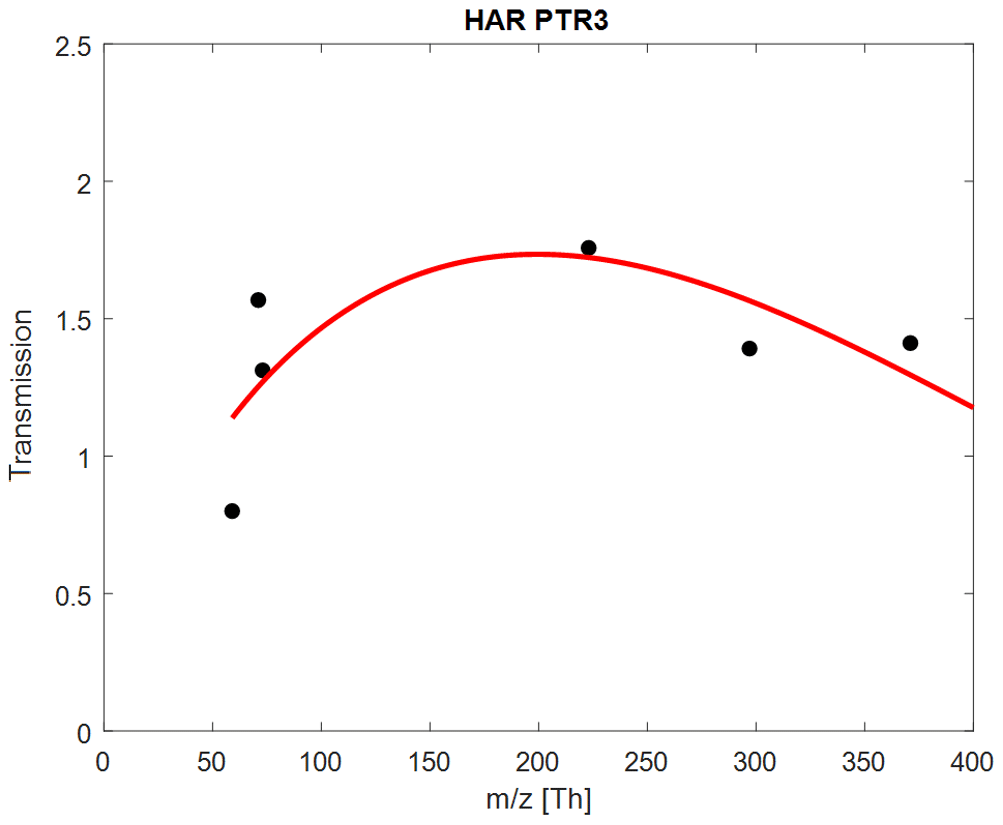
Figure A2Retrieved transmissions for the Harvard PTR3, using a reduced subset of compounds: acetone; MVK; MEK; and D3, D4, and D5 siloxanes.
The forward reaction rate constants kf are calculated using the parametrization of Su (1994) and within ±30 % of the reaction rate constants in Table S3. To account for potential equilibrium conditions due to the aforementioned back reactions, we apply the following formula to calculate sensitivities:
where corresponds to a volume mixing ratio of 1 ppbv (with preact and Treact corresponding to the pressure and temperature in the reactor, respectively, and kB to the Boltzmann constant); is the ion current of the nth hydronium water cluster in counts per second; and kr, treact, and cH2O correspond to the forward reaction rate constant, the residence time in the reactor, and the water vapour number density, respectively. The reverse reaction rate constant kr is calculated via
with PA(R) and PA(H2O) being the proton affinities of molecule R and water, respectively. Ecm is the centre-of-mass kinetic energy between the protonated molecule RH+ and water vapour, calculated according to de Gouw et al. (2003).
Using retrieved transmissions(example shown in Fig. A2), this method leads to good agreement between expected and measured sensitivities for acetone, methyl ethyl ketone (MEK), methyl vinyl ketone (MVK), octamethylcyclotetrasiloxane (D4), and decamethylcyclopentasiloxane (D5), as shown in Figure A1. However, sensitivities for methanol, acetonitrile, isoprene, and α-pinene are overestimated. Smith et al. (2001) showed that isoprene only reacts with H3O+ and H3O+ ⋅ (H2O)n (n=0 and n=1) – by limiting the available primary ions for ionization to these two species, expected sensitivities agree with the measured values within uncertainties. Similar adjustments had to be applied for methanol, acetonitrile, and α-pinene (n<3). The error bars of the expected sensitivities in Fig. A1 show that careful calibrations for these compounds are necessary, since the values are sensitive to operational conditions (humidity, reduced electric field, and temperature).
The supplement related to this article is available online at: https://doi.org/10.5194/amt-12-6193-2019-supplement.
RH designed the study. RH, WJFA, MB, LRC, SD, VG, LJK, JEK, BL, FLH, DM, EN, LLJQ, RSE, SS, RT, SW KX, and AZ participated at the campaign and were responsible for the operation and data of their respective instruments. RH, DM, and KX performed the calibrations with the calibration unit. SM and DRW provided the NPL gas standard. All authors contributed to this article by reading the manuscript and providing the necessary feedback.
The authors declare that they have no conflict of interest.
This project has received funding from the European Union's Horizon 2020 research and innovation programme (ACTRIS-2) under grant agreement no. 654109 and by the Dutch NWO Earth and Life Science (ALW), project 824.14.002. W. Joe F. Acton, Martin Breitenlechner, Leigh R. Crilley, Louisa J. Kramer, Jordan E. Krechmer, Felipe Lopez-Hilfiker, Eiko Nemitz, Lauriane L. J. Quéléver, Simon Schallhart, Ralf Tillmann, Sergej Wedel, and Alexander Zaytsev acknowledge Transnational Access (TNA) travel funding from ACTRIS-2 (grant agreement no. 654109). Eiko Nemitz further acknowledges the support of the UK Natural Environment Research Council (NERC) through grants NE/P016502/1 for instrument funding and NE/R016429/1 as part of the UK-SCaPE programme delivering National Capability. Lauriane L. J. Quéléver and Simon Schallhart acknowledge the Finnish Centre of Excellence program (Project no 307331). Lauriane L. J. Quéléver thank the European Research Council (ERC grant no. 638703-COALA). W. Joe F. Acton has received funding from Natural Environment Research Council (UK) grant NE/N006976/1, Sources and Emissions of Air Pollutants in Beijing (AIRPOLL-Beijing).
This research has been supported by the European Commission (ACTRIS-2, grant no. 654109) and the Netherlands Organisation for Scientific Research (NWO) (grant no. 824.14.002).
This paper was edited by Bin Yuan and reviewed by three anonymous referees.
Blake, R. S., Monks, P. S., and Ellis, A. M.: Proton-Transfer Reaction Mass Spectrometry, Chem. Rev., 109, 861–896, https://doi.org/10.1021/cr800364q, 2009.
Breitenlechner, M., Fischer, L., Hainer, M., Heinritzi, M., Curtius, J., and Hansel, A.: PTR3: An Instrument for Studying the Lifecycle of Reactive Organic Carbon in the Atmosphere, Anal. Chem., 89, 5824–5831, https://doi.org/10.1021/acs.analchem.6b05110, 2017.
Cappellin, L., Karl, T., Probst, M., Ismailova, O., Winkler, P. M., Soukoulis, C., Aprea, E., Märk, T. D., Gasperi, F., and Biasioli, F.: On Quantitative Determination of Volatile Organic Compound Concentrations Using Proton Transfer Reaction Time-of-Flight Mass Spectrometry, Environ. Sci. Technol., 46, 2283–2290, https://doi.org/10.1021/es203985t, 2012.
De Gouw, J., Warneke, C., Karl, T., Eerdekens, G., Van der Veen, C., and Fall, R.: Sensitivity and specificity of atmospheric trace gas detection by proton-transfer-reaction mass spectrometry, Int. J. Mass spectrom., 223–224, 365–382, https://doi.org/10.1016/S1387-3806(02)00926-0, 2003.
De Gouw, J. and Warneke, C.: Measurements of volatile organic compounds in the earth's atmosphere using proton-transferreaction mass spectrometry, Mass Spectrom. Rev., 26, 223–257, https://doi.org/10.1002/mas.20119, 2007.
Dotan, I., Albritton, D. L., Lindinger, W., and Pahl, M.: Mobilities of , N2H+, H3O+, H3O+H2O, and H3O+(H2O)2 ions in N2, J. Chem. Phys., 65, 5028–5030, 1976.
Eichler, P., Müller, M., D'Anna, B., and Wisthaler, A.: A novel inlet system for online chemical analysis of semi-volatile submicron particulate matter, Atmos. Meas. Tech., 8, 1353–1360, https://doi.org/10.5194/amt-8-1353-2015, 2015.
Gkatzelis, G. I., Tillmann, R., Hohaus, T., Müller, M., Eichler, P., Xu, K.-M., Schlag, P., Schmitt, S. H., Wegener, R., Kaminski, M., Holzinger, R., Wisthaler, A., and Kiendler-Scharr, A.: Comparison of three aerosol chemical characterization techniques utilizing PTR-ToF-MS: a study on freshly formed and aged biogenic SOA, Atmos. Meas. Tech., 11, 1481–1500, https://doi.org/10.5194/amt-11-1481-2018, 2018.
Hansel, A., Jordan, A., Holzinger, R., Prazeller, P., Vogel, W., and Lindinger, W.: Proton transfer reaction mass spectrometry: online trace gas analysis at the ppb level, Int. J. Mass Spectrom., 149–150, 609–619, 1995.
Hansel, A., Wisthaler, A., Schwarzman, M., and Lindinger, W.: Energy dependencies of the proton transfer reactions H3O+ + CH2O ⇔ CH2OH+ + H2O, Int. J. Mass Spectrom., 167–268, 697–703, 1997.
Hansel, A., Jordan, A., Warneke, C., Holzinger, R., Wisthaler, A., and Lindinger, W.: Proton-transfer-reaction mass spectrometry (PTR-MS): on-line monitoring of volatile organic compounds at volume mixing ratios of a few pptv, Plasma Sourc. Sci. Technol., 8, 332–336, 1999.
Holzinger, R., Lee, A., McKay, M., and Goldstein, A. H.: Seasonal variability of monoterpene emission factors for a ponderosa pine plantation in California, Atmos. Chem. Phys., 6, 1267–1274, https://doi.org/10.5194/acp-6-1267-2006, 2006.
Holzinger, R., Williams, J., Herrmann, F., Lelieveld, J., Donahue, N. M., and Röckmann, T.: Aerosol analysis using a Thermal-Desorption Proton-Transfer-Reaction Mass Spectrometer (TD-PTR-MS): a new approach to study processing of organic aerosols, Atmos. Chem. Phys., 10, 2257–2267, https://doi.org/10.5194/acp-10-2257-2010, 2010.
Holzinger, R.: PTRwid: A new widget tool for processing PTR-TOF-MS data, Atmos. Meas. Tech., 8, 3903–3922, https://doi.org/10.5194/amt-8-3903-2015, 2015.
IMAU: Institute for Marine and Atmospheric Research, Atmospheric Physics and Chemistry Group, Data archive, available at: http://www.projects.science.uu.nl/atmosphereclimate/Data.php, last access: 20 November 2019.
Kirkby, J., Curtius, J., Almeida, J., Dunne, E., Duplissy, J., Ehrhart, S., Franchin, A., Gagné, S., Ickes, L., Kürten, A., Kupc, A., Metzger, A., Riccobono, F., Rondo, L., Schobesberger, S., Tsagkogeorgas, G., Wimmer, D., Amorim, A., Bianchi, F., Breitenlechner, M., David, A., Dommen, J., Downard, A., Ehn, M., Flagan, R. C., Haider, S., Hansel, A., Hauser, D., Jud, W., Junninen, H., Kreissl, F., Kvashin, A., Laaksonen, A., Lehtipalo, K., Lima, J., Lovejoy, E. R., Makhutov, V., Mathot, S., Mikkilä, J., Minginette, P., Mogo, S., Nieminen, T., Onnela, A., Pereira, A., Petäjä, T., Schnitzhofer, R., Seinfeld, J. H., Sipilä, M., Stozhkov, Y., Stratmann, F., Tome, A., Vanhanen, J., Viisanen Y., Vrtala, A., Wagner, P. E., Walther, H., Weingartner, E., Wex, H., Winkler, P. M., Carslaw, K. S., Worsnop, D. R., Baltensperger, U., and Kulmala, M.: The role of sulfuric acid, ammonia and galactic cosmic rays in atmospheric aerosol nucleation, Nature, 476, 429–433, 2011.
Krechmer, J., Lopez-Hilfiker, F., Koss, A., Hutterli, M., Stoermer, C., Deming, B., Kimmel, J., Warneke, C., Holzinger, R., Jayne, J., Worsnop, D., Fuhrer, K., Gonin, M., and de Gouw, J.: Evaluation of a New Reagent-Ion Source and Focusing Ion-Molecule Reactor for Use in Proton-Transfer-Reaction Mass Spectrometry, Anal. Chem., 90, 12011–12018, https://doi.org/10.1021/acs.analchem.8b02641, 2018.
Lau, Y. K., Ikuta, S., and Kebarle, P.: Thermodynamics and Kinetics of the Gas-Phase Reactions: H3O+(H2O)n−1 + H2O = H3O+ (H2O)n, J. Am. Chem. Soc., 104, 1462–1469, 1982.
Lelieveld, J., Crutzen, P. J., Ramanathan, V., Andreae, M. O., Brenninkmeijer, C. A. M., Campos, T., Cass, G. R., Dickerson, R. R., Fischer, H., de Gouw, J. A., Hansel, A., Jefferson, A., Kley, D., de Laat, A. T. J., Lal, S., Lawrence, M. G., Lobert, J. M., Mayol-Bracero, O. L., Mitra, A. P., Novakov, T., Oltmans, S. J., Prather, K. A., Reiner, T., Rodhe, H., Scheeren, H. A., Sikka, D., and Williams, J.: The Indian Ocean Experiment: Widespread Air Pollution from South and Southeast Asia, Science, 291, 1031–1036, https://doi.org/10.1126/science.1057103, 2001.
Lindinger, W., Hansel, A., and Jordan, A.: On-line monitoring of volatile organic compounds at pptv levels by means of proton-transfer-reaction mass spectrometry (PTR-MS) medical applications, food control and environmental research, Int. J. Mass Spectrom., 173, 191–241, https://doi.org/10.1016/S0168-1176(97)00281-4, 1998.
Materic, D., Peacock, M., Kent, M., Cook, S., Gauci, V., Rockmann, T., and Holzinger, R.: Characterisation of the semi-volatile component of Dissolved Organic Matter by Thermal Desorption – Proton Transfer Reaction – Mass Spectrometry, Sci. Rep., 7, 15936, https://doi.org/10.1038/s41598-017-16256-x, 2017.
Müller, M., Mikoviny, T., and Wisthaler, A.: Detector aging induced mass discrimination and non-linearity effects in PTR-ToF-MS, Int. J. Mass Spectrom., 365–366, 93–97, https://doi.org/10.1016/j.ijms.2013.12.008, 2014.
Park, J.-H., Goldstein, A. H., Timkovsky, J., Fares, S., Weber, R., Karlik, J., and Holzinger R.: Active AtmosphereEcosystem Exchange of the Vast Majority of Detected Volatile Organic Compounds, Science, 9, 643–647, https://doi.org/10.1126/science.1235053, 2013
Sekimoto, K., Li, S.-M., Yuan, B., Koss, A., Coggon, M., Warneke, C., and de Gouw, J.: Calculation of the sensitivity of protontransfer-reaction mass spectrometry (PTR-MS) for organic trace gases using molecular properties, International J. Mass Spectrom., 421, 71–94, https://doi.org/10.1016/j.ijms.2017.04.006, 2017.
Smith, D., Diskin, A. M., Ji, Y., and Španel, P.: Concurrent use of H3O+, NO+, and O2+ precursor ions for the detection and quantification of diverse trace gases in the presence of air and breath by selected ion-flow tube mass spectrometry, Int. J. Mass Spectrom., 209, 81–97, https://doi.org/10.1016/S1387-3806(01)00478-X, 2001.
Su, T.: Parameterization of Kinetic-Energy Dependences of Ion Polar Molecule Collission Rate Constanta by Trajectory Calculations, J. Chem. Phys., 100, 4703–4703, https://doi.org/10.1063/1.466255, 1994.
Taipale, R., Ruuskanen, T. M., Rinne, J., Kajos, M. K., Hakola, H., Pohja, T., and Kulmala, M.: Technical Note: Quantitative long-term measurements of VOC concentrations by PTR-MS – measurement, calibration, and volume mixing ratio calculation methods, Atmos. Chem. Phys., 8, 6681–6698, https://doi.org/10.5194/acp-8-6681-2008, 2008.
Tröstl, J., Herrmann, E., Frege, C., Bianchi, F., Molteni, U., Bukowiecki, N., Hoyle, C. R., Steinbacher, M., Weingartner, E., Dommen, J., Gysel, M., and Baltensperger, U.: Contribution of new particle formation to the total aerosol concentration at the high-altitude site Jungfraujoch (3580 m a.s.l., Switzerland), J. Geophys. Res.-Atmos., 121, 11692–11711, https://doi.org/10.1002/2015jd024637, 2016.
Warneke, C., van der Veen, C., Luxembourg, S., de Gouw, J. A., and Kok, A.: Measurements of benzene and toluene in ambient air using proton-transfer-reaction mass spectrometry: Calibration humidity dependence and field intercomparison, Int. J. Mass Spectrom., 207, 167–182, 2001.
Yuan, B., Koss, A. R.,Warneke, C., Coggon, M., Sekimoto, K., and de Gouw, J. A.: Proton-Transfer-Reaction Mass Spectrometry: Applications in Atmospheric Sciences, Chem. Rev., 117, 13187–13229, https://doi.org/10.1021/acs.chemrev.7b00325, 2017.
Zhao, J. and Zhang, R. Y.: Proton transfer reaction rate constants between hydronium ion (H3O+) and volatile organic compounds, Atmos. Environ., 38, 2177–2185, https://doi.org/10.1016/j.atmosenv.2004.01.019, 2004.
The unit of Eq. (5) is (counts*moles)/(moles*s). To express sensitivities in cps ppb−1, the trivial relation 1 mol mol−1 = 109 nmol mol−1 is used.
We totalled the signal by considering only the main isotopologue of the protonated ion and the fragments (41 Th for isoprene; 41 and 69 Th for 2-methyl-3-buten-2-ol (MBO); 81 Th for monoterpenes; and 207, 281, and 355 Th for D3, D4, and D5, respectively). These signals were background corrected and multiplied by a factor to account for the signal that is expected on the m∕Q of the minor isotopologues (i.e. molecules containing D, 13C, or 18O).
Note that fluxes are a relative quantity here. We do not know the real ion flux in the drift tube, but we assume that the real ion flux is a fraction of the measured flux that only depends on m∕Q (i.e. the transmission ).
Note that we used only the static electric field in the drift direction in Eq. (11) to calculate the residence time for the Vocus. The RF components are perpendicular to the drift direction and have little influence on the residence time in the reactor.
Note that the E∕N of PTR3 instruments is typically in the range 60–90 Td. Partly this is to reduce the influence of backward reactions (deprotonation), which are important for several compounds because of the many collisions between ions and molecules in the PTR3 reactor.
Position and sharpness of the filter are adjustable. The default factory settings aim at optimizing the detector lifetime.