

Abstract
Microplastics are a major environmental challenge, being ubiquitous and persistent as to represent a new component in all marine environments. As any biogenic particle, microplastics provide surfaces for microbial growth and biofilm production, which largely consists of carbohydrates and proteins. Biofilms influence microbial activity and modify particle buoyancy, and therefore control the fate of microplastics at sea. In a simulated 'plastic ocean', three mesocosms containing oligotrophic seawater were amended with polystyrene microbeads and compared to three control mesocosms. The evolution of organic matter, microbial communities and nutrient concentrations was monitored over 12 days. The results indicated that microplastics increased the production of organic carbon and its aggregation into gel particulates. The observed increase of gel-like organics has implications on the marine biological pump as well as the transport of microplastics in the ocean.
Export citation and abstract BibTeX RIS

Original content from this work may be used under the terms of the Creative Commons Attribution 3.0 licence. Any further distribution of this work must maintain attribution to the author(s) and the title of the work, journal citation and DOI.
1. Introduction
The flux of plastic debris from land to sea continues to increase globally, even if in situ observations do not show the corresponding expected rate of accumulation in the surface ocean. As plastic distribution in the water column is still not well understood, this mismatch is likely the explanation for the 'lost' particles at sea (Cózar et al 2014, Eriksen et al 2014, Mintenig et al 2018). Through mechanical and biological fragmentation, as well as UV-induced photooxidation, plastics degrade to a continuum of sizes, shapes and surface conditions. In general, an increase in the abundance of the smallest fractions (i.e. nano and microplastics) would facilitate their interaction with living organisms and autochthonous organic matter. In fact, such interactions may be a major pathway to the removal of plastic from the marine environment (GESAMP 2016, Koelmans et al 2017, Choy et al 2019).
In aquatic ecosystems, the concentration of organic and inorganic particles influences microbial behavior and metabolism (Paerl 1975). Particles such as detritus, marine snow, fecal pellets are rich in organic matter and nutrients, can facilitate microbial access to resources, and become potential hotspots for metabolic activity. Moreover, particles present physiological opportunities as substrates for microbial attachment where the close proximity of the microbes facilitates metabolic cooperation and genetic exchange (Dang and Lovell 2015). Submerged particles are thus rapidly colonized and the surface biofilm formed provides protection from environmental stressors, promotes the maintenance of the integrity of extracellular enzymes and contributes to the development of organic aggregates and high molecular weight polymers (Dang and Lovell 2015). As such, microbial assemblages on biofilms facilitate the decomposition of sinking particles and the release of nutrients in their descent, making nutrients available to other organisms of the ecosystem and transporting the photosynthetically produced carbon from the euphotic surface to the deep ocean, processes known as the microbial and the biological pump (Jiao et al 2010, Herndl and Reinthaler 2013). While microbial degradation of biogenic particles may decrease particles' presence with increasing depth, non-degradable particles could more easily reach the deep ocean, influencing the marine biological pump.
The marine biological pump thus encompasses the processes through which atmospheric carbon dioxide is absorbed and converted, through primary production in the oceanic euphotic zone, to organic mostly polysaccharidic biopolymers (Engel et al 2004, Sabine et al 2004). Such compounds, released during phytoplankton growth and senescence into the surrounding environment, represent around 20% of the ocean's total dissolved organic carbon pool (Benner 2002) and serve as precursors for the formation of organic gel-like polysaccharidic particles (TEP, transparent exopolymer particles). TEP are sticky macromolecules that can build up into larger aggregates when organic or mineral particles are present. Their production is estimated to be 2.5–5 Pg C yr−1, corresponding to 10% of annual oceanic primary productivity (45–55 Pg C yr−1) (Mari et al 2017, Thornton 2018).
TEP accelerate the sinking of organic carbon to the seafloor as marine snow (Engel et al 2004), and can be rapidly colonized by bacteria which, by the release of extracellular polymers, increase TEP's specific density and settling velocity (Herndl and Reinthaler 2013). Proteinaceous gels (CSP, Coomassie stainable particles) are present in similar concentrations to TEP, but are more labile due to their relatively elevated nitrogen content (Thornton 2018). Both classes of gel particles are produced by autotrophic and heterotrophic organisms as part of their metabolic activities. As the production rates of TEP and CSP are similar, it can be estimated that up to 20% of oceanic primary productivity is converted into marine gels (Thornton 2018), giving them an essential role in nutrients and carbon cycling (Verdugo 2012).
Marine microorganisms can interact with microplastics as they would with any other substrate (Ogonowski et al 2018), creating hotspots for autotrophic and heterotrophic activity. When microplastics enter the ocean, through their surface forces they rapidly interact with suspended organic and inorganic compounds. These, in turn, attract microorganisms. Microbial attachment on microplastics starts by the creation of an extracellular organic coating on the particle's surface (Rummel et al 2017). This leads to a progressively more complex biofilm that includes microbial exudates as well as organic macromolecules and nutrients from the surrounding seawater (Dang and Lovell 2015, Mincer et al 2016).
The microbial production of organic exudates (i.e. long-chain polysaccharides and proteins), precursors of marine gels, as well as biofilm structure and development increase size, surface charge and density of plastic particles, modifying their bioavailability for adsorption by microbial plankton, and for seafloor detritus feeders and suspension-feeding organisms by changing particles' buoyancy and movement within the water column (Galloway et al 2017, Rummel et al 2017). Marine gels are ubiquitous particles in seawater. Thanks to their stickiness, they can be adsorbed onto microplastics, modifying the latter's buoyancy and biological availability (Galloway et al 2017, Michels et al 2018).
To study whether an increase in available substrates related to microplastics is sufficient to produce a measurable short-term impact on marine carbon and nutrients dynamics, we simulated a plastic ocean under controlled conditions in six identical mesocosms (3 m3) filled with coastal oligotrophic seawater from the Sea of Crete. Three mesocosms were treated with standard 30 μm polystyrene microbeads and compared to three control mesocosms. Over a 12 days experiment, measurements were made to determine the dynamics of organic carbon (dissolved, DOC and particulate, POC), particulate organic nitrogen (PON), inorganic nutrients (phosphate, PO43− and dissolved inorganic nitrogen, DIN), TEP and CSP, chlorophyll a and microplastics, as well as the abundances of phytoplankton and heterotrophic bacteria.
2. Material and methods
2.1. Experimental design: mesocosm set up, sampling and manipulation
Six 3 m3 mesocosms made of transparent food-grade polyethylene were filled with coastal seawater pumped from below the surface (2 m) in the proximity of the Hellenic Centre for Marine Research in Crete in the bay of Gournes (Sea of Crete). As cylindrical bags, the mesocosms had a height of ∼2.5 m and a diameter of 1.32 m. For the duration of the experiment, the mesocosms were kept in a 150 m3 deep concrete tank with circulating seawater maintained at a constant temperature of 20 ± 1 °C. Each mesocosm was protected by a clear PVC lid to avoid contamination by atmospheric aerosols. Mesocosms assemblage, seawater transport and homogeneous split into the mesocosms were performed following standardized procedures (Pitta et al 2016). Each mesocosm was continuously mixed through a centralized airlift system from just above the bottom of the mesocosm to just under the surface (Pitta et al 2016), creating a homogeneous distribution of the water.
Samples were collected daily from a depth of 1 m in each mesocosm using a 2 m long Plexiglas tube with a diameter of 5 cm. The tube was rinsed three times with deionized water before and between sampling in different mesocosms. The average density of the water in the mesocosms during the experiment was 1.032 ± 0.001 g cm−3 with an average salinity of 41.4 ± 1.6 PSU. On 26th May, 2017 (day-0), initial reference samples were taken from all mesocosms prior to any manipulation. An aqueous solution of 30 μm diameter transparent polystyrene microbeads (Sigma-Aldrich, nr. 84135) with a density of 1.05 g cm−3 was added to three mesocosms, hereafter named MP treatments (MP1-3) after sampling on day 0. The concentration was approximately 430 microplastic particles per L, corresponding to about 5.92 μg C L−1. The polystyrene beads have a negative surface charge, which is the same as the polyethylene mesocosm walls at pH above 2.5 (Beneš and Paulenová 1973). This charge reduces the possibility of attraction between polystyrene beads and the mesocosms walls. The slightly higher density of the polystyrene beads with respect to seawater, together with the airlift system allowed for an equal distribution of the virgin beads throughout the mesocosms over the duration of the experiment. Biofilm development on polyethylene sheets was not expected to be significant (Lobelle and Cunliffe 2011), so the mesocosms' walls were not cleaned to minimize the manipulation of the mesocosms.
Sampling was afterwards performed daily for 11 consecutive days (until June 6th) and following the same procedures and at the same hour. The total sample volume removed from each mesocosm over the 12 days experiment was 90 L (3% of the total volume). Previous testing of the same batch of polystyrene beads indicated that they did not leach organic compounds (Galgani et al 2018).
Samples for microbead concentrations (1.5–2 L) were filtered daily through 47 mm diameter polycarbonate filters (Whatman, 1 μm pore-size). Polystyrene microbeads were counted microscopically at 20× magnification directly after sampling. Each filter was scanned in a cross diagonal section and microplastics were counted randomly in 45 ocular fields. Assuming no biological aggregation, we expected a 3%–5% loss of microbeads over the course of the experiment, considering the sampling volume and the highest number of polystyrene microbeads (per L) found in the treated mesocosms.
2.2. Dissolved and particulate organic carbon, particulate organic nitrogen, chlorophyll a, phaeopigments and dissolved inorganic nutrients
Dissolved organic carbon (DOC) was determined using a Shimadzu TOC-V organic carbon analyzer and following the high temperature catalytic oxidation method. The system was standardized prior to analysis using a potassium hydrogen phthalate standard solution. Each sample was injected 3–5 times and DOC concentration was calculated by the average value of three replicates that yielded standard deviation <2%. Analytical precision and accuracy were tested against Deep Atlantic Seawater Reference Material provided by the DOC-CRM program (University of Miami—D.A. Hansell, batch 16); measured values: 0.510–0.580 (n = 10), certified value: 0.516–0.540. Drift correction of the DOC results was applied as needed. Samples for POC and PON were filtered through pre-combusted glass fiber filters and analyzed using a Perkin Elmer 2400 CHN Elemental Analyzer following Hedges and Stern (1984). To remove biases in carbon concentration due to polystyrene microbeads, estimates of particulate organic carbon (POC) were corrected for microbead concentration.
Samples for chlorophyll a were filtered through 2, 0.6 and 0.2 μm polycarbonate filters at low vacuum pressure. The concentrations of chlorophyll a and phaeopigments were determined fluorometrically, according to Yentsch and Menzel (1963), using a Turner TD-700 fluorometer.
Daily samples were immediately analyzed for dissolved phosphates with the MAGIC method (Rimmelin and Moutin 2005), with a detection limit of 0.8 nM. Analysis for dissolved nitrite and nitrate followed Strickland and Parsons (1972). Ammonium was measured according to Ivančič and Degobbis (1984). The detection limits were 0.017 μM for nitrate and 0.019 μM for ammonium.
2.3. Marine gels (TEP and CSP)
Total area and number of gel particles were determined by microscopy (Engel 2009). Ten to fifteen mL of sample were filtered using 0.2 μm Nuclepore membranes (Whatman), which were then stained with 1 mL Alcian Blue solution for polysaccharidic gels (transparent exopolymer particles, TEP) and 1 mL Coomassie Brilliant Blue G solution for proteinaceous gels (Coomassie Stainable Particles, CSP). Filters were mounted onto Cytoclear® slides and stored at −20 °C until microscopic analysis. For each slide, thirty images were taken randomly at 200× magnification with a light microscope equipped with a digital camera. The analysis of the cross-sectional area of marine gels was performed with an image analysis software (ImageJ, US National Institutes of Health) and used to calculate the equivalent spherical diameter (ESD) of individual particles, particle number, volume and total area.
2.4. Heterotrophic and autotrophic organisms
Abundances of Synechococcus, picoeukaryotes and heterotrophic bacteria were measured by flow cytometry. One subsample collected from the mesocosm was divided upon return to the laboratory into (a) three replicated cryotubes for flow cytometric analysis of heterotrophic bacteria, viruses and for backup storage at −80 °C and (b) one sample for immediate, live analysis of autotrophic bacteria. Samples for heterotrophic bacteria were fixed with 25% 0.2 μm filtered glutaraldehyde (0.5% final concentration), incubated at 4 °C for 45 min, flash frozen in liquid nitrogen and stored at −80 °C until analysis. Frozen samples were thawed at room temperature and sub-samples were stained for bacterial enumeration with the nucleic-acid stain SYBR Green I (final dilution 4 × 10⁻⁴ of the stock solution in Tris-EDTA buffer, pH = 8) and incubated for 10 min in the dark (Marie et al 1997). Fluorescence signal was analyzed to distinguish high and low DNA content cells. Samples for Synechococcus and autotrophic picoeukaryotes were not fixed and analyzed without prior staining, based on their auto-fluorescence signals. A FACSCaliburTM flow cytometer (Becton Dickinson) was used (Tsiola et al 2018). To estimate the carbon contribution by both picoeukaryotes and Synechococcus, we used values of 471 fg C cell−1 (picoeukaryotes) and 151 fg C cell−1 (Synechococcus) according to Lagaria et al (2017), which were applied for the same study area in a similar set up.
2.5. Data analysis and statistics
Two-Way ANOVA was used to analyze differences between the control and MP mesocosms. Spearman correlation coefficients were used to compare non-normal distributed data. To identify the treatment effect (microplastic addition) on temporal variability, we calculated the normalized anomaly  of data from each mesocosm (j) for days (i = 0, ..., 11) from the overall daily mean of the mesocosms
  (Galgani et al 2014):

Differences between control and treated mesocosms were determined with Mann–Whitney tests on normalized daily anomalies. Statistical tests were performed with GraphPad Prism 7.03 and Minitab 18.1.
3. Results and discussion
Initial concentrations (day 0) of dissolved PO43− and DIN were 4.3 ± 1.7 nM and 0.6 ± 0.1 μM, respectively, leading to the development of a phytoplankton bloom in all mesocosms. The concentrations of phosphate indicated ultra-oligotrophic conditions throughout the experiment, similar to previous mesocosm experiments performed during May with surface offshore water from the Cretan Sea (Pitta et al 2017, Tsiola et al 2017). DIN concentrations were higher but still indicative of oligotrophic conditions. These concentrations were expected for a coastal site of the Sea of Crete (Tsiola et al 2018). The phytoplankton bloom lasted 2–3 days, similar to other mesocosm experiments performed at the same time of the year and in the same study area in both natural and induced bloom conditions (Pitta et al 2017, Tsiola et al 2018) (figure 1). The concentrations of phosphate and DIN reached a minimum on day 3 and slightly increased again after day 4, remaining low throughout the experiment and with no evident differences between controls and MP treatments.
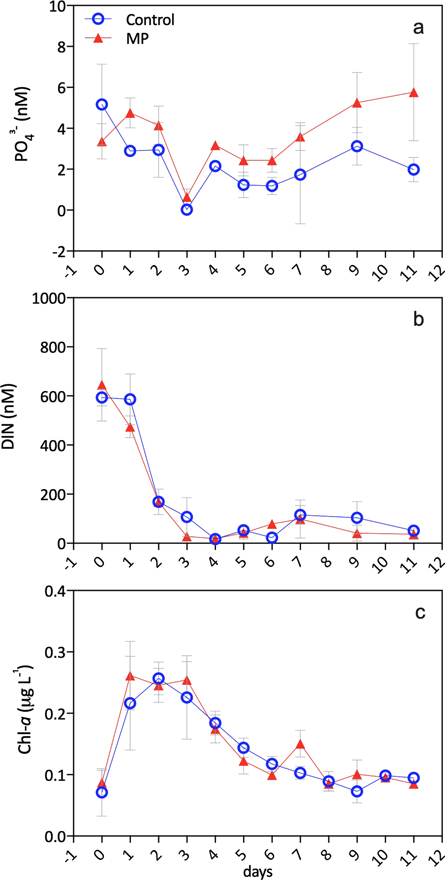
Figure 1. Dynamics of phosphate (PO43−) (a), dissolved inorganic nitrogen as the sum of nitrates, nitrites and ammonium (DIN) (b), and Chlorophyll a (Chl a) (c). Reported data are averages of three mesocosms per control and MP (microplastic treatment), with standard deviations.
Download figure:
Standard image High-resolution imageMaximum chlorophyll a concentration was observed on day 2 followed by a rapid decline. The chlorophyll a bloom was associated to autotrophic picoeukaryotes, which have a high productivity and play a major role in carbon production and cycling in marine ecosystems (Bell and Kalff 2001) (figure 2). The abundance of autotrophic pikoeukaryotes and the concentration of chlorophyll a were not significantly different between controls and MP mesocosms.
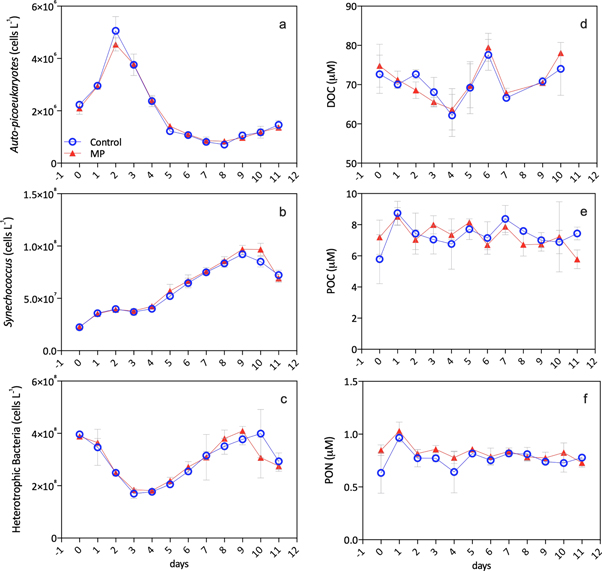
Figure 2. Temporal changes in autotrophic picoeukaryotes (a), the abundance of Synechococcus sp. (b), and heterotrophic bacteria (c), dissolved organic carbon (DOC) (d), particulate organic carbon (POC) (e), and nitrogen (PON) (f). Reported data are averages of three mesocosms per control and MP (microplastic treatment), with standard deviations.
Download figure:
Standard image High-resolution imageIn all mesocosms, inorganic nutrients promoted a constant growth of Synechococcus, a photosynthetic cyanobacterium and the dominating autotrophic species in this time of the year in the Sea of Crete. The abundance of Synechococcus was an order of magnitude higher than autotrophic picoeukaryotes, reaching 108 cells per liter (figure 2). This concentration increased after the picoeukaryotes bloom. Synechococcus was probably best suited for the post bloom conditions of low PO43− levels, helping to explain its delayed increase, as it has a superior affinity for phosphate compared to other prokaryotes and eukaryotic algae when phosphate is the limiting nutrient for microbial growth (Tanaka et al 2003). Synechococcus is an important primary producer in the oligotrophic Sea of Crete in terms of abundance and primary production, and it contributes to 16.7% of the global ocean net primary production (Flombaum et al 2013). In our experiment its carbon contribution to biomass was 0.74 ± 0.30 μM C (with minimum of 0.27 μM C and maximum of 1.29 μM C), ten times higher than picoeukaryotes carbon biomass, 0.08 ± 0.05 μM C (minimum of 0.02 μM C and maximum of 0.22 μM C). Synechococcus and heterotrophic bacteria followed similar patterns; their initial lower abundances may be also explained by grazers, suggesting that their common predator(s), diminished after day 5, allowed their subsequent growth. This is a predator–prey interaction cycle often observed in enclosed mesocosm experiments.
Similarly to Synechococcus, the highest abundance of heterotrophic bacteria was observed after the decay of the picoeukaryote bloom. A stronger negative relationship between heterotrophic bacteria and autotrophic picoeukaryotes occurred in the MP treatments (Spearman rho −0.55, p < 0.001, n = 36) compared to controls (Spearman rho −0.36, p = 0.04, n = 35). This suggested an increased relationship between microbial metabolism and biomass production and decay, also evidenced by the concentration of phaeopigments, chlorophyll a degradation products (figure S1 is available online at stacks.iop.org/ERL/14/124085/mmedia).
The amount of dissolved organic carbon (DOC) was similar between mesocosms. It declined until day 3, and increasing toward the end of the experiment (figure 2), with average concentrations of 70.5 ± 5.4 μM (control) and 70.7 ± 5.6 μM (MP). Interestingly, in MP treatments only, the increase in DOC correlated to an increased abundance of heterotrophic bacteria (Spearman rho = 0.57, p = 0.002, n = 29) and to a decrease in phaeopigments (Spearman rho = −0.42, p = 0.037, n = 25). This indicates a higher bacterial metabolic activity and transformation of phytoplankton-derived organic substrates (Galgani et al 2018, Galgani and Loiselle 2019), with a subsequent reintegration of inorganic nutrients, mainly PO43−, into the system. This is further demonstrated by the different dynamics of PO43− concentrations in the treatment mesocosms, being significantly higher in MP treatments throughout the experiment (Two-Way ANOVA F(1,40) = 20.83, p < 0.0001) (Kirchman 1994).
Particulate organic carbon (POC) peaked on day 1 and varied over time. PON reached a maximum on day 1 (figure 2) and remained constant thereafter, but with a higher concentration in MP treatments (Two-Way ANOVA F(1, 48) = 10.49, p < 0.002). The average particulate carbon to nitrogen ratio (POC:PON) differed significantly between the controls and the MP treatments (Two-Way ANOVA F(1,48) = 18.14, p < 0.0001) with 9.56 ± 0.76 in control compared to 8.79 ± 0.83 for MP treatments. These values were well above the Redfield ratio of 6.6, and dependent on the phytoplankton community composition. This may suggest the production of particulate organic matter by Synechococcus in high-light regimes (Martiny et al 2013, Talmy et al 2016). In MP treatments, the decrease in POC:PON ratio was coincident to the increase of high DNA containing heterotrophic bacterial cells (MP: Spearman rho −0.35, p = 0.03, n = 36) and to an increase in DOC (MP: Spearman rho −0.43, p = 0.02, n = 29). This further supports the hypothesis of an enhanced bacterial turnover of phytoplankton-derived particulate compounds into the dissolved pool through microbial metabolism (Decho 1990, Verity et al 2000).
Polysaccharidic gels (TEP) concentrations (as total area of the particles, μm2 L−1) and abundance (L−1) increased constantly in all mesocosms, with significantly higher concentrations in MP treatments (area: ANOVA F(1, 28) = 21.61, p < 0.0001 and number: ANOVA F(1, 28) = 23.45, p < 0.0001), particularly on days 5, 9 and 10 (figure 3). The average size of the particles (ESD), of 1.38 ± 0.33 μm and 1.44 ± 0.37 μm in control and MP treatments, respectively, was not significantly different.

Figure 3. Temporal changes in the concentrations of transparent exopolymer particles (TEP) (a), (c) and Coomassie stainable particles (CSP) (b), (d) as area (a), (b) and particles abundance per liter (c), (d). Reported data are averages of three mesocosms per control and MP (microplastic treatment), with standard deviations. Gels (TEP and CSP) were sampled every second day until day 10.
Download figure:
Standard image High-resolution imageTEP concentrations closely followed the growth of Synechococcus in control (Spearman rho = 0.70, p < 0.001, n = 21) as well as in MP treatments (Spearman rho = 0.71, p < 0.001, n = 21). TEP particles' abundance in all mesocosms displayed a similar correlation (control: Spearman rho = 0.71, p = 0.0002, n = 21; MP: Spearman rho = 0.64, p = 0.002, n = 21). While other phytoplankton groups and heterotrophic bacteria are able to produce TEP (Cruz and Neuer 2019), TEP production was not associated to picoeukaryotes in the present experiment. Therefore, TEP dynamics were largely attributable to Synechococcus, a major producer of TEP (Ortega-Retuerta et al 2019) and particularly in nutrient limited conditions, where Synechococcus related TEP production has been associated to an increase in the settling velocity of the cell aggregates (Deng et al 2016).
CSP concentrations (μm2 L−1) showed different dynamics between control and MP mesocosms. Like TEP, CSP concentrations were higher in MP mesocosms (area: ANOVA F(1, 28) = 7.245, p = 0.012). Highest CSP concentrations were observed at lowest bacterial abundances (figures 2, 3), being inversely dependent to heterotroph's abundances only in the MP mesocosms (Spearman rho = −0.65, p < 0.001, n = 21). This further confirmed the labile nature of CSP, in particular in the presence of high-DNA containing heterotrophic bacteria, considered more metabolically active (Gasol et al 1999). Interestingly, the highest CSP particles' abundance was observed in control mesocosms (ANOVA F (1, 28) = 8.808, p = 0.006), with mean values of 4.4 ± 2.8 × 10⁷ particles L−1 (control) and 3.6 ± 2.0 × 10⁷ particles L−1 (MP). This observation may be related to an increase in CSP aggregation in the MP mesocosms. These dynamics led to the presence of larger molecules (ANOVA, F(1, 28) = 9.796, p = 0.004) in the presence of polystyrene beads, resulting in a larger surface area (figure 3) with respect to control mesocosms, where an accumulation of smaller CSP particles prevailed. In all mesocosms, CSP particles were more abundant than TEP (figure 3) although average particle size (ESD) did not differ much between both gel classes (control: 1.27 ± 0.24 μm and MP: 1.44 ± 0.24 μm).
Microplastic concentrations decreased in all MP treatments over the 12 days experiment (Spearman rho = −0.92, p < 0.0001, n = 11, figure S2). Considering the sampled water removed from each mesocosm over this period (3% of the total volume) and assuming homogeneous mixing and no biological aggregation, a loss of 3%−5% in the relative concentration of microplastics was expected. However, we observed a much larger loss. At the end of the experiment only between 20% and 30% of the expected concentration of microplastics were present in the MP treated mesocosms (85 ± 33 particles L−1), suggesting a potential mechanism for particle loss. One possibility is the downward motion of spherical particles due to density differences with the surrounding medium. If we assume a quiescent system and spherical particles with a density higher than the surrounding medium, their terminal velocity depends on the particle radius and density, and on the fluid density and viscosity (Stokes' Law). When all conditions apply (smooth spherical particles, constant and undisturbed fluid, no interfering attractive or repelling forces), a polystyrene sphere would sink to the bottom of the mesocosms in approximately three days. While some particle loss is probable, conditions in the mesocosm were such that that terminal velocity predicted by Stokes' law could not be reached. First of all, the airlift system introduced internal motion to the mesocosms, mostly in the upward direction. Second, particles had a high possibility of being incorporated into gel aggregates, becoming neither smooth nor spherical and with a density different than that of the virgin polystyrene beads. Third, the negative surface charge of polystyrene as well as that of the polyethylene surfaces of the mesocosm would modify movement within the mesocosms. These altered conditions would strongly reduce particle settling velocity and indicate that other removal mechanisms were present.
Together with particle loss we observed a net increase in gel abundance. This resulted in negative correlations of both TEP (particles L−1, Spearman rho = −0.69, p = 0.001, n = 18) and CSP (particles L−1, Spearman rho = −0.49, p = 0.04, n = 18), as well as in the number of Synechococcus cells (Spearman rho = −0.860.65, p < 0.0001, n = 33) to microplastics concentration (figure S2). This suggests that biological production and rapid aggregation of organic gels are a possible removal mechanism of microplastics from the water column, supporting recent observations (Kaiser et al 2017, Michels et al 2018). The presence of both heterotrophic bacteria and suspended particles may increase the stickiness of Synechococcus-derived TEP or its precursors, enhancing cell aggregation and export (Deng et al 2015, Cruz and Neuer 2019). Bacteria can also release TEP or TEP precursors, which result in stickier particles, richer in uronic acids (Bhaskar et al 2005). These stickier TEP facilitate the formation of sinking aggregates and can increase the export of carbon and other material. Thus, the interaction of heterotrophic bacteria and Synechococcus may have played an important role in directing the flux of carbon and particles, including microplastics in the mesocosms. Aggregation into marine gels and marine snow further facilitates microplastics' ingestion by zooplankton and their excretion through fecal pellets. The interaction with organic particulate matter has been seen to play a significant role in microplastics' distribution in the water column (Cole et al 2016, Galloway et al 2017). We note, however, that we had no sediment traps installed to check the flux of sinking organic aggregates containing microplastics in the mesocosms.
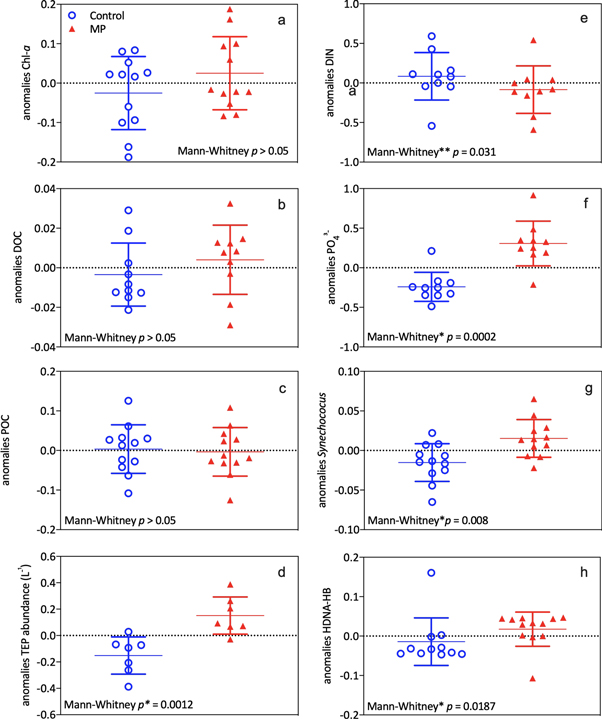
To better discern the overall differences in the production and remineralization of organic matter related to the presence of microplastics, and minimize biases introduced by temporal variations, normalized daily anomalies were compared. Similar concentrations of DOC, POC and chlorophyll a were observed in all mesocosms, while DIN concentration was higher in controls and PO43− was higher in MP treatments (figure 4). Higher abundances of autotrophic (Synechococcus) and heterotrophic microorganisms, and in particular of high-DNA containing bacteria were observed in MP treatments. Given the higher concentration of TEP particles (figure 4), the enhanced interaction of heterotrophs and autotrophs appears to be an important mechanism for the production of marine gels in the presence of suspended particles (microplastics).
Figure 4. Anomalies for control and microplastic treated (MP) mesocosms of the daily concentration of Chlorophyll a (Chl a) (a), dissolved organic carbon—DOC (b), particulate organic carbon—POC (c), TEP abundance (particles L−1) (d), dissolved inorganic nitrogen (DIN) (e), phosphate (PO43−) (f), Synechococcus (g) and high DNA containing heterotrophic bacteria (HDNA-HB) (h). Differences between control and microplastic treated mesocosms (MP) were tested by Mann–Whitney, with a significance level of p < 0.05 (indicated as *) and n = 12. **DIN anomalies were significantly different for one-tailed Mann–Whitney test. POC anomalies were corrected for the carbon introduced by polystyrene microbead addition (5.92 μgC L−1).
Download figure:
Standard image High-resolution image
While similar temporal trends were observed in both control and MP mesocosms (figure 1), the latter showed a higher rate of microbial organic matter production, reworking and incorporation into particulate forms (figures 3, 4). This could have influenced nutrient conditions, with a higher heterotrophic microbial N uptake and processing coupled to the regeneration and accumulation of inorganic P (figure S3).
High metabolic activity and heterotrophic reworking of organic matter was also suggested by an increased DOC concentration and decreased POC:PON ratio in MP mesocosms, accompanied by lower ammonium (NH4+) concentrations and DIN:PO43− ratios (figure S4).
4. Conclusions
The concentration of microplastics in the world's oceans is elevated and its potential influence on marine biogeochemical dynamics is unclear. Estimated concentrations range between 0.1 to 1 particle m−3 in the water column and from 103 to 104 particles m−3 in sediments (Erni-Cassola et al 2019). The concentration of virgin particles used in our experiment is not representative of real ocean conditions, but illustrates a particular process that may occur already in a less evident manner, or could occur in a future 'plastic' ocean, as plastic production is expected to double in the next decades (Geyer et al 2017).
Synechococcus is a widespread cyanobacteria group and a high TEP producer (Ortega-Retuerta et al 2019, Zamanillo et al 2019) that contributes to carbon export in many areas of the ocean thanks to its capacity to form large aggregates (Cruz and Neuer 2019). Our results suggest that inert polystyrene microplastics act the same way as inorganic ballasting particles to favor an increased metabolism and interaction of both autotrophic (Synechococcus) and heterotrophic bacteria. This results in an increased production of DOM polymers and TEP precursors, and an enhanced aggregation into gel-like macromolecules. This increases the possibility for sinking organic aggregates, which helps explain microplastics' downward flux in the mesocosms. Extrapolated to the ocean, this mechanism may have consequences on nutrients' dynamics, microbial organic matter turnover and carbon export. While it is a complex process with multiple pathways, these results indicate a possible mechanism. As growth substrates for marine plankton, microplastics may increase the biological production of DOM (Galgani et al 2018, Galgani and Loiselle 2019) and its aggregation into marine gel particles around suspended particulates. This is facilitated by the phytoplankton-bacteria interplay and would favor the downward export of natural or artificial materials through marine snow (Galloway et al 2017). These sinking aggregates are rich in organic matter and can be easily ingested by zooplankton eventually being excreted as fecal pellets. Hence, this aggregation may play a pivotal role in the mobilization of microplastics across the water column and their subsequent accumulation in the deep ocean (Galloway et al 2017).
Within the adsorbed biofilm surrounding the particles, microplastics may incorporate inorganic nutrients (PO43−, DIN) and stimulate phytoplankton and bacterial growth (Mincer et al 2016). Bacteria can consume up to 60% of available PO43− and 30% of NH4+ (Kirchman 1994) as well as process up to 50% of photosynthetically produced DOM. This organic matter is stored in their biomass and transferred back to the ecosystem through the microbial loop (Azam et al 1983). In the same manner, nitrogen is released in organic particulate forms (PON) and phosphate is regenerated (Kirchman 1994, Paytan and Mclaughlin 2007). These dynamics were likely favored in MP mesocosms and led to the accumulation of particulate forms of organic matter.
It should be noted that, while the standard polystyrene particles used were inert over the period of the present study, the common mix of plastics debris found at sea can leach carbon, which may additionally stimulate marine heterotrophic activity (Romera-Castillo et al 2018). By combining both direct (leaching) and indirect (as substrates) effects on marine carbon dynamics, it is clear that the ubiquitous and increasing presence of plastics in the marine environment has the potential to alter carbon sequestration and turnover, with consequences on marine nutrients cycles and global oceanic productivity.
Acknowledgments
We greatly acknowledge G Piperakis for his inspired technical assistance and mesocosms set up, as well as I Santi and R Benavides for support during the experiment. We also acknowledge the anonymous reviewers who provided valuable comments to improve the manuscript. This work received funding from the European Union's Horizon 2020 Research and Innovation Programme under the Marie Skłodowska-Curie grant agreement No. 702747–POSEIDOMM, to LG. The authors declare no financial and non-financial competing interests.
Data availability statement
The data that support the findings of this study will be openly available at DOI following a delay of 2 months from the date of publication, in conformity with the requirements of all Horizon 2020 funded research projects.