
Abstract
Microalgae worldwide regularly cause harmful effects, considered from the human perspective, in that they cause health problems and economic damage to fisheries and tourism. Cyanobacteria cause similar problems in freshwaters. These episodes encompass a broad range of phenomena collectively referred to as “harmful algal blooms” (HABs). For adequate management of these phenomena, monitoring of microalgae is required. However, effective monitoring is time-consuming because cell morphology as determined by light microscopy may be insufficient to give definitive species and toxin attribution. In the European Union FP7 project MIDTAL (Microarrays for the Detection of Toxic Algae), we achieved rapid species identification using rRNA genes as the target. These regions can be targeted for probe design to recognise species or even strains. We also included antibody reactions to specific toxins produced by these microalgae because, even when cell numbers are low, toxins can be present and can accumulate in the shellfish. Microarrays are the state-of-the-art technology in molecular biology for the processing of bulk samples for detection of target RNA/DNA sequences. After 36 months, we have completed RNA-cell number–signal intensity calibration curves for 18 HAB species and the analysis of monthly field samples from five locations from year 1. Results from one location, Arcachon Bay (France), are reported here and compared favourably with cell counts in most cases. In general, the microarray was more sensitive than the cell counts, and this is likely a reflection in the difference in water volume analysed with the volume filtered for the microarray an order of magnitude greater.
Introduction
Microalgae (photo-autotrophic and mixotrophic microorganisms) in marine, brackish and freshwaters worldwide regularly bloom and are the essential basis for aquatic trophic networks. Yet, some species can cause harmful effects to human and animal health. From a human perspective, they can also cause economic damages to fisheries, fish- and shell-fish farming, and tourism (Hallegraeff 2003). In freshwaters, some cyanobacteria can cause similar problems. These harmful blooms encompass a broad range of phenomena (i.e., water discoloration, foam, smell nuisances, biogenic toxin production, mechanical damages to gill …), which are collectively called harmful algal blooms (HABs). Only a few hundred toxic cells per litre of some taxa can make shellfish unsuitable for human consumption (Yasumoto et al. 1985), but toxin content is highly variable among strains. Not only can fish and shellfish production be destroyed through stock reduction and consumer mistrust, but there are also ramifications for tourism (Hallegraeff 2003). Tourists do not like to swim in visible algal blooms, and some toxic species cause skin and lung irritations (Hallegraeff 2003). Monitoring of HAB microalgae is required by all countries with a marine coastline or freshwater reservoirs. However, present-day monitoring is time-consuming and is based on species identification using their cell morphology as determined by light microscopy. Species determination by light microscopy may sometimes be insufficient to give a definitive answer as to whether the cell in question is toxic and to quantify this toxicity. Molecular tools offer a faster and more reliable means of identifying species (Anderson et al. 2012). DNA microarrays for the identification of marine organisms is a relatively new and innovative field of research. It provides the possibility to analyse a large number of targets (species or taxa) in one experiment (Ye et al. 2001) and was the molecular tool of choice for the European Union (EU) seventh Framework Program project MIDTAL (microarrays for the detection of toxic algae).
MIDTAL started on 1 September 2008 and was funded under THEME 6 ENVIRONMENT (including climate change) of Framework 7 of the European Commission for 45 months. Ten partners from seven European countries and the USA include Marine Biological Association (co-ordinator), Stazione Zoologica Anton Dohrn, Linneaus University, Instituto Español de Oceanografía, National University of Ireland, University of Oslo, University of Westminster, Instituto Tecnolóxico para o Control do Medio Mariño de Galicia, University of Rhode Island and Queen’s University Belfast. The goal of the research consortium was to make a universal microarray for the detection of toxic algal species and another universal microarray for the detection of the toxins produced by these algae. The purpose of MIDTAL was to support the common fisheries policy, aid the national monitoring agencies by providing new rapid tools for the detection and identification of toxic algae and their toxins so they can comply with EC directive 15/201 (EC 2011) and to replace the mouse bioassay, which has been recently replaced by chemical methods as the standard reference analysis throughout the European Community. We hypothesised that our toxic algal species microarray would be more sensitive than routine cell counting methods and require taxonomic expertise and that our toxin microarray would be more rapid than routine chemical analysis. In the EU FP7 project MIDTAL, we used SSU and LSU rRNA genes as the target for the microarray for species identification. These genes can contain regions that are specific for species or even strains. A toxin-based microarray includes antibody reactions to specific toxins produced by these microalgae because, even when cell numbers are low, toxins can be present and can accumulate in the shellfish (please refer to McNamee et al. (2012) in this volume for more detail on the toxin microarray). Microarrays are the state-of-the-art technology in molecular biology for the processing of bulk samples for detection of target RNA/DNA sequences. Existing rRNA fluorescent in situ probes for toxic algal species/strains and antibodies for their toxins were first adapted and optimised for microarray use. New probes were designed where needed, and these are presently under patent application.
The introduction of DNA microarray technology in 1995 is one of the latest and most powerful innovations in microbiology. Because of true parallelism and miniaturisation, the acquisition of many data with reduced consumption of reagents and time is accomplished using microarrays. This technique offers the possibility to analyse many samples to different probes in parallel under a diverse spectrum of applications (Ye et al. 2001). DNA microarrays consist of glass microscope slides with particular surface properties that allow the probes to bind covalently to their surfaces (Metfies and Medlin 2004). Probes are immobilised as spots on the glass slide in a defined pattern. Each spot consists of many copies of oligonucleotide probes that are complementary to a specific target DNA sequence (Graves 1999), and the targets (RNAs or DNAs) hybridise to the capture oligonucleotide probes on the microarray. The hybridisation is detected using a fluorescent label that is attached to the target (in our case, the rRNA) (Metfies and Medlin 2004). Microarray technology was initially used in studies of gene expression (Schena et al. 1995). Many functional genomic methods benefit from microarrays, such as genome expression profiling, single-nucleotide polymorphism detection and DNA re-sequencing (Ji and Tan 2004; Lipshutz et al. 1999; Kauppinen et al. 2003; Yap et al. 2004; Al-Shahrour et al. 2005; Broet et al. 2006; Gamberoni et al. 2006). Thus, DNA microarrays are a powerful and innovative tool that can facilitate surveying and monitoring of any organism, especially those in the marine environment, tracking changes in biodiversity and ecosystem functioning, and we have used it in MIDTAL to monitor for toxic algae.
The application of DNA microarrays for the identification of marine organisms (the so-called phylochip) is a relatively new and innovative field of research. There are few applications of phylochips in marine biodiversity and ecosystem science, most of them being applied to bacterial species (Peplies et al. 2003; Ye et al. 2001), although a few microarrays have been introduced for toxic eukaryotic algae (Ahn et al. 2010; Galluzi et al. 2011; Gescher et al. 2008b; Ki and Han 2006) but not in the format that we have developed and for assessing biodiversity of microalgae difficult to identify microscopically (Gescher et al. 2008a; Metfies and Medlin 2005; Metfies et al. 2010).
All probes on the microarray have to work specifically under identical experimental conditions, which is the biggest challenge for a successful microarray. To apply microarray technology as a standard tool with fast and simple routine handling, methodical optimisations need to be done at each step in the procedure (Peplies et al. 2003). We proceeded through several steps in the optimisation of our protocol. In the initial step, we took published probes used for fluorescence in situ hybridisation (FISH) and converted them to a microarray format by adding a six carbon spacer to the 5’ end, and these were tested in a microarray format and in general were not useful. In the second step, we lengthened the probes from 18 to 25 nt with approximately the same (ca 50%) guanine cytosine (GC) content because the increased length provides a stronger and more specific signal, and with similar GC content, the hybridisation temperature is almost identical for all probes (Metfies et al. 2008). An amended and detailed hybridisation protocol is available for purchase from Koeltz (Lewis et al. 2012). Several partners were taxonomic specialists in several toxic algae species, and these partners had the responsibility of testing probe specificity against cultures prior to field testing. Once probe specificity was ascertained (see various papers in this issue that also deal with probe specificity), we proceeded to field testing. We used the second-generation microarray to analyse 1 year of field data, which we present here. Each partner in the consortium will present their microarray analysis in a separate paper in this special issue (seven phylochip papers and one toxin paper). The results of Partner 1 regarding field testing are presented here.
Materials and methods
Field sampling
In 2010, sub-surface (1 m) water samples for both cell count and microarray analysis were collected at Arcachon Bay in France between July and September, during REPHY (IFREMER) and SOMLIT (INSU) monitoring and survey networks, respectively. The sampling site for microarray analysis, termed Tès (1°10′00 W, 44°40′ 00 N), is located directly in front of the town of Arcachon inside the bay and is influenced by both continental runoff and marine waters that enter the bay. Because of logistic problems inherent to the SOMLIT service, only three samples were taken for microarray analysis during this period (06.07, 02.09 and 16.09.2010; Table 1). The sampling site for phytoplankton identification, termed Teychan (1°09.51′W, 44°40.42′N) is located 1.5 km from Tès station. Both stations belong to the same water masses, i.e. the internal neretic waters as described by Robert et al. (1987), and sampling was always performed during high tide. Indeed, Arcachon Bay is a well-mixed system highly influenced by tidal mixing. Spatial patchiness is minimum for a same tide moment in terms of hydrological parameters of the water column as well as of phytoplankton populations (Glé et al. 2007, 2008). Cell counts were done as previously described by Medlin and Schmidt (2010) and provided by IFREMER (results Ifremer/Quadrige2/Rephy). Briefly: a 1-L sample was collected from a 4-L Niskin bottle and immediately fixed with Lugol’s fixative. Ten millilitres was allowed to settle overnight and used for counting by the Utermöhl method (von Utermöhl 1931); for sparse species, an additional settlement of 100 mL is undertaken. The full settling chamber was counted at 20× and across one diameter at 40×. The detection limit for those conditions is estimated to 100 cells/L for the 10-mL chamber and 10 cells/L for the 100-mL chamber (Belin and Raffin 1998). Counts varied from 200 to 1,600 cells per chamber leading to an accuracy range of 5 to 16 % expressed as percent of total (Lund et al. 1958).
For the microarray analysis, around 2 L of water were filtered onto 3-μm nitrocellulose filters (25 mm) until they clogged (Table 1). Two filters were transferred into cryogenic vials containing 1 mL of TRI Reagent (Sigma-Aldrich). The samples were frozen and stored at −80 °C until further processing. One filter was transferred into cryogenic vials without TRI reagent for toxin analysis and sent frozen to Partner 11 (Queens University Belfast, UK) using their toxin microarray.
Toxin extraction
The toxin filters were extracted according to the protocol presented by McNamee et al. (2012; this volume), and their analysis is discussed in detail in that paper. We present here only the correlation between toxin and the species present either in the cell counts or in the microarray (Table 2).
RNA extraction
Acid-washed glass beads (300 μm) were added to the samples and were placed in a bead beater twice for 20 s at 4,800 oscillations/min. Cell+Tri Reagent mixture was transferred into a new microcentrifuge tube, vortexed for 15 s and let stand at room temperature (RT) for 10 min. After vortexing for another 15 s, samples were incubated at 60 °C for 10 min in a Thermoshaker vortexing at maximum speed. After the addition of 100 μL of 1-bromo-3-chloropropane to the samples, the tubes were vortexed for 15 s. Samples were then transferred into pre-spun phase-lock gel heavy 2-mL tubes (5 Prime; 12,000×g for 30 s) and were shaken thoroughly for 15 s. Samples were incubated at RT for 5 min and centrifuged (12,000×g) for 15 min at 4 °C. The upper phase was mixed gently with 200 μL of chloroform and centrifuged (12,000×g) for 2 min at 4 °C. The aqueous phase was then transferred to a fresh 2-mL RNase-free tube. Five hundred microlitres of isopropanol was added, vortexed for 15 s and incubated for 1 h at −20 °C. Supernatant was quickly removed and washed with 1 mL ethanol (75 %), vortexed for 5 s and centrifuged (12,000×g) for 10 min at 4 °C. The supernatant was carefully removed, and the pellet was air-dried for 5 min. The pellet was dissolved in 100 μL of RNase-free water by flicking the tube. Concentration and integrity of RNA were measured by a Nanodrop (PerkinElmer) and an Agilent Bioanalyzer 2100 (Agilent Biotechnologies). Samples were shock-frozen in liquid nitrogen and stored at −80 °C until further use.
RNA labelling and fragmentation
One microgram RNA of field sample was labelled using the PlatinumBright Infrared Labelling Kit from KREATECH according to the manufacturer’s instructions. The total volume was 20 μL containing 2 μL dye and 2 μL 10× labelling solution. Concentration and incorporation of the dye was measured by a Nanodrop (PerkinElmer). The degree of labelling (DOL) was calculated and was between 1.4 and 2.5 %. RNA was fragmented by adding 1/10 volume of RNA fragmentation buffer (100 mM ZnCl2 in 100 mM Tris–HCL, pH 7.0) and an incubation of 15 min at 70 °C. The reaction was stopped with the addition of 1/10 volume of 0.5 M EDTA (pH 8.0), and the samples were placed on ice.
Preparation of controls
The MIDTAL chip currently comprises one spotting control ‘Poly-T-Cy5,’ two hybridisation controls (Positive_25 and ‘Positive_25_dT) and several probes for RNA of algae of the genus Dunaliella (‘DunGS02_25’, ‘DunGS02_25_dT’ and ‘DunGS05_25_dT’), 50,000 cells of which are added as a control before the RNA extraction. Negative controls are ‘NEGATIVE1_dT’, ‘NEGATIVE2_25_dT’, ‘NEGATIVE3_25_dT’ and ‘3×SCC’; the first two are nonsense oligonucleotides with no similarity to any sequence in Genbank.
The internal positive control (TBP-Cy5 = Positive_25_dT’ and Positive_25_dT) is prepared as follows: DNA from bread yeast powder (Saccharomyces cerevisiae) was extracted by using the Plant DNA Extraction Kit from QIAGEN according to the manufacturer’s protocol. A 250-bp fragment of the TATA-box binding protein gene (TBP) was amplified with the primers TBP-F (5'-ATG GCC GAT GAG GAA CGT TTA A-3') and TBP-R labeled with CY5 (5'-TTT TCA GAT CTA ACC TGC ACC C-3'). The TBP polymerase chain reaction (PCR) conditions were: (1) pre-denaturation step for 5 min at 95 °C, 40 cycles of denaturation for 1 min at 95 °C, annealing for 1 min at 53 °C and elongation for 2 min at 72 °C, with a final extension step of 5 min at 72 °C. The PCR product was purified with the PCR MinElute Cleanup Kit (QIAGEN) and quantified with a Nanodrop using the microarray setting. The TBP fragment was diluted to 50-ng/μL aliquot and stored at −80 °C.
Microarray design
Probe design was done with the open software package ARB (Ludwig et al. 2004). A list of the probes and their target can be found in Table 3; sequences for the probes are not provided because they are patent-pending. A commercial kit with the chip and all reagents will soon be commercially available from Kreatech (Amsterdam, The Netherlands). Probes were made first for a toxic taxon at the species level, and then probes for higher taxonomic levels were designed. The higher taxonomic level probes were either at the genus or family level. Clade-level probes were designed when groups of species were determined to be phylogenetically closely related in the ARB database but were not recognised at a formal taxonomic level. All oligonucleotides including the positive and negative controls were synthesised by Thermo Fisher Scientific (Ulm, Germany) with a C6/MMT aminolink at the 5’ end of the molecule. The probe length was 18 or 25 nt. Probes were spotted onto epoxy-coated Genetix or Schott slides using a pin printer VersArray ChipWriter Pro (Bio-Rad Laboratories GmbH, Munich, Germany) and split pins (Point Technologies, Inc., CO). The probes had a final concentration of 20 pmol/μL in 3× saline sodium citrate buffer (SSC) and a spot size between 70 and 110 μm. Two arrays were printed on each slide containing 162 different probes (see Table 3) with four to eight replicates, as well as two negative and two positive controls, Poly-T and Poly-T-Cy5 (MIDTAL ver2.52). After spotting, slides were incubated for 30 min at 37 °C and then stored at −20 °C.
Hybridisation
Just prior to use, slides were pre-hybridised in a slide box containing 20 mL pre-hybridisation buffer (1 mg/mL BSA and 1× STT buffer (2× STT/2 M NaCl; 20 mM Tris–Cl, pH 8.0; 0.01 % Triton 100)) for 60 min at 60 °C. The slides were washed in ddH2O and were dried by centrifugation in a 50-mL Falcon tube for 2 min at 2,000 rpm.
Labeled samples (1 μg RNA) were mixed with 35 μL of 2× hybridisation buffer (1 mg/mL BSA, 0.2 μg/μL Herring sperm DNA, 2 M NaCl, 20 mM Tris–Cl, pH 8.0, 0.01 % Triton 100), 14 μL of formamide, 100 ng TBP-control, and the volume was adjusted with nuclease-free water to 70 μL. Slides were placed into an array holder; coverslips (LifterSlips, Erie Scientific) were cleaned and placed onto the microarrays. Half of the hybridisation mixture (35 μL) was added to one microarray. Prior to hybridisation, a hot start was performed for 10 min at 84 °C. Hybridisation was carried out for 1 h at 50 °C in a 50-mL Falcon tube containing a wet Whatman paper. The DNA chips were washed three times, shaking on a belly dancer (~25 rpm) with increasing stringency (Table 4).
After centrifugation for 2 min at 2,000 rpm in a 50-mL Falcon tube, microarrays were scanned with a GenePix 4000B scanner (Axon Instruments) using the GenePix 6.0 software. Settings for scanning were 600 PMT gain and 100 % of laser power for the 635 nm wavelength, and the pixel size was 10 μm.
Detection limits for probes on the microarray
Each partner was responsible for growing various species under different culture conditions to assess the effect of the selected environmental variables on rRNA content in order to establish calibration curves and to determine detection limits. Details of these experiments will be published elsewhere (Taylor et al. submitted), but a brief description follows below. All calibration curves were conducted in a similar fashion. Three strains for each species were selected and exposed to optimal conditions for nutrients, temperature, light and salinity. During log phase, aliquots of this optimised culture were inoculated into new culture vessels and exposed to stresses of each variable along with controls at the optimum conditions. There was more variation between the strains in response to the stress than the stress itself. Linear responses were obtained in nearly all cases with RNA content increasing with time regardless of the stress (data not shown). Therefore, we can convert RNA content to cell numbers at any stage of the bloom and under any environmental conditions, and from the minimum amount hybridised on the microarray (5 ng), we have determined a corresponding cell number, which varies with each probe because of the strength of the various probes (Table 5).
Data analysis
Obtained fluorescent signals and the surrounding background intensity were calculated by superimposing a grid of circles (midtal_ver252_20100423.gal) onto the scanned image using the GenePix 6.0 software. Results were processed first with the phylochip analyser (Metfies et al. 2008) to construct a hierarchy file. A hierarchy file places probes for species below probes of a higher taxonomic designation, e.g. kingdom, phylum, class, order, family, genus, and species. Table 3 shows the taxonomic hierarchy of the probes we have developed. The use of the hierarchy file ensures that false-positives can be eliminated because, for a species to be present, the entire taxonomic hierarchy leading to that species must also be present. The hierarchy file and the gpr file from the scanned image were then loaded into the gpr-analyser program ver 1.24 (Dittami and Edvardsen 2012; this volume). A signal-to-noise ratio (S/N ratio) above 2 was taken as a cut-off for a positive signal. To compare values from different hybridisations, we normalised the total signal intensity of features with an S/N ratio above 2 against the positive control POSITIVE_25 (corresponds to TBP). The data are stored at http://www.mba.ac.uk/midtal/login.php?ret_link=%2Fmidtal%2F&type=notLogged. New users of the MIDTAL chip can obtain detailed instructions as to how to log into the database, upload their own microarray and compare it to any experiment in the MIDTAL project from Lewis et al. (2012).
Results and discussion
Phylochips have been used successfully and designed mainly for bacterial diversity research (Ye et al. 2001; Rudi et al. 2000; Peplies et al. 2003) and the characterisation of ectomicrorhizal fungal communities (Reich et al. 2009). Only a few studies have used 18S rDNA to identify eukaryotes, such as waterborne protozoan pathogens (Lee et al. 2010) or to assess the community composition of microalgae difficult to identify with light microscopy, such as prasinophytes (Gescher et al. 2008a) or cryptophytes (Metfies et al. 2010). A microarray for a selection of potentially toxic species has been developed by Ahn et al. (2010), Galluzi et al (2011), Gescher et al. (2008a, b) and Ki and Han (2006). All of these studies, except that by Ahn et al. (2010), are based on DNA-PCR products of the ribosomal RNA operon (16S, 18S, 28S or ITS). By introducing a PCR step into the protocol, a bias can be potentially introduced into the analysis. We have used total RNA from the entire plankton community at the time of sample filtration. The study by Ahn et al. uses a sandwich hybridisation protocol (capture and signal probe) on the microarray using fibre optic rather than fluorescent detection and was tested only with three species.
The MIDTAL project took advantage of using total RNA to detect potentially toxic algae and not genomic DNA and PCR products. The latter one can have high copy numbers of the 18S rRNA, which influences the signal as more copy numbers result in a higher signal, and because monitoring is based on cell numbers, harvesting sites would be closed even when sanitary thresholds are not reached, if PCR products are used. Our calibration curves generated for each species is based on total RNA content = microarray signal = cell numbers for each probe tested (see papers in this volume and Blanco et al. and Taylor et al. submitted). We developed probes based on sequences from a global database, thus, our probes were designed to construct a universal microarray. The microarray designed by Ahn et al. (2010) contains a probe set for Pseudo-nitzschia australis that can only be applied to Pacific Ocean isolates.
Probe specificity was greatly improved by increasing the length of the probe from 18 to 25 nt (Fig. 1a). This also enabled us to use some probes, such as DinoB, which were unusable at the a length of 28 nt because the secondary structure of the 18S rRNA molecule prevented probe access if the probe target region was in the last 900 bases of the molecule (Metfies and Medlin 2008). Fragmentation of the RNA enhanced access to the target site especially for the weakest of probes whose target site was likely blocked by secondary structure of the RNA (Metfies and Medlin 2008, Fig. 1c), but fragmentation inhibited the strongest probes likely because the target site was broken by the fragmentation (Fig. 1d). Both the length of time and temperature at which the fragmentation took place were optimised (Fig. 1b).

Summary of the modifications to either the probes or the hybridisation protocols to enhance the microarray signal of the second-generation chip. The detection cut-off signal-to-noise (S/N) ratio of 2 is shown in a by the red arrow. a Comparison of different probe lengths and length of spacer to raise the probe above the surface of the chip. b Comparison of the signal proportional to the length of time the RNA was exposed to fragmentation before hybridised to the chip. c Comparison of strong probes whose performance decreased by fragmentation. d Comparison of weak probes whose performance was enhanced by fragmentation
Using the gpr-analyser version 1.24 and the hierarchy file for the second-generation slides, we were able to exclude almost all false-positive signals. Only signals with a signal-to-noise ratio above 2 were considered for this analysis. Positive samples that failed because of the taxonomic hierarchy (false-positives) were also excluded. The following points could be ascertained from our microarray analysis:
-
The three Arcachon samples showed only a few taxa that could be considered toxic, i.e. six taxa ranging from 10 to 800 cells/L (Electronic supplementary material 1), whereas our microarray revealed more taxa. This is likely smaller volume (10–100 mL) used for counting relative to the volume filtered for the microarray (1–2 L).
-
Dinoflagellates (Fig. 2a): Both class-level probes for Dinophyceae (DinoB_25, DinoE12_5) showed a higher signal in sample 1A, where 13,130 dinoflagellates were counted for 1 L, than in sample 5A with 29,570 cells/L. The higher signal means more dinoflagellate cells were present in sample 1A than in sample 5A, but these cells were not counted or identified as dinoflagellates (Fig. 2a). The lower volume analysed and/or the existence of small nano-dinoflagellates <10 to 15 μm could help explain these differences. DinoB_25 had always a higher signal than DinoE12_25, which means that DinoB_25 has a better detection. This is in stark contrast to its non-usability with a length of 18 nt. Each of these probes recognises about 95 % of all dinoflagellates in Genbank, and the same suite of species is not recognised by each probe; thus between the two probes, nearly all dinoflagellates can be detected (data not shown).
Fig. 2 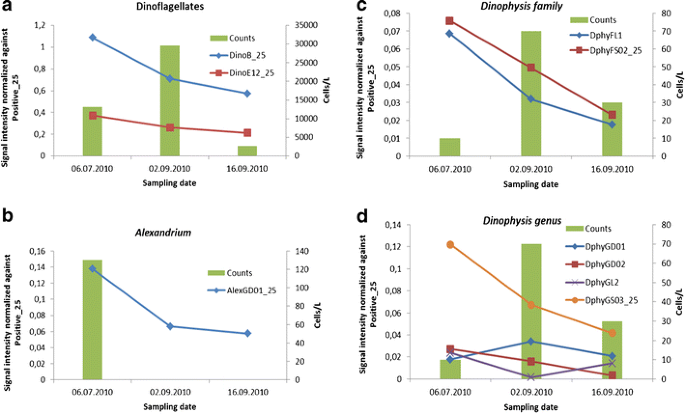
Microarray signals normalised against the positive control (Positive_25) for three field samples taken in Arcachon Bay, France, and compared with cell counts. The graphs show only probes that yielded a signal above the detection limit (signal/noise ratio > 2) except for graph d. The sampling dates (06.07.2010, 02.09.2010, and 16.09.2010) correspond to the sampling names: 1A, 5A, and 6A. Cell counts are depicted on the secondary y-axis and as columns. a Normalised signal of the Dinophyceae class-level probes (DinoB_25, DinoE12_25) in comparison to the cell numbers of all counted dinoflagellates. b Normalised signal of the Alexandrium genus-level probe AlexGD01_25 in comparison to A. minutum cell counts. c Normalised signal of the Dinophysis family-level probes (DphyFL1, DphyFS02_25) in comparison to cell counts of D. caudata and D. tripos. d Normalised signal of Dinophysis genus-level probes (DphyGD01, DphyGD02, DphyGL2, DphyGS03_25) in comparison to cell counts of D. caudata and D. tripos
-
The genus-level probe of Alexandrium showed a signal in all three samples, but no Alexandrium cells were recorded in the cell counts from September samples (Fig. 2b). The higher signal matched the cell counts in July. However, small amounts of paralytic shellfish poisoning (PSP) toxin were detected using the ELISA tests for all three samples (Table 2).
-
Azadinium genus-level probes AzaGD01 produced a signal in samples 5A and 6A and AzaGS01 produced a signal in sample 6A. The species probe AzptoxiD05 for Azadinium poprum produced a signal in sample 1A failed the hierarchy test because the two generic probes were not highlighted. This genus was not counted in the Arcachon samples. It is a relatively newly described species (Tillmann et al. 2009), and not all monitoring agencies are adjusting their cell counts to account for this new toxic species.
-
Cells of Karenia brevis (20 cells/L) and Karenia mikimotoi (50 cells/L) were counted in sample 1A. Slight signals of Karenia species-level probes (KB4, KbreD04_25) were registered, but the presence of this species failed when using the hierarchy file because the Karenia genus-level probe (KareGD01_25) had an S/N ratio below 2. For this species, the present microarray needs at least 1,000 cells in the filtered sample to get a signal. However, the sanitary threshold of this potentially toxic species is not usually given because its toxins only affect fish and not humans.
-
The toxic alga, Dinophysis caudata, was identified in sample 5A (70 cells/L) and sample 6A (30 cells/L). The toxic Dinophysis tripos and the Phalacroma rotundatum were identified in sample 1A (10 and 20 cells/L, respectively). The Dinophysis family probes DphyFL1 and DphyFS02_25 showed signals for all three samples (Fig. 2c) with an S/N ratio above 2. The highest signals were obtained for the sample 1A and were lower in the September samples. These results suggest that cells of Dinophysis were missed during counting for sample 1A, and this is likely caused by the lower volume of water used for the cell counts. The genus-level probe DphyGS03_25 showed a consistent signal for all three samples following a similar pattern as the family probes (Fig. 2d). The other four generic-level probes, DphyGD01, DphyGD02, DphyGL2 and ProroFD01 (= all Dinophysis except Dinophysis acuta), did not have a S/N ratio above 2 in the three samples. The probe DphyGD01 was detected in samples 5A and 6A () and the probe DphyGD02in sample 1A and 5A (). In addition, only sample 1A showed a signal for the two probes DphyGL2 and ProroFD01. No okadaic acid was detected in any of the samples (Table 5)
-
Haptophyta/Prymnesiophyceae/phyta were not identified in cell counts, but all three class-level probes (PrymS01_25, PrymS02_25, PrymS03_25) and the clade-level probe for Prymnesium (Clade01_25) had a permanent signal in all three samples, especially in the last one (Fig. 3). In addition, sample 1A had a signal for the genus-level probe of Prymnesium (PrymGS02_25) and the species-level probe of Chrysochromulina polylepis (CPOLY01), both of these species being too small to count accurately by LM. The reason for that is, again, most likely the larger volume used for filtration (~2 L) than for counting (10 or 100 mL) and the definitely small size of this phytoplankton species.
Fig. 3 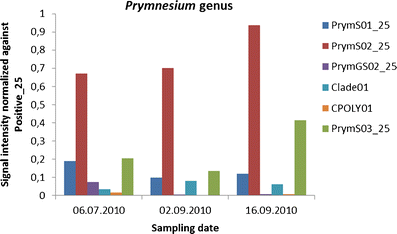
Normalised signals of haptophyte class-level probes (PrymS01_25, PrymS02_25, PrymS03_25) and the clade-level probe for Prymnesium (Clade01). The genus-level probe of Prymnesium (PrymGS02_25) and the species-level probe of C. polylepis (CPOLY01) had only in sample 1A an S/N ratio above 2
-
Pseudo-nitzschia sigmoid species (=multistriata) was identified only in sample 6A (Electronic supplementary material 1), which agrees with the microarray signals (Fig. 4). Some other species-level probes gave a signal in sample 1A and 5A, but they failed the hierarchy test because the signal of the genus-level probe failed and were therefore categorised as false-positives. The highest signal in sample 6A was achieved from PfrauD04_25, followed by Pdel1D03_2, Pdel3D01_25 and PmultD02_25 (Fig. 4). However, no domoic acid was detected in any of the samples (Table 5).
Fig. 4 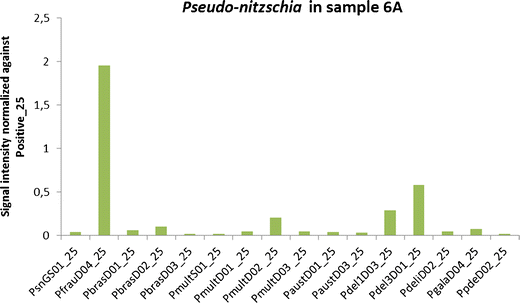
Signals with an S/N ratio above two for Pseudo-nitzschia genus- and species-level probes in sample 6A normalised against Positive_25
-
Field sample 6A had also signals for Pseudo-nitzschia (genus-level probe) and the species-level probes Pseudo-nitzschia brasiliana, Pseudo-nitzschia multiseries and P. australis. Three Pseudo-nitzschia delicatissima probes, one Pseudo-nitzschia galaxiae and one Pseudo-nitzschia pseudodelicatissima exhibited signals. PfrauD04 had a very high signal. This latter probe has consistently cross-reacted with nearly all Pseudo-nitzschia spp., and its hierarchic level has been elevated to a genus-level probe.
-
Prorocentrum micans was detected in cell counting in all three samples but not with the microarray. The reason for that is probably because the cells were not successfully broken open or the detection limit of Prorocentrum probes is higher than 1,000 cells. No calibration curves for these species were performed. This species is generally not considered to be toxic in European waters (but see the related paper by McCoy et al. in this volume).


The results of the first-year samples from MIDTAL show that microscopic cell counts often can underestimate cell numbers and some rare taxa can be undetected because of the smaller volume analysed for cell counts as compared with the volume filtered for the microarray. It is well-known that cell counting when using light microscopy and the classical Utermöhl (von Utermöhl 1931) method has limits when trying to detect rare species with very low densities. Indeed, Maurer et al. (2010) concluded that the sampling strategy and the methodology developed within the REPHY network is not adapted for listing all rare or low abundant taxa and that other strategies and tools would be required in order to be exhaustive (i.e. plankton tow, or molecular probes …). Furthermore, morphological identification of some taxa is not always possible at the species or the genus level, especially for the smallest organisms, and molecular probes are therefore a powerful tool. Thus, because the volume filtered for the microarray is several times more than that counted (>10×), the possibility of detecting rare species of other potentially toxic species with low densities at a pre-bloom stage makes this molecular tool a much more sensitive monitoring tool.
One possible external validation improvement for the microarray would be to settle larger volumes of water for the cell counts and perhaps to perform quantitative PCR (qPCR) when the microarray signal contradicts the cell counts based on a smaller volume. In the few cases where qPCR has been done, the results have confirmed the microarray signals (data not shown). Only in the case of Prorocentrum did the microarray not pick up the potentially toxic species, and this is most likely a failure to break open the cells. For other species (e.g. Karenia spp.), the detection limit of microarray may not be low enough and needs improvement.
The MIDTAL phylochip is still not fully optimised, but these preliminary results gave us a good indication of which areas we need to optimise in our protocols for the next steps of the project. The RNA extraction protocol has to be adapted so that all cells can be better broken. The hybridisation protocol revealed a high background and often bad smears on the arrays. Our next goals are therefore to reduce the background as well as to enhance the signal. The next-generation chip (version 3) for the second year will be spotted with new probes (non-specific ones from generation 2 will be deleted), and year 2 samples will be extracted with an enhanced RNA extraction protocol and hybridised with an optimised hybridisation protocol.
References
Ahn S, Kulis D, Erdne DD, Anderson DM, Walt D (2010) Fibre optic microarrays for the detection and enumeration of harmful algal bloom species. Afr J Mar Sci 28:231–235
Al-Shahrour F, Diaz-Uriarte R, Dopazo J (2005) Discovering molecular functions significantly related to phenotypes by combining gene expression data and biological information. Bioinformatics 21:2988–93
Anderson DM, Cembella AD, Hallegraeff GM (2012) Progress in understanding harmful algal blooms: paradigm shifts and new technologies for research, monitoring, and management. Ann Rev Mar Sci 4:143–176
Belin C, Raffin B (1998). Les espèces phytoplanctoniques toxiques et nuisibles sur le littoral français de 1984 à 1995, résultats du REPHY (réseau de surveillance du phytoplancton et des phycotoxines). RST.DEL/MP-AO 98-16. 2 tomes
Bowers HA, Tomas C, Torstein T, Kempton JW, Lewitus AJ, Oldach DW (2006) Raphidophyceae [Chadefaud ex Silva] systematics and rapid identification: sequence analyses and real-time PCR assays. J Phycol 42:1333–1348
Broet P, Kuznetsov VA, Bergh J, Liu ET, Miller LD (2006) Identifying gene expression changes in breast cancer that distinguish early and late relapse among uncured patients. Bioinformatics 22:1477–85
Chen GF, Wang GC, Zhang CY, Wang XK, Zhou BC (2008) Development of rRNA and rDNA-targeted probes for the fluorescence in situ hybridization to detect Heterosigma akashiwo (Raphidophyceae). J Exp Mar Biol Ecol 355:66–75
Diercks S, Metfies K, Medlin LK (2008) Molecular probe sets for the detection of toxic algae for use in sandwich hybridization formats. J Plank Res 30:439–448
Dittami S. Edvardsen B. (2012) GPR-analyzer: a simple tool for quantitative analysis of hierarchical multispecies microarrays. Env Sci Poll Res doi: 10.1007/s11356-012-1051-5
EC (2011) Commission regulation (EU) No 15/201. Amending regulation (EC) No 2074/2005 as regards recognized testing methods for detecting marine biotoxins in live bivalve molluscs. Off J Eur Union L320/13
Eller G, Töbe K, Medlin LK (2007) A set of hierarchical FISH probes for the Haptophyta and a division level probe for the Heterokonta. J Plank Res 29:629–640
Galluzi L, Cegna A, Casabianca S, Penna A, Sunder N, Magnnai M (2011) Development of an oligonucleotide microarray for the detection and monitoring of marine dinoflagellates. J Microbiol Meth 84:234–242
Gamberoni G, Storari S, Volinia S (2006) Finding biological process modifications in cancer tissues by mining gene expression correlations. BMC Bioinforma 7:6
Gescher C, Metfies K, Frickenhaus S, Knefelkamp B, Wiltshire KH, Medlin LK (2008a) Feasibility of assessing the community composition of prasinophytes at the Helgoland roads sampling site with a DNA microarray. Appl Environ Microbiol 74:5305–16
Gescher G, Metfies K, Medlin LK (2008b) The ALEX Chip - Development of a DNA chip for identification and monitoring of Alexandrium. Harmful Algae 7:485–494
Glé C, del Amo Y, Bec B, Sautour B, Froidefond JM, Gohin F, Maurer D, Plus M, Laborde P, Chardy P (2007) Typology of environmental conditions at the onset of winter phytoplankton blooms in a shallow macrotidal coastal ecosystem, Arcachon Bay (France). J Plank Res 29:999–1014
Glé C, Del Amo Y, Sautour B, Laborde P, Chardy P (2008) Variability of nutrients and phytoplankton primary production in a shallow macrotidal coastal ecosystem (Arcachon Bay, France). Estuar Coast Shelf Sci 76:642–56
Graves DJ (1999) Powerful tools for genetic analysis come of age. Trends Biotechnol 17:127–34
Guillou L, Nézan E, Cueff V, Erard L, Denn E, Cambon-Bonavita MA, Gentien P, Barbier G (2002) Genetic diversity and molecular detection of three toxic dinoflagellate genera (Alexandrium, Dinophysis, and Karenia) from French coasts. Protist 153:223–38
Hallegraeff GM (2003) Harmful algal blooms: a global overview. In: Hallegraeff GM, Anderson DM, Cembella AD (eds) Manual on harmful marine microalgae. United Nations Educational, Scientific and Cultural Organization, Paris, pp 25–49
Ji L, Tan K-L (2004) Mining gene expression data for positive and negative co-regulated gene clusters. Bioinformatics 20:2711–18
John U, Cembella A, Hummert C, Elbrächter M, Groben R, Medlin LK (2003) Discrimination of the toxigenic dinoflagellate species Alexandrium tamarense and Alexandrium ostenfeldii in co-occurring natural populations from Scottish Coastal waters. Eur J Phycol 38:25–40
Kauppinen SSN, Mouritzen P, Toftgaard Nielsen A, Vissing H, Moller S, Birger Ramsing N (2003) LNA microarrays in genomics. Pharma Gen 3:24–34
Ki J-S, Han M-S (2006) A low-density oligonucleotide array study for parallel detection of harmful algal species using hybridization of consensus PCR products of LSU rDNA D2 domain. Biosens Bioelectron 21:1812–1821
Lange M, Simon N, Guillou L, Vaulot D, Amann R, Ludwig W, Medlin LK (1996) Identification of the Class Prymnesiophyceae and the genus Phaeocystis with rRNA-targeted nucleic acid probes detected by flow cytometry. J Phycol 32:858–868
Lee D-Y, Seto P, Korczak R (2010) DNA microarray-based detection and identification of waterborne protozoan pathogens. J Microbiol Meth 80:129–33
Lewis J, Medlin LK Raine, R (2012) MIDTAL (Microarrays for the Detection of Toxic Algae): A Protocol for a Successful Microarray Hybridisation and Analysis. Koeltz, Germany
Lim EL, Amaral LA, Caron DA, Delong EF (1993) Application of rRNA-based probes for observing marine nanoplanktonic protists. Appl Environ Microbiol 59:1647–1655
Lipshutz RJ, Fodor SP, Gingeras TR, Lockhart DJ (1999) High density synthetic oligonucleotide arrays. Nature Gen 21:20–24
Ludwig W, Strunk O et al (2004) ARB: a software environment for sequence data. Nucleic Acids Res 25:1363–1371
Lund JWG, Le Kipling C, Cren ED (1958) The inverted microscope method of estimating algal numbers and the statistical basis of estimations by counting. Hydrobiologia 11:143–170
Maurer D, BecB, Neaud-Masson N, Rumebe M, Auby I, Grémare A (2010) Etude des relations entre le phytoplancton et les phénomènes de toxicité d’origine inconnue dans le Bassin d'Arcachon. Ifremer internal repport: p 100
McNamee, S. Campbell K, Elliot C (2012) SPR technology as an early warning monitoring tool for marine biotoxins in algae/seawater samples. Env Sci Poll Res (this volume)
Medlin LK, Schmidt K (2010) Molecular probes improve the taxonomic resolution of cryptophyte abundance in Arcachon Bay, France. Vie et Milieu 60:9–15
Metfies K, Medlin LK (2004) DNA microchips for phytoplankton: the fluorescent wave of the future. Nova Hedw 79:321–27
Metfies K, Medlin LK (2005) Ribosomal RNA probes and microarrays: their potential use in assessing microbial biodiversity. In: Zimmer EA (ed) Methods in enzymology, molecular evolution: producing the biochemical data, volume 395 ed. Academic Press, New York, NY pp 258-278
Metfies K, Medlin LK (2008) Feasibility of transferring FISH-probes to an 18S rRNA gene-phylochip and a mapping of signal intensities. Appl Environ Microbiol 74:2814–2821
Metfies K, Borsutzki P, Gescher C, Medlin LK, Frickenhaus S (2008) PhylochipAnalyzer—a program for analysing hierarchical probe-sets. Mol Ecol Res 8:99–102
Metfies K, Gescher C, Frickenhaus S, Niestroy R, Wichels A, Gerdts G, Knefelkamp B, Wiltshire K, Medlin LK (2010) Contribution of the class Cryptophyceae to phytoplankton structure in the German Bight. J Phycol 46:1152–1160
Milkulski CM, Morton SL, Doucette GJ (2005) Development and application of LSU rRNA probes for Karenia brevis in the Gulf of Mexico, USA. Harmful Algae 4:49–60
Miller PE, Scholin CA (1998) Identification and enumeration of cultured and wild Pseudo-nitzschia (Bacillariophyceae) using species specific LSU rRNA-targeted fluorescent probes and filter-based whole cell hybridization. J Phycol 34:371–382
Moon-Van Der Staay SY, De Wachter R, Vaulot D (2001) Oceanic 18S rDNA sequences from picoplankton reveal unsuspected eukaryotic diversity. Nature 409:607–610
Peplies J, Glockner O, Amann R (2003) Optimization strategies for DNA microarray-based detection of bacteria with 16S rRNA-targeting oligonucleotide probes. Appl Environ Microbiol 69:1397–407
Reich M, Kohler A, Martin F, Buée M (2009) Development and validation of an oligonucleotide microarray to characterise ectomycorrhizal fungal communities. BMC Microbiol 9:241–41
Robert R, Guillocheau N, Collos Y (1987) Hydrobiological parameters during an annual cycle in the Arcachon Basin. Mar Biol 95:631–40
Rudi K, Skulberg OM, Skulberg R, Jakobsen KS (2000) Application of sequence-specific labeled 16 s rRNA gene oligonucleotide probes for genetic profiling of cyanobacterial abundance and diversity by array hybridization. Appl Environ Microbiol 66:4004–11
Schena M, Shalon D, Davis RW, Brown PO (1995) Quantitative monitoring of gene expression patterns with a complementary DNA microarray. Science 270:467–70
Simon N, Brenner J, Edvardsen B, Medlin LK (1997) The identification of Chrysochromulina and Prymnesium species (Haptophyta, Prymnesiophyceae) using fluorescent or chemiluminescent oligonucleotide probes: a means for improving studies on toxic algae. Eur J Phycol 32:393–401
Simon N, Campbell L, Ornolfsdottir E, Groben R, Guillou L, Lange M, Medlin LK (2000) Oligonucleotide probes for the identification of three algal groups by dot blot and fluorescent whole-cell hybridization. J Euk Micro 47:76–84
Tillmann U, Elbrächter M, Krock B, John U, Cembella A (2009) Azadinium spinosum gen. et sp. nov. (Dinophyceae) identified as a primary producer of azaspiracid toxins. Eur J Phycol 44:63–79
Töbe K, Eller G, Medlin LK (2006) Automated detection and enumeration for toxic algae by solid-phase cytometry and the introduction of a new probe for Prymnesium parvum (Haptophyta: Prymnesiophyceae). J Plank Res 28:643–657
Tyrrell JV, Bergquist PR, Bergqusit PL, Scholin CA (2001) Detection and enumeration of Heterosigma akashiwo and Fibrocapsa japonica (Raphidophyceae) using r-RNA targeted oligonucleotide probes. Phycologia 40:457–467
von Utermöhl H (1931) Neue wege in der quantitativen erfassung des planktons. (Mit besondere beriicksichtigung des ultraplanktons). Verh Int Ver Theor Angew Limnol 5:567–595
Yap Y, Zhang X, Ling M, Wang X, Wong Y, Danchin A (2004) Classification between normal and tumor tissues based on the pair-wise gene expression ratio. BMC Cancer 4:72
Yasumoto T et al (1985) Recent progress in the chemistry of dinoflagellate toxins. In: Anderson DM, White AW, Baden DG (eds) Toxic dinoflagellates. Elsevier, New York, pp 259–270
Ye RW, Wang T, Bedzyk L, Croker KM (2001) Applications of DNA microarrays in microbial systems. J Microbiol Meth 47:257–72
Acknowledgments
This work was supported by EU FP7 project MIDTAL, contract no 201724. Jixin Chen contributed to early stages of the protocol development and spotted the microarray. Delphine Guillebault and Angelica Herrera helped with the RNA extractions and hybridisations. YDA thanks her crew members (Laurent Letort and Francis Prince) and René Parra and Pascal Lebleu for technical support in Arcachon. Thanks are also due to Danièle Maurer from IFREMER/LER Arcachon for cell counts data and comments on the manuscript.
Author information
Authors and Affiliations
Corresponding author
Additional information
Responsible editor: Philippe Garrigues
Electronic supplementary material
Below is the link to the electronic supplementary material.
ESM 1
(DOC 39 kb)
Rights and permissions
About this article
Cite this article
Kegel, J.U., Del Amo, Y. & Medlin, L.K. Introduction to project MIDTAL: its methods and samples from Arcachon Bay, France. Environ Sci Pollut Res 20, 6690–6704 (2013). https://doi.org/10.1007/s11356-012-1299-9
Received:
Accepted:
Published:
Issue Date:
DOI: https://doi.org/10.1007/s11356-012-1299-9