Using Input-Output Analysis to Measure Healthy, Sustainable Food Systems
 Sinead M. Boylan1,2,3*
  Anne-Marie Thow1,3 Elijah K. Tyedmers4 Arunima Malik4,5 Janet Salem4,6 Robyn Alders7,8 David Raubenheimer2,3 Manfred Lenzen4
- 1School of Public Health, University of Sydney, Sydney, NSW, Australia
- 2School of Life and Environmental Sciences, University of Sydney, Sydney, NSW, Australia
- 3Charles Perkins Centre, University of Sydney, Sydney, NSW, Australia
- 4ISA, School of Physics, University of Sydney, Sydney, NSW, Australia
- 5Business School, University of Sydney, Sydney, NSW, Australia
- 6Asia and the Pacific Office, United Nations Environment Programme, Bangkok, Thailand
- 7Kyeema Foundation, Brisbane, QLD, Australia
- 8Centre for Global Health Security, Chatham House, London, United Kingdom
Our current food systems are hampering efforts to meet the Sustainable Development Goals. Reshaping our food systems could have enormous co-benefits for our populations and planet. However, decision makers and experts are questioning whether it is possible to meet environmental, social and economic goals simultaneously, or whether tradeoffs are necessary. There has been a call for the development of better measurements and indicators to help policymakers understand the benefits and considerations for healthy and sustainable food systems. There is an urgent need to address the gaps in understanding of what a sustainable food system means across varying populations and geographies and how we can better measure these systems. Practice calls for a framework in which different aspects of food and nutrition security can be measured under identical scope, where policy simulations which arrive at multi-indicator outcomes are comparable, and where quantified trade-offs between different sustainable development objectives are valid. We introduce, and focus on one technique that does allow such multi-indicator scope-consistent analysis of food systems under a life-cycle perspective: input-output analysis. We describe input-output analysis, and its relevance and advantages for measuring the sustainability of food systems, nutrition and diets, including resilience and vulnerability. Using data from the global multi-regional input-output databases, we then describe potential measures that are able to extend the current state of art into a more comprehensive framework that has the potential to support policy related to global initiatives such as the Sustainable Development Goals.
Introduction
Food systems encompass a range of actors and activities involved in the production, aggregation, processing, distribution, consumption, and disposal of food products (Food and Agriculture Organisation, 2018). Food systems underpin the 2030 Agenda for Sustainable Development, also known as the Sustainable Development Goals (SDGs), which is a global commitment to eradicate poverty and hunger while ensuring environmental sustainability, health and prosperity for all (United Nations, 2015). Food and agriculture are associated with most of the 17 goals, with Goal two specifically devoted to ending hunger and malnutrition, achieve food security and improved nutrition and promote sustainable agriculture (United Nations, 2015). Over millennia, our food systems have evolved from highly localized systems, to an international system; today, the food we grow, harvest, process, trade, transport, store, sell and eat is a connecting thread along value chains between people, prosperity, and planet (United Nations Environment Programme, 2016).
Food systems are rapidly changing, growing in volume and intensity while still operating within the same planetary boundaries. It has been estimated that the world needs to produce 70% more food to feed the 9 billion people who will live on this planet in 2050 (Food and Agriculture Organisation, 2009). While the ability to currently produce enough food for all remains largely unquestioned, the ability to produce enough food to equitably and efficiently feed the world without harming population or planetary health remains uncertain. The global food system fails to meet the related challenges of sustainability, health, vulnerability, and resilience. The way in which food systems currently operate are responsible for land degradation, depletion of fish stocks, nutrient losses, impacts on terrestrial and aquatic biodiversity, impacts on air, soil and water quality, and greenhouse gas emissions contributing to climate change (United Nations Environment Programme, 2016). The expected population growth, expansion of cities, dietary shifts to unhealthy and unsustainable consumption will increase the pressures even more.
While food production has more than doubled and diets have become more varied (and more energy-dense) as global incomes increase, over 800 million people are still hungry, over 2 billion suffer from micronutrient deficiencies (in particular of iron, zinc, vitamin A, and iodine) and over 2 billion people are overweight or obese (United Nations Environment Programme, 2016).
Tackling food systems challenges will require an integrated approach if we are to meet many of the SDGs (United Nations Development Programme, 2018), with research indicating that reshaping our food systems could not only help reach global greenhouse gas emission targets for 2050 plus other environmental wins, but protect and improve population health (Friel et al., 2009). Public and private sector actors globally are taking action to shift toward healthy and sustainable food systems.
But what exactly is a healthy and sustainable food system, and would the proposed solutions actually work? The FAO describe “sustainable diets” as “those diets with low environmental impacts which contribute to food and nutrition security and to healthy life for present and future generations. Sustainable diets are protective and respectful of biodiversity and ecosystems, culturally acceptable, accessible, economically fair and affordable; nutritionally adequate, safe and healthy; while optimizing natural and human resources” (Food and Agriculture Organisation and Bioversity International, 2010). While this definition is concerned with “diets,” it suggests that “diets” cannot be separated from the food system, and moreover, from human and ecosystem health. It also highlights that if food systems are to help meet the SDGs, using traditional nutritional science and indicators will not be enough.
There has been a call for better measurements and indicators to be developed to help policymakers understand the benefits, possible unintended consequences and other considerations (e.g., data availability and complexity), for healthy and sustainable food systems (United Nations Standing Committee on Nutrition, 2017; Tuomisto, 2019). In order to advance commitments to sustainable food systems and, moreover, the SDGs, there is an urgent need to address the gaps in understanding of what a sustainable food system means across varying populations and geographies and how we can better measure these systems. An integrated approach underpinned by transdisciplinary research is key (Francis et al., 2008; Mendez et al., 2013; Clancy, 2017).
Aim of This Work
We will demonstrate how input-output analysis (IOA), which is a technique that draws on a global life-cycle perspective, can be used to effectively advance metrics regarding healthy and sustainable food systems. To do this, we have conducted a mapping review to map out existing literature, identify gaps in research and highlight the strengths of IOA in advancing metrics. We will also present example indicators using IOA to illustrate its power and relevance.
Prior Work to Measure Healthy and Sustainable “Diets”
Increasing research has focused on the impact of the food system on environmental sustainability, in particular greenhouse gas emissions (GHGEs) and in some cases, land use (Ridoutt et al., 2017). However, the key determinants, components and processes of a sustainable diet remain largely overlooked. These include use of fossil fuels, trade, food subsidies, water use, packaging material, gender, and knowledge to name but a few. Achieving healthy and sustainable diets for all will require a sustained effort across geographies, sectors and disciplines. In recent years, there have been a number of attempts to consider a comprehensive range of indicators at regional (World Wildlife Federation, 2013) and global levels (Chaudhary et al., 2018; Willett et al., 2019).
The World Wildlife Fund Live Well for Life project defined sustainable diets for France, Sweden and Spain (World Wildlife Federation, 2013). This project collected data on consumption patterns, nutritional recommendations, dietary guidance, GHGEs associated with particular foods, and general price information. They demonstrated that for all three countries a healthy and sustainable diet (one that complies with nutritional recommendations, reduces GHGEs by 25%, and provides an acceptable choice of foodstuffs) is possible and is not too far from current consumption patterns. However, the authors report a number of methodological limitations and recommend better GHGEs and life-cycle analysis (LCA) data, more research into reducing GHGEs in production and distribution of food and into the consequences of taking wider sustainability criteria (water, biodiversity) into account.
More recently, The EAT-Lancet Commission, have led the development of global scientific targets for sustainable food systems (Willett et al., 2019). The focus is on food production and consumption, with a healthy reference diet integrated with a set of system-wide environmental parameters based on the planetary boundaries framework (Stockholm Reslience Centre, 2018). The findings of this Commission indicate that a healthy food system is achievable with major dietary shifts, large reductions in food waste and loss, and major improvements in food production practices. The Commission acknowledges that other parts of the food system were not considered as part of this assessment, nor were issues around economy, culture and society. The Commission states that interdisciplinary research and monitoring with replicable methodology at national and other levels is urgently needed to help policy actors to operate on a strong evidence base.
Chaudhary et al. (2018) have partly considered several important determinants in their application of seven indicators, including socio-cultural well-being and resilience, across 156 countries (Chaudhary et al., 2018). However, there are a number of ways in which this multi-indicator assessment could be strengthened. Indicators in this analysis were not measured and reported with the same scope, because some indicators were measured in a supply-chain context, whilst others were not (e.g., well-being). Further, their measurement of food consumption was based on Food Balance Sheet data and was analyzed using a single food composition database. Food Balance Sheet data do not necessarily reflect actual intakes and ideally, up-to-date country-specific food composition data would be included in this analysis (de Bruyn et al., 2016).
Our current global economy is increasingly linked through an international supply-chain network that accounts for around 30% of major environmental and social impacts (Wiedmann and Lenzen, 2018). The pressure on ecosystems and natural resources from food supply chains will increase with the expected increase in demand in both volume from population growth, as well as intensity from dietary shifts toward more resource-intensive products (e.g., livestock-based food and processed food and drinks) that are associated with increased incomes. Climate change will further exacerbate these issues (United Nations Environment Programme, 2016). Today's food systems in particular predominantly consist of highly industrial globalized supply chains and so in measuring the health consequences and sustainability of these systems, international trade and the global supply-chain network must be considered. Herein lies an important limitation of previous research (Chaudhary et al., 2018; Willett et al., 2019) as we now detail.
Advancing the Measurement of Healthy and Sustainable “Diets”
The Importance of a Global Life-Cycle Perspective
Whilst in the analysis by Chaudhary et al. (2018), carbon, water, land and biodiversity were measured with a supply-chain coverage (or in other words, as footprints, Figure 2 in Chaudhary et al.), other indicators such as nutrient adequacy, affordability, well-being, and safety were not (Chaudhary et al., 2018). This is because they cannot be measured in a life-cycle context, either because they have no supply-chain relevance (e.g., affordability is relevant only to the consumer in their analysis), because they are not additive (a key requirement in LCA e.g., one cannot add quantities measured as ratios or indices), or not industry-specific quantities (e.g., most surveys measure well-being as a region- but not industry-specific quantity).
Mixing quantities that are measured under a life-cycle or footprint scope with others that are not, means that trade-offs and relationships between the different indicators can in general not be established (this circumstance is explained in Lenzen et al. for the example of a deficient environmental impact statement; Lenzen et al., 2003). This shortcoming is the reason why practice calls for a framework in which different aspects of food and nutrition security can be measured under identical scope, where policy simulations which arrive at multi-indicator outcomes are comparable, and where quantified trade-offs between different sustainable development objectives are valid. In the following we will therefore introduce, and focus on IOA, as one technique that does allow such multi-indicator scope-consistent analysis of food systems under a life-cycle perspective.
Further, given that food and nutrition sustainability are a global problem, a research framework is needed that:
a) allows modeling of international trade and the global supply-chain network,
b) provides completely harmonized physical and economic data at the global scale and at the detail of individual economic sectors, and
c) is governed by accepted worldwide standards.
IOA can address each of these components and thus offers a suitable approach in researching the complexities of healthy and sustainable food systems at a global level. We will now outline example studies from the current literature followed by a discussion of potential measures, namely: the social and environmental impacts of food demand; vulnerability; local disasters, global reach; resilience; fiscal measures and income distribution; the supply chain of foods associated with chronic disease risk; and trade, inequality and food insecurity.
Input-Output Approaches to Measuring the Sustainability of Food Systems
Input-output analysis (IOA) is an economic technique conceived in the 1930s by Nobel Prize Laureate Wassily Leontief 1936 (Leontief, 1936). IOA is able to interrogate economic data on inter-industry transactions, final consumption and value added, in order to trace economic activity rippling throughout complex supply-chain networks and unveil both immediate and indirect impacts of systemic shocks (Leontief, 1966). Over the past 70 years, IOA has been used extensively for a wide range of public policy and scientific research questions (Rose and Miernyk, 1989). In the past two decades IOA has experienced a surge in applications, especially on carbon footprints (Wiedmann, 2009) and global value chains (Timmer et al., 2014), and in the disciplines of LCA (Suh and Nakamura, 2007) and Industrial Ecology (Suh, 2009).
International and inter-industry trade modeling is typically undertaken on the basis of global multi-regional input-output (MRIO) databases (Tukker and Dietzenbacher, 2013). These databases are based on a range of data sources: national input-output tables published by numerous national statistical agencies such as the Australian Bureau of Statistics (Australian Bureau of Statistics, 2016a), international trade and national accounts data published by the United Nations (United Nations Industrial Development Organisation, 2016; United Nations Statistics Division, 2016a,b,c,d, 2017a), and economic data published by a range of other global governance organizations (SourceOECD, 2009; Institute of Developing Economies-Japan External Trade Organisation, 2015; International Food Policy Research Institute, 2015; Organisation for Economic Co-operation Development, 2015; World Bank, 2017). Input-output accounts are governed by established United Nations (United Nations, 1999, 2009), European (Eurostat, 2016) and national (Australian Bureau of Statistics, 2016b) data standards. Monetary national and trade accounts are seamlessly integrated and harmonized with satellite accounts for physical (economic, social and environmental sustainable development) indicators such as employment, income, gender and income equality, occupational safety, GHGEs, water scarcity, land degradation, air pollution, nitrogen emissions, energy use, biodiversity decline, and material flow, amongst others. This integration and harmonization is standardized in the System of Environmental-Economic Accounting (United Nations Statistics Division, 2017b).
Some of the authors of the present paper are members of a research team with expertise in global MRIO database compilation and use. In particular, the authors have utilized Australian Government-funded NeCTAR Virtual Laboratory eResearch technology (NeCTAR, 2013) to develop the Global MRIO Virtual Lab. The data used to produce the exemplary results presented in this paper were compiled in the Global MRIO Lab. MRIO databases also exist at the sub-national inter-regional level.
Example Studies From the Literature
The potential of IOA lies in its ability to account for the complex interactions between economic, social and environmental factors that both shape food systems and arise from food systems. Kytzia et al. (2004) highlight the shortcomings of several analytical methods including LCA, material flow analysis (MFA) and IOA, but suggest using a hybrid model of IOA and MFA based on an intrinsic aspect of IOA—money flow (Kytzia et al., 2004). Through a comparative evaluation of the environmental impact between different vegetarian diets in Switzerland, it was demonstrated that although a plant-based diet has environmental benefits, it was not a viable option within the context of the Swiss economy. Similarly, a review in the United States indicated that current food systems may not be capable of supporting an increase in consumption of fruits and vegetables (Finley et al., 2017). These findings demonstrate that current food systems can be constrained by a sustainability threshold in a sense meaning that a “conventionally” sustainable diet, such as a vegetarian one, may only be a more sustainable option until that threshold is reached (such as an entire country shifting to a vegetarian diet). In these cases, importing more fruits and vegetables to satisfy demand could negate the environmental benefits of a vegetarian diet due to the embodied environmental impact associated with importing.
The support for plant-based or low-meat diets and their benefits for planetary health stem from the consensus that a reduction in meat consumption would significantly reduce GHGEs (United Nations Environment Programme, 2016). However, this does not imply that plant-based diets do not contribute their share of GHGEs as well, and the impact embodied along the entire supply chain should be taken into consideration. An input-output study done by Hirst (1974) aiming to determine the energy embodied in food-related sectors found the transport and processing sectors to be most energy intensive and thus a noticeable difference existed between fresh and processed fruits and vegetables (Hirst, 1974). The larger environmental impact embodied in processed fruits and vegetables further emphasizes the need for a more sustainable food system as opposed to simply switching to what are considered more sustainable diets. An evaluation of GHGE contributors from food-related sectors also underlined plant-related agriculture as a significant producer of N2O—a contributor to GHGEs (Kramer et al., 1999). These studies highlight that examining the health and sustainability of food systems using a food-based approach can obscure the complexities of such systems.
Organic farming methods have been suggested as an effective measure against N2O emissions released from fertilizer use. A study conducted by Wood et al. (2006) compared organic and conventional methods of farming. The on-site impacts of both farming methods were similar at first glance, however the differences were highlighted further across the supply chain indicating that organic farming tended to have a lesser impact overall. Australian research using LCA has shown that industrial food production systems for chicken meat and lettuce can be more environmentally sustainable than alternative commercial and civic systems, indicating the importance of multiple food subsystems for food security (James and Friel, 2015).
These food systems must also be tailored (and therefore, monitored) according to regional and cultural circumstances (Behrens et al., 2017). MRIO was used to evaluate the environmental impact of nationally recommended diets compared to national average diets (Behrens et al., 2017). The findings indicate that the environmental impact was significantly reduced in higher-income countries, slightly reduced in middle-income countries and had an increased impact in low-income countries when comparing nationally recommended diets to average diets. While this may be largely due to the higher environmental impact of diets in higher-income countries, there are other explanations for these findings. Different regions place different levels of importance on different nutrients and foods, reflecting local agroecological conditions and their ability to adequately nourish humans. The findings also indicate that there is room to improve nationally recommended diets to support healthy and sustainable food systems. From the literature so far, it is evident that IOA has helped with understanding that a sustainable diet may not necessarily be a part of a sustainable food system, and a sustainable food system in one context may not necessarily be sustainable in another.
Example Indicators Using IOA
IOA can support the measurement of food system impact with respect to sustainability and nutrition. The notion of sustainable food systems can potentially include a very broad set of objectives and performance indicators, and as a consequence a very extensive range of methods and applications, even when the scope is restricted to IOA. Here, we do not aim to present an exhaustive account of potential measures, but instead we will just present seven examples to illustrate the power and relevance of IOA for practice.
Social and Environmental Impacts of Food Demand
The most straightforward application of IOA for measuring the sustainability of diets is as a conventional LCA of the environmental and social impact of food consumption. Technically, this involves arranging physical indicator data (such as quantities of water use, greenhouse gas emissions, employment etc.) into so-called satellite accounts (Bartelmus et al., 1991; United Nations Statistics Division, 2017a), then applying Leontief's physically extended demand-pull calculus (Leontief and Ford, 1970), and calculating so-called multipliers for each satellite indicator (International Food Policy Research Institute, 2015). These multipliers quantify the amount of indicator quantity that is associated with a monetary unit of final demand of commodities. Multipliers cover impacts across the entire upstream supply-chain network, or life cycle, of commodities.
Figure 1 shows multipliers for a range of American food products, in terms of seven environmental and social indicators. The information is taken from a number of publications [employment (Alsamawi et al., 2014a); GHGEs (Malik et al., 2016); energy use (Lan et al., 2016); land (Moran et al., 2013); Nitrogen emissions (Oita et al., 2016); water scarcity (Lenzen et al., 2013)].
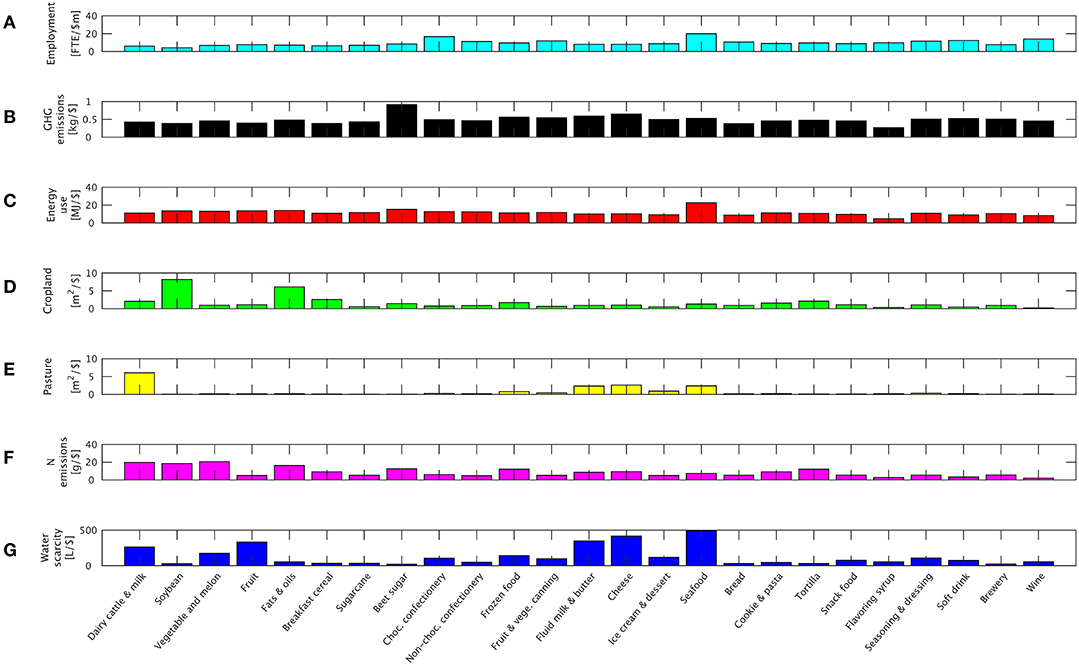
Figure 1. Multipliers for a range of US food products. Multipliers for a range of US food products, in terms of 7 environmental and social indicators, per unit of US$ of household expenditure. FTE, Full-time equivalent; GHG, greenhouse gas; MJ, megajoule; N, nitrogen. Social multiplier is shown in (A), and environmental multipliers in (B–G).
The indicator list can be extended to cover other indicators such as human health (Gill, 2006; Capon and Dannenberg, 2016), hunger (Pritchard, 2012), soil degradation (Lal et al., 1997; McBratney et al., 2003, 2017a,b; Koch et al., 2013), air pollutants (Kanemoto et al., 2014), occupational hazards (Alsamawi et al., 2017), child labor (Gómez-Paredes et al., 2016), gender and income inequality (Alsamawi et al., 2014b), corruption (Xiao et al., 2017a), biodiversity loss (Lenzen et al., 2012), material flow (Wiedmann et al., 2015), and many more (Xiao et al., 2017b). Using the Global MRIO Lab (Lenzen et al., 2017), this analysis can also be carried out for any year between 1990 and 2015, and for 220 countries.
Multipliers can be compared, and trade-offs between them established, because they are calculated with identical scope.
Another way of exploring the social and environmental impacts, could be to examine food consumption data, rather than food demand data, however this is outside the scope of this current paper.
Vulnerability: Global Food Hinterlands
The technique applied in the previous example can be extended from individual commodities to the food consumption of entire countries. Such applications yield what is commonly referred to as “resource hinterlands” (Lenzen and Peters, 2010). In this context, vulnerability is of particular interest, and a low degree of vulnerability can be seen as a prerequisite of food or diet sustainability. National food systems are vulnerable to adverse events within but also beyond their borders. In order to understand these vulnerabilities, it is helpful to understand the “global hinterland” of a country's food consumption. In other words: where does the food that a country consumes come from? And in addition, where do non-food items that are needed for food production (e.g., agricultural machinery, pesticides, fertilizer) and their supply-chain inputs (e.g., steel, chemicals etc.) come from? Answering these questions requires a complete global LCA of food consumption.
Using MRIO analysis, we find that the global food hinterlands of the USA, Germany, Japan and Australia span most high-income countries, predominantly in North America, Europe and Asia, and leave out South America and Africa. Transport distances seem to play some role as the USA relies more on Canada than other countries, Japan relies more on China, and Germany more on the EU. Interestingly, Brazil's food hinterland is concentrated on Argentina and the USA, whilst India relies mostly on its own food production (Figure 2). All six countries represent a more important food source for themselves than their import origins.
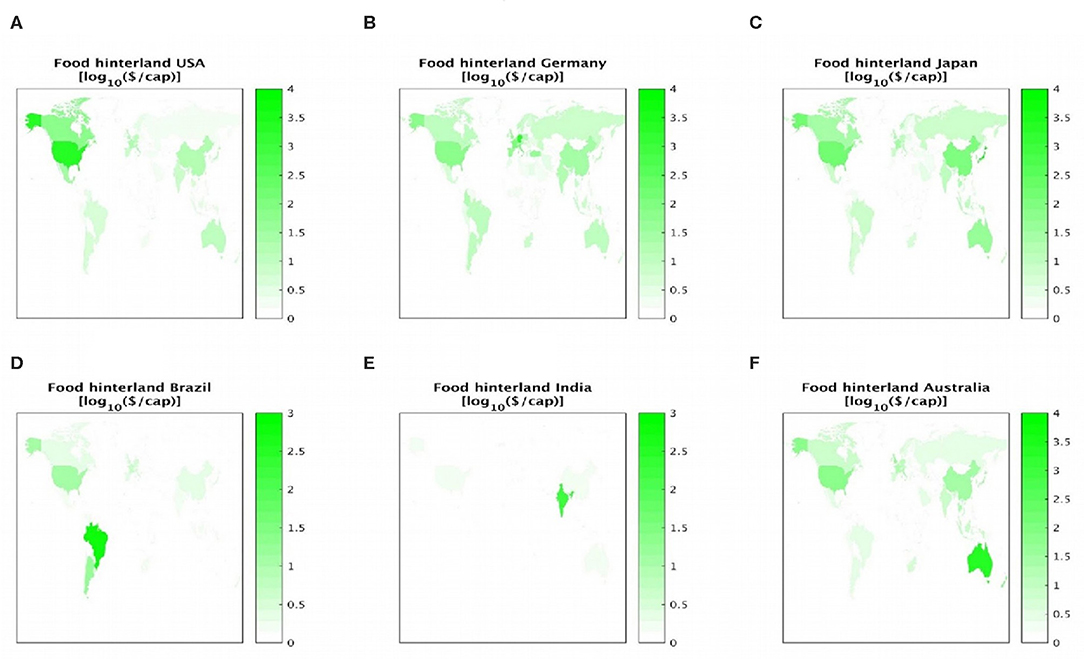
Figure 2. Global food hinterlands of countries with high populations. Global food hinterlands of the USA (A), Germany (B), Japan (C), Brazil (D), India (E), and Australia (F). To relate the production values to population size in the consuming countries, the maps are color-coded in units of log10 (US$/cap), so that e.g., 3 = US$1,000/cap.
Smaller and/or less populous countries face more complex food supply realities (Figure 3). Unlike the six countries shown in Figure 2, some countries rely heavily on food imports from abroad. For example, Canada is highly dependent just on the USA, and New Zealand on Australia. Norway relies on a broader set of countries, as its own food production is relatively small due to climatic conditions. An extreme case are small-island nations such as Palau, which rely almost entirely on food imports from around the world. Cuba is seen as relatively self-sufficient because of political circumstances. The Central African Republic has a negligible global food hinterland, given that the country is amongst the poorest on the planet, and cannot afford expensive imported food.
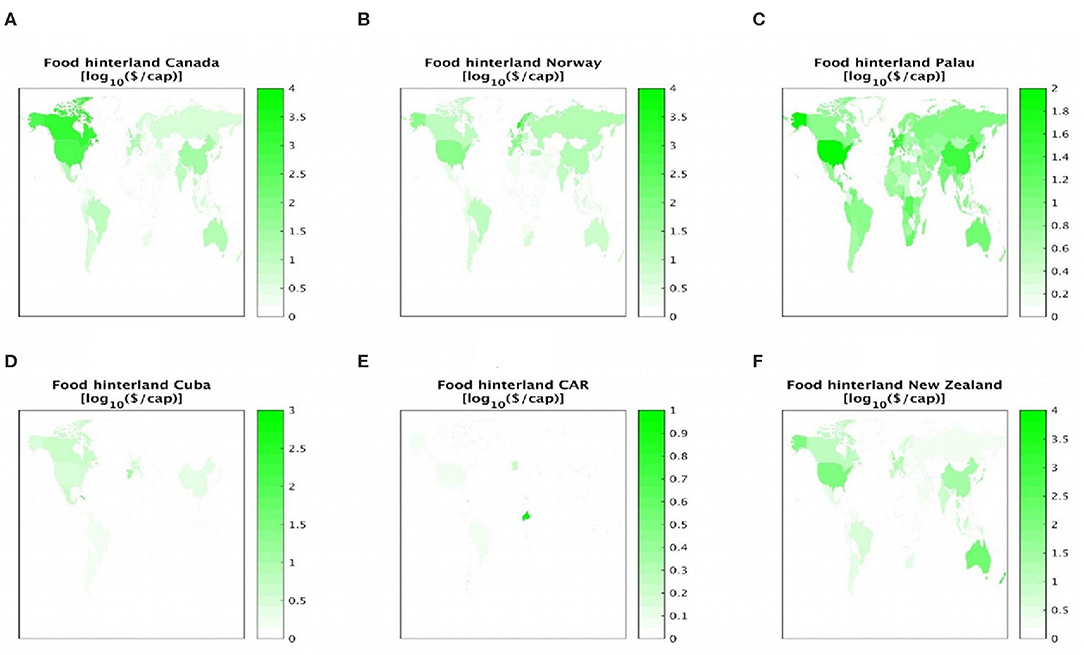
Figure 3. Global food hinterlands of countries with low populations. Global food hinterlands of Canada (A), Norway (B), Palau (C), Cuba (D), the Central African Republic (CAR) (E), and New Zealand (F). To relate the production values to population size in the consuming countries, the maps are color-coded in units of log10 (US$/cap), so that e.g., 3 = US$1,000/cap.
Local Disasters, Global Reach
Vulnerabilities play out in disasters. In the context of food supply and diets, six countries in the world supply almost half, or more than half of global exports of four of the world's most important staple crops: rice, wheat, soybeans and corn (Table 1).
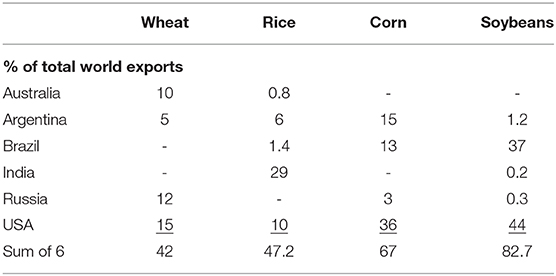
Table 1. Exports of wheat, rice, corn and soybeans from six export origins, as a percentage of total world exports.
Many of these crop systems are vulnerable to natural disasters such as floods, droughts and storms, or human-induced disasters such as chemical pollution, invasive species, or civil unrest. Any adverse event that destroyed a sizable fraction of national crops would lead to production shortfalls. For example, in 2007 when extreme weather hit the Murray-Darling Basin in Australia, the fall in cereal production was partly to blame for soaring food prices globally (Piesse and Thirtle, 2009). It is very likely that markets will respond by fulfilling local needs at the expense of international markets (particularly when the domestic market is relatively high-income, as in Australia). Accordingly, we have modeled the global production impacts of a 10% decrease of exports of wheat, rice, corn and soy beans from Australia, Argentina, Brazil, India, Russia and the USA (Figure 4).
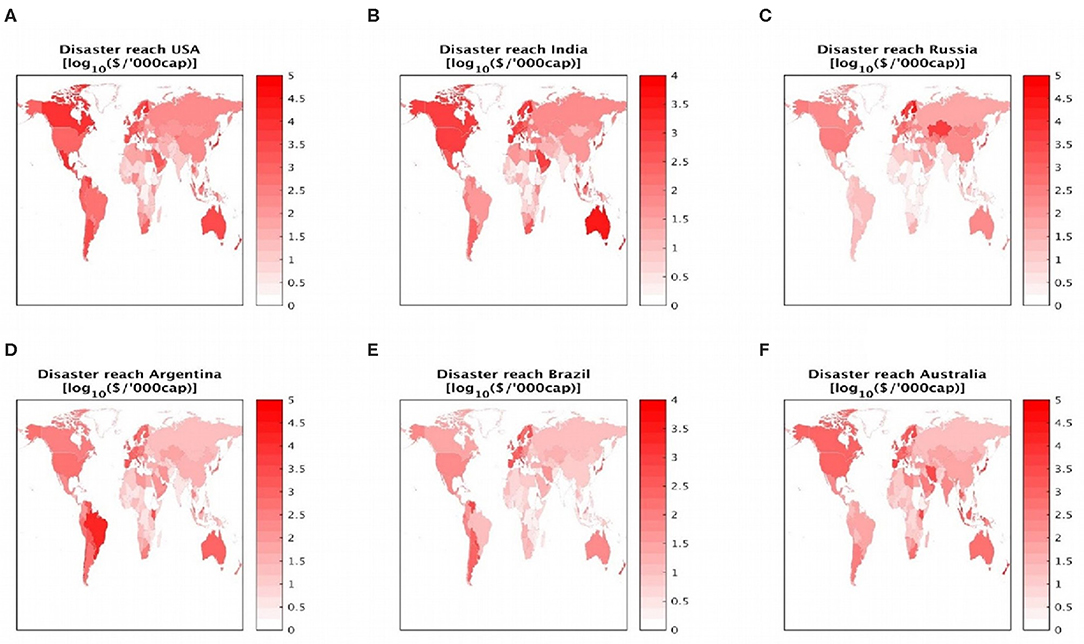
Figure 4. Export shortfalls and global production. Decrease in global production as a result of a 10% shortfall in exports of wheat, maize, rice and soybeans from six major exporters: USA (A), India (B), Russia (C), Argentina (D), Brazil (E), Australia (F). The decrease of 10% was chosen only to exemplify the impacts and is not based on any predicted scenarios. To relate the production losses to population size in the producing countries, the maps are color-coded in units of log10 (US$/'000cap), so that e.g., 5 = US$100/cap.
Shocks to staple exports from the USA would have a major global reach (Figure 4, top left panel). In particular, Canadian consumers would feel an impact in the order of US$100 per capita. Similar relationships exist between Brazilian recipients of Argentinian crops (bottom left), and Kazakh recipients of Russian crops (top right). The disaster reach originating from India, Brazil and Australia is about one order of magnitude smaller.
Interestingly, exporting countries are themselves affected by the shock, even though we have assumed that local supplies remain unaffected. This is because countries rely on imports of processed products that were initially made out of the crop they exported. For example, Australia may import American wheat products made from Australian wheat. If Australian wheat exports to the USA decreased, some of the US food exports to Australia would be affected.
Resilience
Rose (2017) defines economic resilience as the ability of individuals and communities to inherently and adaptively respond to hazards, and to avoid potential losses (Rose, 2017). Measuring resilience allows evaluating disaster responses and identifying strategies for reducing losses. In an IO context, individuals, communities, companies, cities and regions are all exposed to risks stemming from the exposure of their supply chains to potential disasters, and thus supply-chain resilience forms an important part of the economic resilience concept. In IO parlance, a low degree of vulnerability is one characteristic of a resilient economy (Rose, 2011). Resilience in the face of global adversity is also an important concept in relation to food and nutrition security (Food and Agriculture Organisation, 2013; Berry et al., 2015; Candy et al., 2015; MacMahon et al., 2015; Tendall et al., 2015) and therefore for the sustainability of food systems. A coherent analytical modeling framework that integrates food security, sustainability and resilience is required for improving our understanding of indirect effects of climate change-related impacts, thus informing effective decision-making for adaptation of food systems (Wheeler and von Braun, 2013).
Resilience is also traditionally dealt with quantitatively within IOA (Rose, 2007, 2011; Cox et al., 2011; Rose and Krausmann, 2013; Chen et al., 2017). One example for addressing resilience against disasters is to re-structure inter-industry and inter-regional trade (e.g., by choosing alternative suppliers and/or supply chains), with the aim of reducing the exposure to disaster-prone or environmentally intensive commodity origins (Burch and Pritchard, 1996; Venn et al., 2006; Ash and Newth, 2007; Holloway et al., 2007; Maye et al., 2007; Kneafsey et al., 2008). Often, linear programming techniques are used for this purpose (Muller, 1973; James and Musgrove, 1986; Tamiz et al., 1998; Kondo and Nakamura, 2005; Lin, 2011).
Fiscal Measures and Income Distribution
IOA can also be used effectively to measure the intended and unintended consequences of policy intervention to promote healthy and sustainable food systems, by assessing the impact of consumer-oriented interventions on the global food system. For example, fiscal policy interventions have been widely recommended as effective interventions to incentivize dietary change among consumers (Thow et al., 2018). These interventions work by creating price differentials that favor the consumption of sustainable (environment- or health-wise) commodities (Bonnet and Réquillart, 2013; Edjabou and Smed, 2013; Härkänen et al., 2014; Bíró, 2015; Hagenaars et al., 2017; Harding and Lovenheim, 2017; Nomaguchi et al., 2017; The Lancet Diabetes and Endocrinology, 2017; The Lancet Public Health, 2017). While much existing evidence is specific to a given national context (for example the UK, Chile, Denmark or Hungary), it is possible to assess global impacts of a commodity-specific tax using a time series of global MRIO databases that covers 220 countries. For example, it is possible to assess the wage impacts on sugar producers and manufacturers of commodities high in sugar (Figure 5). Due to the geographical location of these producers, low-income countries will be most significantly affected, highlighting the challenge in balancing environmental, health, social and economic wins.
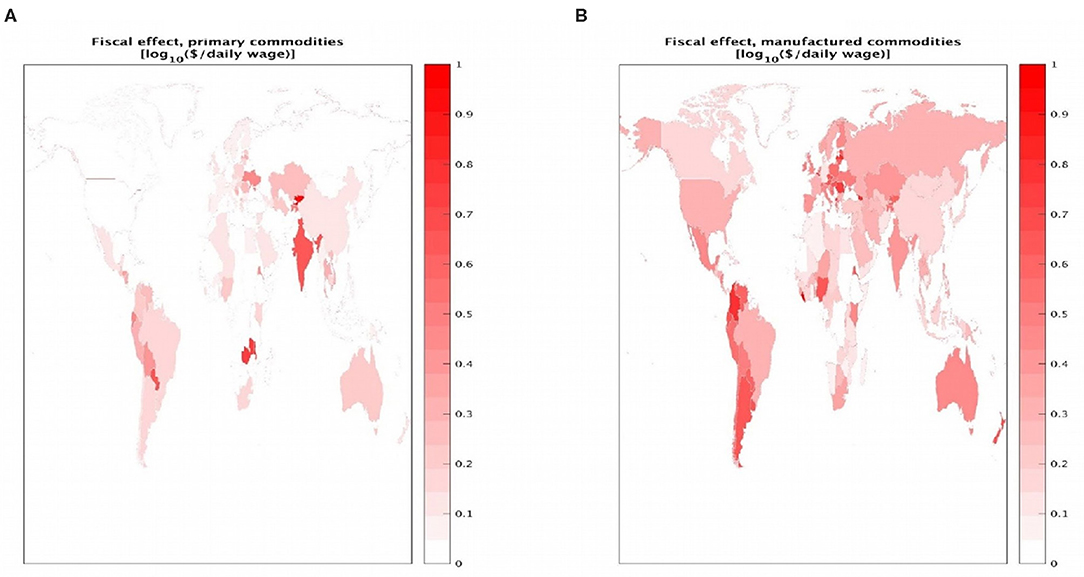
Figure 5. Incidence of a 10% tax on a range of food items. Incidence of a 10% tax on the total output of a set of primary (A) and secondary food (B) items. To refer fiscal effects to a meaningful unit reflecting countries' relative wealth, color shadings reflect multiples (1–10) of each country's total daily wage payment. Left panel: Sugar beet, sugar cane, raw sugar, refined sugar. Right panel: Refined sugar, soft drinks, chocolate, ice cream, extracts.
A key benefit of IOA in this context is the ability to examine the complexity of the supply chains relevant to the taxed products. It can thus provide forewarning about potential economic impacts so that governments and industry can pro-actively develop strategies to mitigate the impact. The adaptability of employment across sectors, and the shift in consumption to other goods or services (which in some cases may be more employment intensive), mean that aggregate employment as well as sectoral employment needs to be considered. Two recent studies have indicated that taxes on sugar sweetened beverages, for example, are unlikely to have negative effects on aggregate employment, and may also have positive impacts through the employment-generating impacts of revenue and reallocation of consumer expenditure (Powell et al., 2014; Guerrero-López et al., 2017). The ability of industry to adapt to emerging trends also needs to be considered—including a significant global trend toward “health” products in the food sector, which nuts are very well-positioned to take advantage of. This type of research would be equally applicable to a range of other policy interventions that have been tabled in the United Nations, such as removal of harmful subsidies, investment in sustainable food system research or consumption-oriented policies such as stricter marketing rules for unhealthy food.
The Supply Chains of Foods Associated With Chronic Disease Risk
As concern regarding the high burden of diet-related non-communicable diseases (NCDs) grows, more and more governments are taking action through the implementation of policies designed to reduce consumption of foods high in fat, salt and sugar, which are associated with NCD risk (World Cancer Research Fund, 2018). Such strategies include labeling, restrictions on marketing, health promotion campaigns and fiscal policy intervention. Public health evidence suggests that reductions in consumption of these foods would have significant benefits for both health and environmental sustainability, if consumers of high animal-sourced diets switch to a more plant-based diet. However, these products incorporate other ingredients as well. IOA can be used to assess the impacts of reduction in consumption of a food high in salt, fat and/or sugar not only on the production of the intended target, as we show above with a tax on sugar, but also on the other—in some cases healthy—commodities also involved in their production. A decline in the consumption of chocolate, e.g., will affect the production of cocoa upstream in chocolate's supply chains and associated employment in low-income countries, even though cocoa (and its direct products) may not directly cause adverse health effects (Figure 6). A similar situation exists for nut producers around the world, since nuts are a significant component in many chocolates (Figure 7). This result is observed owing to the linear relationship between demand for inputs and outputs in the Leontief demand-pull model.
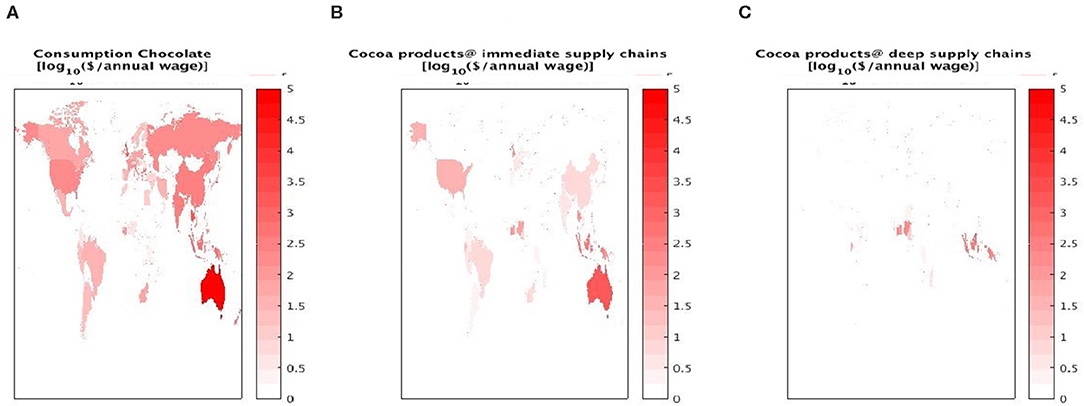
Figure 6. Chocolate consumption and outputs of cocoa products. Consumption of chocolate in Australia (A), and output of cocoa products in the first five supply-chain layers upstream from chocolate (B), and in the remaining upstream supply chains (C).
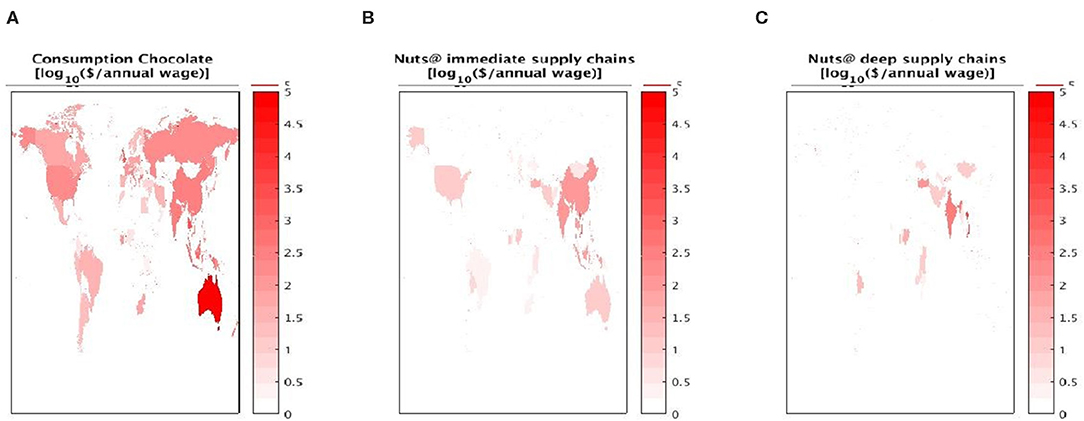
Figure 7. Chocolate consumption and output of nuts. Consumption of chocolate in Australia (A), and output of nuts in the first 5 supply-chain layers upstream from chocolate (B), and in the remaining upstream supply chains (C).
Australians buy mainly Australian-made chocolate, but also from many other countries around the world (United Nations Statistics Division, 2016b) (Figure 6 left panel). This chocolate requires a range of material and non-material inputs from industries situated in the supply-chain network upstream from chocolate. Including five layers of production upstream from Australian chocolate, we find cocoa processing facilities mainly in the USA, Ecuador, Brazil, the UK, Côte d'Ivoire, Ghana, Nigeria, Cameroon, South Africa, China, Thailand, Malaysia and Indonesia (center). Following the supply-chain network through to its origins with primary producers of cocoa leaves just seven main global cocoa producers: Ecuador, Côte d'Ivoire, Ghana, Nigeria, Cameroon, Malaysia and Indonesia (right). In these countries, cocoa production for the ultimate chocolate destination Australia alone is worth hundreds of mean annual incomes. Should Australian chocolate consumption decrease, these jobs would be at risk. Some types of Australian chocolate embody nuts, and these originate from Turkey (hazelnuts and walnuts), India and Vietnam, Nigeria and Côte d'Ivoire (cashew nuts), Iran (almonds) and Ukraine (walnuts) (Figure 7).
Trade, Inequality, and Food Insecurity
Food security requires constant access to sufficient, safe, nutritious food to maintain a healthy and active life (Food Agriculture Organisation, 1996). Food insecurity, a notable indicator of food inequality, can manifest itself in a number of ways. Here, we discuss two of these- hunger and obesity. In the context of food security and planetary health, the issue of hunger and food inequality warrants special investigation. The International Food Policy Research Institute (IFPRI) regularly calculates the Global Hunger Index (GHI), using well-established procedures for 118 countries, for four key component indicators: undernourishment, child-wasting, -stunting and -mortality. The comprehensive data are available for a continuous time-series from 2011 to 2016, and for separate years−1992, 2000 and 2008 (International Food Policy Research Institute, 2017). Food shortage resulting from natural disasters, such as droughts and floods, is one of the causes of hunger worldwide. The contribution of international trade in promoting or eradicating hunger is unclear (Pritchard, 2012). It has been suggested that international trade opens avenues for low- and middle-income countries to have access to large global markets allowing them to specialize in production and exploit economies of scale. There is, however, another school of thought that challenges this argument on the basis of unfair trading rules that are biased against low- and middle-income countries (Food and Agriculture Organisation, 2017; Oxfam, 2017). A potential integration of GHI with a global MRIO database, coupled with additional data for harmonizing the GHI dataset with the trade model, could yield useful insights into the implications of international trade on hunger in low- and middle-income countries. It is important to note that whilst for environmental indicators such as carbon emissions and energy use, we can enumerate the amount of emissions embodied in the consumption of a particular good or service, such a link is not clear-cut for social indicators such as a hunger or food inequality (mentioned below). These intrinsically complex issues require exploration of potential indicators that could be coupled with the global database for undertaking a supply-chain assessment.
Thinking along the lines of the income equality (Alsamawi et al., 2014b), a term used to describe inequality in accessible food is called “food inequity.” It essentially means that wealthy people are eating better than ever whilst the poor are eating worse. Whilst inequity in the availability of food is primarily an issue in low- and middle-income countries, certain income groups in developed nations such as Australia face this issue as well (Australian Institute of Family Studies, 2011). The statistics on global food inequity are alarming. The Global Food security index provides information on countries that are most and least vulnerable to food insecurity. The data-set is for 113 countries, developed using a unique set of 28 qualitative and quantitative indicators (Economist Intelligence Unit, 2017). An investigation of the role of international trade as an accelerator or retardant of food inequity could yield useful insights.
At the other end of the malnourishment spectrum lies obesity. This condition, which increasingly occurs across the socioeconomic spectrum, has almost tripled in incidence since 1975 and is now considered a global epidemic (World Health Organisation, 2003, 2017a). Undernutrition and obesity may co-exist not just in the same country, region or community, but also within the same household (World Health Organisation, 2018). Recent research indicates that there may be a causal relationship between opening up trade and increasing likelihood of obesity, via increasing imports of unhealthy foods (McNamara, 2015; Barlow et al., 2017; Guintella et al., 2017; Mendez Lopez et al., 2017). Whilst IOA cannot directly work with obesity rates (since these are a characteristic of a population and not of an industrial supply-chain system), it can utilize proxy indicators of obesity, such as amounts of sugar and fat embodied in diets. Thus, combining obesity rates from the WHO Global Health Observatory Data (World Health Organisation, 2017b) with results from a trade-linked global model could reveal a potential role of globalization in the obesity problem.
Conclusions
This paper highlights the value of IOA in not only providing data to monitor against existing indicators but in developing new and more comprehensive indicators through its ability to consider whole food systems and consideration of regional and cultural circumstances. Using examples, we have illustrated the power of IOA in providing policy makers with information regarding the global impacts of policies to promote healthy and sustainable systems, so that they can mitigate these impacts through complementary policy intervention.
Data Availability Statement
The data used in this study was taken from publicly available data sets, which are summarized in this paper.
Author Contributions
All authors listed have made a substantial, direct and intellectual contribution to the work, and approved it for publication.
Funding
This work was financially supported by the Australian Research Council (ARC) through its Projects DP0985522, DP130101293, DP190102277, and LE160100066 and the National eResearch Collaboration Tools and Resources project (NeCTAR) through its Industrial Ecology Virtual Laboratory infrastructure VL 201, as well as by the Sydney Food and Nutrition Network at the University of Sydney.
Conflict of Interest
The authors declare that the research was conducted in the absence of any commercial or financial relationships that could be construed as a potential conflict of interest.
Acknowledgments
We would like to thank Sebastian Juraszek for expertly managing the Global IELab's advanced computation requirements, and Charlotte Jarabak for help with collecting data.
References
Alsamawi, A., Murray, J., and Lenzen, M. (2014a). The employment footprints of nations: uncovering master-servant relationships. J. Industr. Ecol. 18, 59–70. doi: 10.1111/jiec.12104
Alsamawi, A., Murray, J., and Lenzen, M. (2017). Trade in occupational safety and health: tracing the embodied human and economic harm in labour along the global supply chain. J. Clean. Prod. 147, 187–196. doi: 10.1016/j.jclepro.2016.12.110
Alsamawi, A., Murray, J., Lenzen, M., Kanemoto, K., and Moran, D. (2014b). A novel approach to quantitative accounting of income inequality. PLoS ONE 9:e110881. doi: 10.1371/journal.pone.0110881
Ash, J., and Newth, D. (2007). Optimising networks for resilience against cascading failure. Phys. Statist. Mech. Appl. 380, 673–683. doi: 10.1016/j.physa.2006.12.058
Australian Bureau of Statistics (2016a). Australian System of National Accounts: Concepts, Sources and Methods, 2015. ABS Catalogue No. 5216.0. Available online at: http://www.abs.gov.au/AUSSTATS/abs@.nsf/DetailsPage/5216.02013?OpenDocument
Australian Bureau of Statistics (2016b). Australian National Accounts: Input-Output Tables, 2013-14. ABS Catalogue No. 5209.0. Australian Bureau of Statistics. Available online at: https://www.abs.gov.au/AUSSTATS/abs@.nsf/Lookup/5209.0.55.001Main+Features12013-14?OpenDocument (accessed July 19, 2018)
Australian Institute of Family Studies (2011). Food insecurity in Australia: What Is It, Who Experiences It and How Can Child and Family Services Support Families Experiencing It? Food Insecurity in Australia: What Is It, Who Experiences It and How Can Child and Family Services Support Families Experiencing It? Australian Institute of Family Studies. Available online at: https://aifs.gov.au/cfca/publications/food-insecurity-australia-what-it-who-experiences-it-and-how-can-child
Barlow, P., McKee, M., Basu, S., and Stuckler, D. (2017). The health impact of trade and investment agreements: a quantitative systematic review and network co-citation analysis. Global. Health. 13:13. doi: 10.1186/s12992-017-0240-x
Bartelmus, P., Stahmer, C., and van Tongeren, J. (1991). Integrated environmental and economic accounting: framework for a SNA satellite system. Rev. Income Wealth. 37, 111–148. doi: 10.1111/j.1475-4991.1991.tb00350.x
Behrens, P., Kiefte-de Jong, J. C., Bosker, T., Rodrigues, J. F. D., de Koning, A., and Tukker, A. (2017). Evaluating the environmental impacts of dietary recommendations. Proc. Natl. Acad. Sci. U.S.A. 114, 13412–13417. doi: 10.1073/pnas.1711889114
Berry, E. M., Dernini, S., Burlingame, B., Meybeck, A., and Conforti, P. (2015). Food security and sustainability: can one exist without the other? Public Health Nutr. 18, 2293–2302. doi: 10.1017/S136898001500021X
Bíró, A. (2015). Did the junk food tax make the Hungarians eat healthier? Food Policy. 54, 107–115. doi: 10.1016/j.foodpol.2015.05.003
Bonnet, C., and Réquillart, V. (2013). Tax incidence with strategic firms in the soft drink market. J. Public Econ. 106, 77–88. doi: 10.1016/j.jpubeco.2013.06.010
Burch, D., and Pritchard, B. (1996). The Uneasy Transition to Globalization: Restructuring of the Australian Tomato Processing Industry. Aldershot: Ashgate Publishing Limited.
Candy, S., Biggs, C., Larsen, K., and Turner, G. (2015). Modelling food system resilience: a scenario-based simulation modelling approach to explore future shocks and adaptations in the Australian food system. J. Environ. Studies Sci. 5, 712–731. doi: 10.1007/s13412-015-0338-5
Capon, A., and Dannenberg, A. (2016). “Healthy communities,” in Environmental Health: From Global to Local, ed H. Frumkin (San Francisco: Jossey Bass), 377–413.
Chaudhary, A., Gustafson, D., and Mathys, A. (2018). Multi-indicator sustainablity assessment of global food systems. Nat. Commun. 9:848. doi: 10.1038/s41467-018-03308-7
Chen, Z., Rose, A. Z., Prager, F., and Chatterjee, S. (2017). Economic consequences of aviation system disruptions: a reduced-form computable general equilibrium analysis. Transp. Res. Part A Policy Practice. 95, 207–226. doi: 10.1016/j.tra.2016.09.027
Clancy, K. (2017). Transdisciplinary and systems approaches to food security. J. Agricul. Food Systems Comm. Dev. 7, 13–16. doi: 10.5304/jafscd.2017.074.012
Cox, A., Prager, F., and Rose, A. (2011). Transportation security and the role of resilience: a foundation for operational metrics. Trans. Policy. 18, 307–317. doi: 10.1016/j.tranpol.2010.09.004
de Bruyn, J., Ferguson, E., Allmann-Farinelli, M., Darnton-Hill, I., Maulaga, W., Msuya, J., et al. (2016). Food Composition Tables in resource-poor settings: exploring current limitations and opportunities, with a focus on animal-source foods in sub-Saharan Africa. Br. J. Nutr. 16, 1709–1719. doi: 10.1017/S0007114516003706
Economist Intelligence Unit (2017). The Global Food Security Index. Economist Intelligence Unit. Available online at: https://foodsecurityindex.eiu.com (accessed 18 July, 2018)
Edjabou, L. D., and Smed, S. (2013). The effect of using consumption taxes on foods to promote climate friendly diets – The case of Denmark. Food Policy. 39, 84–96. doi: 10.1016/j.foodpol.2012.12.004
Eurostat (2016). ESVG Aufkommens-, Verwendungs- und Input-Output Tabellen. Available online at: http://ec.europa.eu/eurostat/de/web/esa-supply-use-input-tables/data/workbooks
Finley, J., Dimick, D., Marshall, E., Nelson, G., Mein, J., and Gustafson, D. (2017). Nutritional sustainability: aligning priorities in nutrition and public health with agricultural production. Adv. Nutr. 8, 780–788. doi: 10.3945/an.116.013995
Food and Agriculture Organisation (1996). Rome Declaration on World Food Security and World Food Summit Plan of Action. World Food Summit 13-17 November 1996. Rome. Food and Agriculture Organisation. Available online at: http://www.fao.org/docrep/003/w3613e/w3613e00.HTM
Food and Agriculture Organisation (2009). Draft Declaration of the World Summit on Food Security. Food and Agriculture Organisation. Available online at: http://www.fao.org/fileadmin/templates/wsfs/Summit/Docs/Declaration/WSFS09_Draft_Declaration.pdf
Food and Agriculture Organisation (2013). Resilient Livelihoods – Disaster Risk Reduction for Food and Nutrition Security. Food and Agriculture Organisation. Available online at: http://www.fao.org/3/a-i3270e.pdf
Food and Agriculture Organisation (2017). Trade and Food Security: The Importance of Agriculture and Agricultural Trade in Developing Countries. Available online at: http://www.fao.org/docrep/006/j0083e/j0083e04.htm (accessed July 23, 2018)
Food and Agriculture Organisation (2018). Sustainable Food Systems: Concept and Framework. Food and Agriculture Organisation. Available online at: http://www.fao.org/3/ca2079en/CA2079EN.pdf
Food and Agriculture Organisation, Bioversity International (2010). Sustainable Diets and Biodiversity: Directions and Solutions for Policy, Research and Action. Food and Agriculture Organisation and Bioversity International. Available online at: http://www.fao.org/docrep/016/i3004e/i3004e00.htm
Francis, C. A., Lieblein, T. A., Breland, L., Salomonsson, U., Sriskandarajah, G. N., and Langer, V. (2008). Transdisciplinary research for a sustainable agricultre and food sector. Agron. J. 100, 771–776. doi: 10.2134/agronj2007.0073
Friel, S., Dangour, A. D., Garnett, T., Lock, K., Chalabi, Z., Roberts, A., et al. (2009). Public heatlh benefits of strategies to reduce greenhouse-gas emissions: food and agriculture. Lancet. 374, 2016–2025. doi: 10.1016/S0140-6736(09)61753-0
Gill, T. (2006). Epidemiology and health impact of obesity: an Asia Pacific perspective. Asia Pac. J. Clin. Nutr. 15, 3–14. Available online at: https://www.cpc.unc.edu/projects/china/publications/1263
Gómez-Paredes, J., Alsamawi, A., Yamasue, E., Okumura, H., Ishihara, K. N., Geschke, A., et al. (2016). Consuming childhoods: an assessment of child labor's role in indian production and global consumption. J. Industr. Ecol. 20, 611–622. doi: 10.1111/jiec.12464
Guerrero-López, C., Molina, M., and Colchero, M. (2017). Employment changes associated with the introduction of taxes on sugar-sweetened beverages and nonessential energy-dense food in Mexico. Prev. Med. 105, S43–S49. doi: 10.1016/j.ypmed.2017.09.001
Guintella, O., Rieger, M., and Rotunno, L. (2017). Weight Gains From Trade in Foods: Evidence from Mexico. Available online at: https://voxeu.org/article/weight-gains-trade-foods-evidence-mexico.
Hagenaars, L. L., Jeurissen, P. P. T., and Klazinga, N. S. (2017). The taxation of unhealthy energy-dense foods (EDFs) and sugar-sweetened beverages (SSBs): an overview of patterns observed in the policy content and policy context of 13 case studies. Health Policy. 121, 887–894. doi: 10.1016/j.healthpol.2017.06.011
Harding, M., and Lovenheim, M. (2017). The effect of prices on nutrition: comparing the impact of product- and nutrient-specific taxes. J. Health Econ. 53, 53–71. doi: 10.1016/j.jhealeco.2017.02.003
Härkänen, T., Kotakorpi, K., Pietinen, P., Pirttil,ä, J., Reinivuo, H., and Suoniemi, I. (2014). The welfare effects of health-based food tax policy. Food Policy. 49, 196–206. doi: 10.1016/j.foodpol.2014.07.001
Hirst, E. (1974). Food-Related Energy Requirements. Science. 184, 134–138. doi: 10.1126/science.184.4133.134
Holloway, L., Kneafsey, M., Venn, L., Cox, R., Dowler, E., and Tuomainen, H. (2007). Possible food economies: a methodological framework for exploring food production–consumption relationships. Sociol. Ruralis. 47, 1–19. doi: 10.1111/j.1467-9523.2007.00427.x
Institute of Developing Economies-Japan External Trade Organisation (2015). Asian International Input-Output Table. Available online at: http://www.ide.go.jp/Japanese/Publish/Books/Tokei/pdf/2005ASIA%20TechnicalNotes.pdf
International Food Policy Research Institute (2015). Social Accounting Matrices and Multiplier Analysis. Available online at: http://www.ifpri.org/publication/social-accounting-matrices-and-multiplier-analysis
International Food Policy Research Institute (2017). 2017 Global Hunger Index Data. International Food Policy Research Institute. Available online at: http://www.ifpri.org/publication/2017-global-hunger-index-data (accessed July 18, 2018)
James, D. E., and Musgrove, K. J. (1986). Integration of an economic input-output model and a linear programming technological model for energy systems analysis. Energy Economics. 99–112. doi: 10.1016/0140-9883(86)90034-4
James, S., and Friel, S. (2015). An integrated approach to identifying and characterising reslient urban food systems to promote population health in a changing climate. Public Health Nutr. 18, 2498–2508. doi: 10.1017/S1368980015000610
Kanemoto, K., Moran, D., Lenzen, M., and Geschke, A. (2014). International trade undermines national emission reduction targets: new evidence from air pollution. Global Environ. Change. 24, 52–59. doi: 10.1016/j.gloenvcha.2013.09.008
Kneafsey, M., Cox, R., Holloway, L., Dowler, E., Venn, L., and Tuomainen, H. (2008). Reconnecting Consumers, Producers and Food: Exploring Alternatives. Oxford: Berg Publishers. doi: 10.5040/9781350047631
Koch, A., McBratney, A., Adams, M., Field, D., Hill, R., Crawford, J., et al. (2013). Soil security: solving the global soil crisis. Global Policy. 4, 434–441. doi: 10.1111/1758-5899.12096
Kondo, Y., and Nakamura, S. (2005). Waste Input-Output Linear Programming model with its application to eco-efficiency analysis. Econ. Syst. Res. 17, 393–408. doi: 10.1080/09535310500283526
Kramer, K. J., Moll, H. C., Nonhebel, S., and Wilting, H. C. (1999). Greenhouse gas emissions related to Dutch food consumption. Energy Policy. 27, 203–216. doi: 10.1016/S0301-4215(99)00014-2
Kytzia, S., Faist, M., and Baccini, P. (2004). Economically extended—MFA: a material flow approach for a better understanding of food production chain. J. Clean. Prod. 12, 877–889. doi: 10.1016/j.jclepro.2004.02.004
Lal, R., Blum, W. E., Valentin, C., and Stewart, B. A. (1997). Methods for Assessment of Soil Degradation. Boca Raton, FL: CRC Press.
Lan, J., Malik, A., Lenzen, M., McBain, D., and Kanemoto, K. (2016). A structural decomposition analysis of global energy footprints. Appl. Energy. 163, 436–451. doi: 10.1016/j.apenergy.2015.10.178
Lenzen, M., Geschke, A., Abd Rahman, M. D., Xiao, Y., Fry, J., Reyes, R., et al. (2017). The Global MRIO Lab - charting the world economy. Economic Syst. Res. 29, 158–186. doi: 10.1080/09535314.2017.1301887
Lenzen, M., Moran, D., Bhaduri, A., Kanemoto, K., Bekchanov, M., Geschke, A., et al. (2013). International trade of scarce water. Ecol. Econ. 94, 78–85. doi: 10.1016/j.ecolecon.2013.06.018
Lenzen, M., Moran, D., Kanemoto, K., Foran, B., Lobefaro, L., and Geschke, A. (2012). International trade drives biodiversity threats in developing nations. Nature. 486, 109–112. doi: 10.1038/nature11145
Lenzen, M., Murray, S. A., Korte, B., and Dey, C. J. (2003). Environmental impact assessment including indirect effects - a case study using input-output analysis. Environ. Impact Assess. Rev 23, 263–282. doi: 10.1016/S0195-9255(02)00104-X
Lenzen, M., and Peters, G. (2010). How city dwellers affect their resource hinterland – a spatial impact study of Australian households. J. Industrial Ecol. 14, 73–90. doi: 10.1111/j.1530-9290.2009.00190.x
Leontief, W. (1936). Quantitative input and output relations in the economic system of the United States. Rev. Econ. Stat. 18, 105–125. doi: 10.2307/1927837
Leontief, W., and Ford, D. (1970). Environmental repercussions and the economic structure: an input-output approach. Rev. Econ. Stat. 52, 262–271. doi: 10.2307/1926294
Lin, C. (2011). Identifying lowest-emission choices and environmental Pareto frontiers for wastewater treatment: wastewater treatment input-output model based linear programming. J. Industr. Ecol. 15, 367–380. doi: 10.1111/j.1530-9290.2011.00339.x
MacMahon, A., Smith, K., and Lawrence, G. (2015). Connecting resilience, food security and climate change: lessons from flooding in Queensland, Australia. J. Environ. Studies Sci. 5, 378–391. doi: 10.1007/s13412-015-0278-0
Malik, A., Lan, J., and Lenzen, M. (2016). Trends in global greenhouse gas emissions from 1990 to 2010. Environ. Sci. Technol. 50, 4722–4730. doi: 10.1021/acs.est.5b06162
Maye, D., Holloway, L., and Kneafsey, M. (2007). Alternative Food Geographies. Bingley: Emerald Group Publishing Limited.
McBratney, A. B., Morgan, C. L., and Jarrett, L. E. (2017a). The Value of Soil's Contributions to Ecosystem Services Global Soil Security. Geneva: Springer. 227–235. doi: 10.1007/978-3-319-43394-3_20
McBratney, A. B., Santos, M. M., and Minasny, B. (2003). On digital soil mapping. Geoderma 117, 3–52. doi: 10.1016/S0016-7061(03)00223-4
McBratney, A. B., Field, D. J., Morgan, C. L., and Jarrett, L. E. (2017b). Soil Security: A Rationale Global Soil Security. Geneva: Springer. p. 3-14. doi: 10.1007/978-3-319-43394-3_1
McNamara, C. (2015). Trade liberalization, social policies and health: an empirical case study. Global. Health 11, 1–10. doi: 10.1186/s12992-015-0126-8
Mendez Lopez, A., Loopstra, R., McKee, M., and Stuckler, D. (2017). Is trade liberalisation a vector for the spread of sugar-sweetened beverages? A cross-national longitudinal analysis of 44 low- and middle-income countries. Soc. Sci. Med. 172, 21–27. doi: 10.1016/j.socscimed.2016.11.001
Mendez, V. E., Bacon, C. M., and Cohen, R. (2013). Agroecology as a transdisciplinary, participatory and action-oriented approach. Agroecol. Sust. Food Syst. 37, 3–18. doi: 10.1080/10440046.2012.736926
Moran, D. D., Lenzen, M., Kanemoto, K., and Geschke, A. (2013). Does ecologically unequal exchange occur? Ecol. Econ. 89, 177–186. doi: 10.1016/j.ecolecon.2013.02.013
Muller, F. (1973). An operational mathematical programming model for the planning of economic activities in relation to the environment. Socio-Econ. Planning Sci. 7, 123–138. doi: 10.1016/0038-0121(73)90051-7
NeCTAR (2013). The Industrial Ecology Virtual Laboratory. Available online at: https://nectar.org.au/?portfolio=industrial-ecology
Nomaguchi, T., Cunich, M., Zapata-Diomedi, B., and Veerman, J. L. (2017). The impact on productivity of a hypothetical tax on sugar-sweetened beverages. Health Policy. 121, 715–725. doi: 10.1016/j.healthpol.2017.04.001
Oita, A., Malik, A., Kanemoto, K., Geschke, A., Nishijima, S., and Lenzen, M. (2016). Substantial nitrogen pollution embedded in international trade. Nat. Geosci. 9, 111–115. doi: 10.1038/ngeo2635
Organisation for Economic Co-operation Development (2015). OECD Inter-Country Input-Output (ICIO) Tables. Available online at: http://www.oecd.org/trade/input-outputtables.htm
Piesse, J., and Thirtle, C. (2009). Three bubbles and a panic: An explanatory review of recent food price commodity events. Food Policy. 34, 119–129. doi: 10.1016/j.foodpol.2009.01.001
Powell, L., Wada, R., Persky, J., and Chaloupka, F. (2014). Employment impact of sugar-sweetened beverage taxes. Am. J. Public Health 2014. 104, 672–677. doi: 10.2105/AJPH.2013.301630
Pritchard, B. (2012). Trading Into Hunger? Trading Out of Hunger? International Food Trade and the Debate on Food Security. Food System Failure: The Global Food Crisis and the Future of Agriculture. London: Earthscan.
Ridoutt, B., Hendrie, G., and Noakes, M. (2017). Dietary strategies to reduce environmental impact: a critical review of the evidence base. Adv. Nutr. 8, 933–946. doi: 10.3945/an.117.016691
Rose, A. (2007). Economic resilience to natural and man-made disasters: Multidisciplinary origins and contextual dimensions. Environmental Hazards. 7, 383–398. doi: 10.1016/j.envhaz.2007.10.001
Rose, A. (2011). Resilience and sustainability in the face of disasters. Environ. Innovat. Soc. Trans. 1, 96–100. doi: 10.1016/j.eist.2011.04.003
Rose, A. (2017). Defining and Measuring Economic Resilience From a Societal, Environmental and Security Perspective. Singapore: Springer. doi: 10.1007/978-981-10-1533-5
Rose, A., and Krausmann, E. (2013). An economic framework for the development of a resilience index for business recovery. Int. J. Disaster Risk Reduct. 5, 73–83. doi: 10.1016/j.ijdrr.2013.08.003
Rose, A., and Miernyk, W. (1989). Input-output analysis: the first fifty years. Econ. Syst. Res. 1, 229–271. doi: 10.1080/09535318900000016
SourceOECD (2009). ITCS International Trade by Commodities Statistics. Available online at: https://www.oecd-ilibrary.org/trade/international-trade-by-commodity-statistics_22195076
Stockholm Reslience Centre (2018). The Nine Planetary Boundaries. Available online at: http://www.stockholmresilience.org/research/planetary-boundaries/planetary-boundaries/about-the-research/the-nine-planetary-boundaries.html
Suh, S. (2009). Handbook of Input-Output Economics in Industrial Ecology, 1st ed. Netherlands: Springer. doi: 10.1007/978-1-4020-5737-3
Suh, S., and Nakamura, S. (2007). Five years in the area of input-output and Hybrid, LCA. Int. J. Life Cycle Assess. 12, 351–352. doi: 10.1065/lca2007.08.358
Tamiz, M., Jones, D., and Romero, C. (1998). Goal programming for decision making: an overview of the current state-of-the-art. Eur. J. Oper. Res. 111, 569–581. doi: 10.1016/S0377-2217(97)00317-2
Tendall, D. M., Joerin, J., Kopainsky, B., Edwards, P., Shreck, A., Le, Q. B., et al. (2015). Food system resilience: defining the concept. Global Food Secur. 6, 17–23. doi: 10.1016/j.gfs.2015.08.001
The Lancet Diabetes and Endocrinology (2017). Sweet success: will sugar taxes improve health? Lancet Diabetes Endocrinol. 5:235. doi: 10.1016/S2213-8587(17)30070-0
The Lancet Public Health (2017). Obesity: the sweet revenge of tax. The Lancet Public Health. 2:e1. doi: 10.1016/S2468-2667(16)30041-X
Thow, A. M., Downs, S. M., Mayes, C., Trevena, H., and Waqanivalu, T., and J. (2018). Fiscal policy to improve diets and prevent noncommunicable diseases: from recommendations to action. Bull. World Health Organ. 96, 201–210. doi: 10.2471/BLT.17.195982
Timmer, M. P., Erumban, A. A., Los, B., Stehrer, R., and de Vries, G. J. (2014). Slicing up global value chains. J. Econ. Persp. 28, 99–118. doi: 10.1257/jep.28.2.99
Tukker, A., and Dietzenbacher, E. (2013). Global multiregional input-output frameworks: an introduction and outlook. Econ. Syst. Res. 25, 1–19. doi: 10.1080/09535314.2012.761179
Tuomisto, H. L. (2019). The complexity of sustainable diets. Nat. Ecol. Evol. 3, 720–721. doi: 10.1038/s41559-019-0875-5
United Nations (1999). Handbook of Input-Output Table Compilation and Analysis. United Nations, editor. New York, NY: United Nations.
United Nations (2009). European Commission, International Monetary Fund, Organisation for Economic Co-operation and Development, World Bank. System of National Accounts 2008. Available online at: https://unstats.un.org/unsd/nationalaccount/sna2008.asp
United Nations (2015). Transforming Our World: The 2030 Agenda For Sustainable Development, A/RES/70/1. United Nations. Available online at: https://sustainabledevelopment.un.org/content/documents/21252030%20Agenda%20for%20Sustainable%20Development%20web.pdf
United Nations Development Programme (2018). Sustainable Development Goals. Available online at: http://www.undp.org/content/undp/en/home/sustainable-development-goals.html (accessed July 17, 2018)
United Nations Environment Programme (2016). Food Systems and Natural Resources. A Report of the Working Group on Food Systems of the International Resource Panel. United Nations Environment Programme. Available online at: http://www.resourcepanel.org/reports/food-systems-and-natural-resources
United Nations Industrial Development Organisation (2016). Industrial Statistics Database at the 4-Digit Level of ISIC (INDSTAT4). Available online at: http://www.unido.org/resources/statistics/statistical-databases.html
United Nations Standing Committee on Nutrition (2017). Sustainable Diets for Healthy People and a Healthy Planet. Available online at: https://www.unscn.org/en/unscn-publications?idnews=1739
United Nations Statistics Division (2016a). Industrial Commodity Production Statistics Database. Available online at: https://unstats.un.org/unsd/industry/Commodity/
United Nations Statistics Division (2016b). National Accounts Official Data. Available online at: http://data.un.org/Browse.aspx?d=SNA
United Nations Statistics Division (2016c). UN comtrade - United Nations Commodity Trade Statistics Database. Available online at: http://comtrade.un.org/
United Nations Statistics Division (2016d). UN Service Trade Database. Available online at: http://unstats.un.org/unsd/servicetrade/
United Nations Statistics Division (2017a). National Accounts Main Aggregates Database. Available online at: http://unstats.un.org/unsd/snaama/Introduction.asp
United Nations Statistics Division (2017b). System of Environmental- Economic Accounting— SEEA Revision. Available online at: https://unstats.un.org/unsd/envaccounting/seearev/
Venn, L., Kneafsey, M., Holloway, L., Cox, R., Dowler, E., and Tuomainen, H. (2006). Researching European ‘alternative’food networks: some methodological considerations. Area. 38, 248–258. doi: 10.1111/j.1475-4762.2006.00694.x
Wheeler, T., and von Braun, J. (2013). Climate change impacts on global food security. Science 341, 508–513. doi: 10.1126/science.1239402
Wiedmann, T. (2009). Carbon footprint and input-output analysis: an introduction. Econ. Syst. Res. 21, 175–186. doi: 10.1080/09535310903541256
Wiedmann, T., and Lenzen, M. (2018). Environmental and social footprints of international trade. Nat. Geosci. 11, 314–321. doi: 10.1038/s41561-018-0113-9
Wiedmann, T. O., Schandl, H., Lenzen, M., Moran, D., Suh, S., West, J., et al. (2015). The material footprint of nations. Proc. Natl. Acad. Sci. U.S.A. 112, 6271–6276. doi: 10.1073/pnas.1220362110
Willett, W., Rockström, J., Loken, B., Springmann, M., Lang, T., Vermeulen, S., et al. (2019). Food in the Anthropocene: the EAT–Lancet Commission on healthy diets from sustainable food systems. Lancet. 393, 447–492. doi: 10.1016/S0140-6736(18)31788-4
Wood, R., Lenzen, M., Dey, C., and Lundie, S. (2006). A comparative study of some environmental impacts of conventional and organic farming in Australia. Agric. Syst. 89, 324–348. doi: 10.1016/j.agsy.2005.09.007
World Bank (2017). Global Consumption Database. Available online at: http://datatopics.worldbank.org/consumption/
World Cancer Research Fund (2018). WCRF International Food Policy Framework for Healthy Diets: NOURISHING. Available online at: https://www.wcrf.org/int/policy/nourishing/our-policy-framework-promote-healthy-diets-reduce-obesity (accessed July 17, 2018)
World Health Organisation (2003). Controlling the Obesity Epidemic. Available online at: http://www.who.int/nutrition/topics/obesity/en/ (accessed July 18, 2018)
World Health Organisation (2017a). Global Health Observatory Data. Available online at: http://www.who.int/gho/ncd/risk_factors/overweight/en/ (accessed July 17, 2018)
World Health Organisation (2017b). Overweight and Obesity. Available online at: http://www.who.int/en/news-room/fact-sheets/detail/obesity-and-overweight (accessed July, 17 2018)
World Health Organisation (2018). Obesity. Available online at: http://www.afro.who.int/health-topics/obesity (accessed July 17, 2018)
World Wildlife Federation (2013). A balance of healthy and sustainble food choices for France, Spain and Sweden. Available online at: https://livewellforlife.eu/wp-content/uploads/2013/02/A-balance-of-healthy-and-sustainable-food-choices.pdf
Xiao, Y., Benoît-Norris, C., Lenzen, M., Norris, G., and Murray, J. (2017a). How social footprints of nations can assist in achieving the sustainable development goals. Ecol. Econ. 135, 55–65. doi: 10.1016/j.ecolecon.2016.12.003
Keywords: sustainability, food systems, diet, indicator, measurement, nutrition security
Citation: Boylan SM, Thow A-M, Tyedmers EK, Malik A, Salem J, Alders R, Raubenheimer D and Lenzen M (2020) Using Input-Output Analysis to Measure Healthy, Sustainable Food Systems. Front. Sustain. Food Syst. 4:93. doi: 10.3389/fsufs.2020.00093
Received: 09 July 2019; Accepted: 22 May 2020;
Published: 26 June 2020.
Edited by:
Selena Ahmed, Montana State University, United StatesReviewed by:
Aida Turrini, Consiglio per la Ricerca in Agricoltura e L'analisi Dell'Economia Agraria (CREA), ItalyJanet Louise Weber, Massey University, New Zealand
Copyright © 2020 Boylan, Thow, Tyedmers, Malik, Salem, Alders, Raubenheimer and Lenzen. This is an open-access article distributed under the terms of the Creative Commons Attribution License (CC BY). The use, distribution or reproduction in other forums is permitted, provided the original author(s) and the copyright owner(s) are credited and that the original publication in this journal is cited, in accordance with accepted academic practice. No use, distribution or reproduction is permitted which does not comply with these terms.
*Correspondence: Sinead M. Boylan, sinead.boylan@sydney.edu.au