Rare Earth Element Behavior in a Sandy Subterranean Estuary of the Southern North Sea
 Ronja Paffrath1*
  Katharina Pahnke1
  Melanie K. Behrens1 Anja Reckhardt2
  Claudia Ehlert1 Bernhard Schnetger2
  Hans-Jürgen Brumsack2
- 1Marine Isotope Geochemistry, Institute for Chemistry and Biology of the Marine Environment (ICBM), University of Oldenburg, Oldenburg, Germany
- 2Microbiogeochemistry, Institute for Chemistry and Biology of the Marine Environment (ICBM), University of Oldenburg, Oldenburg, Germany
The use of rare earth elements (REEs) as tracers for oceanic processes requires knowledge and quantification of their sources and sinks. Submarine groundwater discharge (SGD) has been suggested to be a potentially important source of REEs and other trace elements to the ocean. To investigate the processes affecting REEs in a subterranean estuary (STE) of a sandy beach system and their contribution to coastal waters of the southern North Sea, we analyzed dissolved REE concentrations in beach pore waters, coastal seawater and fresh groundwater on the barrier island Spiekeroog, German North Sea. The pore waters show variable REE concentrations (Neodymium between 6 and 54 pmol/kg), generally increasing from the upper beach to the shoreline. At the upper beach, mixing of coastal pore water with rainwater and scavenging lead to lower REE concentrations than in coastal seawater and high heavy (HREE) over light (LREE) REE ratios. Close to the low water line, the REE concentrations increase, partly exceeding seawater concentrations and showing a positive deviation from conservative mixing, with shale-normalized light and middle REE-enriched patterns. This is due to the release of light and middle REEs from degrading particulate organic material and potentially dissolution of Fe/Mn-oxides under reducing conditions. Reducing conditions are further supported by the change from a negative Ce-anomaly at the upper beach to no anomaly close to the low water line. Net SGD fluxes of both fresh groundwater and recirculated seawater are a source of light, middle and heavy REEs to the ocean, with a higher contribution of LREEs than HREEs compared to seawater. However, the total amount of REEs added to the North Sea by SGD from the East Frisian Islands is still ~500 times smaller than input from nearby rivers. An anthropogenic Gd signal higher than previously reported is present throughout the pore waters and seawater, indicating increasing accumulation of anthropogenic Gd in the coastal marine environment.
Introduction
Rare earth elements (REEs) are widely used as tracers for oceanic processes like scavenging, redox changes, and provenance of particles or water. The REEs comprise the elements from lanthanum (La) to lutetium (Lu) that all exist in a trivalent oxidation state except for cerium (Ce) and europium (Eu) that can additionally be oxidized (CeIV) or reduced (EuII), respectively (Elderfield and Greaves, 1982). The REEs show similar chemical behavior with small differences due to the consecutive filling of the 4f electron shell with increasing atomic number that leads to a decrease in their ionic radii (e.g., Elderfield, 1988). In seawater, REEs are stabilized by carbonate complexes, with increasing stability of the complexes with increasing atomic number. This results in a decrease in particle reactivity from the light (LREEs) to the heavy REEs (HREEs) (Sholkovitz et al., 1994). The REE concentrations are usually shown in the sequence of increasing atomic number normalized either to a rock reference material (e.g., Post Archean Australian Shale (PAAS), Rudnick and Gao, 2003) or to a reference water mass. The shape of the resulting REE patterns can give insight into the scavenging intensity (high HREE/LREE = strong scavenging) or REE input from e.g., particle (coatings) or lithogenic sources (lower HREE/LREE). Furthermore, anomalies of single elements in comparison to their neighbor elements (all normalized to shale) point to oxic/sub- or anoxic conditions (negative/positive Ce-anomaly), basaltic influence (positive Eu-anomaly) or anthropogenic contamination (highly positive Gd-anomaly).
In order to use the REEs to study biogeochemical processes in the ocean, it is important to understand their input and removal pathways and quantify the respective rates. In the past, rivers were thought to be the main source of REEs to the ocean (Goldstein and Jacobsen, 1988), but based on mass balance calculations for neodymium (Nd), it was found that river input alone cannot account for the observed Nd concentrations and Nd isotope distributions in the ocean (Lacan and Jeandel, 2005). Subsequent studies (e.g., Tachikawa et al., 2003; Johannesson and Burdige, 2007) have suggested submarine groundwater discharge (SGD) as an additional potentially important source of REEs and other trace elements (Windom et al., 2006), nutrients (Anschutz et al., 2009), and contaminants (Bone et al., 2007; Trezzi et al., 2016) to the ocean. Submarine groundwater discharge is defined as the water that is flowing from the seabed on the margins to the overlying water column, including both fresh terrestrial derived groundwater and infiltrated seawater (Burnett et al., 2003). The term SGD is used independent of the mechanisms driving the water discharge like hydraulic gradients, tidal pumping, or current-induced pressure gradients (Burnett et al., 2003). Recent studies have demonstrated the potential of SGD in adding REEs to the ocean in quantities that are similar to or exceed those of either regional river input (e.g., Johannesson and Burdige, 2007; Johannesson et al., 2011; Kim and Kim, 2011; Chevis et al., 2015a), or sediment diffusive fluxes or atmospheric dust input (e.g., Kim and Kim, 2014), depending on the characteristics of the studied region. Particularly, it was suggested that SGD is a source of LREEs and middle REEs (MREEs), but a sink for HREEs (Johannesson et al., 2011; Chevis et al., 2015b). The observed high REE concentrations of SGD are suggested to be linked to the degradation of REE-rich relict terrestrial organic carbon (Duncan and Shaw, 2003) and/or the reduction of Fe-oxides under anoxic conditions in the sediments (Johannesson et al., 2011; Chevis et al., 2015b).
Sandy beach systems, as found on Spiekeroog Island, make up one third of the ice-free coastline worldwide (Luijendijk et al., 2018) and processes in their subterranean estuaries (STEs) may therefore have a major effect on coastal element cycles and global ocean trace element budgets.
It has been shown in many studies that the medical use of gadolinium (Gd) in urban areas results in a positive Gd-anomaly in terrestrial groundwaters (e.g., Knappe et al., 2005; Johannesson et al., 2017), rivers (e.g., Bau and Dulski, 1996; Kulaksiz and Bau, 2011; de Campos and Enzweiler, 2016), and coastal waters (e.g., Kulaksiz and Bau, 2007; Hatje et al., 2016; Pedreira et al., 2018). Due to its paramagnetic properties, Gd has been used in several contrast agents for magnetic resonance imaging (MRI) since the late 1980s (Bau and Dulski, 1996). Since Gd3+ is toxic to the human body due to its ionic radius that is similar to that of Ca2+ ions (Bourne and Trifaró, 1982), the Gd in the contrast agents is present in complexed form, e.g., gadolinium diethylenetriaminepentaacetic acid (Gd-DTPA) (e.g., Hatje et al., 2016). Because of the high solubility of the Gd complexes, they are not removed in waste water treatment plants and are discharged directly or via rivers into coastal seawater. In an experiment to investigate the behavior of Gd-DPTA during bank filtration, the half-life of Gd-DPTA was determined to be more than 100 days (Holzbecher et al., 2005). However, the authors suggested that different biogeochemical conditions in natural waters (e.g., different concentrations of organic matter) potentially influence the degradation of Gd complexes (Holzbecher et al., 2005). In estuaries, up to 15% of Gd-DPTA can dissociate due to the competition of Mg or Ca ions for DTPA (Schijf and Christy, 2018). Yet, because of the many different complexes in use, their stability may differ under natural conditions and little is known about degradation and transformation of the complexes under natural conditions (Birka et al., 2016).
In this study, we present concentrations of dissolved REEs in pore waters, seawater, and fresh groundwater from a beach site on the northern side of Spiekeroog Island, Germany, facing the open North Sea to investigate the behavior of REEs within the STE and their supply to the coastal waters. Moreover, comparison of natural, complexed, and non-complexed Gd in the STE pore waters and coastal seawater, provides age constraints on the pore waters and additional information on the processes in the STE. The studied STE has previously been shown to be a source of Fe, Mn, Mo, and nutrients to the coastal ocean whereas it is a sink for U, Re, and V (Ehlert et al., 2016; Beck et al., 2017; Reckhardt et al., 2017).
Materials and Methods
Study Area and Sampling
The island of Spiekeroog is part of the barrier island chain in the German Wadden Sea about 6.5 km off the German main land (Figure 1). The island is subject to a mesotidal regime with a tidal range of approximately 2.6 to 2.8 m (Flemming and Davis, 1994). A freshwater lens in the western part of the island is formed by infiltrating rainwater (Röper et al., 2012). A clay layer at about 50 m below sea level separates the fresh groundwater from the underlying saline groundwater [OOWV (Oldenburg-OstfriesischerWasserverband), 2009]. Moore (1999) defined a coastal aquifer where fresh groundwater mixes with infiltrated seawater and is discharged to the coastal ocean as an STE, similar to a surface estuary (Pritchard, 1967). There are similar reactions altering the composition of the estuarine waters through interactions with particles in surface estuaries and STEs (Moore, 1999). An STE typically encompasses the following zones: an upper saline plume (USP) in the intertidal area where seawater is infiltrated and recirculated back to the coastal ocean, the classical saltwater wedge (SW, density-driven, deeper recirculation cell than the USP) below the mean low water line (MLWL), and confined between the USP and SW a freshwater discharge tube (FDT) that reaches the sediment surface close to the MLWL (Robinson et al., 2007). The STE on Spiekeroog exhibits the typical zonation of STEs with a USP, FDT, and SW as suggested by a hydrological model (Beck et al., 2017) (Figure 2).
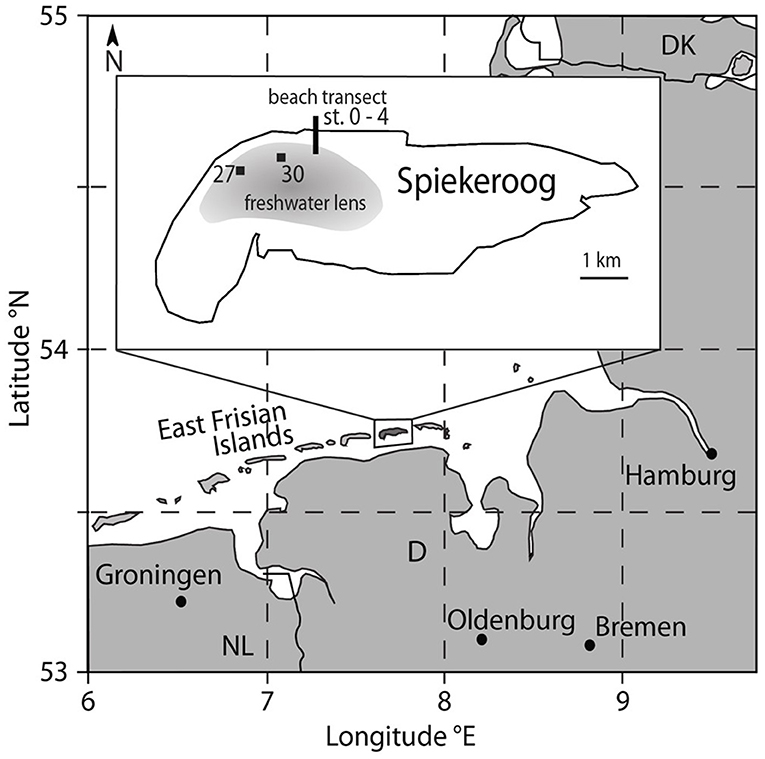
Figure 1. Map of the study area Spiekeroog Island at the German North Sea coast. The beach porewater samples were taken at the north beach (black line, for details see Figure 2), freshwater samples from the freshwater lens of the island were collected from two observation wells (27 and 30) in the dune area (black squares).
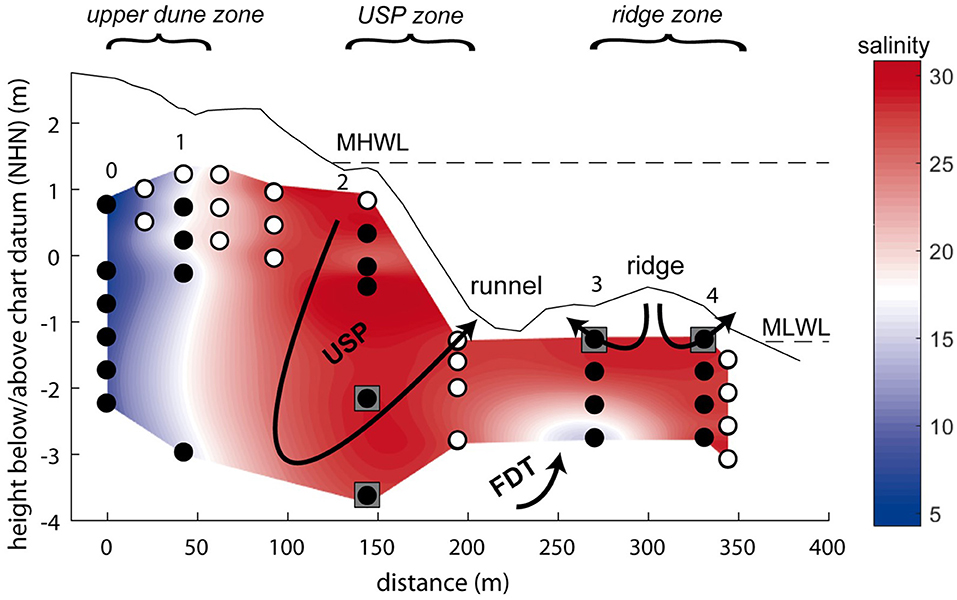
Figure 2. Schematic overview of the subterranean estuary on Spiekeroog with its compartments upper saline plume (USP) and freshwater discharge tube (FDT). Background colors refer to the salinity of the pore waters. Filled circles show sampling depths for REE analyses, open circles indicate additional samples taken for other parameters (salinity, pH, Fe, Mn). Arrows indicate the generalized flow pattern within the STE, gray squares show the representative depths chosen for the flux calculations (representative depths for the FDT in the freshwater lens, not shown). The dashed lines represent the mean low water level (MLWL) and mean high water level (MHWL). Chart datum NHN equals approximately mean sea level. The three areas marked at the top in italics are used in the text for the different compartments of the STE instead of or in addition to the station numbers.
The upper dune area of the sampled transect (Figure 2, stations 0–1) is dominated by low salinities and oxic conditions, indicating recent rain infiltration. In the USP of the intertidal zone (Figure 2, station 2), salinities of 27–31.3 reflect the infiltration of seawater, while a drop to 2 % oxygen saturation below 2 m below sediment surface (mbsf) (Beck et al., 2017) indicates a change in redox conditions in the deeper part of the transect. The residence time of the waters in the USP has been modeled and indicated to be weeks to months depending on the depth (Beck et al., 2017; Waska et al., 2019). A small FDT was sampled at 1.5 and 2 mbsf at station 3, as indicated by low salinity, anoxic conditions (Beck et al., 2017) and high dissolved Si concentrations that are also found in the freshwater lens (Ehlert et al., 2016). Near the MLWL at the stations on the ridge (station 3, ≤ 1 mbsf and station 4), seawater is circulated in two small circulation cells, one discharging toward the runnel that separates stations 2 and 3, and one discharging to the open water (Figure 2). Most recent modeling results, however, suggest that the FDT on Spiekeroog is split, with parts of the FDT and SW located seaward of the ridge (Waska et al., 2019). Residence times of the pore waters covered by our sampling stations are weeks (saltwater) to years (freshwater) (Beck et al., 2017). The beach sediments are mainly composed of quarzitic fine to medium grained sand with layers of shells/shell debris, coarser-grained sand, heavy minerals or organic rich mud (Beck et al., 2017).
Beach pore water samples were collected on the northern open North Sea side of the island along a transect from close to the dunes to the MLWL in May 2014 in the framework of an interdisciplinary study (see Beck et al., 2017) (Figures 1, 2). Pore water samples from the beach transect down to 2 mbsf were taken using stainless steel push point samplers, for details see Reckhardt et al. (2015). Sediment depths exceeding 2 mbsf were sampled by elongating a stainless-steel tip stepwise with 90 cm long steel extension rods (outer diameter 15 mm). They were pushed into the sediment by percussion drilling as described in Charette and Allen (2006) and the samples were retrieved through a Teflon tube (inner diameter 5 mm) using a vacuum hand pump and filled into acid-cleaned 500 ml high-density polyethylene (HDPE) bottles. Seawater and runnel samples were taken at ~0.5 m water depth by submerging a 1 L polycarbonate bottle (Nalgene, acid-cleaned). The samples were filtered (AkroPak200 or 500 filter cartridges, pore size 0.8/0.2 μm) into acid-cleaned HDPE bottles in the lab within 8 h after sampling, acidified with ultra-clean 6N HCl to a pH of ~2, and stored for further processing in the home laboratory at the ICBM, Oldenburg. Samples from stations 3 and 4 were directly filtered through 0.45 μm surfactant-free cellulose acetate (SFCA) syringe filters into low-density polyethylene (LDPE) bottles and acidified at the sampling location with concentrated, self-distilled HNO3 to obtain an acid concentration of 1 % (v/v). Samples from the islands freshwater lens were obtained from two observation wells (27 and 30) and two depths per well in the dune area of the island (Figure 1) as described in Röper et al. (2012). The samples were filtered directly (AkroPak500 filter cartridges, pore size 0.8/0.2 μm) into acid-cleaned HDPE bottles and acidified immediately in the field.
REE Analyses
The REEs were pre-concentrated from seawater using an automated seaFAST-pico system (Elemental Scientific Inc.) following the method described in Behrens et al. (2016). Briefly, samples were spiked with a multi-element REE isotope spike (DKM, prepared by Gilbert N. Hanson of SUNY Stony Brook) and allowed to equilibrate for at least 48 h before purification and pre-concentration with the seaFAST-pico system. An additional UV/H2O2-oxidation was applied for 24 h prior to the pre-concentration step to destroy organic matter and anthropogenic Gd-complexes as degradation of these complexes via hydroxyl radicals has been shown to be very effective (Cyris et al., 2013). The REE concentrations were analyzed and quantified by isotope dilution ICP-MS using a Finnigan Element ICP-MS and a Cetac Aridus II desolvating nebulizer to reduce oxide formation (<0.04% for Ce). The external reproducibility (1RSD), determined by repeated processing and analysis of seawater samples from North Pacific station SAFe 3,000 m, was <3.4% for all REEs except for Ce (<23%; n = 6). Our analyses were well within the 6% range of the consensus values of the SAFe sample (Behrens et al., 2016). Procedural blanks for all REEs except Ce were <4% of the lowest measured REE concentrations and <10% of the lowest measured Ce concentration. All REE concentrations, ratios and anomalies are shown in Table 1.
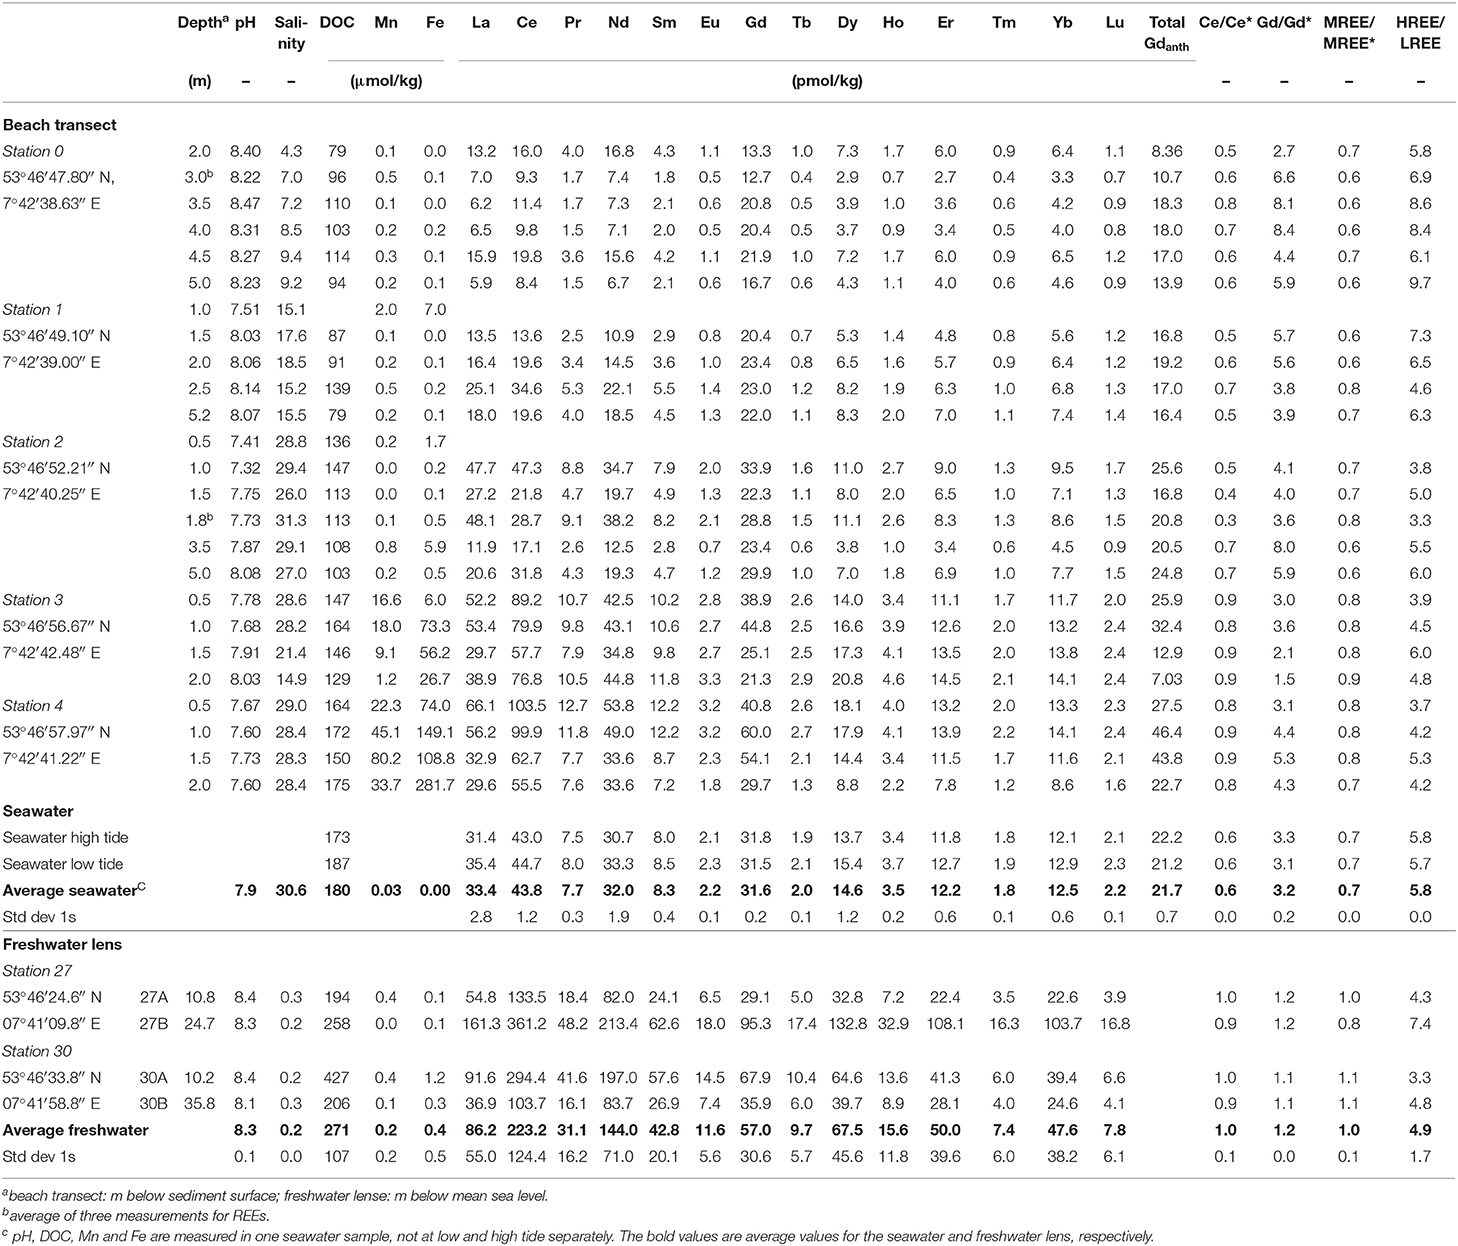
Table 1. REE and ancillary data of porewaters from the beach transect, seawater, and the freshwater lens on Spiekeroog.
REE Anomalies and Natural and Anthropogenic Gd Concentrations
All REE anomalies were calculated using PAAS-normalized (Rudnick and Gao, 2003) REE concentrations (REEN): The Ce-anomaly was calculated as
after German et al. (1995). For the Ce-anomaly, a measured PAAS-normalized Ce concentration is compared with a theoretical PAAS-normalized Ce concentration (Ce*) calculated via neighbor elements. Values >1 indicate a positive Ce-anomaly (higher PAAS-normalized Ce concentrations than expected from interpolation of the neighbor elements), values <1 indicate a negative Ce-anomaly. For all other anomalies of single elements or element groups, the interpretation is accordingly. Ce* or another REE represents the hypothetical Ce value if no anomaly exists. The MREE- and HREE anomalies were calculated after Martin et al. (2010) (for the MREE-anomaly modified by replacing Gd with Eu to avoid inclusion of the high anthropogenic Gd contributions). The Gd-anomaly was calculated in accordance with Bau and Dulski (1996).
Using the Gd-anomaly, the amount of natural Gd (Gdnat) can be calculated as
The anthropogenic part (Gdanth) of the total Gd concentration is then the difference between the total Gd concentration and the natural Gd (Gdnat) concentration, neglecting the small natural positive Gd-anomaly that regularly occurs in natural waters due the higher stability of Gd carbonate complexes compared to its neighbor elements (De Baar et al., 1991).
Since it has been shown that hydroxyl radicals can destroy (or destroy to a great extent) the Gd-complexes (Cyris et al., 2013), we re-analyzed three samples without prior UV/H2O2 treatment to test whether complexed Gdanth can be readily quantified with our analytical method or whether complexed Gdanth may be lost during pre-concentration.
Flux Calculations
In order to determine the net REE addition/removal of the fluxes from the USP, FDT, and from the ridge to the runnel and from the ridge to the MLWL, we chose samples that represent the REE concentrations of the discharged water (see Figure 2, squared symbols) based on the hydrological model of Beck et al. (2017) (see section Study Area and Sampling). We calculate the net fluxes for the USP and ridge, i.e., net addition or removal, in comparison to seawater, because seawater is the source water for the USP and the ridge, by subtracting the REE seawater concentrations from the REE concentrations of the representative samples. The difference in the REE concentrations is then multiplied by the volume of the respective fluxes per day per m shoreline (d*msl), which results in REE addition/removal in pmol per day per m shoreline (Table 2) (note that kg and L are used as equivalent here).
For the net flux from the FDT the average REE concentrations of the freshwater lens is used, which is the source water for the FDT. The total net flux is the sum of all four net fluxes.
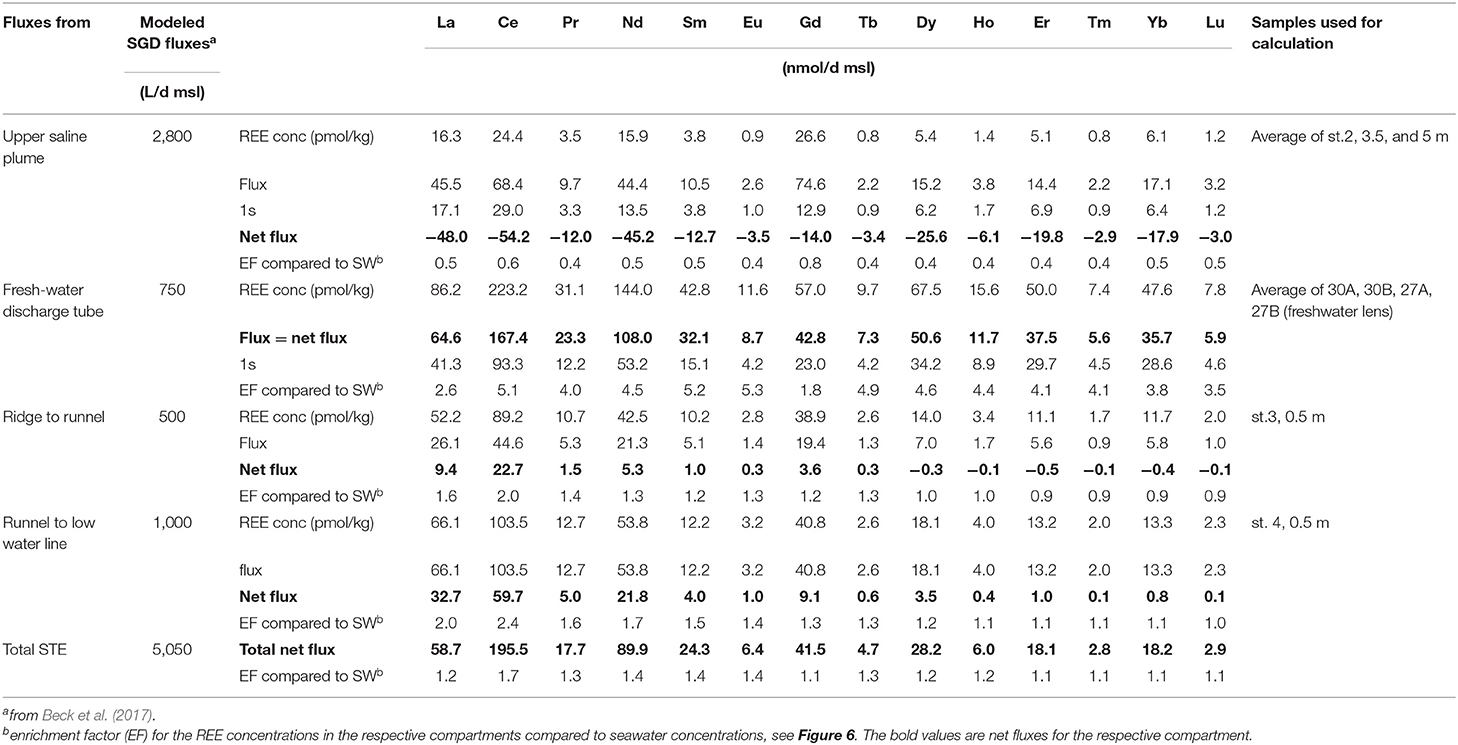
Table 2. Calculated REE fluxes of SGD on Spiekeroog.
Enrichment factors of the REE concentrations in the compartments compared to seawater REE concentrations are shown in Table 2 and Figure 6 and are calculated as follows:
whereby “REE conc compartment” is the (average) REE concentration of the pore water sample(s) representative for the respective flux (Table 2) and “REE conc sw” is the average seawater REE concentration (Table 1).
Results
Salinity
The salinities are increasing from station 0 (salinity 4.3–9.4) to 2 (salinity 26.0–31.3) and are constant around 28.2–29.0 at stations 3 (<1.5 mbsf depth) and 4 (entire profile). In the deep part of station 3, the salinity decreases to 21.4 at 1.5 and 14.9 at 2 mbsf. The salinity of the nearby seawater is 30.6 (northern beach, 14th May 2014, low tide). Salinities of the freshwater lens are in the range of 0.2 to 0.7.
Redox Conditions and Trace Element Concentrations
Beck et al. (2017) measured oxygen concentrations for stations 1 to 4 during the same sampling campaign. Station 1 is oxic down to 2.2 mbsf with nearly constant oxygen saturations throughout the sampled profile. At station 2, the oxygen saturation decreases from 80% at 0.6 mbsf depth to 2% at 2 mbsf depth. At stations 3 and 4 the oxygen saturation was already at or close to 0 within the first 0.5 mbsf. Previous studies (Beck et al., 2017; Reckhardt et al., 2017) that are based on the same sampling campaign with the same sampling sites and depths used here, showed low Fe and Mn concentrations (<7 μM for Fe, <2 μM for Mn) at stations 0 to 2 and increasing concentrations toward station 3, reaching their maximum at station 4 with 281 μM for Fe and 80 μM for Mn (Fe Figure 3A, Mn not shown, Beck et al., 2017; Reckhardt et al., 2017). Concentrations of dissolved organic carbon (DOC) are in the range of 80 to 175 μM with the highest concentrations close to the MLWL (Figure 3B, Beck et al., 2017). For details and other parameters see Beck et al. (2017) (nutrients, DOC, sulfate, hydrogen sulfide), Reckhardt et al. (2017) (Mn, Fe, U, Re, Mo, V) and Ehlert et al. (2016) (Si and δ30Si).
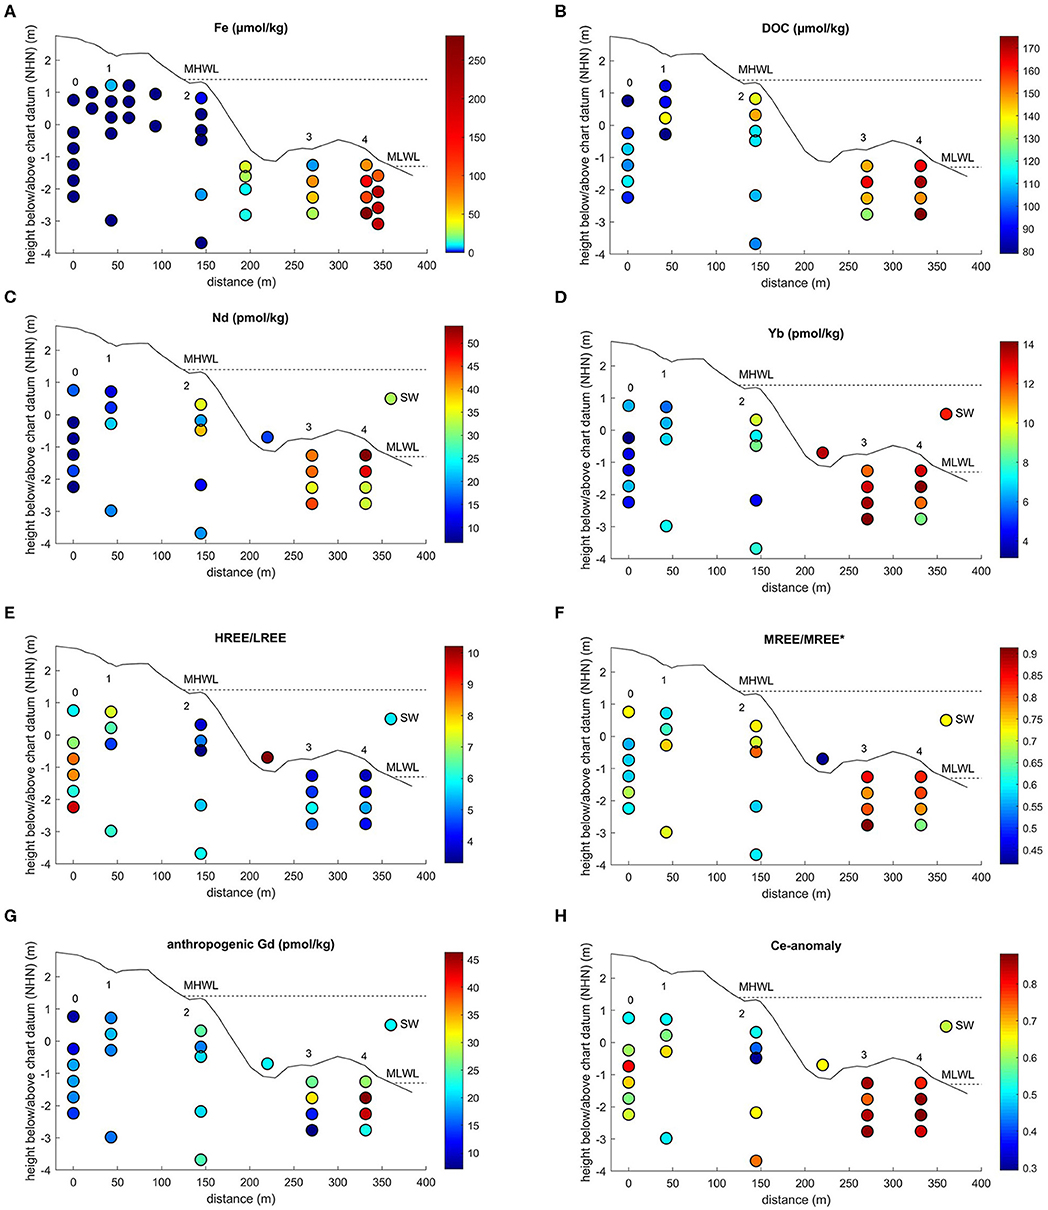
Figure 3. Spatial distribution of (A) Fe, (B) DOC (Beck et al., 2017), (C) Nd concentrations, (D) Yb concentrations, (E) PAAS-normalized (Rudnick and Gao, 2003) HREE/LREE, (F) PAAS-normalized MREE-anomaly, (G) anthropogenic Gd concentrations, and (H) PAAS-normalized Ce-anomaly (this study) in beach pore waters, the runnel, and seawater (SW) on Spiekeroog Island. Site numbers are from Figure 2. The dashed lines indicate the mean high water level (MHWL) and mean low water level (MLWL). Note the non-linear color scales for Fe concentrations. Chart datum NHN equals approximately mean sea level.
Rare Earth Elements
REE Concentrations
Rare earth element concentrations, ratios, and anomalies of beach pore waters, the freshwater lens, and the seawater can be found in Table 1. Along the beach pore water transect, REE concentrations show a generally increasing trend from the dunes to the MLWL, ranging from 6.2 to 53.8 pmol/kg for Nd (representative of LREE) and 3.3 to 14.1 pmol/kg for Yb (representative of HREE) (Figures 3C,D, for concentrations of other elements see Table 1). From the dunes (station 0–1) to the USP (station 2), the REE concentrations increase slightly on average from 12.7 to 24.9 pmol/kg for Nd (5.5 to 7.5 pmol/kg for Yb) and show highest REE concentrations on the ridge (stations 3 and 4) (average of 41.7 pmol/kg for Nd, 12.2 pmol/kg for Yb). Seawater REE concentrations (32.0 pmol/kg for Nd, 12.5 pmol/kg for Yb) are closest to those of the USP (station 2), where salinities indicate the almost pure seawater endmember. Groundwater from the freshwater lens shows generally higher REE concentrations ranging from 82.0 to 213.4 pmol/kg for Nd and 22.6 to 103.7 pmol/kg for Yb.
REE Ratios and Anomalies
PAAS-normalized REE patterns in the upper dune area (stations 0–1) exhibit a strong HREE-enriched pattern with highest HREE/LREE ratios of up to 9.7, compared to 5.8 in coastal seawater (Figure 3E). Lower HREE/LREE ratios of 3.6 to 6.6 are found in the USP and ridge area (stations 2 to 4). The range of the MREE-anomaly is from 0.6 to 0.9, with higher values at the ridge stations (Figures 3F, 4A). A negative Ce-anomaly is most pronounced in the upper USP (station 2, 1–1.8 m) and at the duneward stations 0 to 1, whereas only a slight negative Ce-anomaly (0.8 to 0.9) is found on the ridge (Figure 3H) and the freshwater lens.
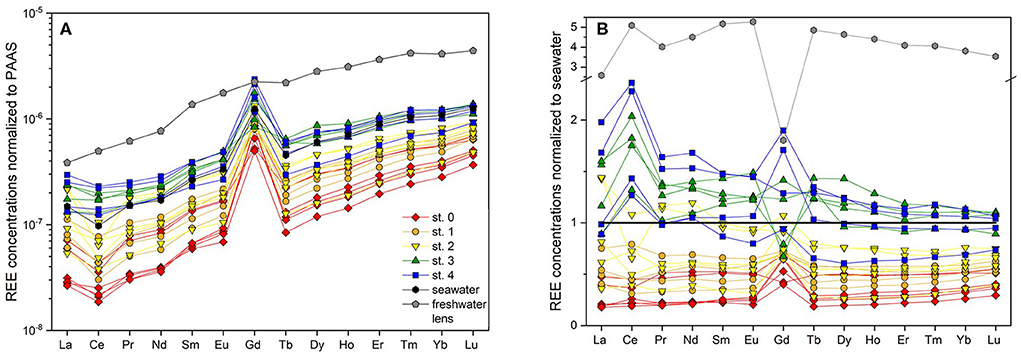
Figure 4. REE concentrations of pore waters and seawater (A) normalized to PAAS (Rudnick and Gao, 2003) and (B) normalized to seawater.
Gadolinium
A pronounced positive Gd-anomaly is present at most stations and depths, with values ranging from 8.4 at station 0 to 1.1 that represents a natural occurring Gd-anomaly at station 3 (Table 1). The seawater samples show intermediate Gd-anomalies of about 3.2. Samples from the freshwater lens do not carry an anthropogenic Gd-anomaly, their Gd-anomaly is in the natural range of up to 1.2. Note that normalized to seawater (Figure 4B), samples from station 3 and the freshwater lens (that do not show a PAAS-normalized Gd-anomaly) appear to have a negative Gd anomaly, which is due to the positive Gd-anomaly in seawater. The calculated Gdnat concentrations in the pore water samples are in the range of 1.9 to 16.2 pmol/kg, with lowest values at station 0 and highest values at station 4, equivalent to the other REEs. The calculated Gdanth concentrations range between 8.4 and 46.4 pmol/kg, again with lowest values at station 0 and highest values at station 4 (Figure 3G).
As described above, three samples were analyzed for REE concentrations with and without prior UV/H2O2 treatment. The different treatment only affected the measured concentration of Gd (Table 3), which is higher in the treated compared to the untreated samples by 5.5 to 13.0 pmol/kg Gd, which represents 38 to 49% of the total measured Gd concentration. This additional Gd represents the complexed part of the Gdanth that is only recovered with the ion exchange method used here if the Gd-DTPA complex is destroyed through UV/H2O2-treatment prior to pre-concentration.
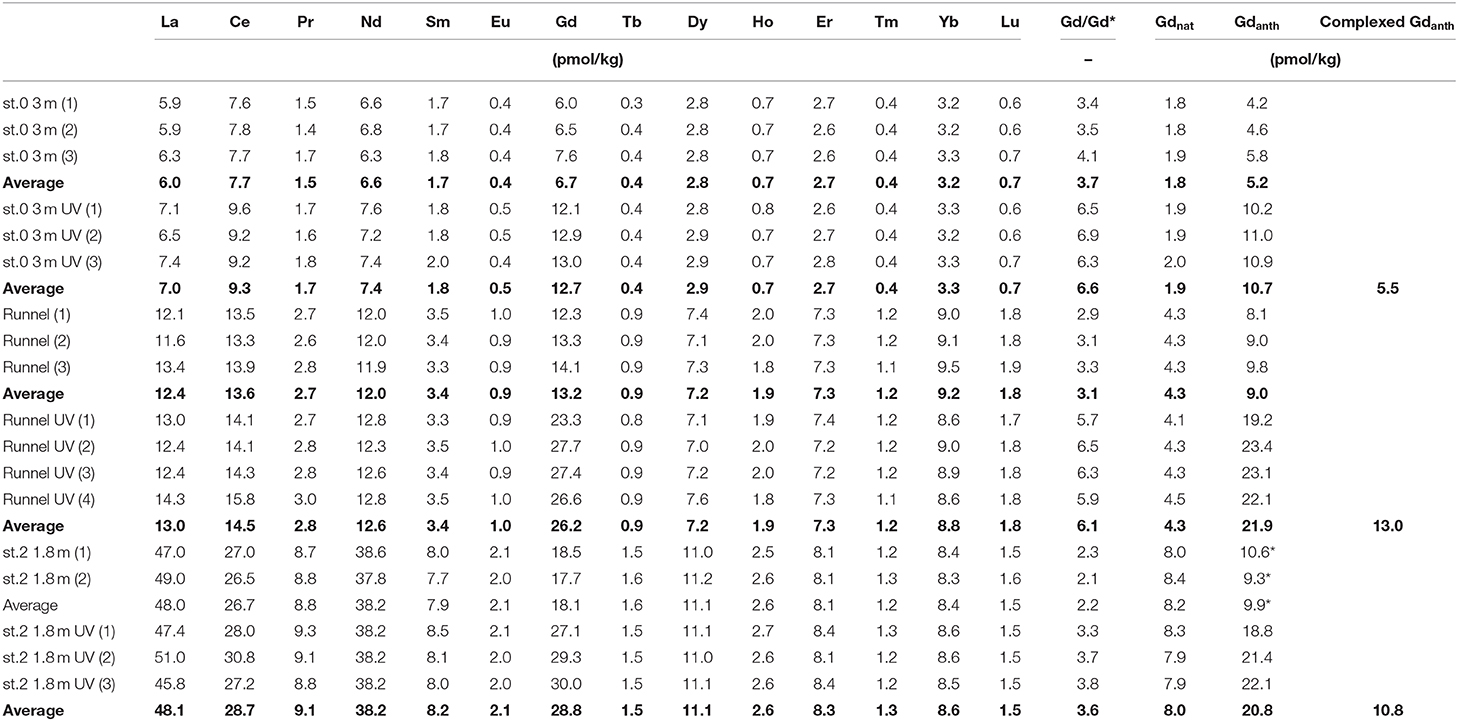
Table 3. Effect of UV-treatment prior to pre-concentration on REE concentrations: Comparison of natural Gd (Gdnat) with non-complexed (untreated) and complexed (UV-treated minus untreated) anthropogenic Gd (Gdanth) in porewaters of the beach transect (replicate numbers in brackets, average values in bold).
Fluxes of REEs
The fluxes of REEs for the USP, FDT, and ridge to runnel and ridge to MLWL are listed in Table 2 as well as enrichment factors of the REE concentrations of these fluxes compared to seawater REE concentrations (see Figure 6). We calculated REE fluxes for the different compartments of the STE as REE fluxes from the USP, the FDT, from the ridge to the runnel and from the ridge to the MLWL (water fluxes from Beck et al., 2017). Estimates of the REE net fluxes from the USP reveal that REEs are removed from infiltrating seawater by factors of 0.4 (MREE) and 0.5 (LREE and HREE) (excluding Ce 0.6 and Gd 0.8), resulting in REE removal from seawater of 2.9 (Tm) to 54.2 (Ce) nmol per day per m shoreline. Discharges from the ridge to the runnel and the MLWL, with up to 2.4-fold REE enrichments of pore waters relative to seawater, lead to minimum and maximum net fluxes of −0.1 and 0.1 (Lu) to 22.7 and 59.7 (Ce) nmol per day per m shoreline from the ridge to the runnel and the MLWL, respectively. These fluxes are higher for LREEs and MREEs than for HREEs, with even slightly negative fluxes (removal) of HREEs from the ridge to the runnel. For the FDT that is fed by fresh groundwater, the REE fluxes are net fluxes. They range from 5.6 (Lu) to 167.4 (Ce) nmol per day per m shoreline. Compared to seawater REE concentrations, the REEs are 1.8- to 5.3-fold enriched in the FDT with the highest enrichment for MREEs (except for Ce and Gd). The total net flux for REEs from the STE to the coastal water results in an addition of individual REEs of 2.8 to 195.5 nmol per day per m shoreline, with HREE ≤ MREE ≤ LREE fluxes and varying with natural abundance. The REE concentrations in the total STE flux are enriched compared with seawater, ranging from 1.1 to 1.7 (Figure 6, purple line).
Discussion
REE Behavior in the Subterranean Estuary
The zonation of the STE on Spiekeroog into different compartments (Figure 2) is also reflected in the distribution of REE concentrations, anomalies, and ratios (Figure 3). In all samples, a positive La-anomaly can be found, which is characteristic for seawater as the mean residence time of La is the longest among the LREE and MREE (Alibo and Nozaki, 1999) and is not discussed further. A positive Gd-anomaly can be seen throughout the transect due to anthropogenic input of Gd. The anthropogenic Gd can be present in complexed and non-complexed form whereby the complexed form is not affected by estuarine removal or scavenging processes in general due to its high solubility. Therefore, the complexed Gd behaves differently than the other REEs, which is seen in Figures 4, 6. The behavior of Gd is discussed separately in section Anthropogenic Gd.
Dune Area and Upper Saline Plume
The salinity increases in pore waters from the dune area toward the MHWL and oxic conditions in the dune area imply mixing of rainwater and seawater that may also control the pore water REE composition.
For the samples in the dune area (st. 0 and 1), there is a positive correlation of the REEs with salinity, as rainwater (low salinity and low REE concentrations originating from sea spray) and seawater (salinity 30.6 and higher REE concentrations) mix in the dune area (Figure 5). Seawater salinity and REE concentrations fall close to the mixing line of rain- and seawater, suggesting an overall conservative behavior of REEs controlled by mixing of rain- and seawater (Figure 5, Supplementary Figure 1).
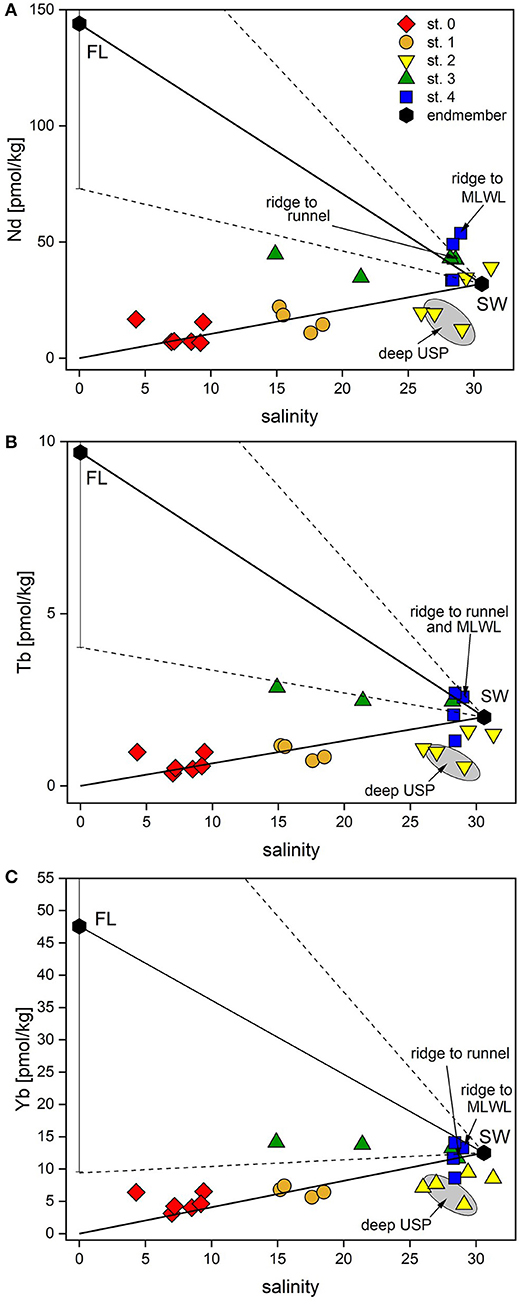
Figure 5. Nd and Yb concentrations vs. salinity of all porewaters and potential endmembers. (A) Nd, representing LREEs, vs. salinity, (B) Tb, representing MREEs, vs. salinity, (C) Yb, representing HREEs, vs. salinity. Black hexagons represent potential endmember compositions of fresh groundwater (FL, average of four samples from the freshwater lens) and seawater (SW, average of coastal seawater at high and low tide). Solid lines indicate mixing between the endmembers, dashed lines show the mixing range for the FL (±1SD). Samples used for the calculations of the REE fluxed are labeled.
In the USP (station 2), however, we observe small depletions for all REEs in most samples compared to seawater and the theoretical mixing line between seawater and rainwater. This can be either caused by lower REE seawater concentrations at the time of infiltration or by removal processes. Assuming the same REE concentrations in seawater during the time of infiltration and during our sampling, non-conservative removal processes typically effect LREE, MREE and HREE differently: Because of the higher stability of REE-carbonate complexes for HREEs compared to LREEs (Sholkovitz et al., 1994), scavenging of REEs from seawater to e.g., organic material/coatings or to other particles typically leads to a preferential depletion of LREEs relative to HREEs in seawater. Enhanced MREE removal has been suggested to be indicative of Fe-oxide scavenging (Haley et al., 2004). Heavy REEs can be preferentially taken up by bacteria (Takahashi et al., 2005) or scavenged by quartz grains (Byrne and Kim, 1990) or Fe-oxides in form of HREE-carbonate complexes (Dzombak and Morel, 1990; Johannesson et al., 2011). As the sediments at the beach site are mainly composed of quartz and the fraction of reactive Fe that could potentially coat the quartz grains in the beach sediments on Spiekeroog is very low (~0.01–0.1%) (J. Ahrens, pers. comm., ICBM, July 2018), preferential removal of HREE onto quartz seems a viable process. Furthermore, bacteria binding HREEs to carboxylate and phosphate groups on their cell surfaces, thereby depleting ambient water in HREE (Takahashi et al., 2005), is possible as well.
In the deeper USP (station 2, ≥3.5 mbsf) under suboxic conditions, MREEs are most depleted, probably due du scavenging by Fe-oxides as mentioned above. Iron-oxide formation in the transition zone between the anoxic freshwater of the FDT and the oxic saline waters of the USP has been suggested previously for the STE on Spiekeroog (Linkhorst et al., 2017) and other STEs (e.g., Rouxel et al., 2008). This “iron curtain” has been suggested to act as a temporal storage or even a sink for dissolved organic matter (Linkhorst et al., 2017), which could apply for REEs and also other trace elements.
In summary, REEs in the dune area and partly the USP are dominantly controlled by mixing of rainwater and seawater, while REEs in the deeper USP are additionally affected by REE removal processes that lead to a negative deviation of REE concentrations from conservative mixing lines, particularly for MREEs and HREEs.
The Freshwater Discharge Area
Below 1.5 mbsf at station 3, where salinities are low at 21.4 and 14.9, indicating the presence of the FDT, sub- to anoxic and Fe/Mn-oxide-reducing conditions prevail, as indicated by high pore water Fe and Mn concentrations (Beck et al., 2017; Reckhardt et al., 2017). Ce-anomalies in the FDT and in the freshwater lens of close to 1 indicate that Ce is mostly present in its reduced soluble oxidation state Ce(III), corroborating sub-/anoxic conditions in the FDT (Figures 3A,H). Due to the high variability of the freshwater endmember in the freshwater lens of Spiekeroog, conservative mixing (Figure 5) is difficult to constrain. However, according to the hydrological model in Beck et al. (2017), the freshwater that is supplied to the coastal ocean is a mixture from all depths of the freshwater lens, so averaging all the freshwater REE concentrations for the endmember seems appropriate.
The REE concentrations in the FDT are slightly higher (at 2 mbsf) or at the same level (at 1.5 mbsf) as those in coastal seawater (Table 1, Figures 4B, 5). Considering a freshwater endmember at the lower end of the REE concentration range found in the freshwater lens, the FDT REE concentrations could be controlled by conservative mixing of water from the freshwater lens and seawater. If the freshwater endmember has REE concentrations at the higher end of the REE concentration range of the freshwater lens, additional removal processes as discussed above must be present.
The Seawater Circulation Cell Below the Ridge
In the suboxic to anoxic seawater circulation cells on the ridge (station 3 ≤ 1 mbsf and station 4), the main source for the pore waters is seawater as reflected by salinities of 28.2–29. All REEs show non-conservative behavior with an enrichment factor of up to 2.4 (for Ce) relative to seawater and generally decreasing enrichment from LREE over MREE to HREE (Figures 4B, 6). The higher REE concentrations at stations 3 and 4 (Figures 3C,D), together with higher positive MREE-anomalies (Figures 3F, 4A) and lower HREE/LREE ratios with respect to the coastal seawater, and Ce-anomalies close to 1 (Figure 3H) are in line with reducing conditions that lead to the dissolution of Fe/Mn-oxides as indicated by high pore water Fe (Figure 3A) and Mn concentrations (Beck et al., 2017; Reckhardt et al., 2017). Possible sources here for the REEs are particulate organic matter (POM), Ce-oxides (source for Ce), and Fe/Mn-oxides. In the following, we will discuss the relevance of the possible sources for the REE concentrations at these stations leading to REE concentrations exceeding those of nearby coastal seawater.
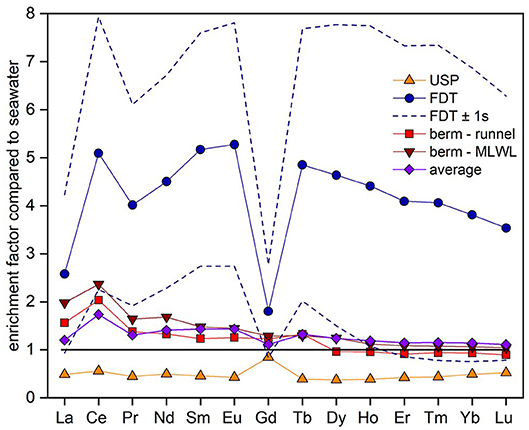
Figure 6. Enrichment factors of the REE concentrations compared to seawater REE concentrations (horizontal black line) for the different compartments of the STE: The freshwater discharge tube (FDT, blue circles), upper saline plume (USP, orange triangles), ridge to the runnel (light red squares) and ridge to the MLWL (dark red inverted triangles). Enrichment factors of total SGD pattern (all concentrations weighted according to their discharge volumes) are shown in purple diamonds. Uncertainties for the FDT (±1SD) that arise from the large range in REE concentrations in the freshwater lens, are shown by blue dashed lines.
Duncan and Shaw (2003) suggested a relict carbon-rich phase as source for REE enrichment in an STE. This is in agreement with Haley et al. (2004), who also found particulate organic carbon degradation as the main source for REEs in marine pore waters, mostly in oxic and suboxic environments, producing a linear (constant moderate increasing pattern across the REEs) or HREE-enriched PAAS-normalized REE pattern. At our sampling sites on the ridge, the dissolved organic matter (DOM) is mainly of marine origin and is constantly resupplied due to the short residence time of the pore waters (Beck et al., 2017; Waska et al., 2019). In the sediments, degradation of particulate organic matter (POM) may release REEs that were previously scavenged from seawater and potentially contributing to the dissolved REE enrichment on the ridge. As REE scavenging by POM leads to the preferential adsorption of LREEs over HREEs (Sholkovitz et al., 1994), a LREE-enriched pattern would be expected from the dissolution of organic matter. This is in agreement with the elevated LREE over HREE concentrations on the ridge relative to seawater, while the HREE are in the same range as the seawater or even slightly depleted (Figures 4B, 5). If one sample (st. 4, 2 mbsf) with extreme REE and DOC concentrations is excluded, the remaining samples show a positive correlation (R2 = 0.48 for Nd, 0.23 for Tb and 0.99 for Yb, only significant p <0.05 for DOC vs. Yb) between DOC and REE concentrations (Supplementary Figure 2). Due to preferential scavenging of LREE over HREE, the best correlation for the case of POM degradation and associated REE release would be expected for DOC and LREE. However, we cannot distinguish between DOC input with seawater and in situ DOC formation through POM degradation and the enrichment (e.g., relative to station 2) is small, which may both affect the correlation. Furthermore, re-adsorption onto sediment particles may affect the REE concentrations after POM degradation and associated REE release. The degradation of an old terrestrial particulate organic carbon pool as suggested for other STEs (e.g., Duncan and Shaw, 2003) is unlikely on Spiekeroog due to the mainly marine origin of the DOM at these sites (Beck et al., 2017). This would also imply that the REEs released here are (at least partly) not “new” fluxes to the ocean but reflect a transient accumulation and subsequent resupply of “marine” REEs to the coastal seawater, as the main source of the released REEs has to be young seawater rather than terrestrial organic or lithogenic material. This is in contrast with other STEs where relict sources or leaching of rocks are the main source for the release of REEs to the terrestrial part of SGD (Duncan and Shaw, 2003; Chevis et al., 2015a; Johannesson et al., 2017).
In the ridge samples, the characteristic negative Ce-anomaly of seawater is nearly absent or clearly less pronounced than in nearby seawater (Figures 3H, 4B) due to Ce-oxide reduction under the suboxic conditions present at the ridge stations (Beck et al., 2017). Below 10 μmol/L oxygen, Ce-oxides are reduced, and Ce behaves like the other trivalent REEs, shifting the Ce-anomaly toward 1 (no anomaly) (Haley et al., 2004).
Under suboxic conditions, Fe/Mn-oxides are reduced, which leads to elevated dissolved Fe and Mn concentrations (Reckhardt et al., 2017) and the release of REEs adsorbed to these oxides. For example, Haley et al. (2004) suggested a positive MREE anomaly as indicative of reductive Fe-oxide dissolution, as Fe-oxides in the water column preferably scavenge MREE. In contrast, Johannesson et al. (2011) found an order of release of REEs under Fe-reducing conditions to follow LREE > MREE > HREE. Here, we observe an MREE- and LREE enrichment for the samples from stations 3 and 4, with a smaller MREE-anomaly (not exceeding 1, Figure 3F) than reported by Haley et al. (2004) despite partly higher dissolved Fe concentrations. For SGD in particular, the dissolution of Fe-oxides has been suggested to add REEs to the pore waters (Johannesson et al., 2011; Chevis et al., 2015b). Assuming the dissolution of Fe-oxides as the source for REEs at the ridge stations, there should be a positive correlation between the dissolved Fe and dissolved REE concentrations, which is not observed here. Instead, there is no or a negative correlation between Fe and REE concentrations (Supplementary Figure 3) or Fe and the MREE-anomaly (positive MREE-anomaly as an indicator of REE release from Fe-oxides). These correlations are mainly controlled by one (st. 4, 2 mbsf) out of 6 data points with the highest Fe and lowest REE concentrations. There is no positive relationship between REE concentrations or MREE-anomaly with Mn concentrations either (not shown). This missing correlation between dissolved Fe or Mn and dissolved REE concentrations is in contrast to other studies (Johannesson et al., 2011; Chevis et al., 2015a), suggesting that neither Fe nor Mn-oxide reduction is the dominant source for REEs on the ridge, but can also not be ruled out completely.
In summary, we suggest that remineralization of marine supplied POM is the main source for REE exceeding the concentrations of seawater at the ridge stations supported by the LREE-enriched pattern compared to seawater. We cannot rule out Fe/Mn-oxide reduction as another REE source completely, but no positive correlation with Fe or Mn or the sum of Fe+ Mn exists, though Fe concentrations could be biased by iron sulfide precipitation due to sulfate reduction. The effect on the REE pattern of pore water by Fe/Mn-oxide dissolution is discussed controversially and therefore the pattern shape cannot be used to identify these compounds as a REE source. For Ce, the reduction of Ce-oxides in low oxygenated areas is an additional source.
Estimated Fluxes of REEs From Beach Sediments
Individual REEs behave differently along the beach transect with general depletion of REEs in the USP and general enrichment in the FDT and in the ridge compared to seawater (Figure 4B). To investigate if the STE acts as a REE source or a sink for coastal waters, we calculate the element fluxes from the STE into the North Sea using pore water discharge derived from a numerical flow and transport model (Beck et al., 2017) and the REE concentrations of this study (see method section). Briefly, the flux from the FDT is highest for all REEs compared to the other fluxes and higher for LREEs and MREEs compared to HREEs. Note that there is a high variability in the REE concentrations of the FDT as the four samples used to create a mean REE concentration for the FDT show very different REE concentrations (average ± 1SD in Figure 6, dashed lines). The net fluxes from the ridge are positive for most REEs and highest for LREEs, whereby the net flux from the ridge to the runnel is slightly negative for HREEs. For the USP, the net flux is negative, resulting in removal of all REEs compared to seawater. The total net flux of all fluxes combined with respect to the discharge of the fluxes is positive for all REEs with HREE ≤ MREE ≤ LREE and varying with natural abundance.
Cerium fluxes from the FDT and the ridge are higher than those of its neighbor elements due to suboxic conditions in these pore waters that lead to the reduction of the insoluble Ce(IV) to the soluble Ce(III). Gadolinium fluxes differ from the fluxes of its neighbor elements as the representative samples for the fluxes contain different amounts of anthropogenic Gd which is discussed further in section Anthropogenic Gd. The flux calculations, however, do not consider redox changes upon the discharge of SGD into seawater. This may be especially relevant for the pore waters at the ridge and the waters from the suboxic/anoxic freshwater lens and may result in trace element removal to the particulate phase when mixing with oxic seawater. This process has so far not been studied and would also affect the trace element fluxes via SGD that have been reported by other studies where the pore waters are suboxic/anoxic. We also note that our study is potentially missing the flux from the more seaward located salt wedge and another FDT that are predicted from a hydrological model for the deeper sediment column and further seaward on Spiekeroog (Waska et al., 2019). Further studies will have to reveal the contribution of these compartments if their existence is confirmed.
To compare the REE fluxes from the beach sediments to the input from rivers, we calculated the total amount of REEs transported by the rivers Weser, Elbe, and Ems to the southern North Sea. Assuming a mean annual discharge of 10.3, 23.7, and 2.5 km3 per year (Frankignoulle and Middelburg, 2002; Flussgebietsgemeinschaft Weser, 2005) and Nd concentrations of 91.2, 96.7, and 156.5 pmol/L (Kulaksiz and Bau, 2007), the rivers supply 938, 2291, and 391 mol Nd per year, respectively. However, considering a loss of REEs in the river estuaries of ~71% (average Nd removal in river estuaries, Rousseau et al., 2015), the combined river Nd flux to the southern North Sea results in 1,058 mol Nd input per year. The combined REE fluxes from the STE on Spiekeroog extrapolated to a shoreline of 56 km for the East Frisian Islands, amounts to an addition of 1.84 mol Nd per year. Even if the entire shoreline of the southern North Sea (~500 km) is considered, the SGD flux of about 16.4 mol Nd per year is still two orders of magnitude lower than the supply from the rivers. Despite the fact that this must be regarded as a rough estimate, the differences in the REE supply are still significant, suggesting that rivers are the main source of REEs to the southern North Sea. The relative importance of these fluxes, however, may change throughout the year due to changes in river supply, current directions, and precipitation.
Other studies have shown that SGD is the main source for REEs to the ocean with fluxes that are equal to or exceed the supply by local rivers (e.g., Johannesson et al., 2011; Chevis et al., 2015a), by atmospheric contribution or by diffusion from bottom sediments (e.g., Kim and Kim, 2011, 2014). However, in those study areas, overall SGD (water) fluxes exceed local river discharge, the opposite of what is true for the southern North Sea, where river discharge is much higher than the SGD flux by volume. Considering the total estimated Nd input via SGD of 5.03 mmol Nd per day for the East Frisian Islands (56 km shoreline) or 45 mmol Nd per day for the southern North Sea (~500 km), this is on the same order of magnitude as some other SGD fluxes e.g., for the Indian River Lagoon (9.4 to 100 mmol Nd per day, Johannesson et al., 2011; Chevis et al., 2015b), Pettaquamscutt Estuary, Rhode Island (26 mmol Nd per day, Chevis et al., 2015a) and Kona Coast (1.3–2.6 mmol Nd per day, Johannesson et al., 2017). The SGD REE fluxes estimated for the southern North Sea are as significant as those suggested from other STEs for the global ocean. Yet, if individual SGD fluxes are evaluated with respect to regional river REE input, the significance of SGD for the coastal seawater REE budget varies due to large differences in the river REE contributions. While the rivers to the North Sea are supplying 2.90 mol Nd per day, rivers just add 12.7 mmol Nd per day to the Indian River Lagoon (Johannesson et al., 2011) and 36.7 mmol Nd per day to the Pettaquamscutt Estuary (Chevis et al., 2015a), at the Kona Coast there is no significant river input (Johannesson et al., 2017). These differences in the river input are mainly due to the higher discharge rates of the rivers draining into the North Sea as the Nd concentrations of the rivers are of the same order of magnitude. Two studies from South Korea (Kim and Kim, 2011, 2014) show that the Nd input via SGD is about 1,000 times higher than in the STE presented in this study. This is due to up to two orders of magnitude higher SGD volumes, Nd concentrations in the discharged waters exceeding the concentrations of the pore waters in this study up to 20-fold, and longer shorelines (230 and 130 km, Kim and Kim, 2014). Differences in these factors result in a total input of 120 mol Nd per day (Kim and Kim, 2011) and 58 and 219 mol Nd per day (Kim and Kim, 2014) compared to 5.03 mmol Nd per day for the East Frisian Islands.
All studied estuaries are of a different size and have different catchment areas and the SGD may show seasonal variations. Thus, the total REE inputs are difficult to compare, but they provide an idea of the diversity of the STEs at different locations. One additional important aspect that can lead to large differences is the nature of the aquifer material for the terrestrial groundwater. Here, we compared young basaltic rocks in South Korea (Kim and Kim, 2011) or older glacial deposits derived from Late Proterozoic and Paleozoic rocks on Rhode Island (Chevis et al., 2015a) with fine- to coarse-grained sands and clays that is the source for the young groundwaters in our study. Groundwater contact with different source rocks may result in different REE signatures regarding the total and relative REE concentrations. In addition, the beaches of Spiekeroog have been shown to change the topography, the shoreline, the shape and location of the runnel several times throughout the year (Waska et al., 2019). This could also have an influence on the dimension of the fluxes, the residence times of the waters within the STE and therefore also on the redox conditions in the pore waters. The study presented here therefore has to be seen as representing a snapshot of the current situation, and seasonal and interannual studies are required to confirm the estimated annual REE fluxes.
Anthropogenic Gd
The origin of the Gdanth in the seawater and pore waters is not a local signal from Spiekeroog Island as there is no hospital on the island that could contribute Gdanth to groundwater or coastal waters. The source of Gdanth in coastal seawater must therefore be derived from river discharge (e.g., Weser, Ems, Elbe, Rhine; Kulaksiz and Bau, 2007) or from direct input of effluent waters by (sub)marine outfalls into the North Sea.
Effect of UV/H2O2 Treatment on Measured Anthropogenic Gd Concentrations
As described previously, the Gd-complexes are degraded by reaction with hydroxyl radicals via UV/H2O2 treatment (Cyris et al., 2013). In order to test whether total Gd (Gdnat and Gdanth) is quantitatively recovered during the pre-concentration of REEs via seaFAST, we measured REE concentrations in samples treated with UV/H2O2 and in untreated samples. We suggest that the significantly higher concentrations found for Gd measured in the treated compared to the untreated samples result from the degradation of the Gd-complexes under UV/H2O2 conditions and the non-quantitative retention of complexed Gdanth on the chelating resin used for pre-concentration of the REEs. In the following, we therefore discuss the difference in Gd concentrations between UV/H2O2 treated and untreated samples as a measure of the difference between complexed and non-complexed Gdanth in the pore waters.
The observed Gd concentration difference between UV/H2O2 treated and untreated samples (n = 3) of up to 13.0 pmol/kg (Figure 7) demonstrates that a large fraction of Gd in the analyzed pore waters is complexed. The percentage of complexed Gdanth of the total Gdanth is in a narrow range of 52 to 59% for the tested samples (st. 0, 3 mbsf, st. 2, 1.8 mbsf, and runnel). This suggests that the samples are roughly of the same age, as it has been shown that there is a degradation of the complexes over time (Holzbecher et al., 2005). Several factors have been found to influence the destabilization of Gd-complexes e.g., transmetallation or competition for binding places of the DPTA complexes by Ca, Mg, or K ions (Schijf and Christy, 2018).
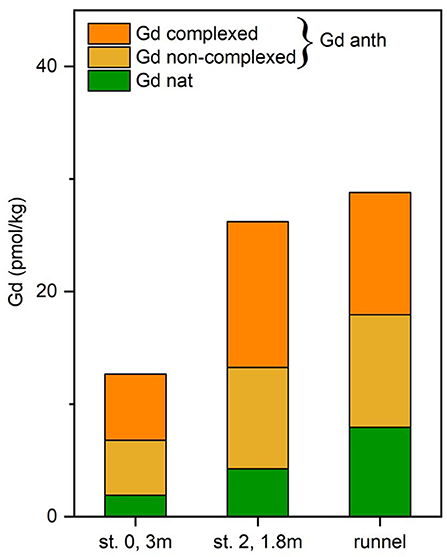
Figure 7. Comparison of natural (Gd nat) and anthropogenic Gd (Gd anth) in pore water and runnel water. The total anthropogenic Gd is separated into a complexed and non-complexed form based on UV-H2O2-treated and untreated samples.
Anthropogenic Gd in the STE on Spiekeroog
The stations in the upper beach zone and the USP suggest strong REE scavenging, whereas the stations on the ridge indicate REE release. As complexed Gdanth is not affected by scavenging/release and stays in the dissolved phase, total Gd-anomalies are misleading, and we will therefore only discuss absolute Gdanth concentrations (Figure 3G).
Differences in the total amount of Gdanth in our samples are due to the origin of the waters. At the upper beach (stations 0 and 1), Gdanth is low due to a high proportion of rainwater that contains only minor Gdanth due to the transport of seawater aerosols onto land (sea spray). Furthermore, it has to be kept in mind that our study represents a snapshot of a highly variable environment, resulting in uncertainties in the Gdanth concentrations in the endmembers (seawater and rainwater) at the time of infiltration.
The low Gdanth concentrations in the FDT (station 3, 1.5, and 2.0 mbsf) are mostly a result of mixing of fresh groundwater (Gdanth = 0) and seawater (Gdanth = 21.7 pmol/kg). The samples from the USP (16.8–25.6 pmol/kg Gdanth) and the runnel (21.9 pmol/kg Gdanth) are mainly fed by seawater on a short timescale and therefore show a similar total Gdanth content as the seawater samples. The highest Gdanth concentrations of the transect of up to 46.4 pmol/kg found on the ridge exceed the seawater Gdanth (Gdanth = 21.7 pmol/kg) and therefore must be due to release of previously scavenged non-complexed Gdanth (i.e., after degradation of the complex) from seawater. Because of the fact that Gdanth is released from organic matter and/or Fe/Mn-oxides, these possible REE sources have to be younger than the onset of Gdanth discharge to the marine environment (post 1980s). This confirms that the REEs in this study are not derived from relict deposits, as suggested for other STEs (Duncan and Shaw, 2003; Chevis et al., 2015a).
Kulaksiz and Bau (2007) showed positive Gd-anomalies for the North Sea and Weser Estuary. At their closest station to our sampling site (EF5, about 10 km north of Spiekeroog) they found a positive Gd-anomaly of 1.9, compared to 3.0 found in our study for coastal surface waters off Spiekeroog if calculated the same way as Kulaksiz and Bau (2007). This difference of ΔGd/Gd* = 1.1 in the anomalies, which is equivalent to 15.7 pmol/kg Gdanth, can in part be attributed to the 9 years timespan between the sampling dates (2005/2014) and reflects the constant increase in input and the accumulation of Gdanth in the North Sea. Additionally, the pre-concentration method used by Kulaksiz and Bau (2007) did not involve a UV/H2O2 treatment, suggesting that they did not recover the complexed Gdanth component quantitatively.
Conclusions
The REE concentrations of a beach transect on Spiekeroog representing an STE have been found to be highly variable. In the upper dune area in oxic, low-salinity pore waters, the REE concentrations are depleted compared to the adjacent seawater due to mixing with rainwater and show a pronounced negative Ce-anomaly due to the oxic conditions. They also show higher HREE/LREE ratios indicating intense scavenging. Moving seawards, the REE concentrations increase due to stronger influence of the seawater. Close to the MLWL with sub-/anoxic redox conditions, confirmed by the near absence of a Ce-anomaly, degradation of POM and possibly also the reduction of Fe/Mn-oxides add REEs to the pore waters and lead to REE concentrations that partly exceed those expected from conservative mixing. Calculated total fluxes from the beach pore waters indicate a net positive addition of all REEs to coastal seawater, with relatively more LREEs than HREEs. This is in line with previous studies that suggested that STEs are a source of LREEs and a sink for HREEs (Johannesson et al., 2011). Compared to nearby rivers, REE addition is of minor importance for the REE budget of the southern North Sea. Compared to most other STEs the observed REE fluxes from the beach sands at Spiekeroog are in the same order of magnitude. The presence of Gdanth throughout the transect displays the increased anthropogenic impact on coastal waters and the accumulation of Gdanth since the first studies that observed Gdanth in the southern North Sea.
Data Availability Statement
All datasets generated for this study are included in the article/Supplementary Material.
Author Contributions
KP and BS designed the study. RP, CE, AR, and BS took the samples. RP and MB measured REE concentrations. AR measured salinity and Fe and Mn concentrations. RP wrote the manuscript with contributions from the other authors. All authors were involved in the interpretation and discussion of the data.
Conflict of Interest
The authors declare that the research was conducted in the absence of any commercial or financial relationships that could be construed as a potential conflict of interest.
Acknowledgments
We thank the Wadden Sea National Park Administration of Lower Saxony for the permission to study the beach site on Spiekeroog Island and S. Fock and C. Winkelmann from the Research Center Wittbülten on Spiekeroog. We further thank all participants of the sampling campaign in May 2014, especially M. Beck for organization and coordination. J. Ahrens kindly provided information on the Fe-content of beach sands. We further thank H. Nicolai and G. Behrens for the boat transfers and their assistance during planning of the sampling campaign as well as their technical support during sampling. Thanks to the staff of the Lower Saxony Water Management, Coastal Defense and Nature Conservation Agency for transporting the sampling equipment to the study site. Furthermore, we acknowledge M. Schulz for laboratory assistance. This project was financially supported through the Institute for Chemistry and Biology of the Marine Environment (ICBM), Oldenburg, and the Max Planck Institute for Marine Microbiology, Bremen.
Supplementary Material
The Supplementary Material for this article can be found online at: https://www.frontiersin.org/articles/10.3389/fmars.2020.00424/full#supplementary-material
References
Alibo, D. S., and Nozaki, Y. (1999). Rare earth elements in seawater: particle association, shale-normalization, and ce oxidation. Geochim. Cosmochim. Acta 63, 363–372. doi: 10.1016/S0016-7037(98)00279-8
Anschutz, P., Smith, T., Mouret, A., Deborde, J., Bujan, S., Poirier, D., et al. (2009). Tidal sands as biogeochemical reactors. Estuar. Coast. Shelf Sci. 84, 84–90. doi: 10.1016/j.ecss.2009.06.015
Bau, M., and Dulski, P. (1996). Anthropogenic origin of positive gadolinium anomalies in river waters. Earth Planet. Sci. Lett. 143, 245–255. doi: 10.1016/0012-821X(96)00127-6
Beck, M., Reckhardt, A., Amelsberg, J., Bartholomä, A., Brumsack, H. J., Cypionka, H., et al. (2017). The drivers of biogeochemistry in beach ecosystems: a cross-shore transect from the dunes to the low-water line. Mar. Chem. 190, 35–50. doi: 10.1016/j.marchem.2017.01.001
Behrens, M. K., Muratli, J., Pradoux, C., Wu, Y., Böning, P., Brumsack, H. J., et al. (2016). Rapid and precise analysis of rare earth elements in small volumes of seawater - method and intercomparison. Mar. Chem. 186, 110–120. doi: 10.1016/j.marchem.2016.08.006
Birka, M., Roscher, J., Holtkamp, M., Sperling, M., and Karst, U. (2016). Investigating the stability of gadolinium based contrast agents towards UV radiation. Water Res. 91, 244–250. doi: 10.1016/j.watres.2016.01.012
Bone, S. E., Charette, M. A., Lamborg, C. H., and Gonneea, M. E. (2007). Has submarine groundwater discharge been overlooked as a source of mercury to coastal waters? Environ. Sci. Technol. 41, 3090–3095. doi: 10.1021/es0622453
Bourne, G. W., and Trifaró, J. M. (1982). The gadolinium ion: a potent blocker of calcium channels and catecholamine release from cultured chromaffin cells. Neuroscience 7, 1615–1622. doi: 10.1016/0306-4522(82)90019-7
Burnett, W. C., Bokuniewicz, H., Huettel, M., Moore, W., and Taniguchi, M. (2003). Groundwater and pore water inpunts to the coastal zone. Biogeochemistry 66, 3–33. doi: 10.1023/B:BIOG.0000006066.21240.53
Byrne, R. H., and Kim, K.-H. (1990). Rare earth element scavenging in seawater. Geochim. Cosmochim. Acta 54, 2645–2656. doi: 10.1016/0016-7037(90)90002-3
Charette, M. A., and Allen, M. C. (2006). Precision ground water sampling in coastal aquifers using a direct-push, shielded-screen well-point system. Gr. Water Monit. Remediat. 26, 87–93. doi: 10.1111/j.1745-6592.2006.00076.x
Chevis, D. A., Johannesson, K. H., Burdige, D. J., Cable, J. E., Martin, J. B., and Roy, M. (2015b). Rare earth element cycling in a sandy subterranean estuary in Florida, USA. Mar. Chem. 176, 34–50. doi: 10.1016/j.marchem.2015.07.003
Chevis, D. A., Johannesson, K. H., Burdige, D. J., Tang, J., Bradley Moran, S., and Kelly, R. P. (2015a). Submarine groundwater discharge of rare earth elements to a tidally-mixed estuary in Southern Rhode Island. Chem. Geol. 397, 128–142. doi: 10.1016/j.chemgeo.2015.01.013
Cyris, M., Knolle, W., Richard, J., Dopp, E., Von Sonntag, C., and Schmidt, T. C. (2013). Reaction of gadolinium chelates with ozone and hydroxyl radicals. Environ. Sci. Technol. 47, 9942–9949. doi: 10.1021/es402219u
De Baar, H. J. W., Schijf, R. H., and Byrne, R. H. (1991). Solution chemistry of the rare earth elements in seawater. Eur. J. Solid State Inorg. Chem. 28, 357–373.
de Campos, F. F., and Enzweiler, J. (2016). Anthropogenic gadolinium anomalies and rare earth elements in the water of Atibaia River and Anhumas Creek, Southeast Brazil. Environ. Monit. Assess. 188:281. doi: 10.1007/s10661-016-5282-7
Duncan, T., and Shaw, T. J. (2003). The mobility of rare earth elements and redox sensitive elements in the groundwater/seawater mixing zone of a shallow coastal aquifer. Aquat. Geochemistry 9, 233–255. doi: 10.1023/B:AQUA.0000022956.20338.26
Dzombak, D. A., and Morel, F. M. M. (1990). Surface Complexation Modeling: Hydrous Ferric Oxide. New York, NY: John Wiley and Sons.
Ehlert, C., Reckhardt, A., Greskowiak, J., Liguori, B. T. P., Böning, P., Paffrath, R., et al. (2016). Transformation of silicon in a sandy beach ecosystem: Insights from stable silicon isotopes from fresh and saline groundwaters. Chem. Geol. 440, 207–218. doi: 10.1016/j.chemgeo.2016.07.015
Elderfield, H. (1988). The oceanic chemistry of rare-earth elements. Philos. Trans. R. Soc. A 325, 105–126. doi: 10.1098/rsta.1988.0046
Elderfield, H., and Greaves, M. (1982). The rare earth elements in seawater. Nature 296, 214–219. doi: 10.1038/296214a0
Flemming, B. W., and Davis, R. A. (1994). Holocene evolution, morphodynamics and sedimentology of the spiekeroog barrier island system (southern North Sea). Senck. Marit. 24, 117–155.
Flussgebietsgemeinschaft Weser (2005). EG- Wasserrahmenrichtlinie. Bewirtschaftungsplan der Flussgebietseinheit Weser. Bestandsaufnahme.
Frankignoulle, M., and Middelburg, J. J. (2002). Biogases in tidal european estuaries: The BIOGEST project. Biogeochemistry 59, 1–4. doi: 10.1023/A:1015544311392
German, C. R., Masuzawa, T., Greaves, M. J., Elderfield, H., and Edmond, J. M. (1995). Dissolved rare earth elements in the Southern Ocean: Cerium oxidation and the influence of hydrography. Geochim. Cosmochim. Acta 59, 1551–1558. doi: 10.1016/0016-7037(95)00061-4
Goldstein, S. J., and Jacobsen, S. B. (1988). Rare earth elements in river waters. Science, 89, 35–47. doi: 10.1016/0012-821X(88)90031-3
Haley, B. A., Klinkhammer, G. P., and McManus, J. (2004). Rare earth elements in pore waters of marine sediments. Geochim. Cosmochim. Acta 68, 1265–1279. doi: 10.1016/j.gca.2003.09.012
Hatje, V., Bruland, K. W., and Flegal, A. R. (2016). Increases in anthropogenic gadolinium anomalies and rare earth element concentrations in San Francisco Bay over a 20 year record. Environ. Sci. Technol. 50, 4159–4168. doi: 10.1021/acs.est.5b04322
Holzbecher, E., Knappe, A., and Pekdeger, A. (2005). Identification of degradation characteristics - Exemplified by Gd-DTPA in a large experimental column. Environ. Model. Assess. 10, 1–8. doi: 10.1007/s10666-004-4269-x
Johannesson, K. H., and Burdige, D. J. (2007). Balancing the global oceanic neodymium budget: evaluating the role of groundwater. Earth Planet. Sci. Lett. 253, 129–142. doi: 10.1016/j.epsl.2006.10.021
Johannesson, K. H., Chevis, D. A., Burdige, D. J., Cable, J. E., Martin, J. B., and Roy, M. (2011). Submarine groundwater discharge is an important net source of light and middle REEs to coastal waters of the Indian River Lagoon, Florida, USA. Geochim. Cosmochim. Acta 75, 825–843. doi: 10.1016/j.gca.2010.11.005
Johannesson, K. H., Palmore, C. D., Fackrell, J., Prouty, N. G., Swarzenski, P. W., Chevis, D. A., et al. (2017). Rare earth element behavior during groundwater-seawater mixing along the kona coast of hawaii. Geochim. Cosmochim. Acta 198, 229–258. doi: 10.1016/j.gca.2016.11.009
Kim, I., and Kim, G. (2011). Large fluxes of rare earth elements through submarine groundwater discharge (SGD) from a volcanic island, Jeju, Korea. Mar. Chem. 127, 12–19. doi: 10.1016/j.marchem.2011.07.006
Kim, I., and Kim, G. (2014). Submarine groundwater discharge as a main source of rare earth elements in coastal waters. Mar. Chem. 160, 11–17. doi: 10.1016/j.marchem.2014.01.003
Knappe, A., Möller, P., Dulski, P., and Pekdeger, A. (2005). Positive gadolinium anomaly in surface water and ground water of the urban area Berlin, Germany. Chem. Erde Geochem. 65, 167–189. doi: 10.1016/j.chemer.2004.08.004
Kulaksiz, S., and Bau, M. (2007). Contrasting behaviour of anthropogenic gadolinium and natural rare earth elements in estuaries and the gadolinium input into the North Sea. Earth Planet. Sci. Lett. 260, 361–371. doi: 10.1016/j.epsl.2007.06.016
Kulaksiz, S., and Bau, M. (2011). Rare earth elements in the Rhine River, Germany: First case of anthropogenic lanthanum as a dissolved microcontaminant in the hydrosphere. Environ. Int. 37, 973–979. doi: 10.1016/j.envint.2011.02.018
Lacan, F., and Jeandel, C. (2005). Neodymium isotopes as a new tool for quantifying exchange fluxes at the continent-ocean interface. Earth Planet. Sci. Lett. 232, 245–257. doi: 10.1016/j.epsl.2005.01.004
Linkhorst, A., Dittmar, T., and Waska, H. (2017). Molecular fractionation of dissolved organic matter in a shallow subterranean estuary: the role of the iron curtain. Environ. Sci. Technol. 51, 1312–1320. doi: 10.1021/acs.est.6b03608
Luijendijk, A., Hagenaars, G., Ranasinghe, R., Baart, F., Donchyts, G., and Aarninkhof, S. (2018). The state of the world's beaches. Sci. Rep. 8:6641. doi: 10.1038/s41598-018-24630-6
Martin, E. E., Blair, S. W., Kamenov, G. D., Scher, H. D., Bourbon, E., Basak, C., et al. (2010). Extraction of Nd isotopes from bulk deep sea sediments for paleoceanographic studies on Cenozoic time scales. Chem. Geol. 269, 414–431. doi: 10.1016/j.chemgeo.2009.10.016
Moore, W. S. (1999). The subterranean estuary: A reaction zone of ground water and sea water. Mar. Chem. 65, 111–125. doi: 10.1016/S0304-4203(99)00014-6
OOWV (Oldenburg-OstfriesischerWasserverband) (2009). Wasserrechtsantrag. Antrag auf Be Willigung Einer Grundwasserentnahme Über 180.000m3/a für das Wasserwerk Spiekeroog.
Pedreira, R. M. A., Pahnke, K., Böning, P., and Hatje, V. (2018). Tracking hospital effluent-derived gadolinium in atlantic coastal waters off Brazil. Water Res. 145, 62–72. doi: 10.1016/j.watres.2018.08.005
Pritchard, D. W. (1967). “What is an estuary: physical viewpoint,” in Estuaries, ed G. H. Lauff (Washington, DC: American Association for the Advancement of Science), 3–5.
Reckhardt, A., Beck, M., Greskowiak, J., Schnetger, B., Böttcher, M. E., Gehre, M., et al. (2017). Cycling of redox-sensitive elements in a sandy subterranean estuary of the southern North Sea. Mar. Chem. 188, 6–17. doi: 10.1016/j.marchem.2016.11.003
Reckhardt, A., Beck, M., Seidel, M., Riedel, T., Wehrmann, A., Bartholomä, A., et al. (2015). Carbon, nutrient and trace metal cycling in sandy sediments: a comparison of high-energy beaches and backbarrier tidal flats. Estuar. Coast. Shelf Sci. 159, 1–14. doi: 10.1016/j.ecss.2015.03.025
Robinson, C., Li, L., and Barry, D. A. (2007). Effect of tidal forcing on a subterranean estuary. Adv. Water Resour. 30, 851–865. doi: 10.1016/j.advwatres.2006.07.006
Röper, T., Kröger, K. F., Meyer, H., Sültenfuss, J., Greskowiak, J., and Massmann, G. (2012). Groundwater ages, recharge conditions and hydrochemical evolution of a barrier island freshwater lens (Spiekeroog, Northern Germany). J. Hydrol. 454–455, 173–186. doi: 10.1016/j.jhydrol.2012.06.011
Rousseau, T. C. C., Sonke, J. E., Chmeleff, J., Beek, P., van Souhaut, M., Boaventura, G., et al. (2015). Rapid neodymium release to marine waters from lithogenic sediments in the Amazon estuary. Nat. Commun. 6:7592. doi: 10.1038/ncomms8592
Rouxel, O., Sholkovitz, E., Charette, M., and Edwards, K. J. (2008). Iron isotope fractionation in subterranean estuaries. Geochim. Cosmochim. Acta 72, 3413–3430. doi: 10.1016/j.gca.2008.05.001
Rudnick, R. L., and Gao, S. (2003). “Composition of the continental crust,” in Treatise on Geochemistry, ed K. K. Turekian (Oxford: Pergamon), 1–64.
Schijf, J., and Christy, I. J. (2018). Effect of Mg and Ca on the stability of the MRI contrast agent Gd-DTPA in seawater. Front. Mar. Sci. 5:111. doi: 10.3389/fmars.2018.00111
Sholkovitz, E. R., Landing, W. M., and Lewis, B. L. (1994). Ocean particle chemistry - the fractionation of rare-earth elements between suspended particles and seawater. Geochim. Cosmochim. Acta 58, 1567–1579. doi: 10.1016/0016-7037(94)90559-2
Tachikawa, K., Athias, V., and Jeandel, C. (2003). Neodymium budget in the modern ocean and paleo-oceanographic implications. J. Geophys. Res. 108:3254. doi: 10.1029/1999JC000285
Takahashi, Y., Châtellier, X., Hattori, K. H., Kato, K., and Fortin, D. (2005). Adsorption of rare earth elements onto bacterial cell walls and its implication for REE sorption onto natural microbial mats. Chem. Geol. 219, 53–67. doi: 10.1016/j.chemgeo.2005.02.009
Trezzi, G., Garcia-Orellana, J., Santos-Echeandia, J., Rodellas, V., Garcia-Solsona, E., Garcia-Fernandez, G., et al. (2016). The influence of a metal-enriched mining waste deposit on submarine groundwater discharge to the coastal sea. Mar. Chem. 178, 35–45. doi: 10.1016/j.marchem.2015.12.004
Waska, H., Greskowiak, J., Ahrens, J., Beck, M., Ahmerkamp, S., Böning, P., et al. (2019). Spatial and temporal patterns of pore water chemistry in the inter-tidal zone of a high energy beach. Front. Mar. Sci. 6:154. doi: 10.3389/fmars.2019.00154
Keywords: rare earth elements, barrier island, North Sea, subterranean estuary, submarine groundwater discharge, Gd-anomaly, Ce-anomaly
Citation: Paffrath R, Pahnke K, Behrens MK, Reckhardt A, Ehlert C, Schnetger B and Brumsack H-J (2020) Rare Earth Element Behavior in a Sandy Subterranean Estuary of the Southern North Sea. Front. Mar. Sci. 7:424. doi: 10.3389/fmars.2020.00424
Received: 07 February 2020; Accepted: 14 May 2020;
Published: 12 June 2020.
Edited by:
Carlos Rocha, Trinity College Dublin, IrelandReviewed by:
Guebuem Kim, Seoul National University, South KoreaPeter Wolfgang Swarzenski, IAEA, Environment Laboratories, Monaco
Copyright © 2020 Paffrath, Pahnke, Behrens, Reckhardt, Ehlert, Schnetger and Brumsack. This is an open-access article distributed under the terms of the Creative Commons Attribution License (CC BY). The use, distribution or reproduction in other forums is permitted, provided the original author(s) and the copyright owner(s) are credited and that the original publication in this journal is cited, in accordance with accepted academic practice. No use, distribution or reproduction is permitted which does not comply with these terms.
*Correspondence: Ronja Paffrath, ronja.paffrath@uni-oldenburg.de