Article

Design and Numerical Analysis of Flow Characteristics in a Scaled Volute and Vaned Nozzle of Radial Turbocharger Turbines

by
Andrés Omar Tiseira Izaguirre
,
Roberto Navarro García
,
Lukas Benjamin Inhestern
and
Natalia Hervás Gómez
*,†
CMT Motores Térmicos, Universitat Politècnica de València, 46022 València, Spain
*
Author to whom correspondence should be addressed.
These authors contributed equally to this work.
Energies 2020, 13(11), 2930; https://doi.org/10.3390/en13112930
Submission received: 3 May 2020 / Revised: 21 May 2020 / Accepted: 29 May 2020 / Published: 7 June 2020
(This article belongs to the Special Issue Machine-Learning Methods for Complex Flows)

Abstract

:
Over the past few decades, the aerodynamic improvements of turbocharger turbines contributed significantly to the overall efficiency augmentation and the advancements in downsizing of internal combustion engines. Due to the compact size of automotive turbochargers, the experimental measurement of the complex internal aerodynamics has been insufficiently studied. Hence, turbine designs mostly rely on the results of numerical simulations and the validation of zero-dimensional parameters as efficiency and reduced mass flow. To push the aerodynamic development even further, a precise validation of three-dimensional flow patterns predicted by applied computational fluid dynamics (CFD) methods is in need. This paper presents the design of an up-scaled volute-stator model, which allows optical experimental measurement techniques. In a preliminary step, numerical results indicate that the enlarged geometry will be representative of the flow patterns and characteristic non-dimensional numbers at defined flow sections of the real size turbine. Limitations due to rotor-stator interactions are highlighted. Measurement sections of interest for available measurement techniques are predefined.

1. Introduction

European standards on pollution emissions regulate the acceptable limits for exhaust emissions of newly purchased vehicles with internal combustion engines in the European Union. In 2014, the last regulation on the exhaust gas emissions of diesel and gasoline engines came into force as the Euro 6 norm [1]. This situation adds to the continuous trend towards energy savings, demanding increasingly efficient automotive internal combustion engines compatible with new laws on environmental protection in Europe [2]. In the last 10 years, the automotive industry has opted for the development of systems such as supercharging, which has become a key for fulfilling government restrictions [3,4,5]. Supercharging has helped to decrease the engine displacement, while maintaining the power performance (downsizing) [6]. The most commonly used technique to increase the engine intake pressure is turbocharging, where mostly a centrifugal compressor is powered by a radial turbine [7]. Both elements are joined by means of a shaft, lubricated and equipped with bearings. The operation of the compressor and thus the compression of the intake air depends on the work contributed by the turbine. As the turbine takes advantage of the exhaust energy of the combustion engine, a highly coupled dependency on the operation behavior results. To enable a satisfying matching of turbocharger and engine, mechanical or aerodynamic limits [8,9] are continuously attempted to be extended while component efficiencies are attempted to be improved. The efficiency of the turbo depends on mechanical losses, heat transmission, and most importantly, on the aerodynamic design of its internal geometry [10,11,12].
The turbine has three main components: the volute; the stator, made up of vanes or spans, and the rotor. The flow passes through the volute, is distributed between the stator vanes, and finally, circulates towards the rotor. Viscous flow phenomena in the volute and stator can decrease the overall efficiency of the turbine and, thus, of the entire system. Some authors mention the importance of volute design and the relationship of fluid behavior depending on the location of the tongue and the final cross-sectional area of the volute itself [13]. Due to the variation in the speed and the dynamic pressure along the volute, the distribution of the flow over the stator channels may change, causing efficiency losses in the turbine. The tip leakage vortex of the stator vane causes losses and has a significant impact on inflow angle distortions, leading to inhomogeneous rotor inflow [14,15] and the related efficiency losses of the entire turbine [16,17].
The information of the flow behavior is important to feed mathematical models that do not require a great computational capacity as 1D models [18]. These models are used to simulate the supercharging system in the engine. The 1D tool is used in research to predict the motor behavior and its systems [19].
Computational fluid dynamic (CFD) tools are useful for analyzing detailed aerodynamic phenomena in a wide range of turbine operating conditions [20]. However, the results must be validated with experimental data. Obtaining experimental data is difficult due to the limited space for the required internal instrumentation. In a bigger radial turbine, Hayami et al. [16] were able to measure the angle distribution downstream of the stator vanes by means of cobra probes. In a slightly smaller geometry, Tamaki et al. [21] applied oil flow visualization to image the shear forces on the surface of the stator passages. Currently, there are few works dedicated to the experimental measurement of internal flow in small-sized centripetal turbines [22,23,24], such as those used in automotive supercharging systems. Hence, the most common way to compare numerical results is by means of global 1D data as efficiency and reduced mass flow, obtained from measurements upstream and downstream of the turbine. The solution is to build a larger scale model of the original geometry. For this, a theoretical study has been previously developed with the subsequent construction and global characterization [25]. There are few works such as those developed by Ioannou et al. [26] and Dufour et al. [27], in which some component of the turbocharger is also scaled. However, none of them is applicable in the present work due to the absence of a rotor.
Therefore, this work is focused on characterizing the internal flow of a larger scale turbine volute and stator. Consequently, this article describes, first, the design and the generation of the computational scale model. Next, it shows the mesh analysis. Following, a comparison of the numerical results of the up-scaled geometry with the results obtained from a separate study in the originally sized turbine with rotor is conducted. Finally, the limitations for the validity of the scaled model and recommendations for measurements to characterize the flow of the presented and future geometries are given.

2. Scaled Volute and Vaned Nozzle

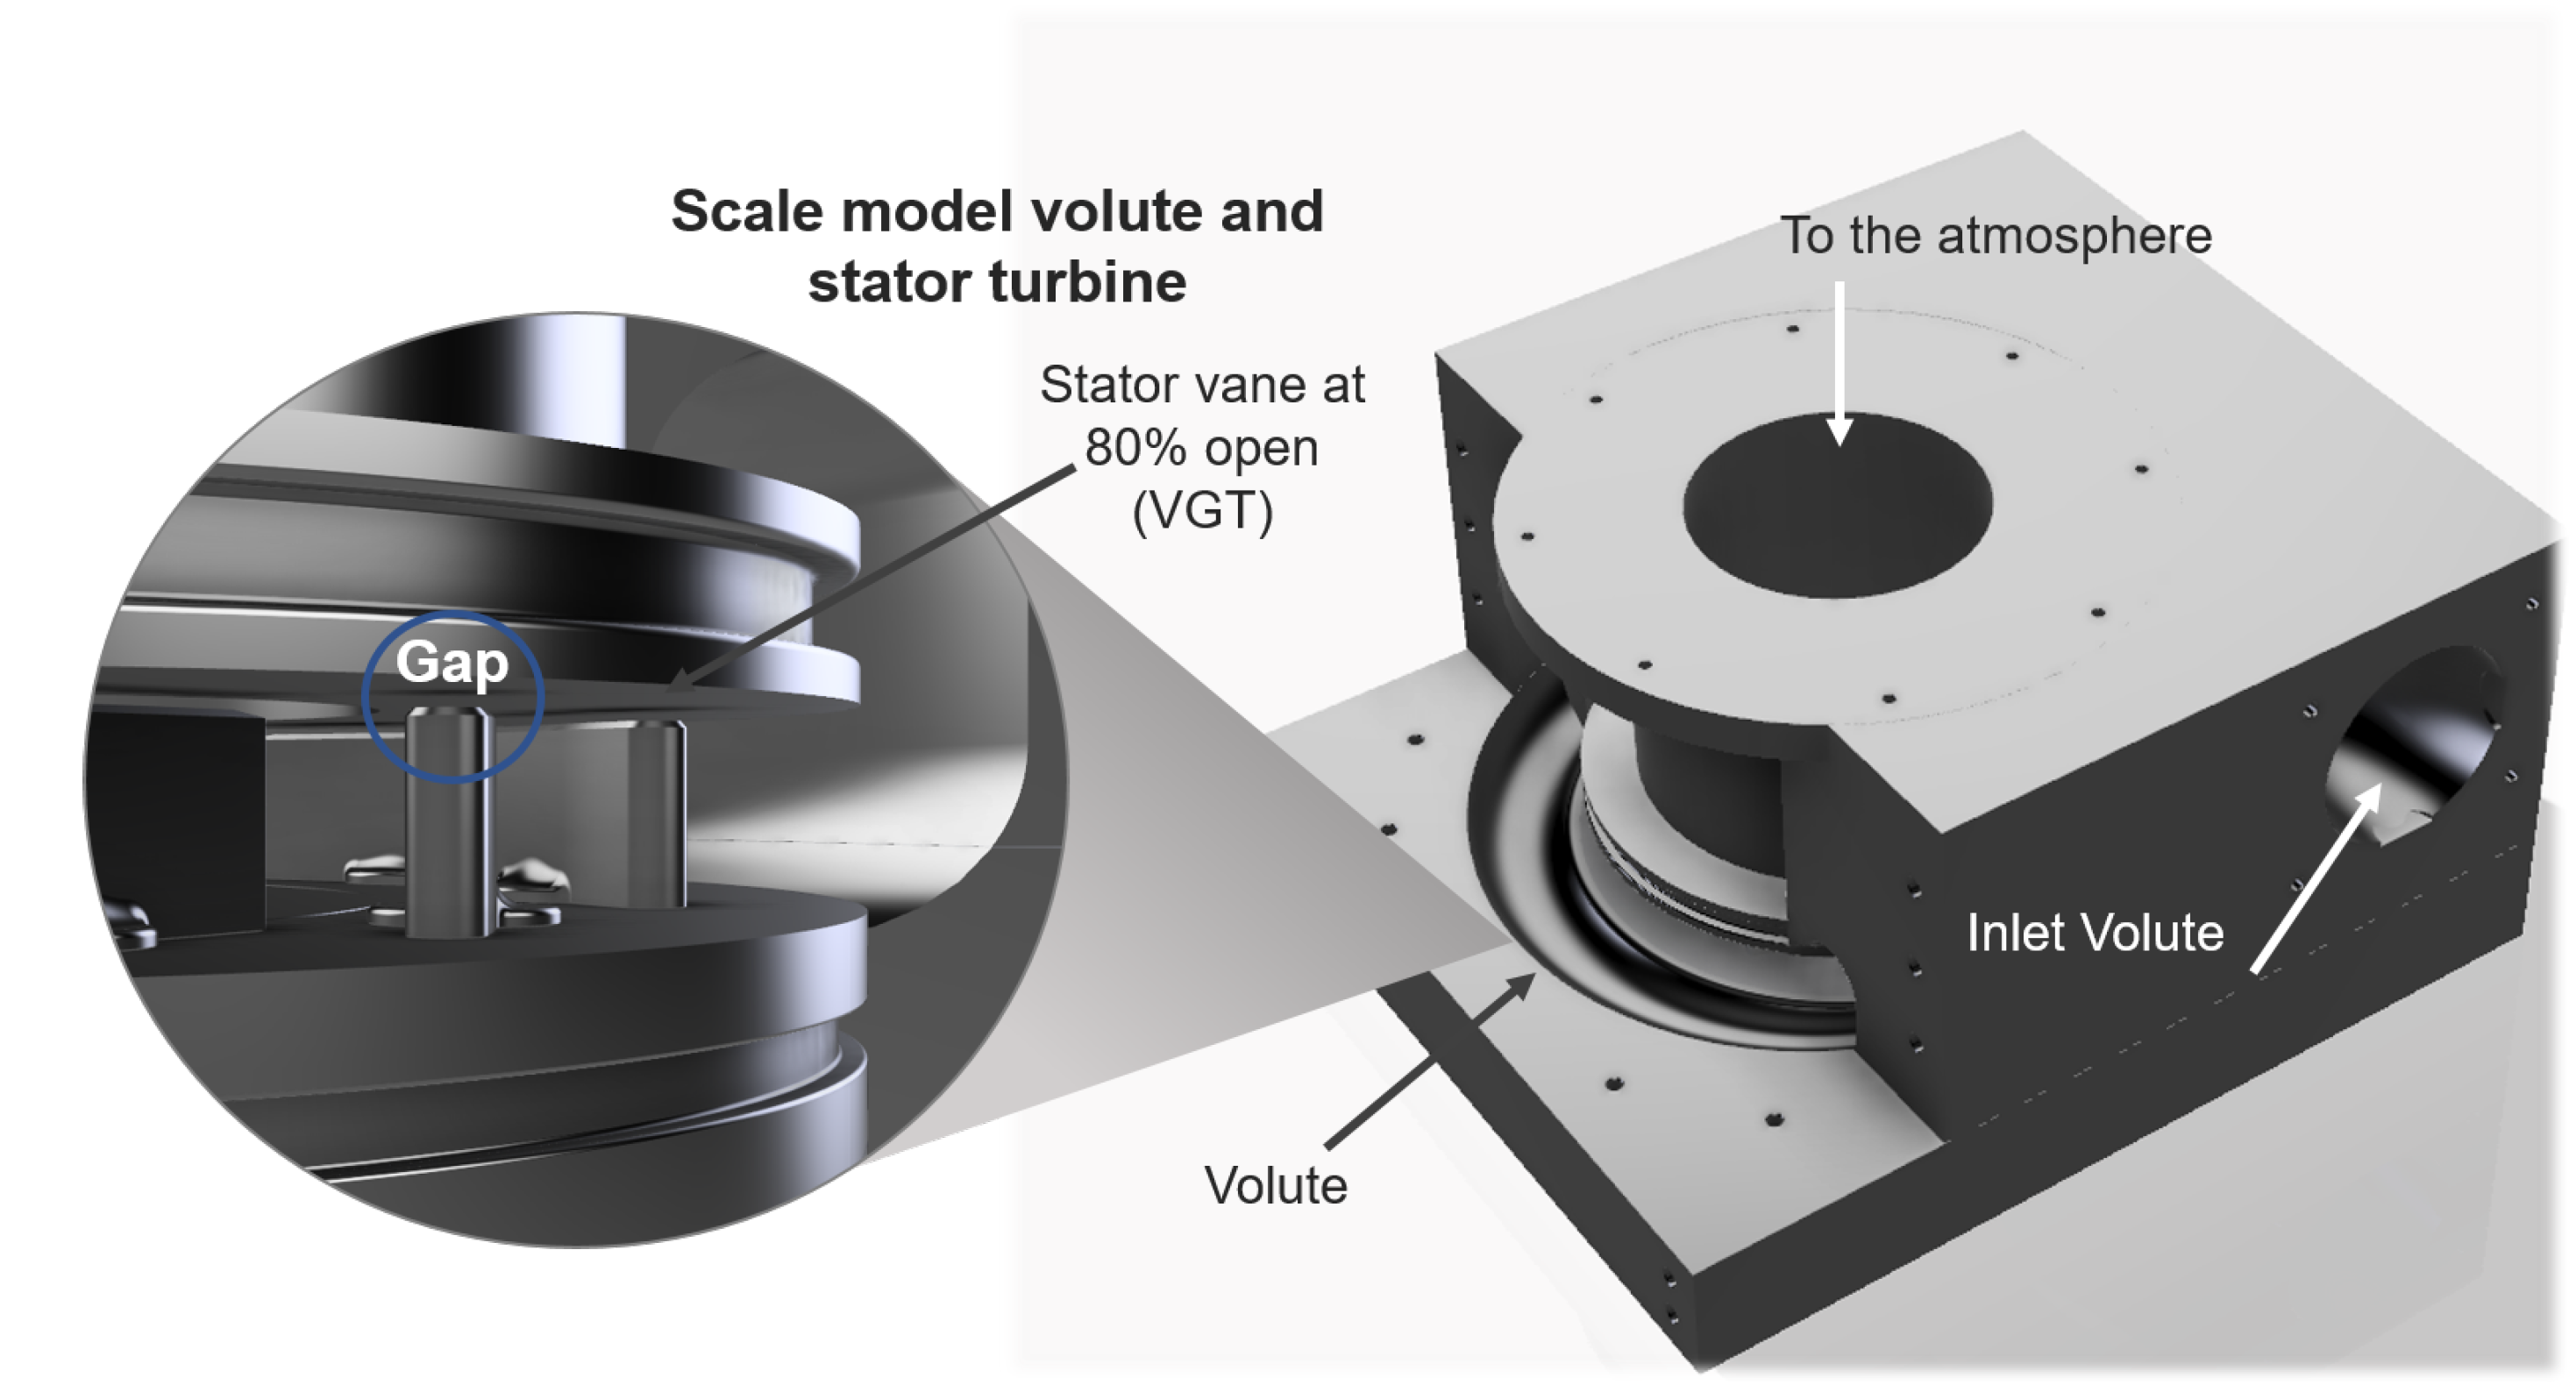
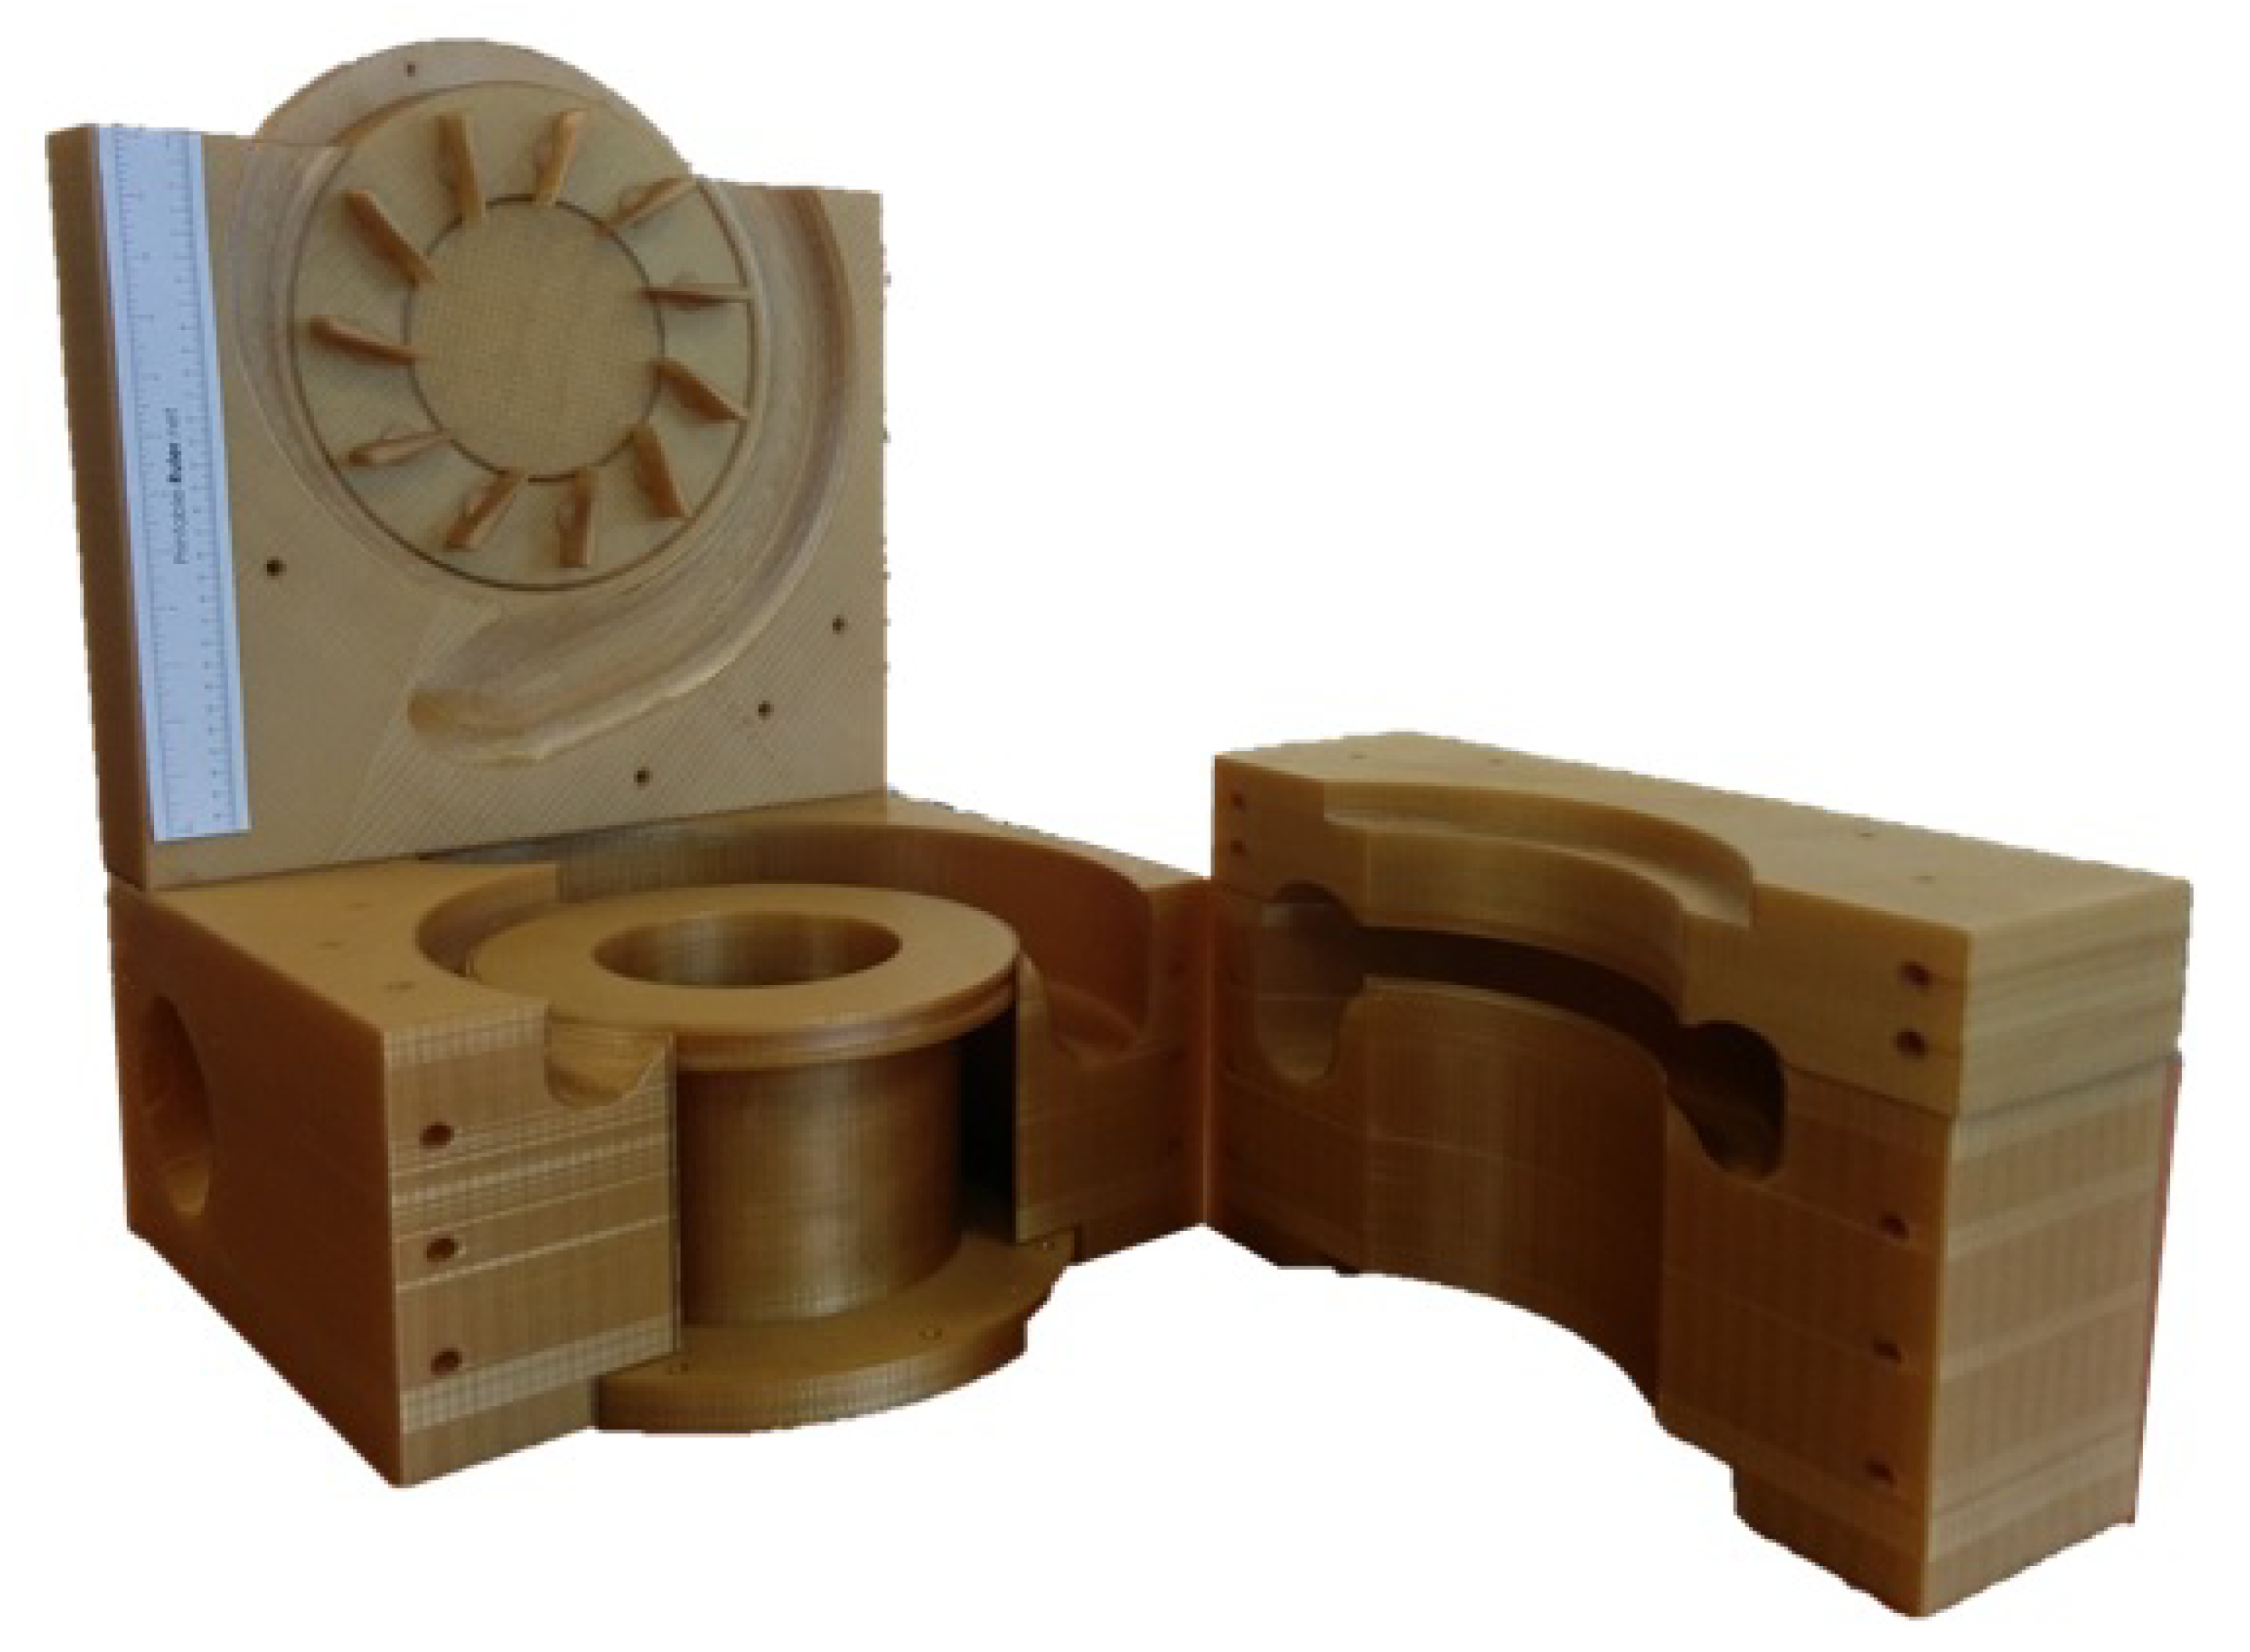
Due to the small dimensions of the typically used turbocharger turbines and limited accessibility, the turbine geometry of a commercially used turbocharger turbine was scaled in its size. Here, only the stationary components as the volute and stator were designed with a scale factor of three in comparison to the actual turbine dimensions. The dimensions of the real size turbocharger turbine and the dimensions of the scaled turbine are listed in Table 1. The scaling ratio of 3:1 turned out to represent a reasonable balance between manufacturing costs, operable running condition at the test bench, which was limited by a maximum mass flow of 1200 kg/h, and the accessibility for optical measurements. However, some modifications of the original geometry were made to allow more generally valid conclusions of future analysis. Separator pins, which existed in the geometry of the real size turbine in the stator passage, were removed to avoid aerodynamically biased conclusions of the volute and stator vane designs. This appreciable difference was due to two reasons. The first referred to being able to study the discharge of the volute on the stator blades without obstacles. The second reason was to compare the free flow field of each stator channel without disturbing elements like a column. In the future, studies will be carried out on the geometric variation of the stator vanes, and the behavior of each channel will be compared, varying the vane and the gap height of the vane. A modular structure of the scaled model was chosen to allow future modification and experiments with advanced designs, as well as investigating several VGT openings. Furthermore, the turbine rotor was not considered in the first design of the test setup. The construction of the rotor would significantly elevate the costs and would also bias the aerodynamics of future designs by the rotor-stator interactions. The validation of CFD models in the volute stator domain by means of 3D flow analysis is one of the main objectives of the future experimental activities. This validation would be independent of the existence of the rotor in the scaled turbine. However, the impact of the rotor-stator interaction on predominant flow patterns and the reproduction of those flow patterns in the scaled turbine were assessed in this paper.
For this study, a VGT opening of 80%, a position representative of the operation of the turbine at various engine operating points [28], was chosen. At the same time, it was one of the rather opened positions, which moved the vane trailing edge relatively close to the rotor of a real turbine geometry. Hence, a comparison of numerically obtained flow patterns in a real size turbine with rotor and in the scaled model gave the opportunity to evaluate the given range of validity in the scaled model, since the rotor was not considered, and no stator-rotor interaction existed.
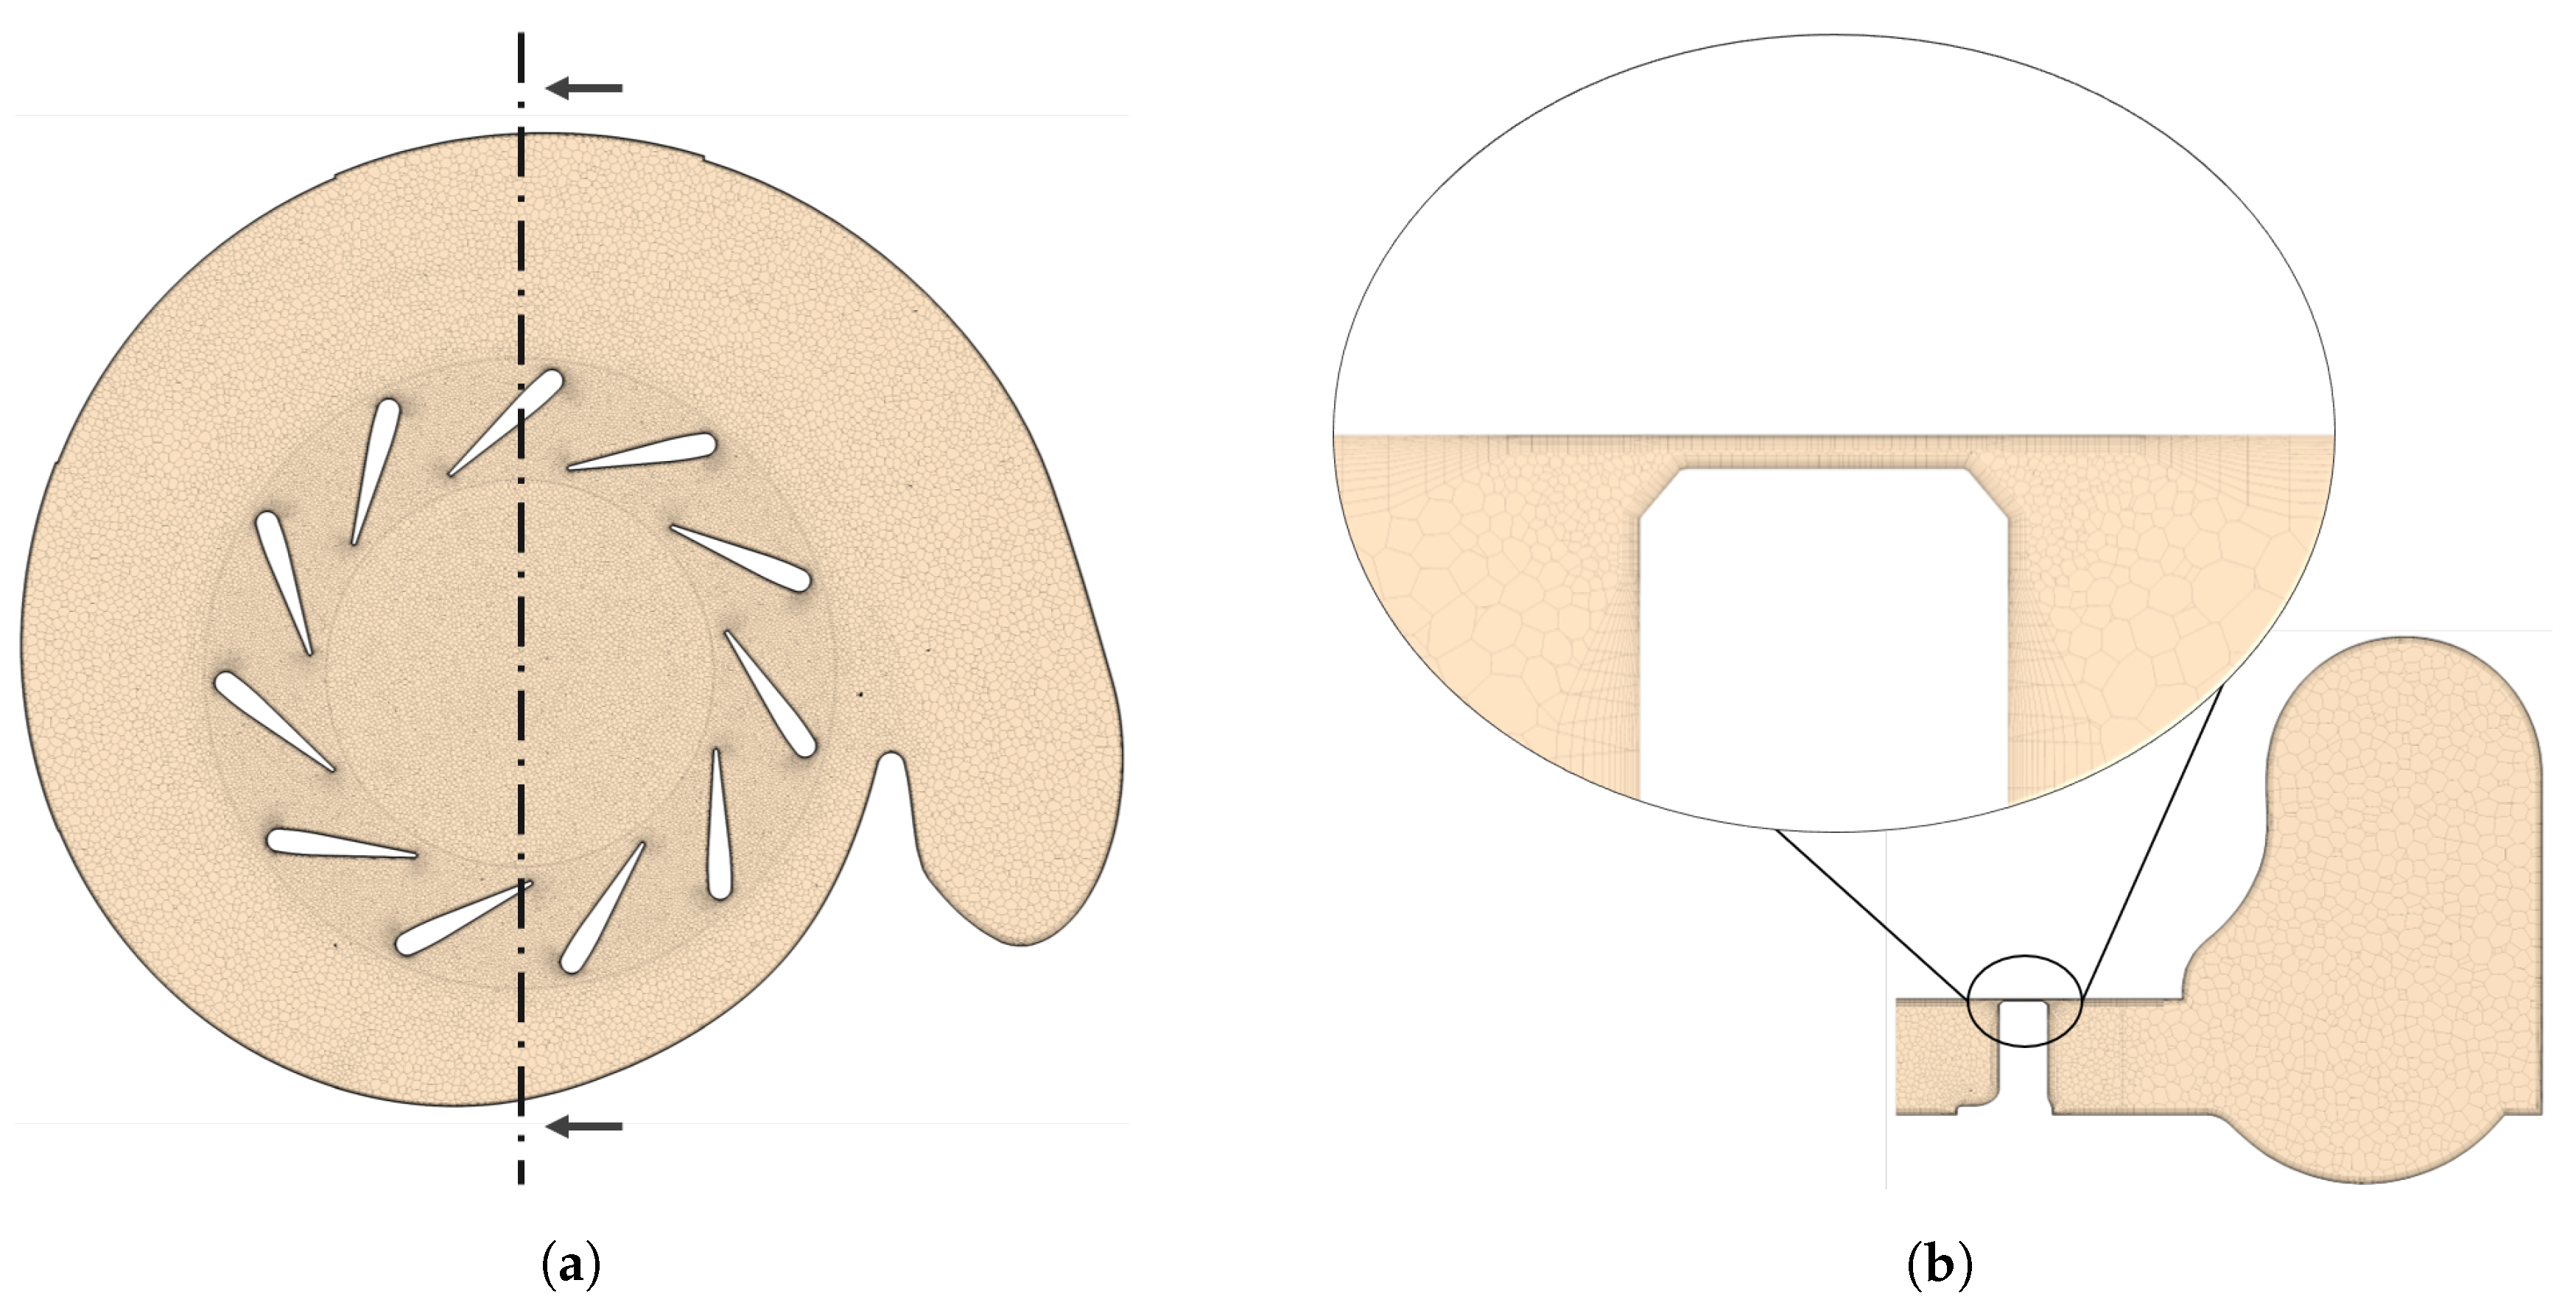
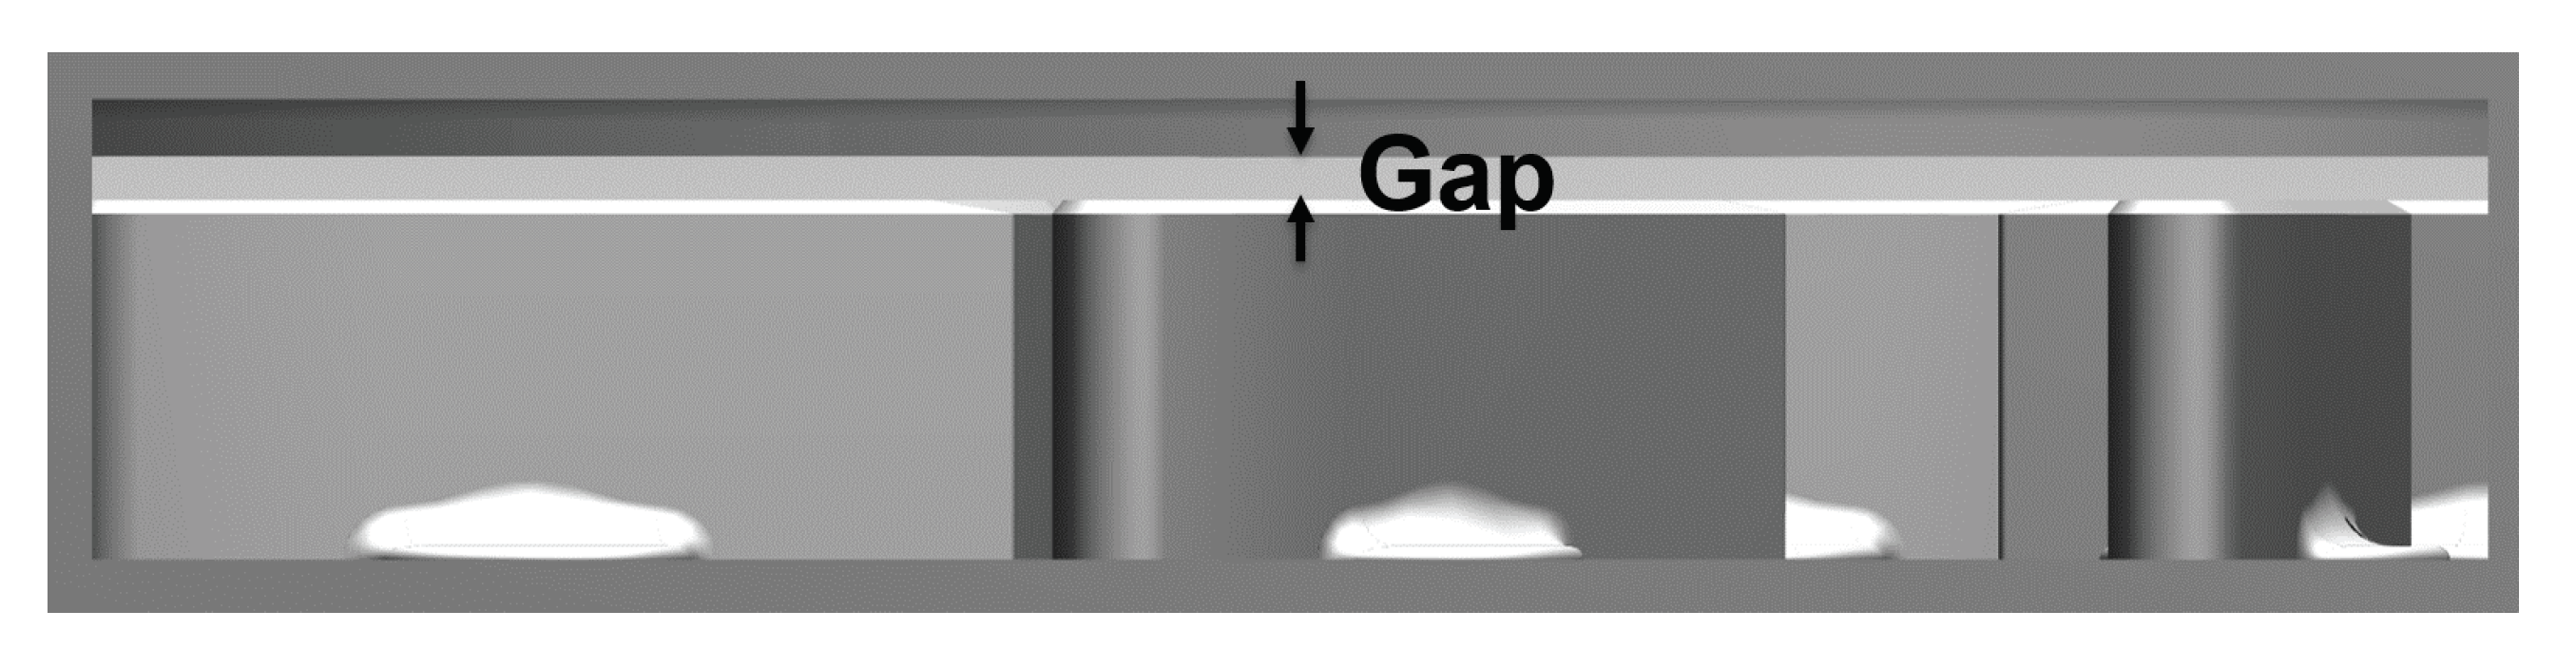
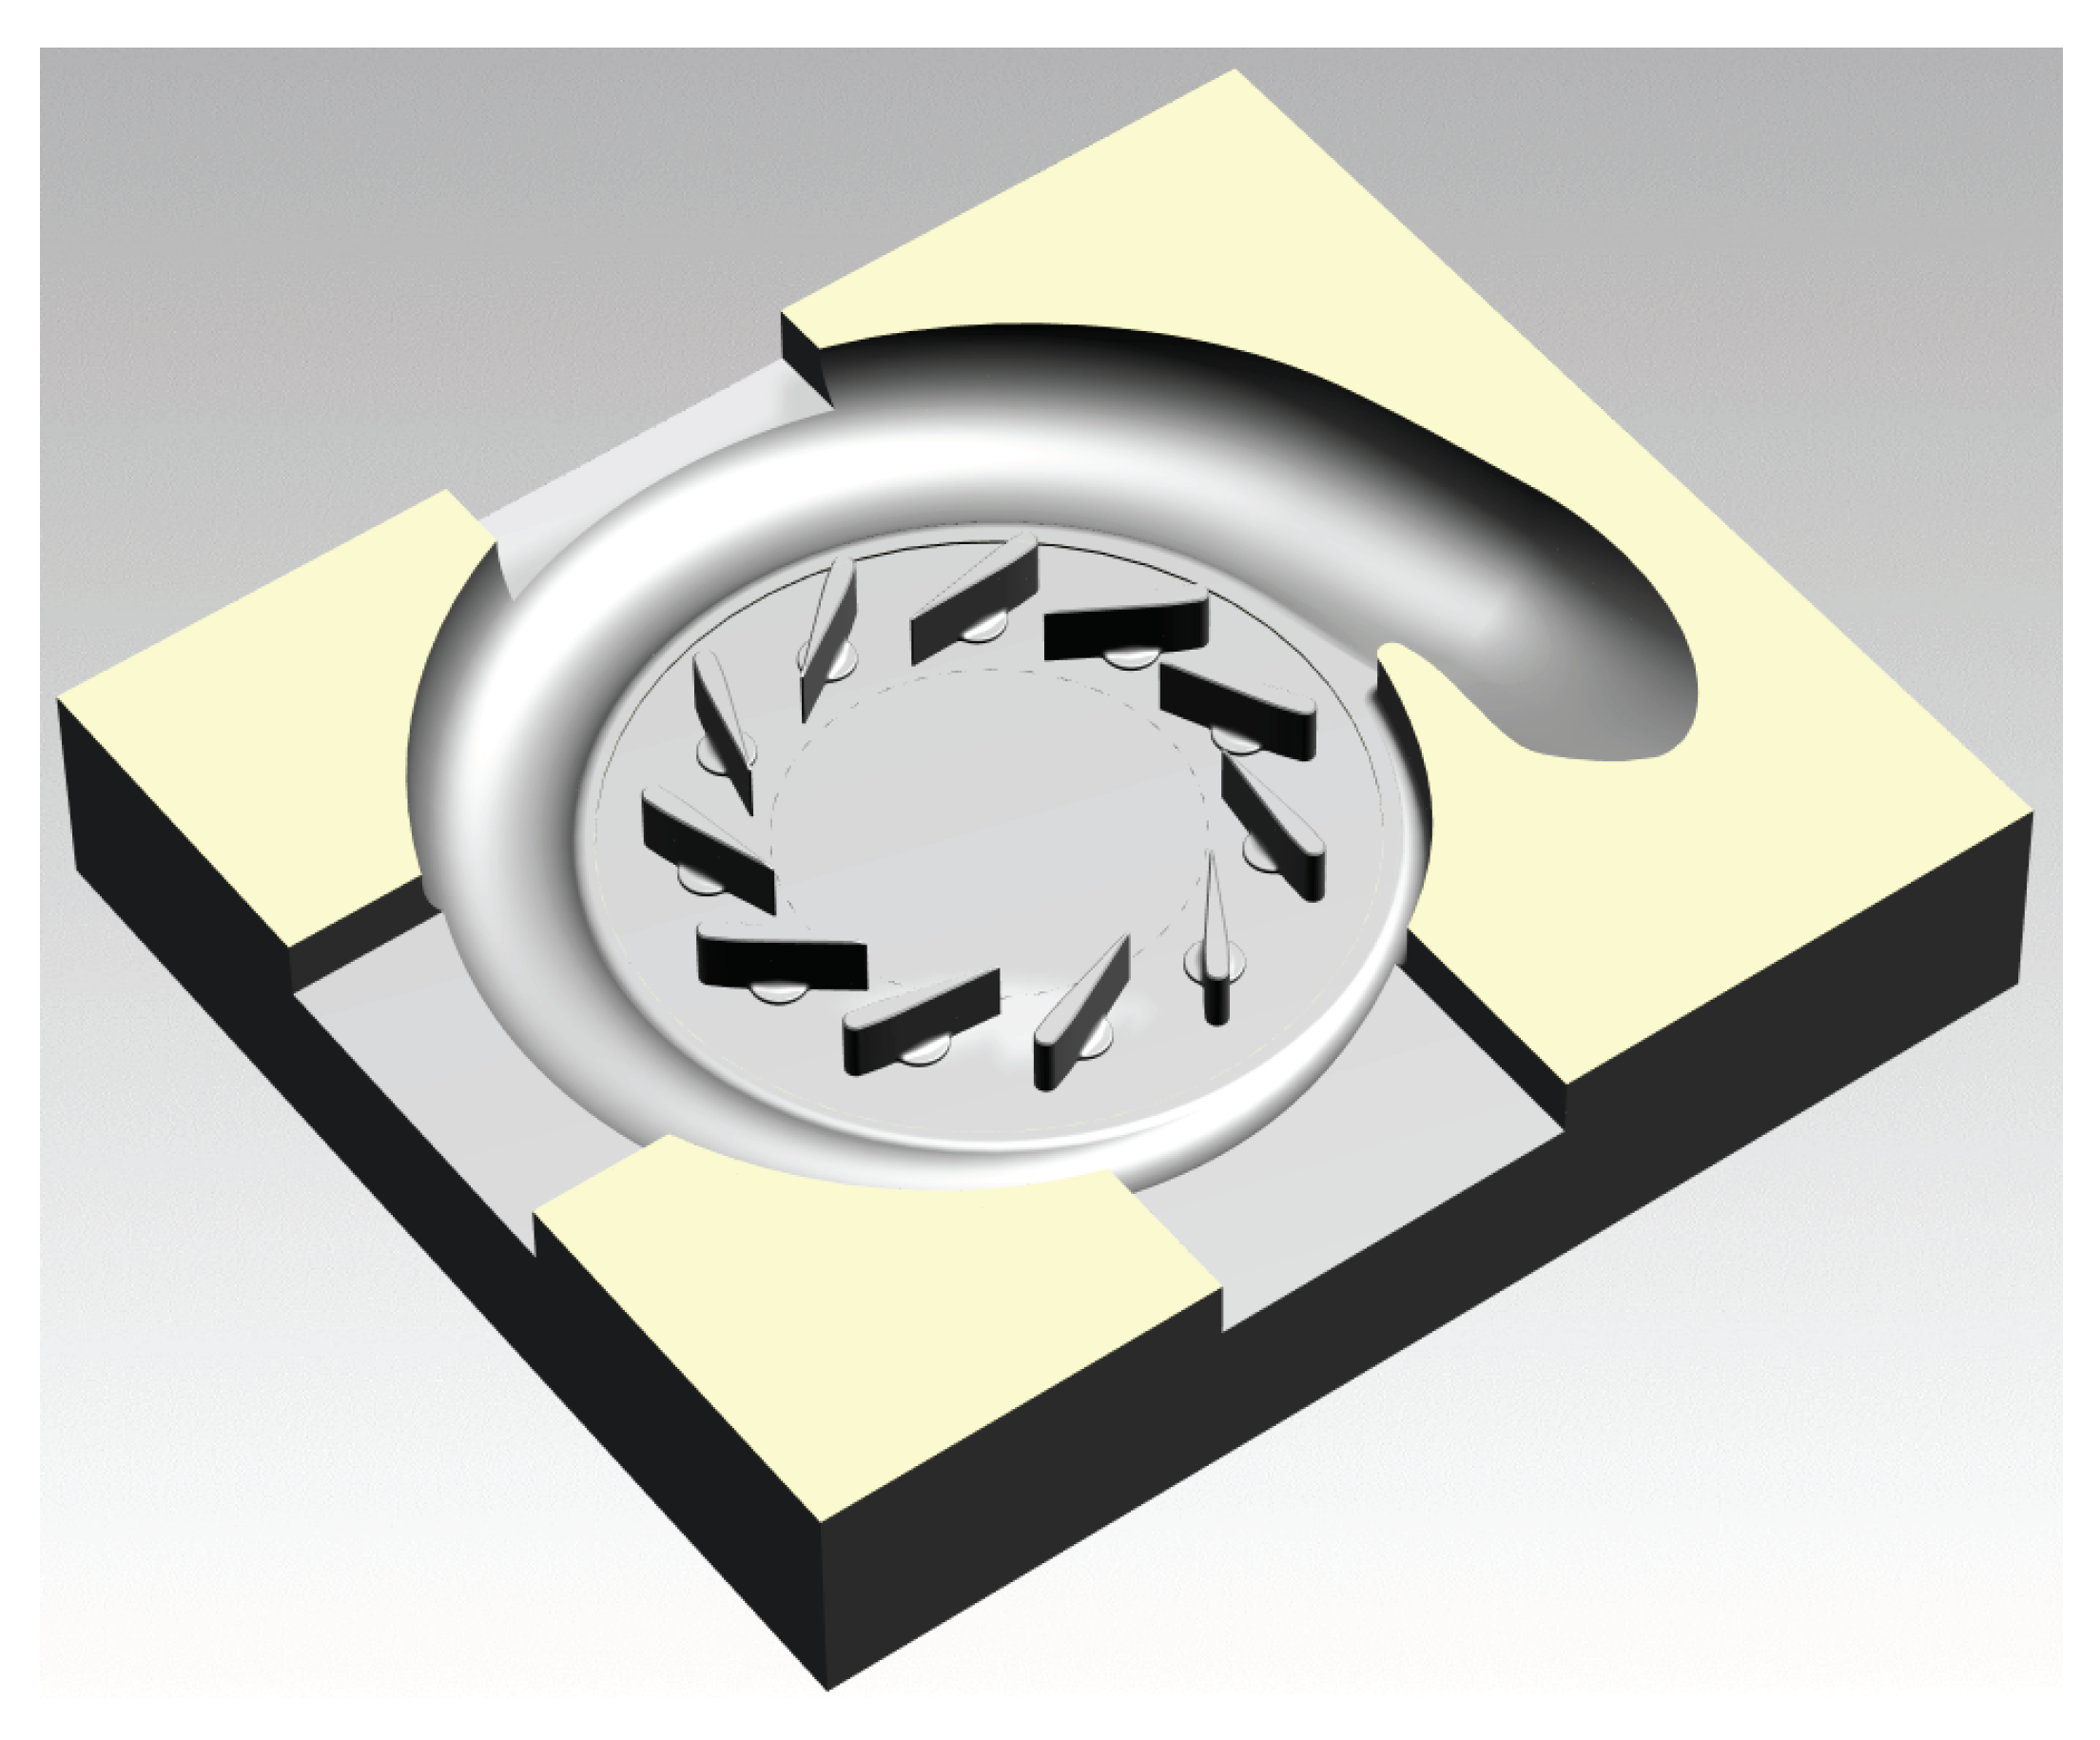
Initially, a stator gap height of the model of 0.5 mm was chosen, to achieve the Reynolds similitude at operating points with reasonably high reduced mass flow. 
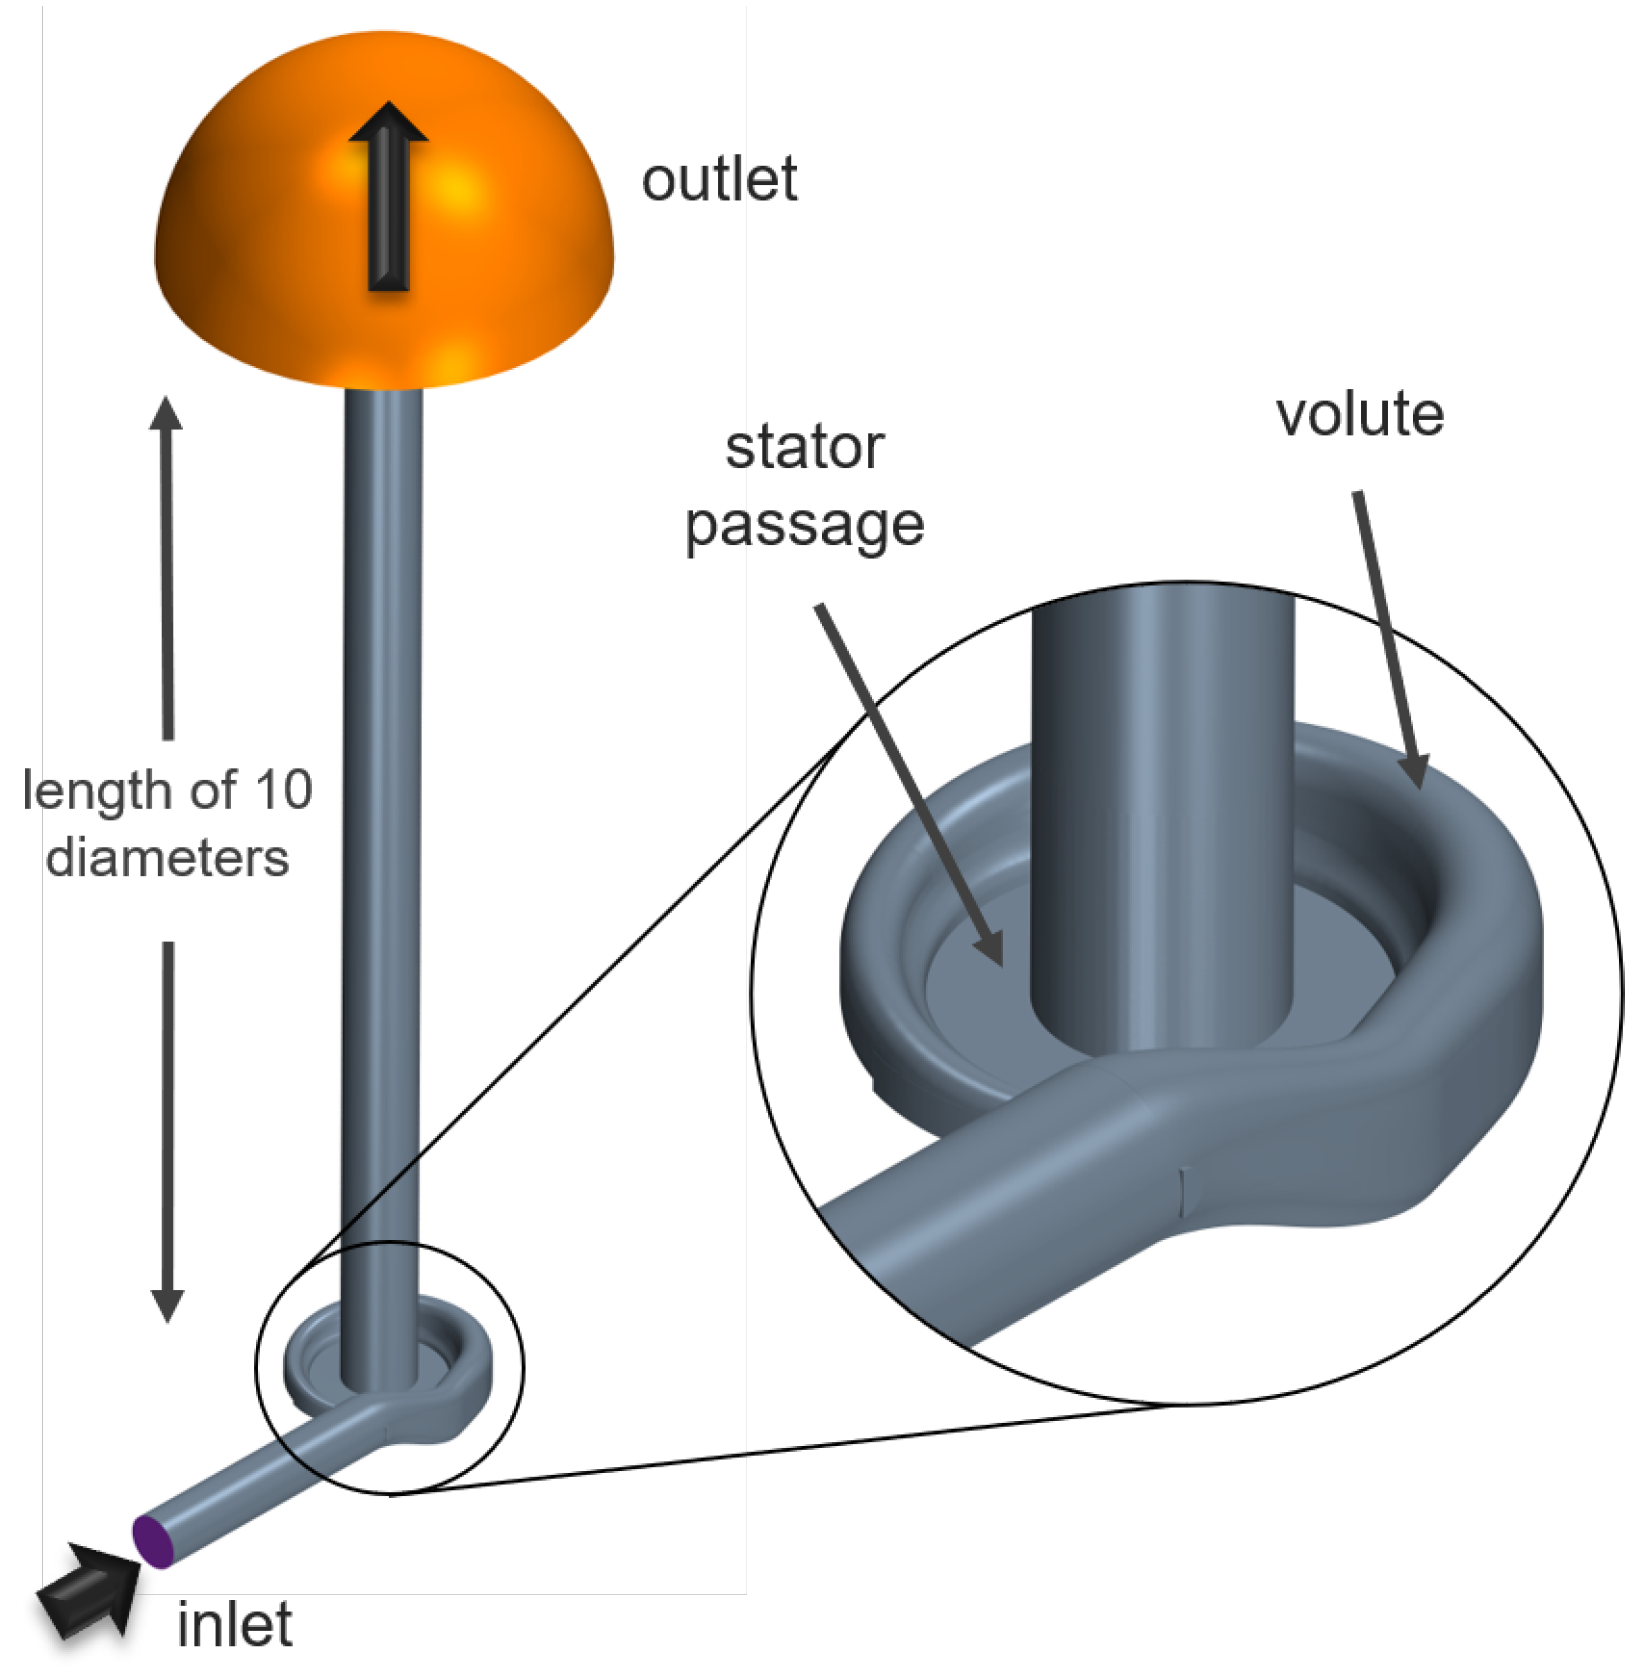
Figure 1 shows the design of the scaled volute and stator, where the space between the vane and the housing of the turbine is defined.
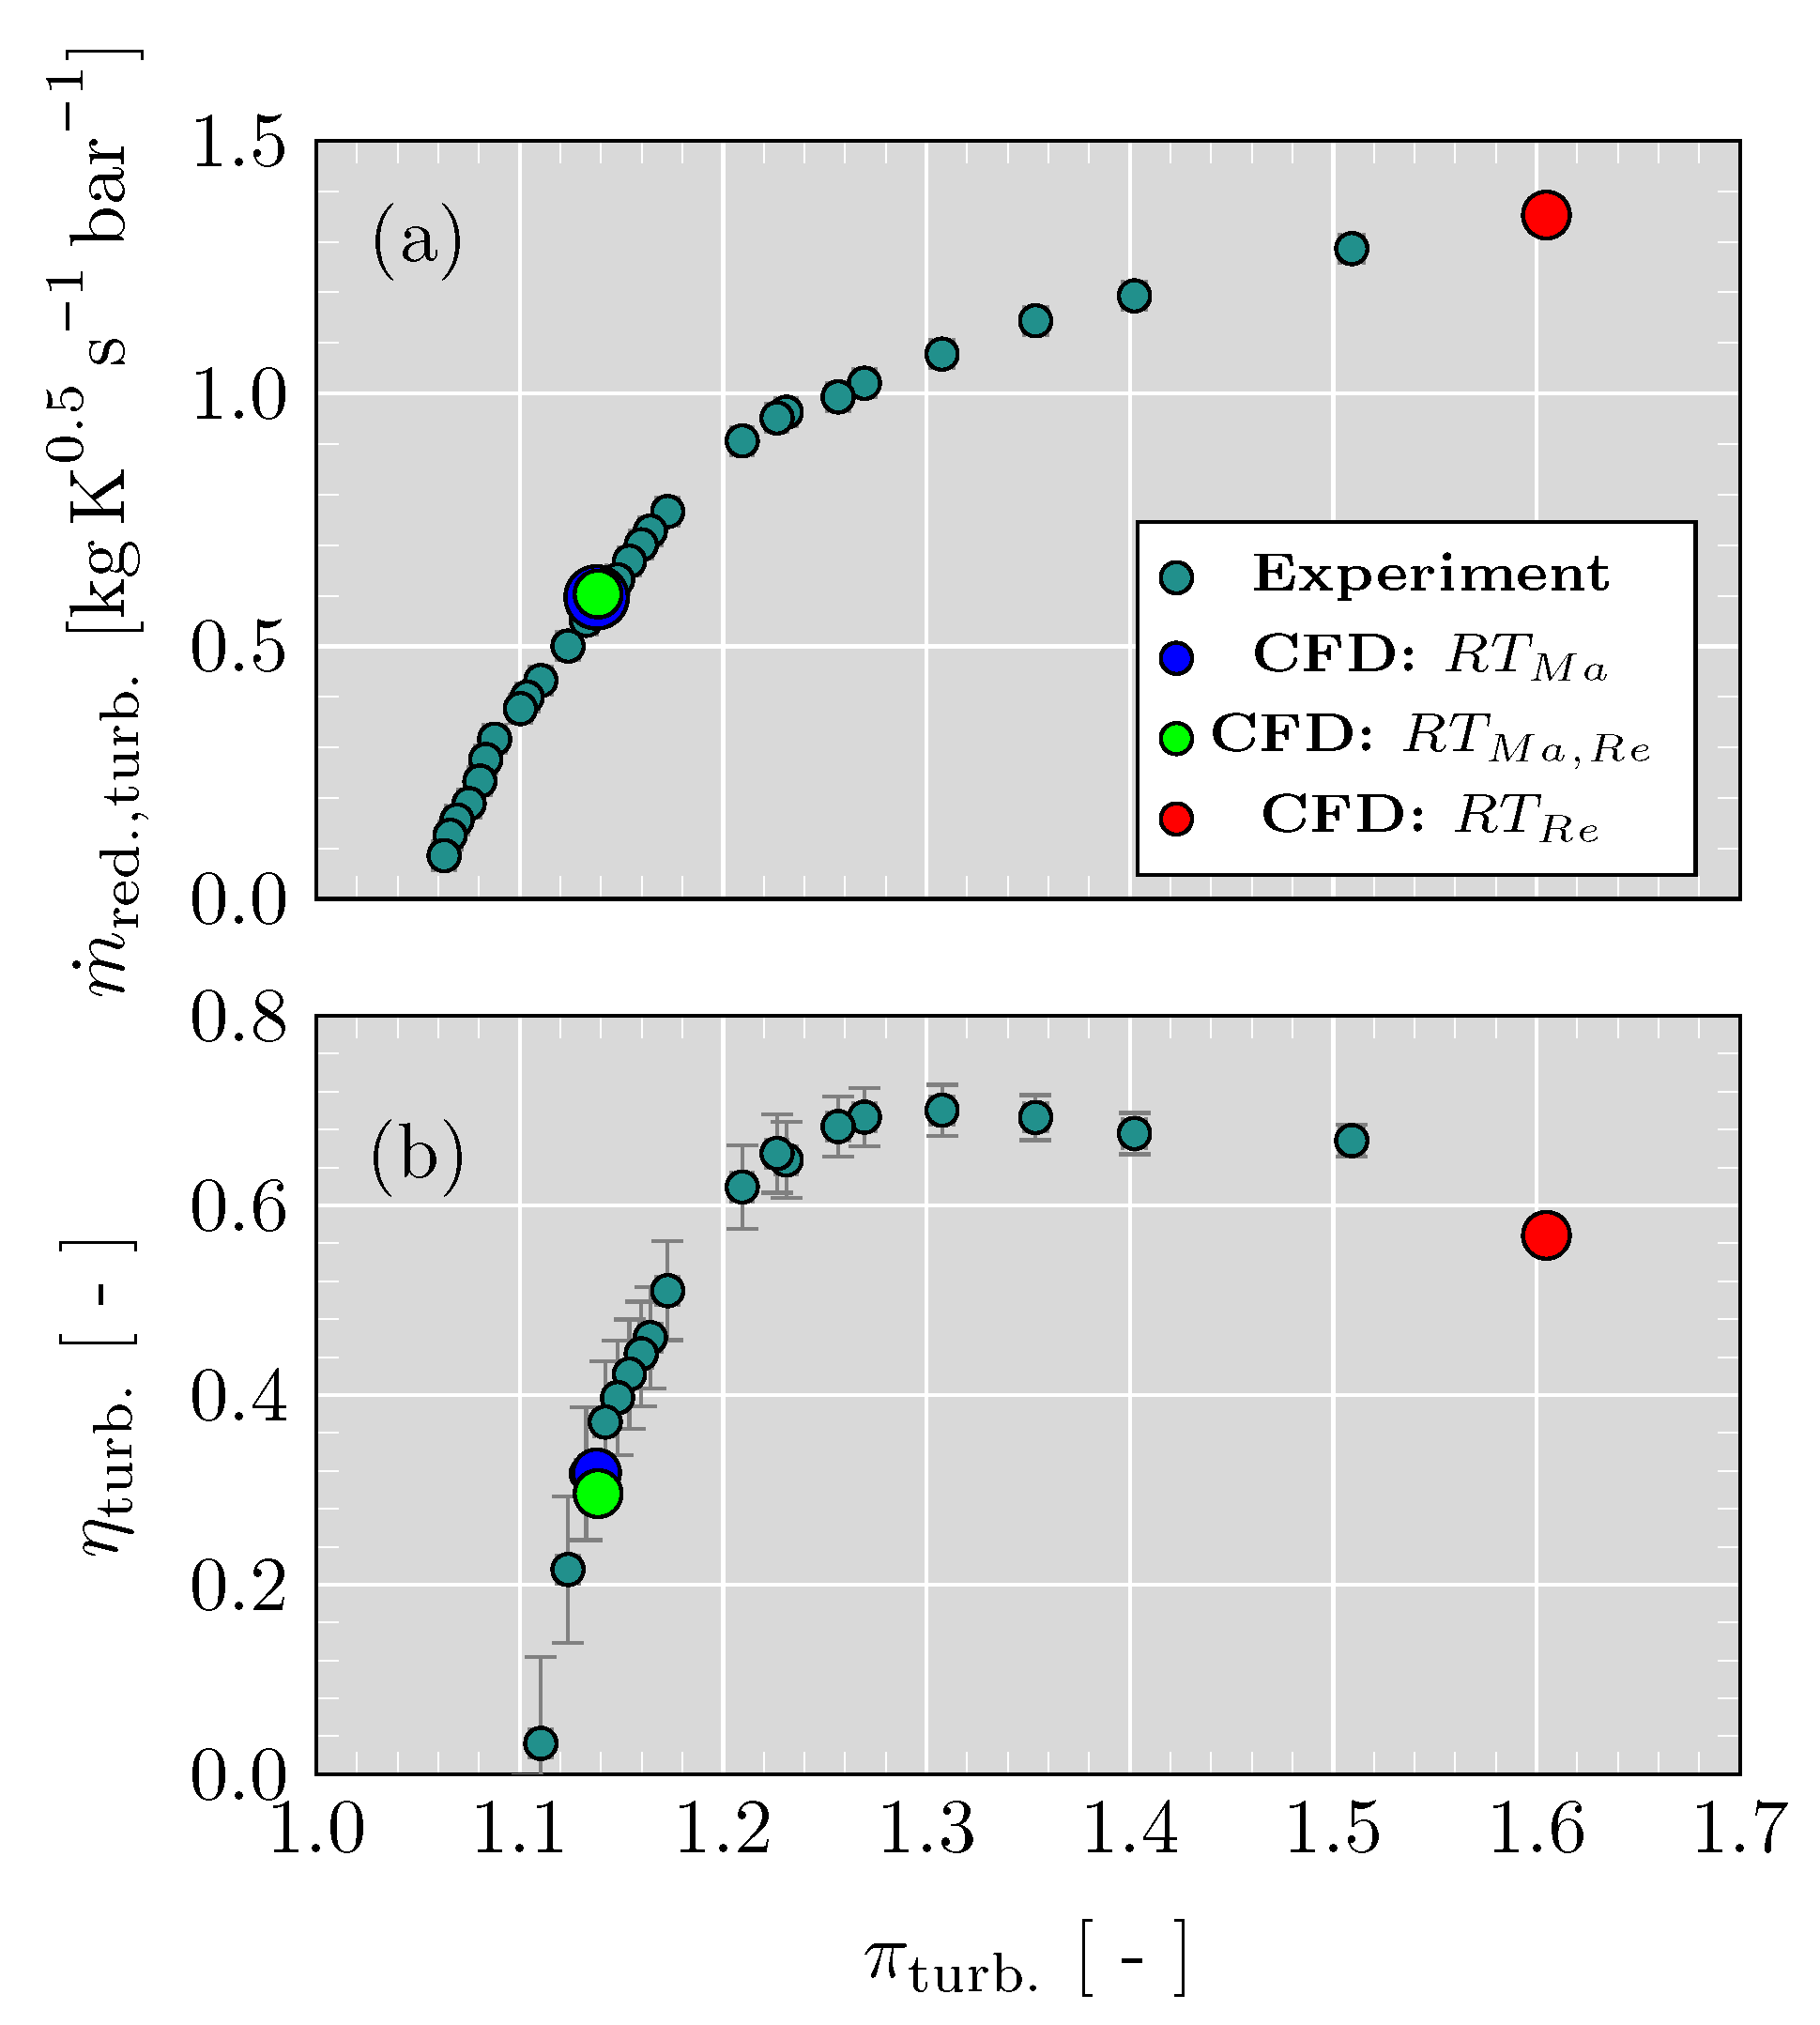
For the characterization of turbocharger turbines, performance maps were obtained in steady flow conditions at different operating points [29]. Since the difference of fluid properties of fresh air and exhaust gases could be neglected [30], those measurements have been typically executed with air. Hence, also for the presented study, steady flow with fresh air was analyzed.

3. Numerical Setup

The computational domain was designed as shown in Figure 2. In the outlet of the turbine, a duct with a length of ten duct diameters was placed. As shown in the experimental setup, the flow would be discharged to the atmosphere with atmospheric pressure.
For the numerical campaign, the commercial CFD simulation software STAR-CCM+ 14.02.010-R8 was utilized. Air modeled as the ideal gas was simulated. This was a valid assumption, since the variation of the static temperature was low in the observed cases. Reynolds-averaged Navier-0Stokes (RANS) equations were solved with a coupled solver. Turbulence closure was obtained by the k- ω SST model [31]. The employed RANS k- ω SST turbulence model was developed to improve the prediction of flows that suffered adverse gradients and boundary layer separation. This model is widely used for turbomachinery applications, being validated against experimental measurements by the research community [32,33].

3.1. Operating Points

The turbine operating point need to be chosen carefully in terms of Mach number similarity and Reynolds number similarity. While the first might cause a similar Mach number distribution and blade loading, a comparable Reynolds number was desired to achieve adequate predictions of separation patterns and tip leakage flow characteristics inside the gap. As a reference, the maximum suppliable mass flow and corresponding pressure and inlet total temperature in the test bench, where the scaled model would be tested, were applied for this analysis. At this operating point, the strongest impact of viscous effects as flow separations was expected.
In comparison, three operating points in the real size turbocharger were evaluated: one fulfilling the Reynolds similarity, one fulfilling the Mach similarity, and one fulfilling the Mach, as well as the Reynolds similarity. Cases with Mach similarity were obtained by targeting one ninth of the reduced mass flow, which could be achieved in the test bench of the scaled turbine model ( S T ).
m ˙ i = ρ i V i π D i 2 4
ρ R T V R T D R T μ R T = ρ S T V S T D S T μ S T
Applying the mass flow rate Equation (1) for R T and S T and combining with the condition of equal Reynolds numbers in Equation (2), the following relation can be derived:
m ˙ R T = μ R T μ S T D R T D S T m ˙ S T
The objective mass flow for the cases with the same Reynolds number were achieved by applying Equation (3), which resulted in around one third of the mass flow of the S T in the real size model ( R T ). The case where both similarities were achieved was reached by reducing the reduced mass flow to one ninth the scaled reduced mass flow due to tripling the inlet total pressure. Assuming Mach similarity, static and absolute values were interchangeable when comparing two cases. Hence, the increase of total inlet pressure resulted in the required increase of density resulting in the objective reduction of the mass flow and reduced mass flow. To achieve these desired values, the back pressure had to be adjusted after increasing the total inlet pressure.
Due to the typical small size of automotive turbocharger turbines, the performance map measurement is highly affected by heat transfer [34,35]. Hence, quasi-adiabatic measurements have become a common practice in research. In those measurements, the turbine inlet temperature is low to reduce heat transfer towards other parts. It has been demonstrated that the turbine maps obtained for hot conditions and cold conditions have the same aerodynamic (adiabatic) efficiency [36,37]. This was the reason to choose a low temperature as the boundary condition for this study. Further, the experimental installation of the scaled model was rather suited for low temperature tests. As total inlet temperature for all cases 343.15 K was set, which was similar to the values obtained in the quasi-adiabatic experiments of the R T in this region of the map [38] and a possible temperature for the measurements in the S T . The final boundary conditions for all cases are listed in Table 2.
For the simulations of the R T , an intermediate reduced rotational speed of 3890 rpm/K 0.5 was chosen. This speed-line was experimentally measured in a wide range in the adapted flow bench for the characterization of radial turbines and centrifugal compressors [38]. The global results obtained with the real size model were previously validated [39] with the experimentally obtained map data. Furthermore, the selected operating points for this study showed good agreement with the experimental data, as depicted in Figure 3.

3.2. Mesh Analysis for the Scaled Model

As the operating point for the mesh analysis of the scaled model, the aforementioned point was used as it had the maximum available mass flow and Reynolds number. For the mesh generation of a unstructured mesh, the automatic mesher integrated in STAR-CCM+ 14.02.010-R8 was used. To resolve the boundary layer, a prism layer mesh was chosen, while the core of the flow volume was discretized by means of tetrahedral cells. To guarantee a valid mesh, a detailed mesh analysis was performed. Therefore, the boundary layer mesh and core mesh were varied independently. Since the analysis of the viscous effects is the main focus of this article, special attention was paid to the adequate meshing of the boundary layer. The necessary thickness of the boundary layer mesh was estimated from a previous simulation with an overly thick prism layer mesh and numerous layers. Following this, a constant thickness of 1.25 mm for the prism layer mesh was imposed for the mesh convergence analysis. Hence, four different prism layer mesh configurations, which varied the cell numbers from eight to 19, were generated. In combination, the core mesh was changed to three different densities. Hence, overall, twelve different meshes formed the basis of this mesh generation. Three of the four different prism layer meshes generated results in an acceptable range for the application in combination with the k- ω SST turbulence model [40]. Two of those could be considered as low Reynolds meshes with a y + value below one.
Since the evaluation of global performance parameters may hide non-converged 3D effects, parameters evaluating the flow in the zone of highest gradients in the volute-stator geometry was chosen. Therefore, the pressure losses over one stator passage were evaluated. Values were always compared with the finest mesh, which had a total of 32.8 million cells. Additionally, the flow acceleration over a passage was analyzed. In Figure 4, those parameters are represented against the y + value. From the two mesh configurations with a y + below one, the configuration B was of higher interest due to its reduced cell count and lower dispersion between the core mesh configurations. Furthermore, the overall dispersion of the analyzed pressure loss could be considered as low considering the uncertainty of the measurement instrumentation, which would be applied in the experiment. Out of this group, the mesh with the finest core mesh showed the lowest variation of flow acceleration in comparison with the finest mesh with the best resolved boundary layer. The rest of the meshes also had great dispersion among themselves and in the result. Hence, the mesh of 15 prism layers (B), a y + around one, and a fine core mesh was chosen for this study.
Finally, an additional test was performed to analyze the mesh density in the tip gap of the stator blades. This fluid region was dominated by viscous effects and had high gradients, and the shape of the tip leakage vortex typically depended highly on the meshing inside the gap. Here, results with a variation of the number of cells and the aspect ratio (AR), while maintaining global y + , were analyzed. Mesh variations were performed, outgoing from the previously selected mesh. The results are shown in Table 3. The line that highlights the numbers in bold determines the selected mesh for this scaled turbine stator-volute system. To select an appropriate mesh, a balance of pressure loss prediction and cell amount had to be found. Since the variations of the pressure loss could be considered as minor and below experimental measurement uncertainty, the mesh setup with lower pressure loss variation and lower cell amount was chosen.
The details of the final mesh counts are listed in Table 3 and the mesh finally used is presented in Figure 5.

4. Characteristic Flow Patterns

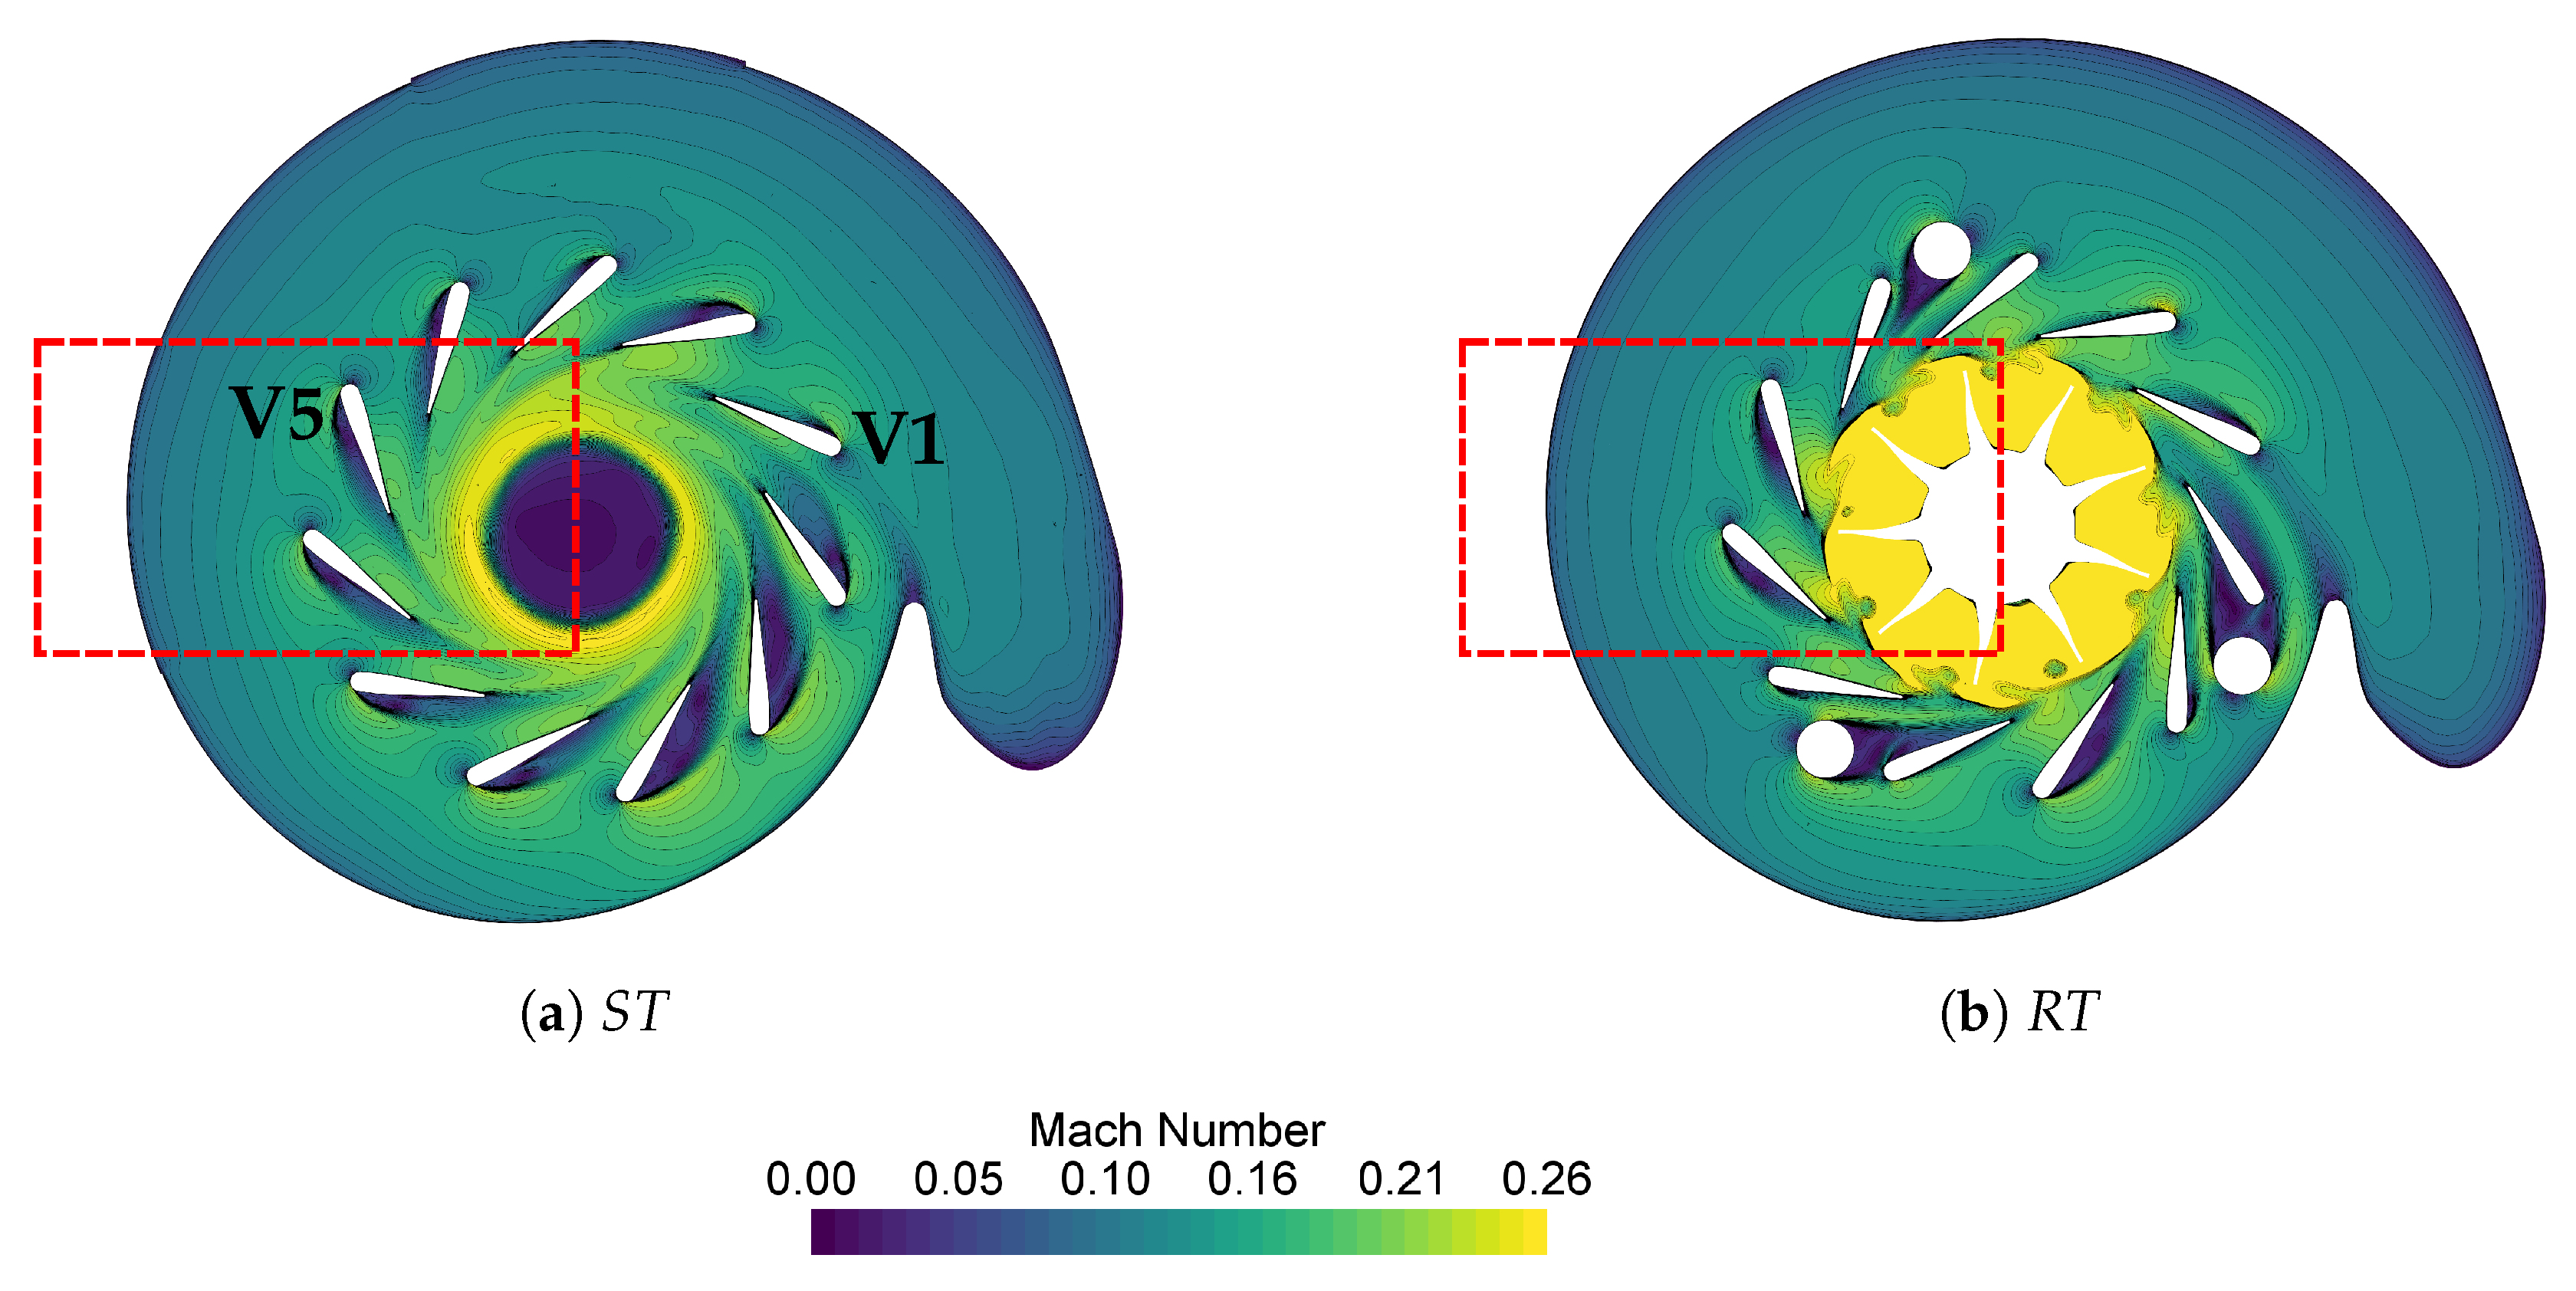
By means of the CFD model of the R T , which has been applied and widely validated in previous studies [41], the 3D fluid dynamics were analyzed as a comparison. In Figure 6, the Mach number distribution of the S T and the case with maintained Mach number R T M a are compared. In the simulated S T , big flow separations could be identified on the pressure side of stator vanes. These separations were continuously growing in the counter clockwise direction starting with the closest vane downstream the volute inlet. In R T M a , the presence of the separator pins generated great distortions in the stator vane inflow, causing the secondary flow of the neighboring vanes to be significantly different. However, the stator passage marked in the red frame was less affected and showed similar flow patterns. Hence, this passage and one of its vanes were used for further analysis.
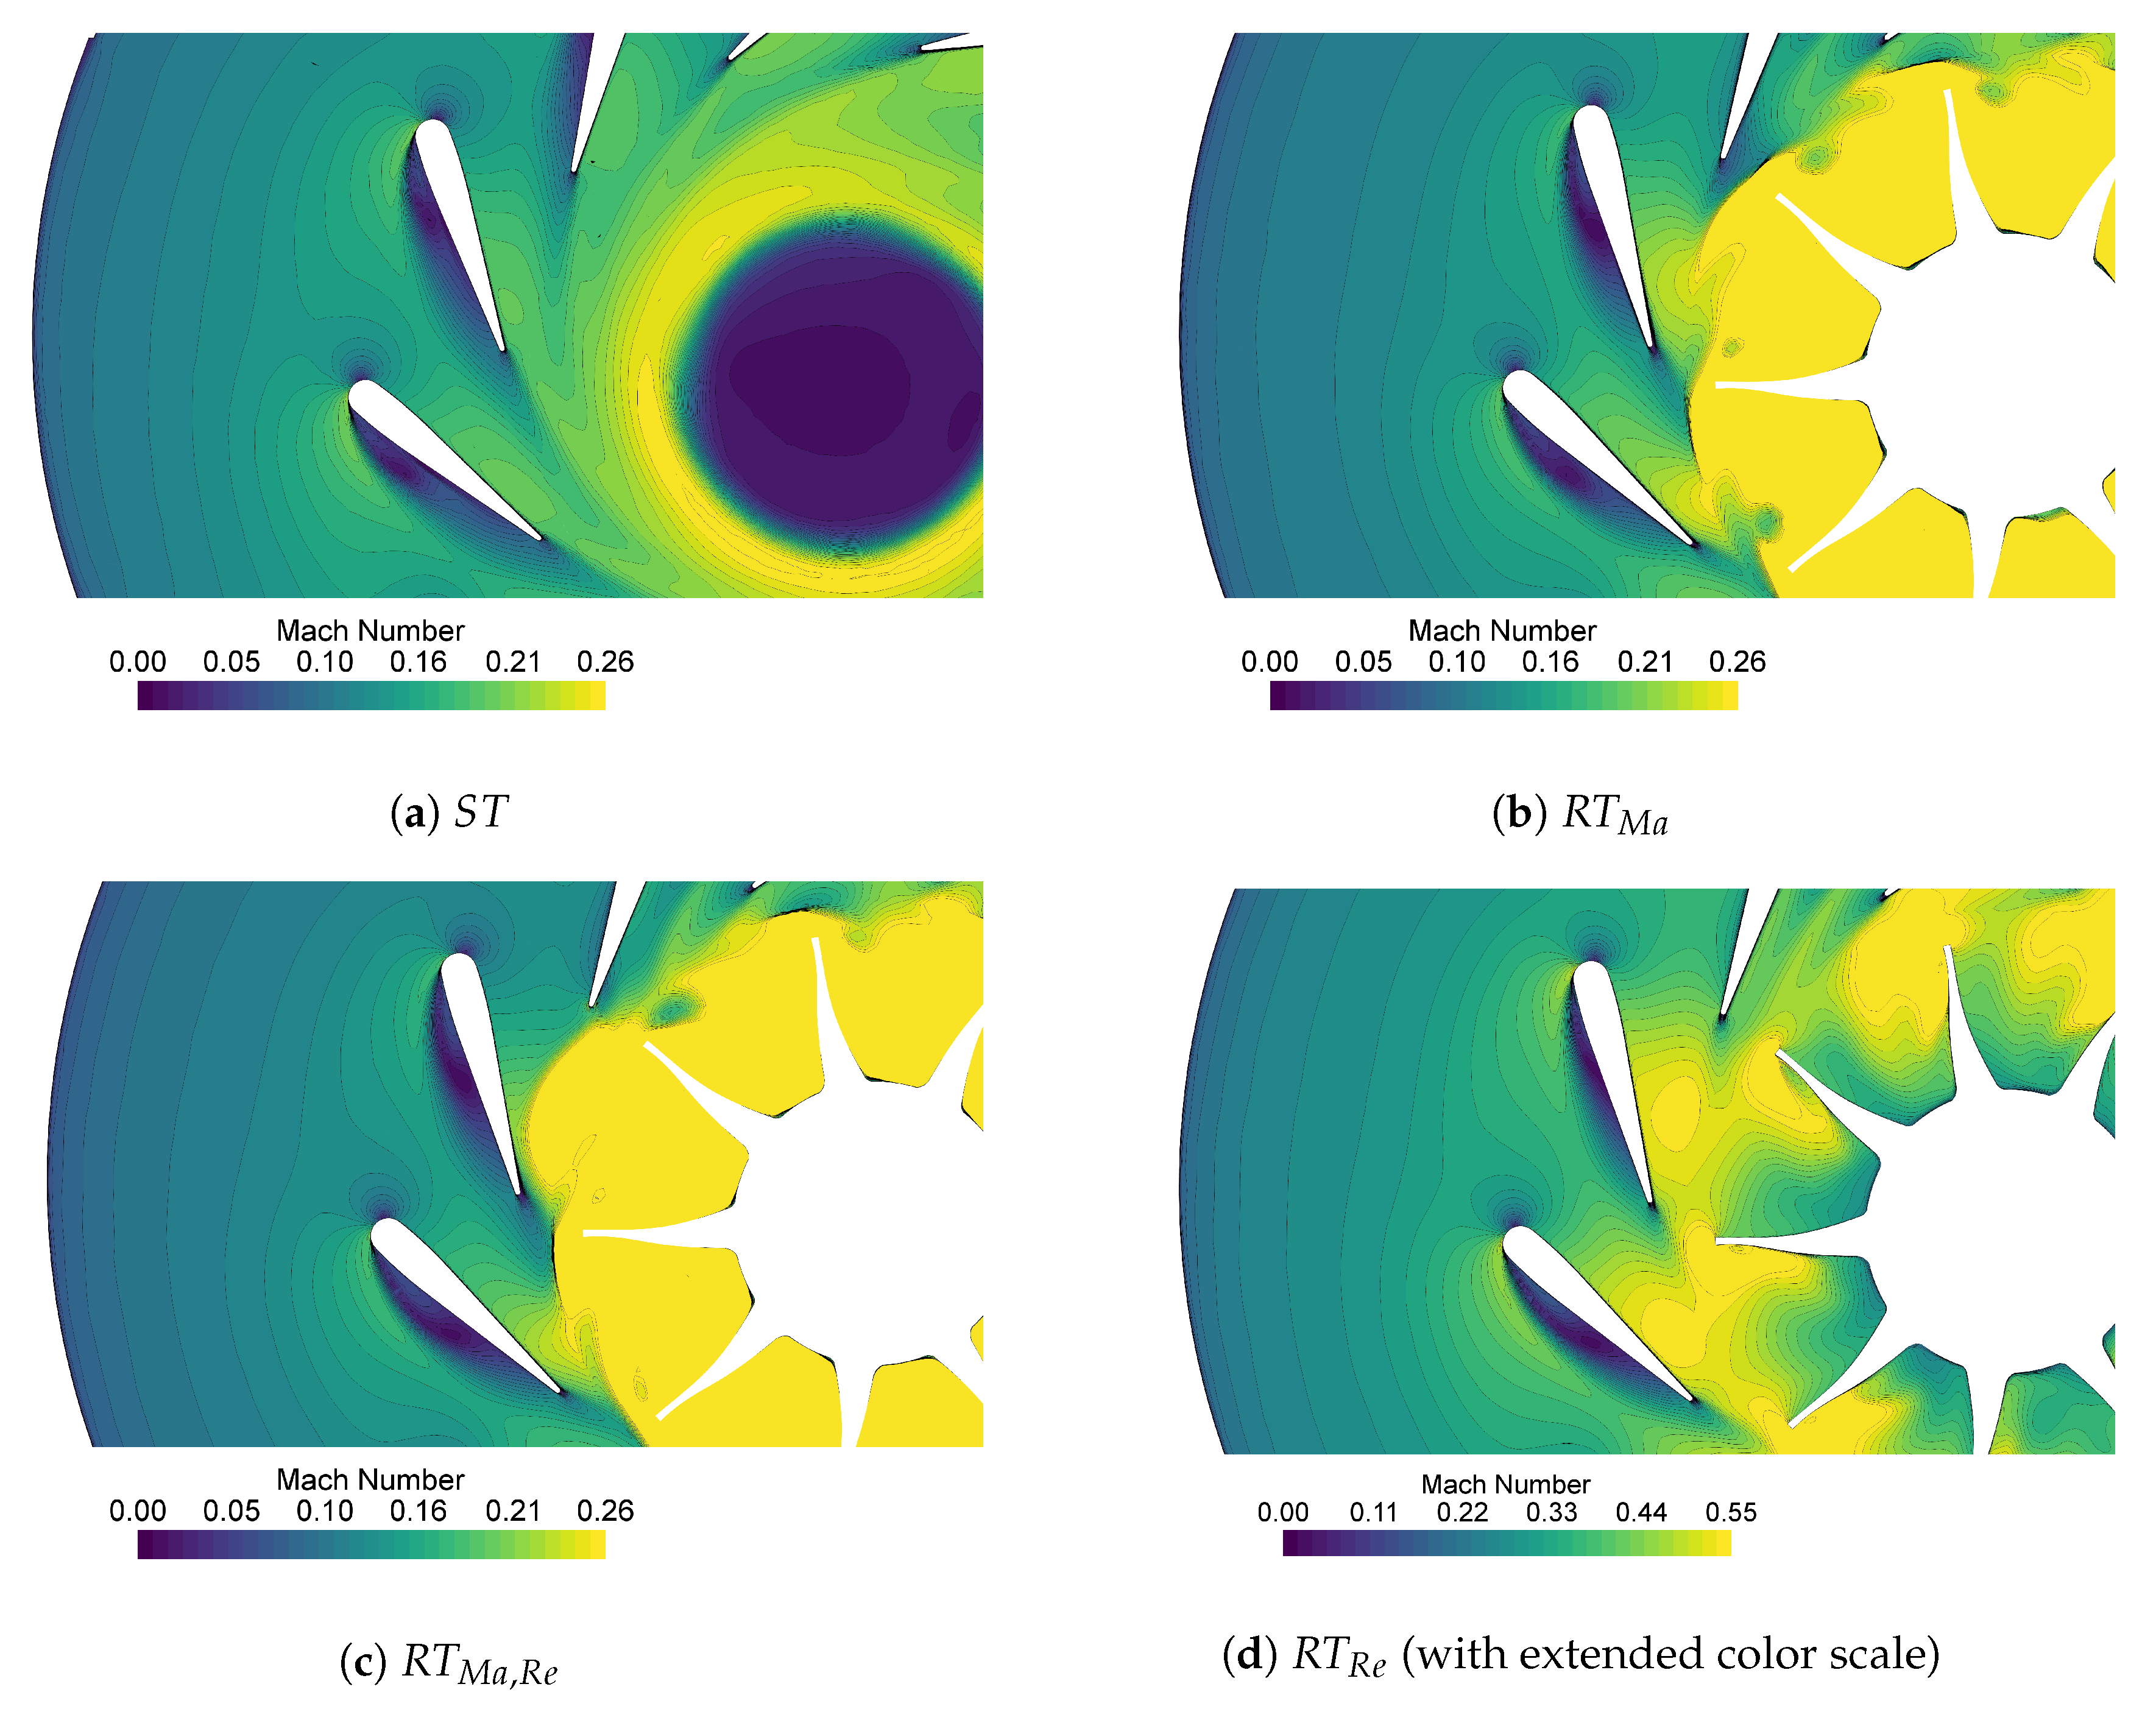
The Mach number of the selected stator passage of all analyzed cases is shown in Figure 7. While the passage flow of all cases with the maintained Mach number was in the incompressible regime, the case with the maintained Reynolds number R T R e reached Mach numbers around 0.6 close to the suction side (SS) of the vane. The comparison of all cases showed that a big separation bubble was located on the pressure side (PS) of the vane for all analyzed cases. Furthermore, in all R T cases, the rotor blades seemed to generate a throat between the SS, as was observed by Tiseira et al. [10] for closed positions in the choked condition. By moving the blades, the effective section changed, resulting in variations in the acceleration on the SS depending on the rotor position. Maintaining the Mach number, this effect could be observed at around 80% chord length, while at higher Mach numbers, this variable throat seemed to have an impact up to lower chord lengths as 50%. This indicated that the blockage generated by the rotor became more important when the reduced mass flow was high. Hence, if those operating conditions were measured according to the Reynolds similarity, a blockage would be required in the flow channel to obtain similar acceleration patterns as in the R T .
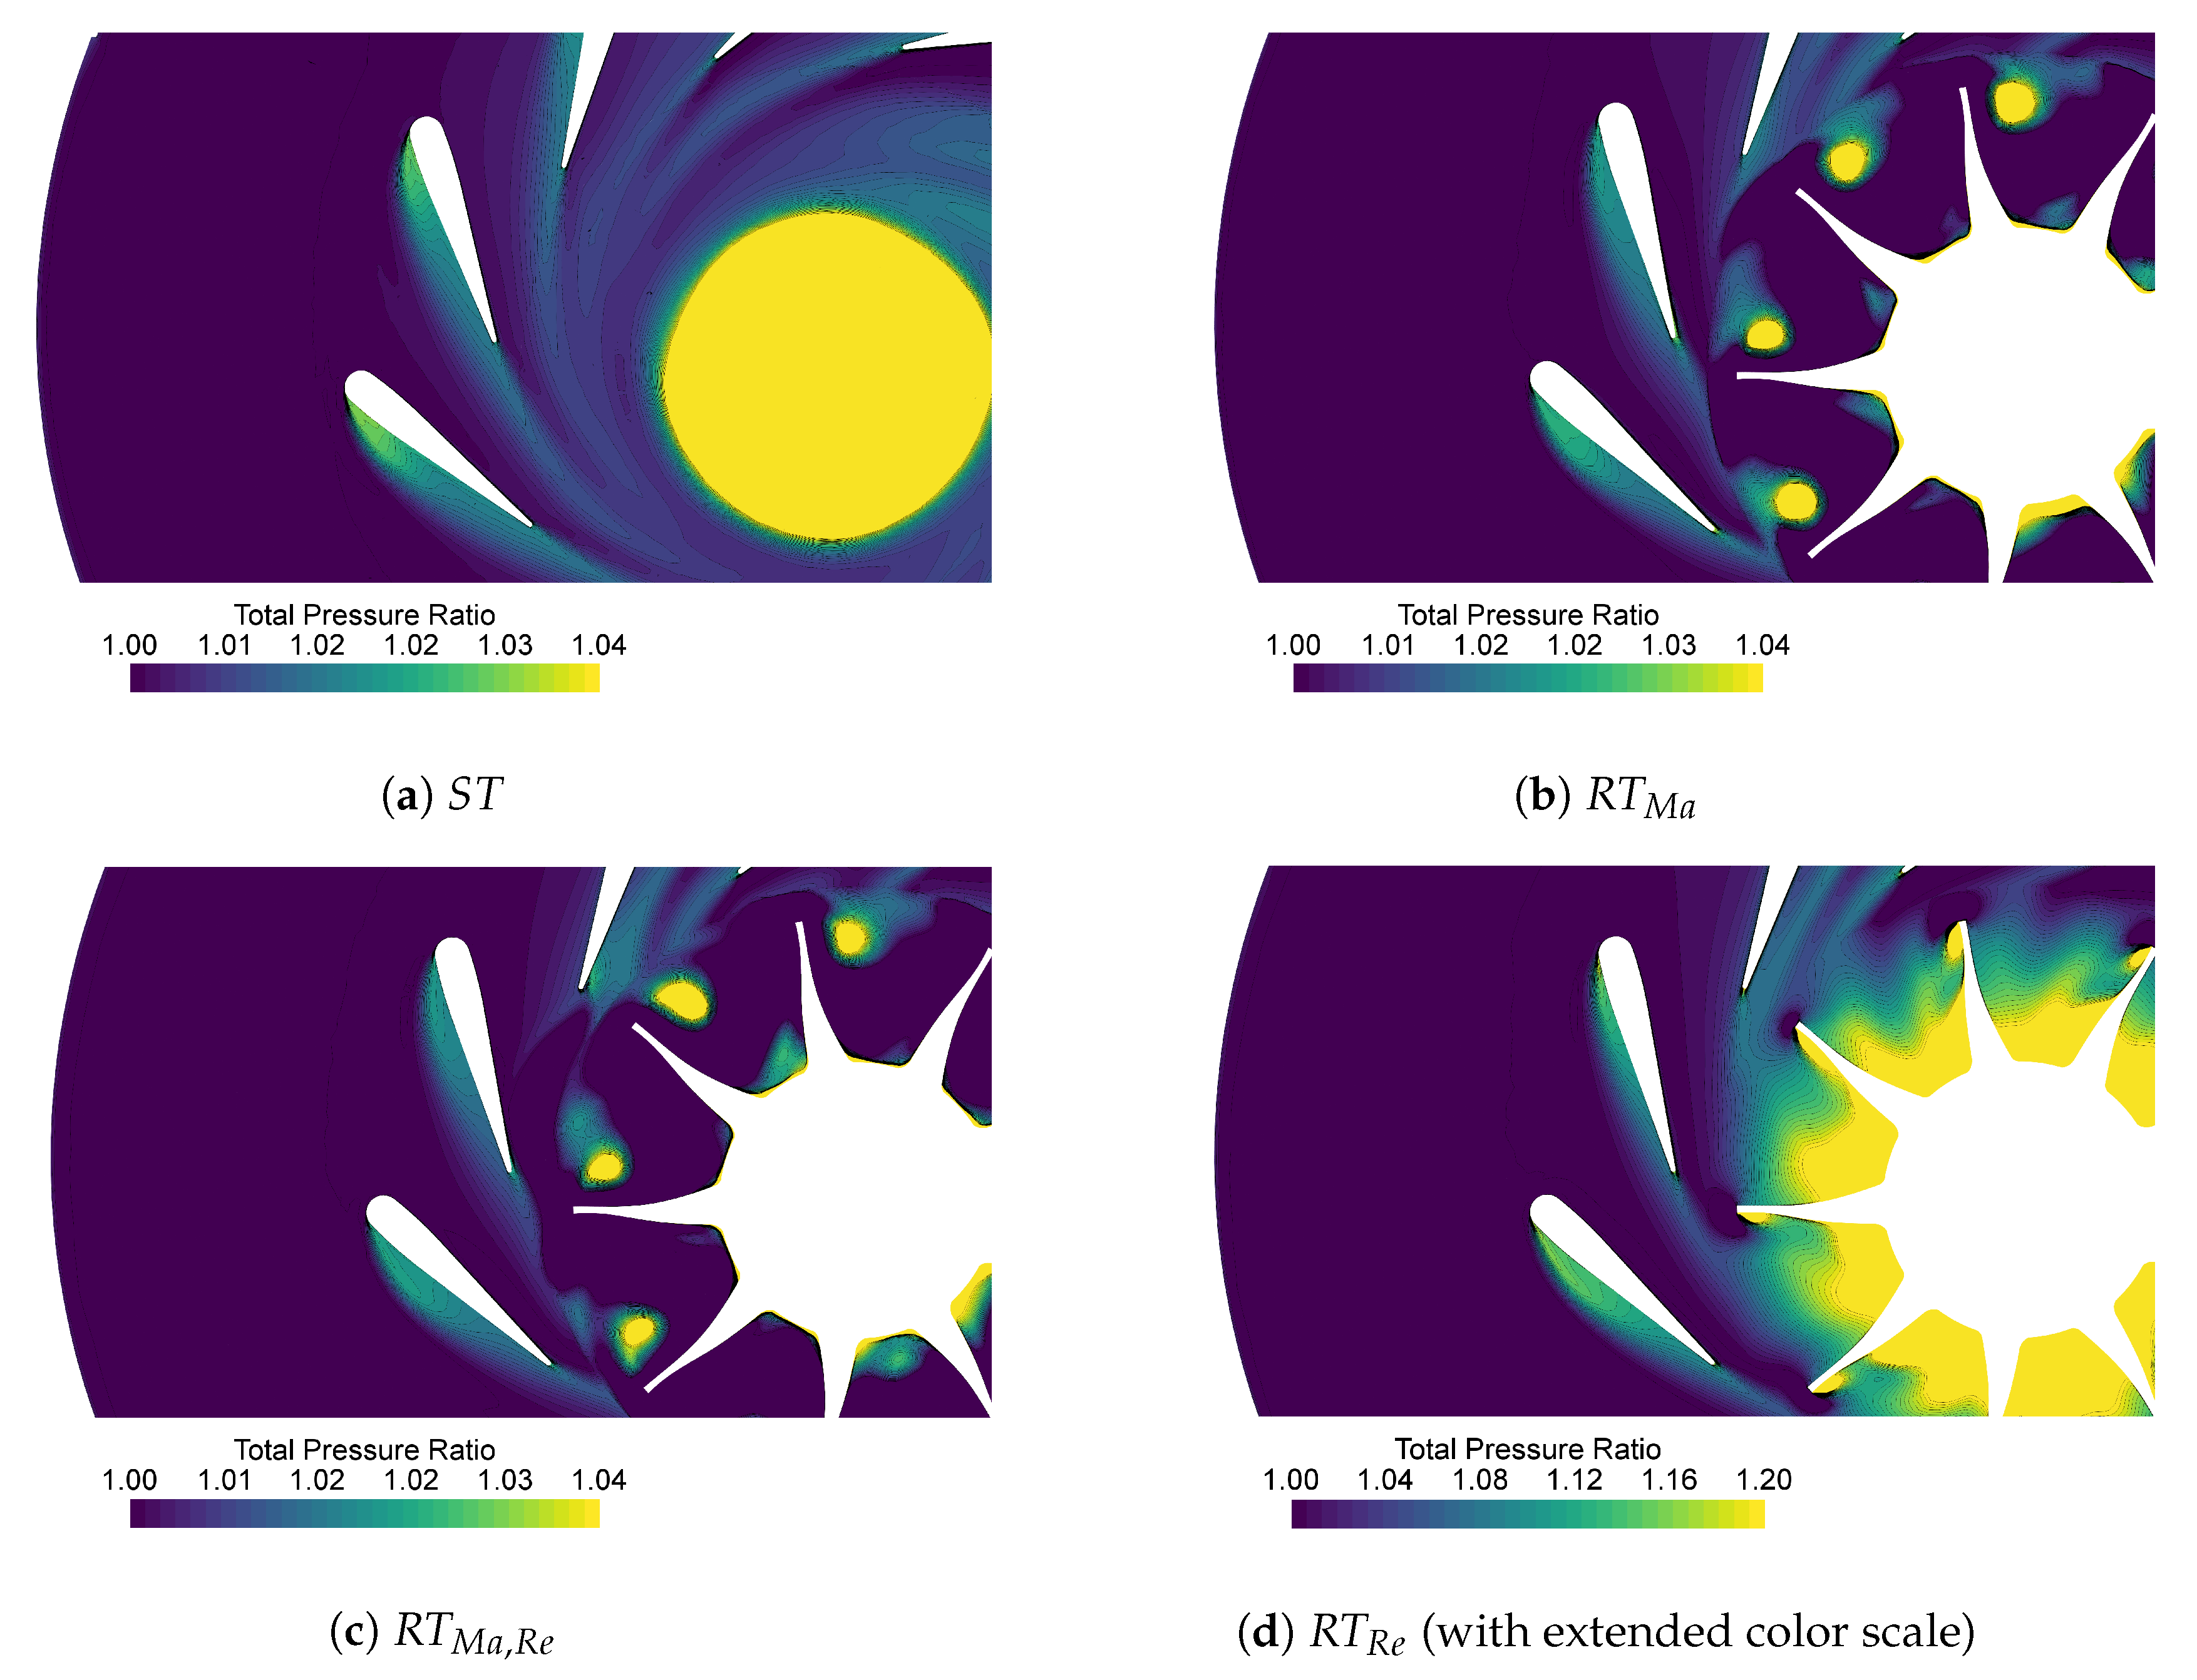
Figure 8 depicts the local total pressure ratio p t o t , i n l e t / p t o t , which was directly related to the irreversible viscous losses, at the midspan. In the observed stator passage, the main source of losses was the identified big separation bubble on the PS of the stator vane. In their extension, the separation looked similar in all cases. However, the intensity of pressure loss was elevated in R T R e , resulting from the elevated Mach number and velocity in this case. Peak values of the total pressure ratio located in the separation bubble in S T , R T M a , and R T M a , R e were around 1.03, while a maximum value of 1.20 was predicted for R T R e . Furthermore, the vane wake could be identified as a second loss source at this span. With respect to the separation and wake losses, no noticeable impact of rotor interaction could be identified inside the stator passage. Nevertheless, the rotor showed also here some influence on the losses field up to the stator TE.
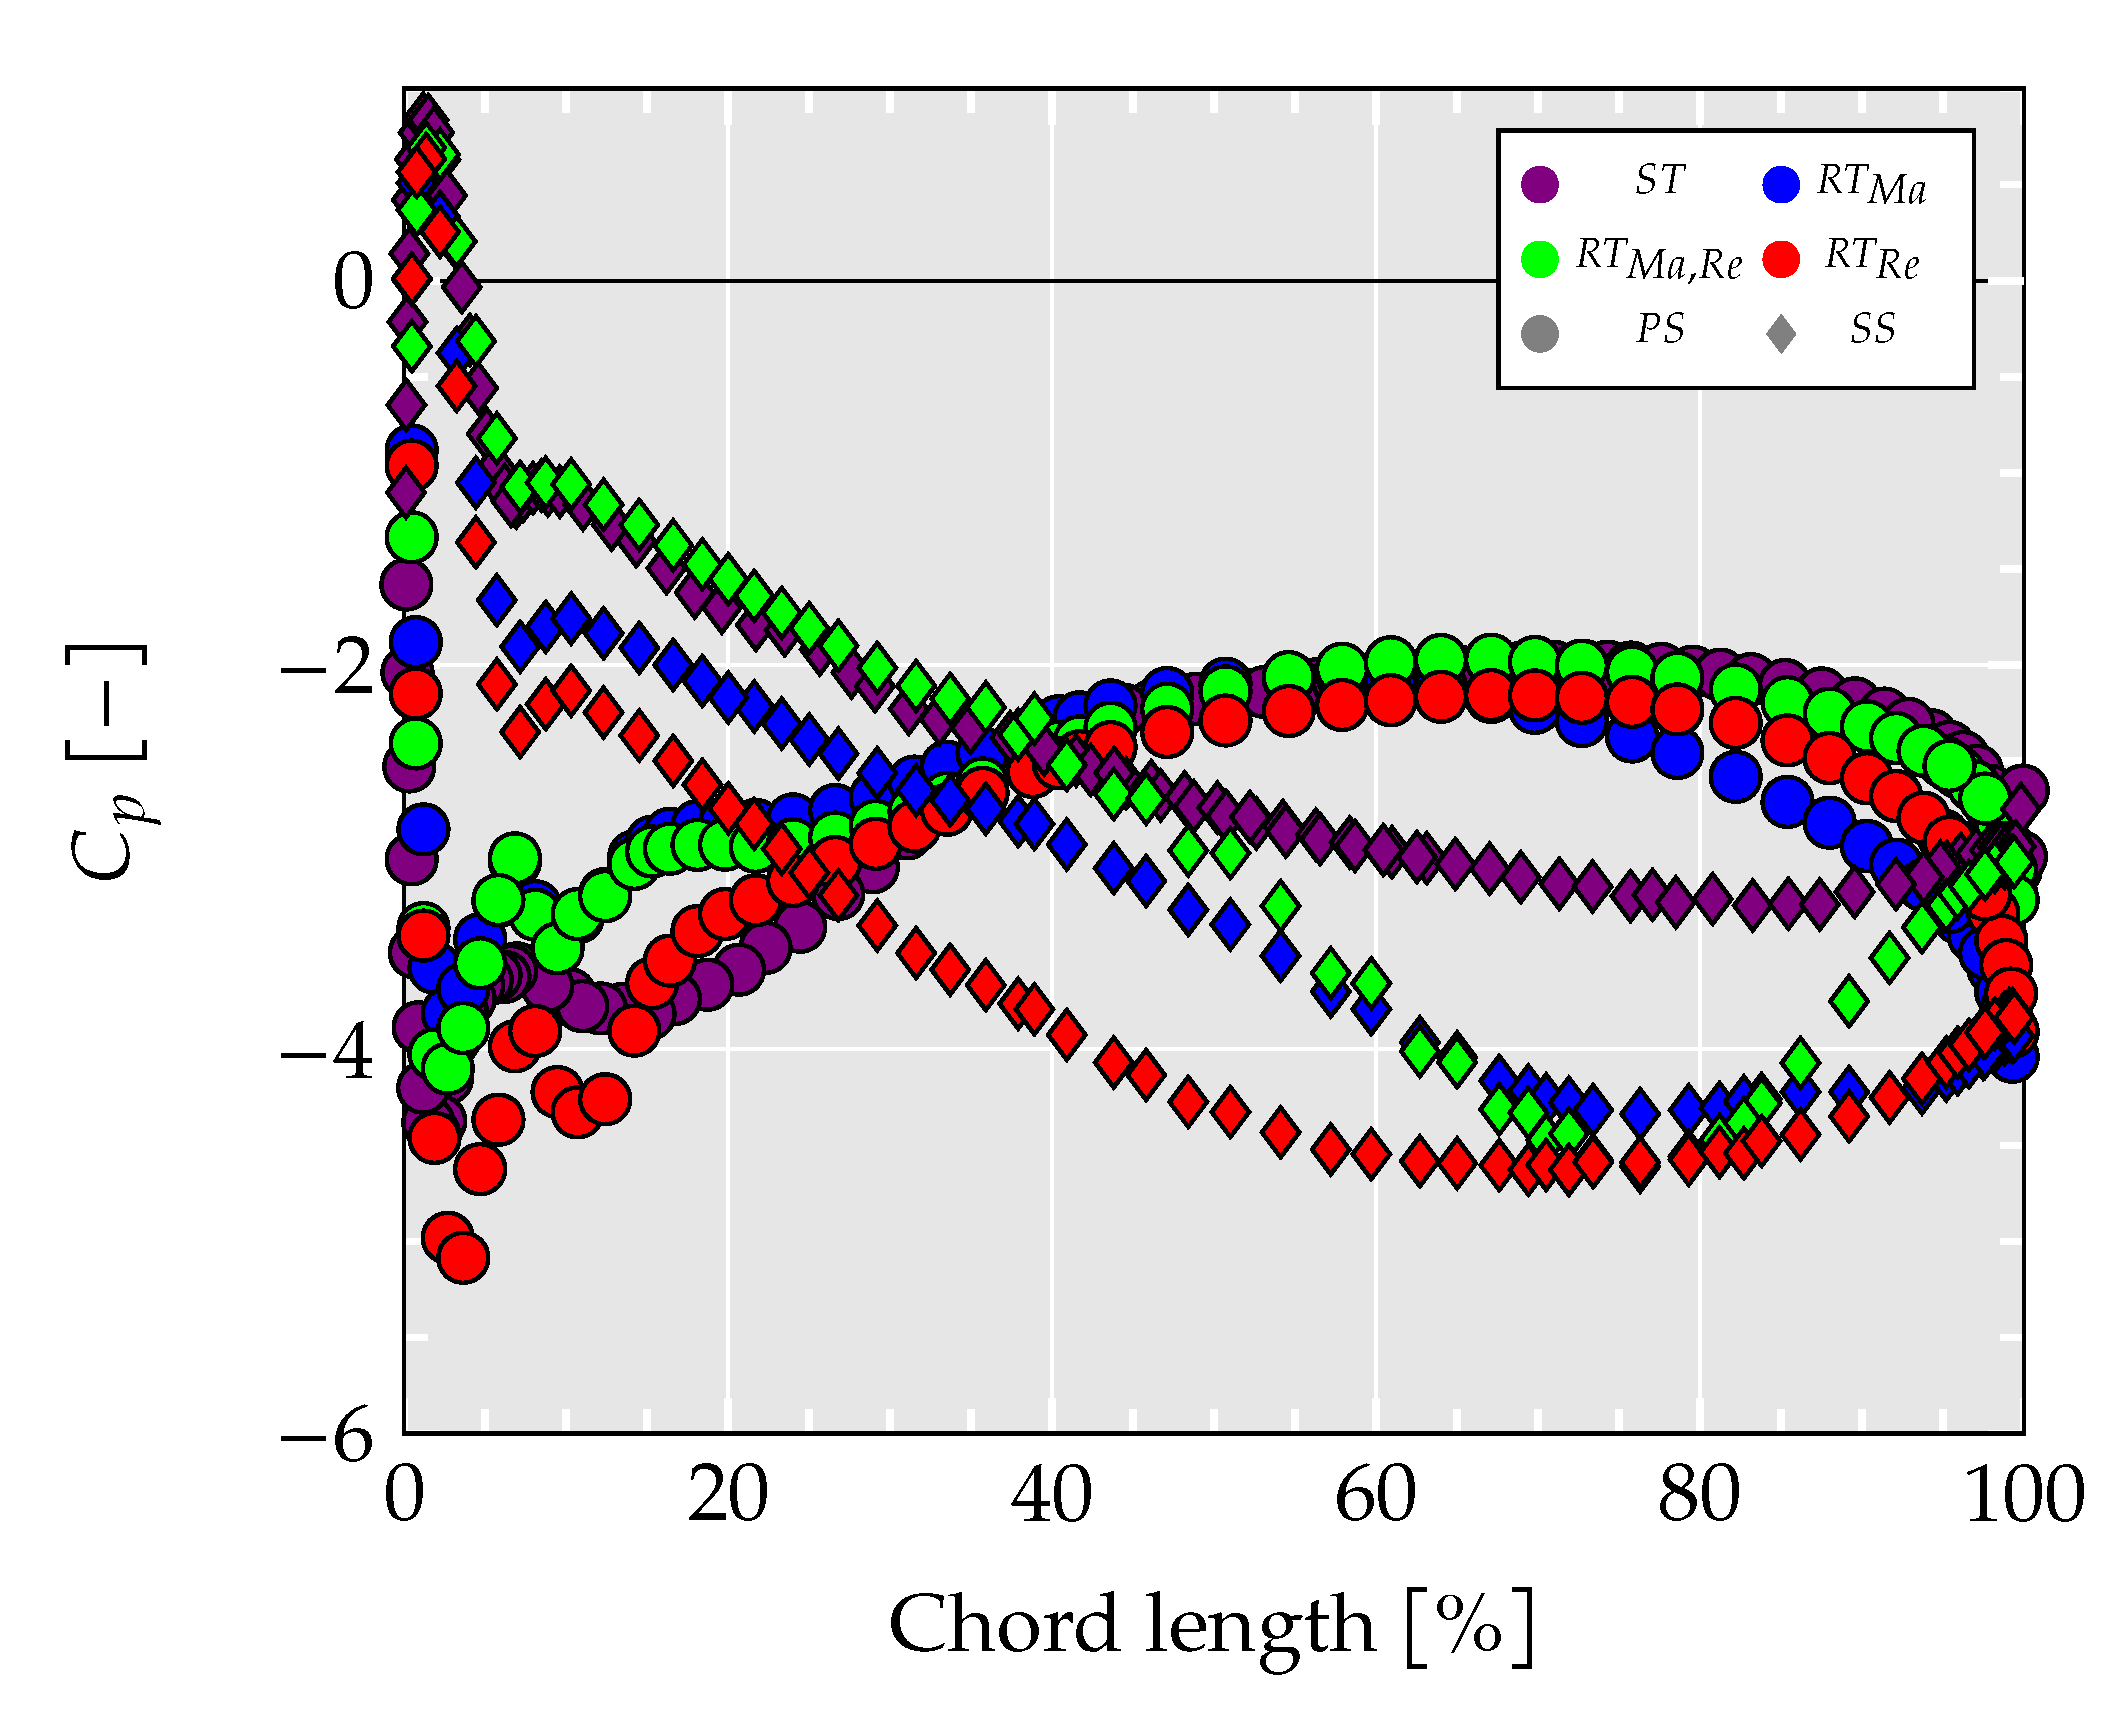
We analyze in more depth the impact of the rotor-stator interaction, as well as the quality of the reproduction of the separation bubble.
C p = p p i n l e t 1 2 ρ i n l e t V i n l e t 2
C p (Equation (4)) distributions at the midspan are plotted in Figure 9. The comparison of S T with R T M a , R e helped to identify possible distortions in the flow field due to the existence of the separator pins and the rotor. The results showed good agreement on the PS of the vane over the entire chord length. On the SS, the curves matched well until 40% chord length, where the previously observed rotor interaction influenced the flow in the stator passage on the SS. Hence, the validity of S T was limited on the SS at the presented VGT opening, if no additional blockage was generated downstream. However, it could be stated that the inflow, which described the adequate reproduction of the volute flow and the flow distribution to the stator passages, could be covered well. This was of high importance, since the analysis of the volute aerodynamics was one of the main objectives of the planned works. Having the same Ma number, but a reduced Reynolds number in R T M a led to some deviations on the SS in the inlet. C p on the PS behaved similarly to the one of S T . As has been seen before, the rotor interaction was high in the stator passage in the case of R T R e . Concluding, it seemed that the C p profile on the PS where the big separation bubble was located could be representative for real turbine applications. At more closed positions, this might be extended to the entire SS. For CFD solver validation purposes, the entire C p profile was assessed in the experimental campaign.
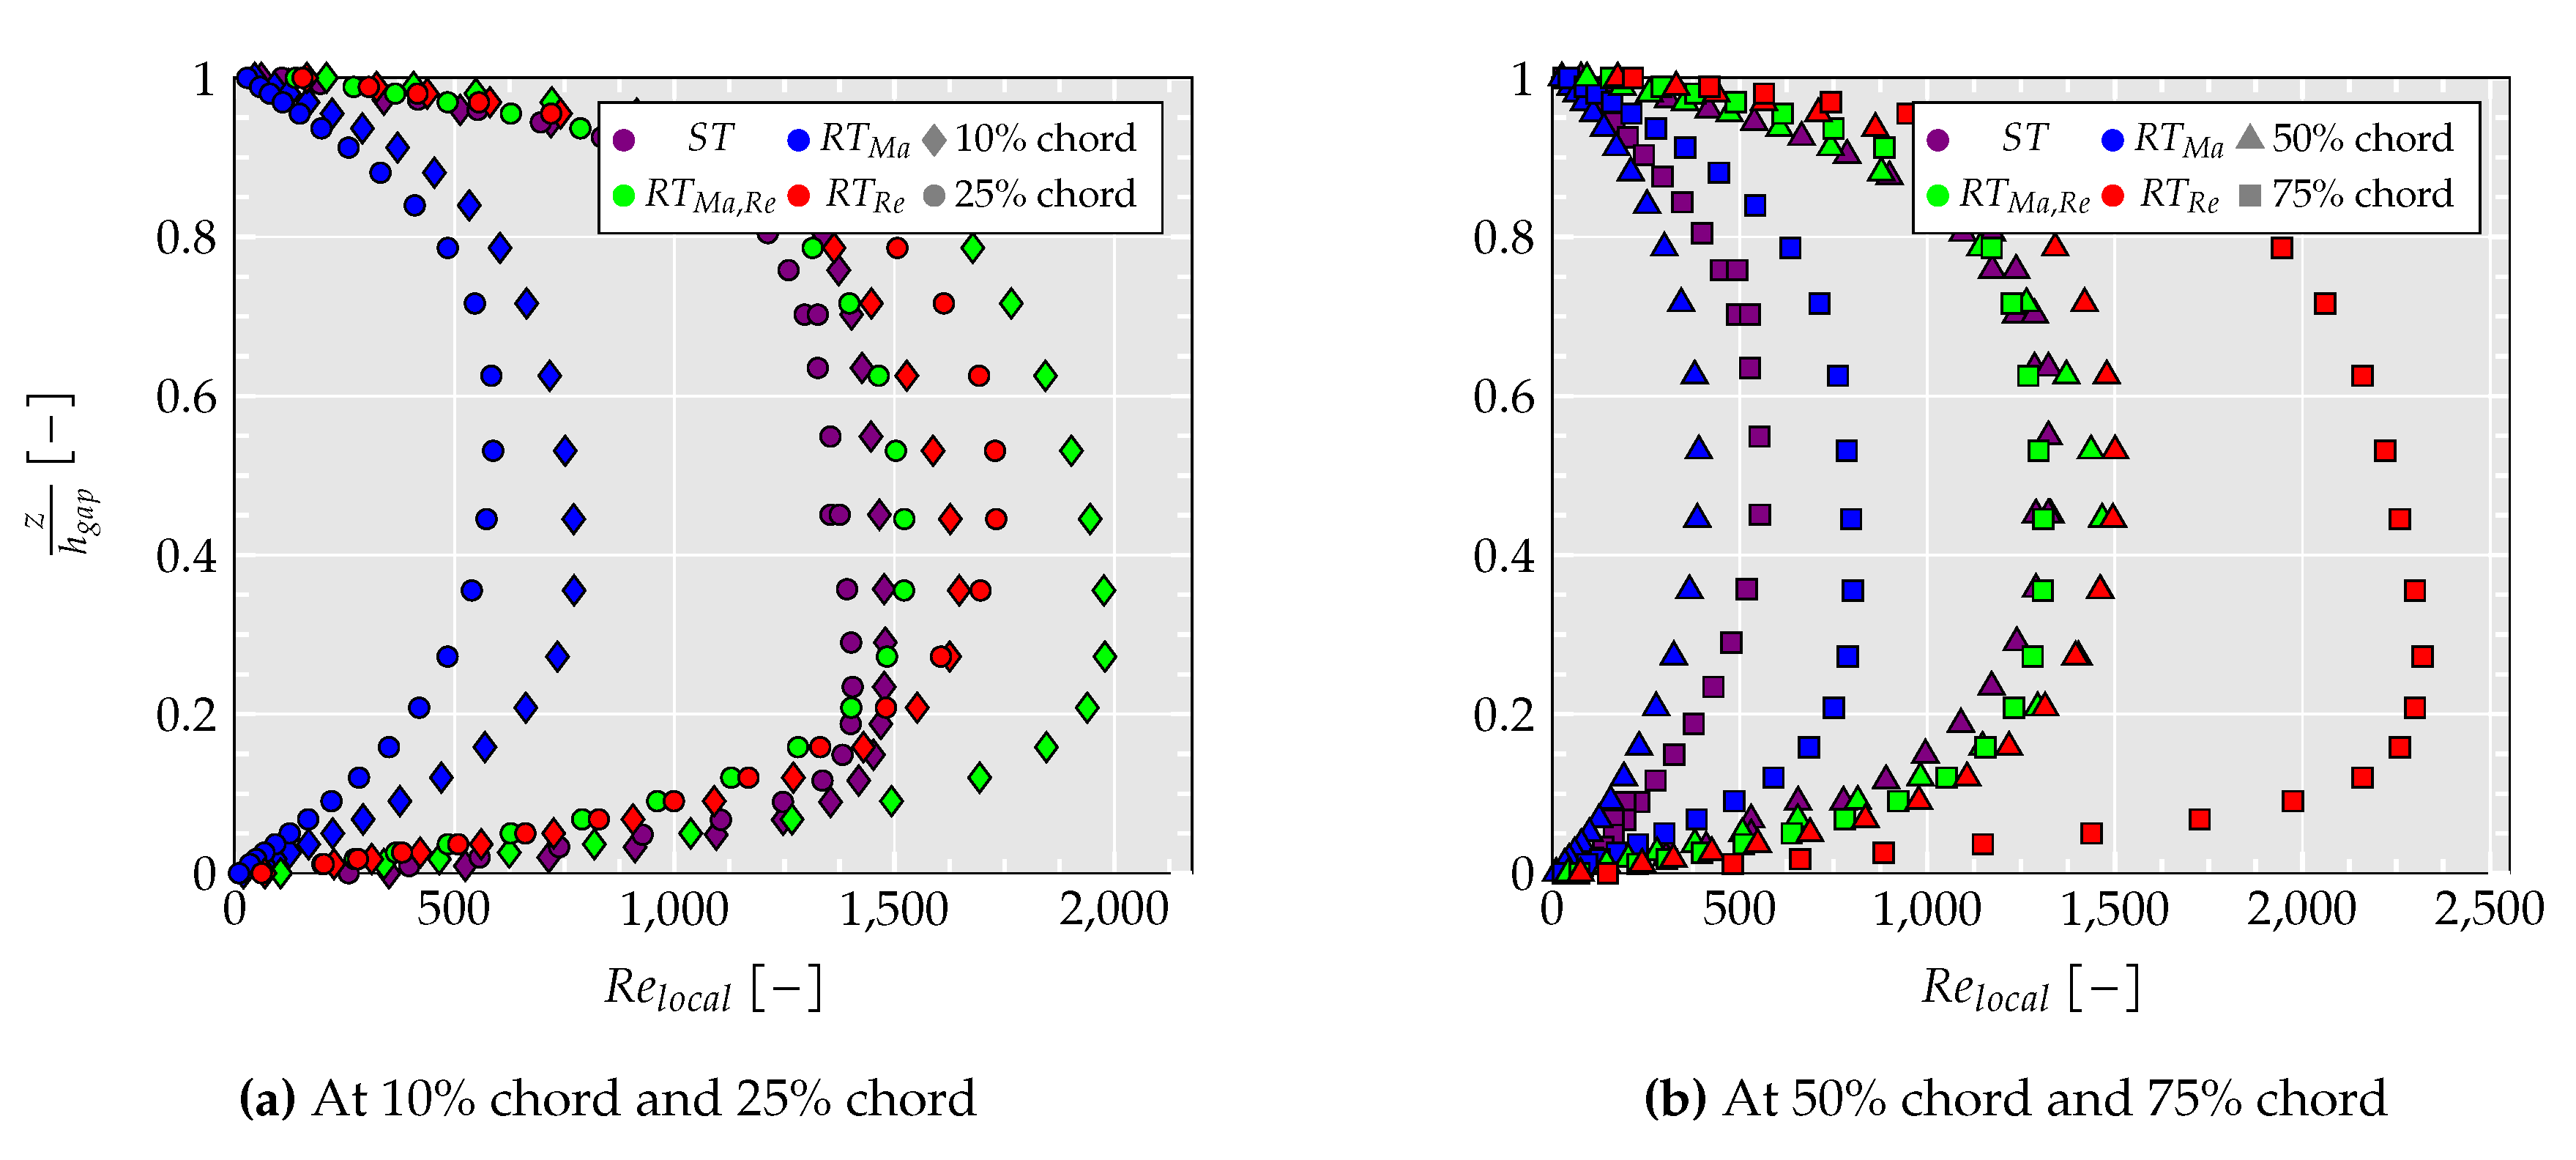
Since the tip leakage flow was in the focus of the experimental campaign, the flow inside the gap was analyzed in more detail. Therefore, the local Reynolds number profile is shown for four different locations along the camberline of the blade in Figure 10. It can clearly be seen that maintaining the Mach number did not contribute to achieving similar flow patterns in the stator gap. The achieved local Reynolds numbers were at a much lower level than those of the other cases at all chord positions. The curves of all cases with the same Reynolds number had their maximum at a similar level. However, the tip leakage flow highly depended on the blade loading, which was identified to be affected by the rotor-stator interaction. Although the interaction was noticed at a chord length of 40%, R e l o c a l matched well at 50% chord length. However, at 75%, the profiles showed large deviations caused by the distortion of the blade loading.
As one leading fluid dynamic effect, the separation of the boundary layer at the PS of the vanes was identified. Therefore, the boundary layer must be studied around the stator spans. Because it was important to resolve the viscous stresses near the walls of each of the vanes, special effort was put into the adequate meshing of these zones.
Obtaining a single definition of the boundary layer can be useless work, as it varies completely with the problem that is studied. The modeled system was complex in its geometry. To establish the limit of the boundary layer, the value of the free stream in the modeled system must be defined, taking into account that it was not affected by the walls and their viscous effects. The complexity of the flow through the channels, the appearance of turbulent wakes, and the influence of the tongue of the volute duct (see Figure 6) disturbed the flow and made it difficult to find a single criterion to define the free stream zone in the system. However, there are applications to define the free stream in a system as complex as this one. Choi et al. [42] proposed to define the limit between the boundary layer and the free stream using normal lines from the wall of the stator spans. The speed studied would be that of the cells that crossed this line. The boundary layer extended to the point where the speed variation was less than 1% between the adjacent cells crossed by the line perpendicular to the surface of the openings. The study on each line along the span was carried out independently, without considering a common free stream for the entire channel. Another postulation was defined in the work developed by Klausner et al. [43]. Free stream velocity was defined as the average between the channel entry velocity and the average velocity. Finally, Tiainen et al. [44] offered four different definitions of free stream velocity based on a centrifugal compressor and applied all four in the same simulation to compare their effect. In this work, two definitions used by Tiainen et al. [44], which provided the best results, were considered of interest (despite the fact that this document used a 99.5% criterion instead of the originally stated 99%).
In general, the limit of the boundary layer to the free stream was 99% of the free stream velocity. Although the definition may be useful, the system did not allow a clear value that had 99% of the free current due to the channeling of the flow by the volute and the stator itself with its channels.
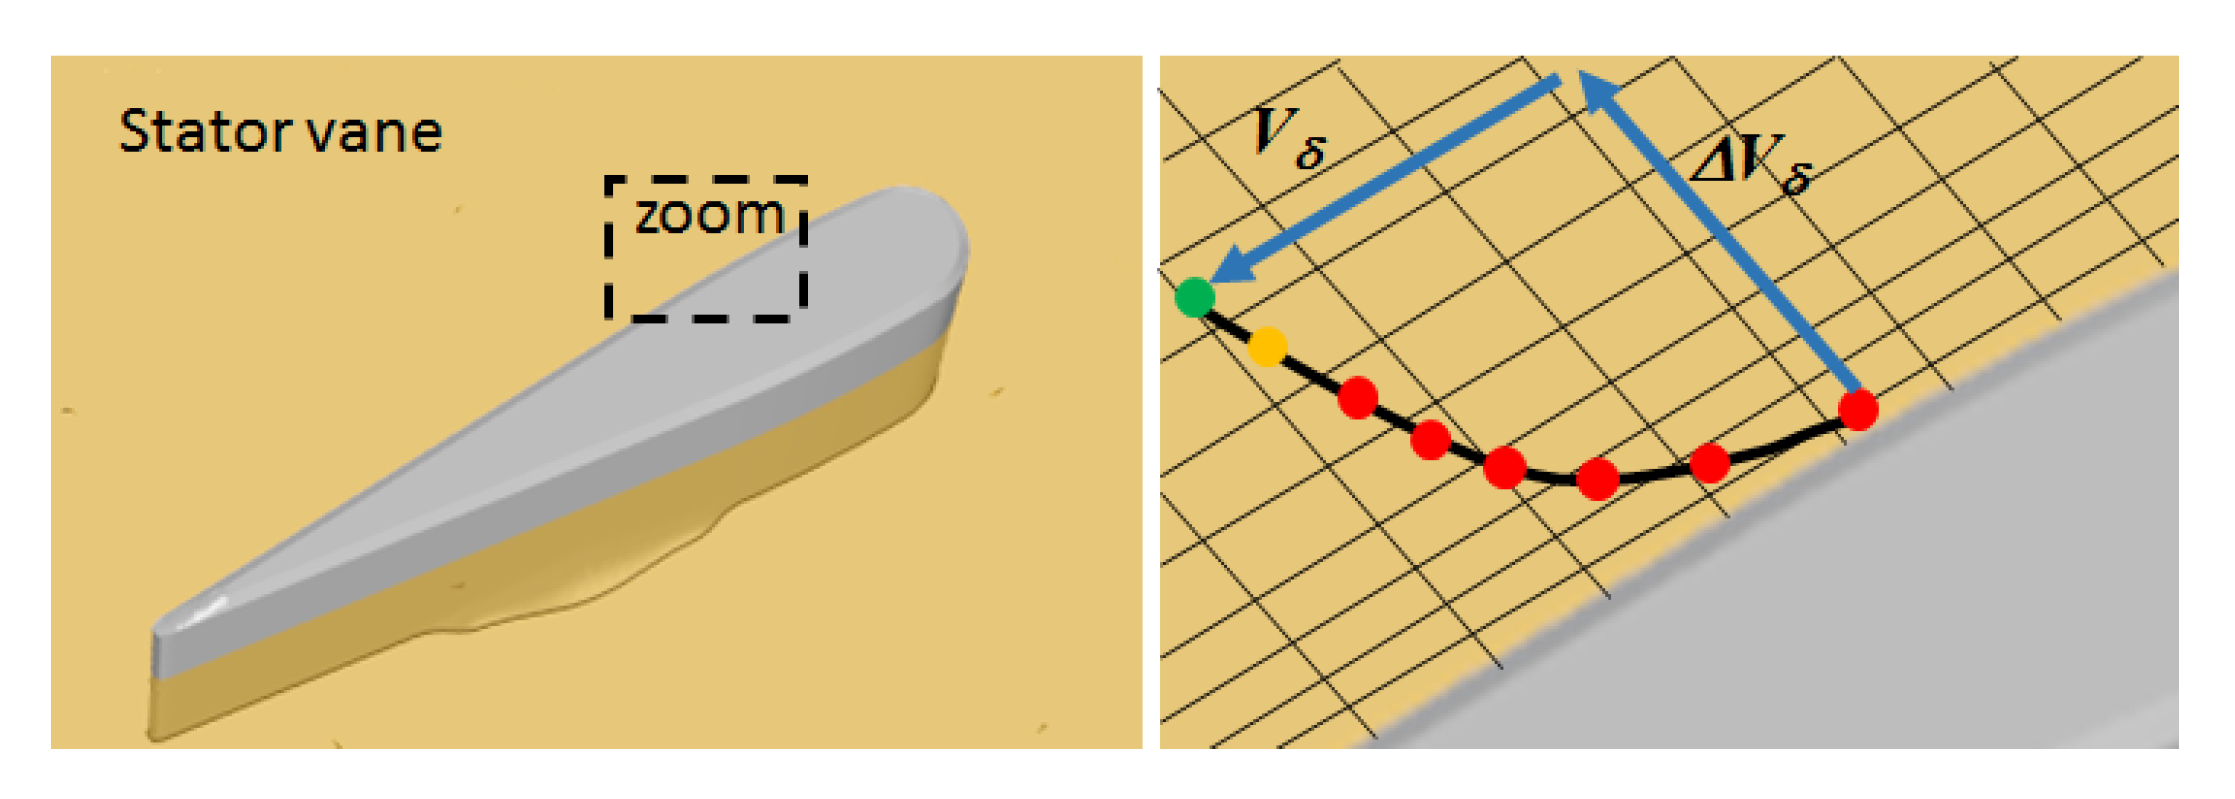
Figure 11 is an example scheme about the boundary layer limit definition by the prism layer using the theory of 99.5%. The circles represent the velocity magnitude in each cell. Δ V δ between yellow and green point was less than 0.5%. The thickness of the boundary layer was defined as the distance from the stator opening wall to the point where the velocity was 99.5% of the adjacent cell. V n 1 = 0.995 V n , where n was defined in the normal direction of the surface. Therefore, the free stream velocity would be V n from the last node to the boundary layer, varying along the channel. According to the conclusions shown in [3], this method captured the boundary layer between the wall and the wake, but if there was a separation of the layer itself, it was possible to make a serious mistake. The second method came from the first, defining the free stream velocity as the average of each V δ studied (Equation (5)). In [44], N it had a total value of 12 samples. The final conclusion regarding this method was that it was able to obtain the separation of the boundary layer, but it could also imply an overestimation in the thickness. Therefore, this could lead to an overestimation of the losses on the aerodynamic stator span according to this study.
V δ = V δ , a v e r a g e = 1 N i = 1 N V n
To apply the so-called estimation methods, the same stator vane V5 as in previous analysis was selected (Figure 6). From the SS and PS, fourteen normal lines were projected along its surface from its leading edge (LE) to its trailing edge (TE). Each of them extended until reaching a channel zone where the speed could be considered as a stable value applying the 99.5% criterion.
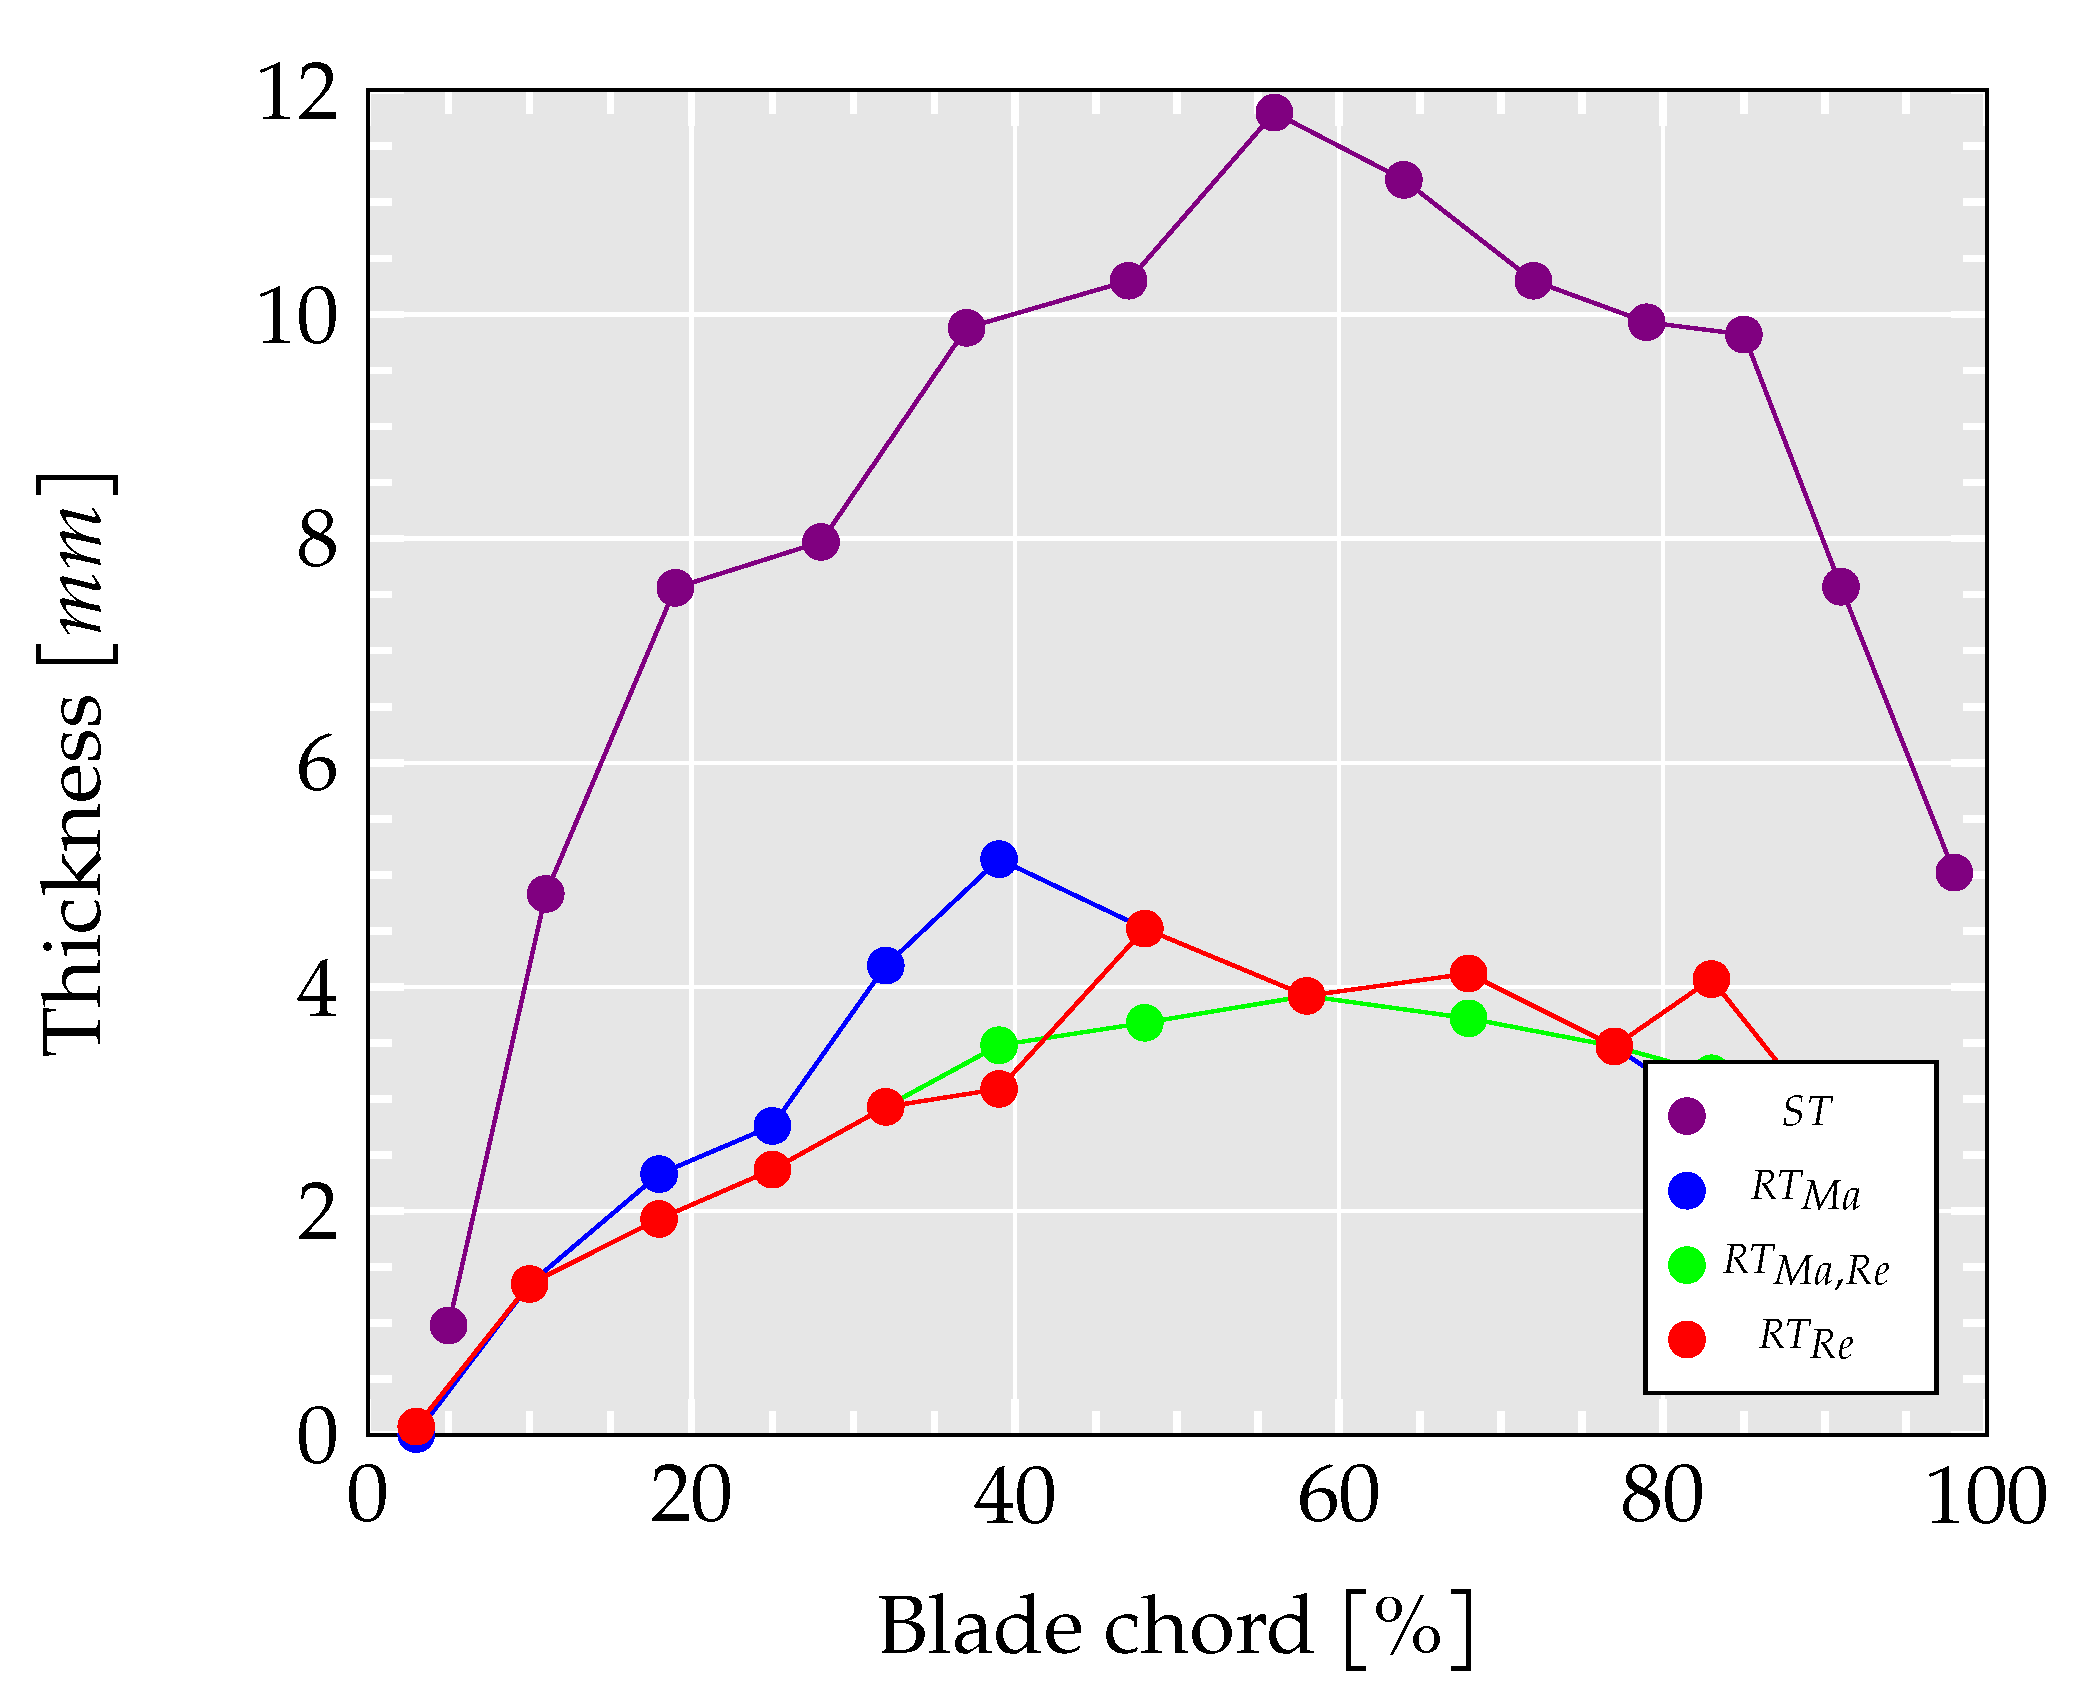
The study on the boundary layer of the stator vanes resulted in a layer thickness of 1.18 cm. The mesh was also adjusted to this physics that determined the appropriate behavior on an aerodynamic surface, as demonstrated by several authors, among which the work carried out on the structure that acquired the flow inside the boundary layer could be highlighted [45]. Figure 12 shows the thickness result as a function of 99.5% of the difference between one cell and another in the channel of vane V5. The same exercise was done with the turbo for the real size. Both curves had a similar behavior. The thickness of the separation bubble in the scaled vane was exactly tripled compared to the actual stator vane.

5. Discussion

This work showed a methodology developed to validate the application of a new tool on the fluid behavior study in the inside of very small radial turbines used in automotive gasoline, diesel, or hybrid engines. A larger scale real turbine allowed a precise approach to some internal flows. The modeled and experimental study must be precise in the calculus, measurements, and data collection process. Therefore, the study presented a series of results demonstrating that the scaled turbine served to study the behavior of the fluid in all the small areas of the turbine, and it demonstrated its validity to be used in research as a simulation and experimental tool.
Meshing was very demanding to determine a fraction value, y + , and to define the numbers of cells on smalls surfaces in the model. Several studies about the boundary layer limit have been cited applying one of them. The mesh definition is not simple and may lead to improvements in the definition if other theories can be used in a complex geometry. The quantification of the separation bubble with the criteria of the boundary layer to the free stream limit used resulted in a factor of three between the separation bubble thickness of S T and R T , as would be expected for an appropriate scaling of the fluid effects along with the model dimensions.
Based on this work, several limitations of the usability range and valid conclusions of future experiments could be given. The missing rotor-stator interaction limited the validity of the results of C p profiles on the S S of the stator vanes. Here, rotor-stator interaction could be noticed in different strengths up to 40% chord length. However, other viscous effects as the dimensions of the big separation bubble and the tip leakage flow up to a chord length of 50% were well predicted according to the Reynolds similarity. Hence, the tip leakage flow in this zone could be analyzed over a wide range of the map. Furthermore, it needs to be considered that a very opened position was chosen for the presented analysis for identifying the global limitations of the experimental campaign and to be able to recommend the placement of measurement equipment, which could supply reliable results. It could be assumed that the rotor-stator interaction would be less significant at reasonable reduced mass flows, when the blades were more closed.
Although results showed that a maintenance of the Mach similitude and Reynolds similitude at the same time would be appreciable to model the operating points of the turbine map, the equality of both numbers was difficult to achieve in S T . To achieve R T M a , R e , the inlet density in the small geometry was tripled by increasing the total inlet pressure. This resulted in the required mass flow for the Reynolds similitude Equation (3) and also in the required reduced mass flow for the Mach number similitude. In turn, if one map operating point of R T were desired to be measured with both the Mach and Reynolds similitude in S T as S T M a , R e , the total inlet pressure would need to be reduced to one third of the one in the R T . However, this would result in a total inlet pressures way below atmospheric pressure, which could not be realized in the test bench. Hence, only the Reynolds similitude or Mach similitude could be assessed in the experimental S T . It is worth highlighting that the operating point of the S T could represent certain flow characteristics as the pressure loss and Mach number distribution of a running point with relatively low reduced mass flow ( R T M a ). At the same time, this exact running point of S T could also represent other flow characteristic of a running point with much higher reduced mass flow ( R T R e ). For this running point, tip leakage flow could partially be predictable. For both running points, the thickness of the separation bubble was properly predicted.

6. Final Setup of the Experimental Equipment

The objective of the experimental campaign was the measurements of the characteristic flow patterns to achieve 3D data for sophisticated flow solver validation. Hence, it was desired to measure all previously analyzed flow phenomena in this work. After the presented analysis, it was possible to know the application limitations of the new tool developed, as well as determine the sensors position to capture the entire extension of expected flow patterns.
First, S T was manufactured by means of 3D printing. The material used for its construction was a polyetherimide resin called ULTEM-1010 used in applications that require high heat resistance, high strength, and broad chemical resistance. Specifically, the maximum temperature and internal pressure that the S T resisted were around 483K and 2 bar. Figure 13 shows the entire 3D printed test section of S T . Here, the vanes were fixed at their position of 80%. However, the stator row could be replaced with separately printed stator rows with different VGT openings.
This test section was installed on a cold flow test bench characterized by a maximum mass flow of 1200 kg/h and maximum relative pressure around 400 mbar. The test bench incorporated sensors for measuring relative pressure and temperature. It also had a heater that allowed reaching the desired temperature in the test.
To allow the measurement with optical measurement techniques, access windows were designed around the turbine volute. It was decided to focus on the measurement of tip leakage flow by means of particle image velocimetry (PIV), but it was also possible to measure at any height of the vane, as can be seen in Figure 14. Apart from one window, which allowed access to the extensively analyzed vane V5, two other windows were designed to allow optical access, as shown in Figure 15. This way, the impact of the location along the volute length could be assessed. This methodology has been used in other research contributions. Experimental studies using the experimental measurement technique to characterize the flow behavior in this type of machinery by means of laser have been shown to be effective. This confirmation could be understood thanks to the contributions of various works by different authors, among which was the experimental study done by [22]. For the study of the behavior of the flow in turbomachines, they used the technique of LDV. Further, The work in [23] used the same measurement technique. The measurements were performed at a plane 9.5 mm behind the rotor trailing edge, and they were resolved in a blade-to-blade sense to examine the nature of the flow fully. The same methodology was presented in [24], where the LDV technique was used to determine the flow pattern in a big size turbo.
For the measurement of vane surface pressures, wall pressure transducers were installed. Firstly, those were installed on the SS of the analyzed blade, since higher gradients were expected to appear there. Following that, they would be moved onto the PS or even in the tip region of the vanes due to their tiny size.
Furthermore, there were also five hole pitot tubes. These were installed at the inlet and outlet of a stator passage, but on different passages so that the pitot tube at the inlet did not disturb the measurements of the pitot tube at the output. With these pitot tubes, it was possible to measure total and static pressure, as well as velocity and flow angles. These sensors had a limitation in terms of working temperature. The maximum temperature at which they could operate was 353K. This was another reason why a low temperature was chosen as the boundary condition for this study.
With all the instrumentation that were mentioned, static and total pressure, velocity, and flow angles could be measured at almost any point in the domain. With these data, it was possible to validate all the previously carried out analyses and to characterize the main identified 3D flow phenomena.

7. Conclusions and Future Work

In this analysis, the validity of the Mach and Reynolds similarity with a real size turbine was revised locally for the operating point of maximum possible mass flow in the scaled turbine. The obtained results in both modeled turbines demonstrated that there was an interaction between the stator and the rotor, which could not be replicated by the scaled model. The strength of the interaction increased towards higher reduced mass flows. This alteration on the flow behavior by the rotor affected the last 50% of the profile chord only on the SS, for a highly opened position of the 80% VGT position. Furthermore, the similarity analysis concluded that the operating point of max. available mass flow in the scaled turbine could be representative for certain fluid dynamic effects at two very different operating points. However, some effects as a big separation bubble on the PS of the vane were present in all studied cases. This observed bubble showed a large field of energy dissipation in the channels. This phenomenon acted directly on the total performance of the turbine. Using the scaled turbine should be possible to study this phenomenon easily and in more detail. The results of this work served to determine the sensor position strategy and highlighted the limitations, as well as gave guidelines for future experimental tests using the scaled turbine. The instrumentation of the scaled geometry was presented in detail.
In the near future, exhaustive measurements with the presented measurement techniques will provide valuable data to validate 3D flow patterns reproduced by CFD simulations. Further, experimental and numerical studies will consist of varying the VGT opening while maintaining the air mass flow to observe the gradual change in the rotor-stator interaction along the turbine. Furthermore, different stator vane shapes will be tested, and the effect on the separation bubble and tip leakage flow will be analyzed.

Author Contributions

Conceptualization, A.O.T.I.; investigation, N.H.G.; methodology, L.B.I.; resources, R.N.G.; writing, original draft, A.O.T.I., L.B.I., and N.H.G.; writing, review and editing, R.N.G. All authors have read and agreed to the published version of the manuscript.

Funding

The authors disclose receipt of the following financial support for the research, authorship, and/or publication of this article: This work was partly sponsored by the program “Ayuda a Primeros Proyectos de Investigación (PAID-06-18), Vicerrectorado de Investigación, Innovación y Transferencia de la Universitat Politècnica de València (UPV), Spain”. The support given to Ms. N.H.G. by Universitat Politècnica de València through the “FPI-Subprograma 2” (No.FPI-2018-S2-1368) grant within the “Programa de Apoyo para la Investigación y Desarrollo (PAID-01-18)” is gratefully acknowledged.

Acknowledgments

Juan Antonio López Carrillo is a final master degree project student at CMT, and Pau Raga Nieto is the Senior Research Technician.

Conflicts of Interest

The authors declare no conflict of interest. The funders had no role in the design of the study; in the collection, analyses, or interpretation of data; in the writing of the manuscript; nor in the decision to publish the results.

Abbreviations

ARAspect ratio
CFDComputational fluid dynamics
C p Pressure coefficient
DDiameter
KKelvin
LELeading edge
LDVLaser Doppler Velocimetry
MaMach number
m ˙ Mass flow rate
PIVParticle image velocimetry
PSPressure side
P t o t Total pressure
RANSReynolds-averaged Navier–Stokes
ReReynolds number
rpmRevolutions per minute
RTReal turbine
SSSuction side
STScaled turbine
TETrailing edge
V 5 Vane Number 5 counting from the tongue
VVelocity
VGTVariable geometry turbine
μ Dynamic viscosity
ρ Density
1DOne-dimensional
3DThree-dimensional

References

  1. Williams, M.; Minjares, R. A Technical Summary of Euro 6-VI Vehicle Emission Standards; International Council for Clean Transportation (ICCT): Washington, DC, USA, 2016; pp. 1–17. [Google Scholar]
  2. European Commission. General Union Environment Action Programme to 2020 ‘Living well, within the limits of our planet’. In European Commission: Directorate-General for Environment; European Commission: Brussels, Belgium, 2014. [Google Scholar] [CrossRef]
  3. Praveena, V.; Martin, M. A review on various after treatment techniques to reduce NOx emissions in a CI engine. J. Energy 2018, 91, 704–720. [Google Scholar] [CrossRef]
  4. Sindhu, R.; Rao, G.; Murthy, K. Effective reduction of NOx emissions from diesel engine using split injections. Alex. Eng. J. 2018, 57, 1379–1392. [Google Scholar] [CrossRef]
  5. Vibhute, U.A.; Dube, B.R.; Gavali, D.A.; Lokhande, P.N.; Satpute, P.R. NOx Emission Control Techniques by Using Venturi and Urea. J. Mech. Eng. Appl. Mech. 2016, 1. [Google Scholar]
  6. Germanand, J.; Isenstadt, A. Downsized Boosted Gasoline Engines. Int. Counc. Clean Transp. 2016, 22. [Google Scholar]
  7. Alshammari, M.; Alshammari, F.; Pesyridis, A. Electric Boosting and Energy Recovery Systems for Engine Downsizing. Energies 2019, 12, 4636. [Google Scholar] [CrossRef] [Green Version]
  8. Galindo, J.; Tiseira, A.; Navarro, R.; Tarí, D.; Meano, C.M. Effect of the inlet geometry on performance, surge margin and noise emission of an automotive turbocharger compressor. Appl. Therm. Eng. 2017, 110, 875–882. [Google Scholar] [CrossRef]
  9. Zamboni, G.; Moggia, S.; Capobianco, M. Effects of a Dual-Loop Exhaust Gas Recirculation System and Variable Nozzle Turbine Control on the Operating Parameters of an Automotive Diesel Engine. Energies 2017, 10, 47. [Google Scholar] [CrossRef] [Green Version]
  10. Tiseira, A.; Garcia-Cuevas, L.M.; Inhestern, L.B.; Echavarria, J.D. Numerical simulation of a radial turbine at off-design conditions in presence of choked flow (accepted for publication). In Proceedings of the ASME Turbo Expo 2020: Turbomachinery Technical Conference and Exposition, London, UK, 22–26 June 2020. [Google Scholar]
  11. Gil, A.; Tiseira, A.O.; García-Cuevas, L.; Usaquén, T.; Mijotte, G. Fast three-dimensional heat transfer model for computing internal temperatures in the bearing housing of automotive turbochargers. Int. J. Engine Res. 2018. [Google Scholar] [CrossRef]
  12. Serrano, J.; Olmeda, P.; Tiseira, A.; García-Cuevas, L.; Lefebvre, A. Importance of Mechanical Losses Modeling in the Performance Prediction of Radial Turbochargers under Pulsating Flow Conditions. SAE Int. J. Engines 2013, 6, 729–738. [Google Scholar] [CrossRef] [Green Version]
  13. Suhrmann, J.F.; Peitsch, D.; Gugau, M.; Heuer, T. On the Effect of Volute Tongue Design on Radial Turbine Performance. In Proceedings of the ASME Turbo Expo 2012: Turbomachinery Technical Conference and Exposition, Copenhagen, Denmark, 11–15 June 2012; pp. 891–901. [Google Scholar] [CrossRef]
  14. Qiu, X.; Anderson, M.R.; Baines, N.C. Meanline Modeling of Radial Inflow Turbine With Variable Area Nozzle. In Proceedings of the ASME Turbo Expo 2009: Power for Land, Sea, and Air, Orlando, FL, USA, 8–12 June 2009; Volume 7, pp. 1185–1191. [Google Scholar] [CrossRef]
  15. Roumeas, M.; Cros, S. Aerodynamic Investigation of a Nozzle Clearance Effect on Radial Turbine Performance. In Proceedings of the ASME Turbo Expo 2012: Power for Land, Sea, and Air, Copenhagen, Denmark, 11–15 June 2012; Volume 8, pp. 715–723. [Google Scholar] [CrossRef]
  16. Hayami, H.; Senoo, Y.; Hyun, Y.I.; Yamaguchi, M. Effects of Tip Clearance of Nozzle Vanes on Performance of Radial Turbine Rotor. J. Turbomach. 1990, 112, 58–63. [Google Scholar] [CrossRef] [Green Version]
  17. Liu, Y.; Yang, C.; Qi, M.; Zhang, H.; Zhao, B. Shock, Leakage Flow and Wake Interactions in a Radial Turbine With Variable Guide Vanes. In Proceedings of the ASME Turbo Expo 2014: Power for Land, Sea, and Air, Düsseldorf, Germany, 16–20 June 2014; Volume 2D. [Google Scholar] [CrossRef]
  18. Cornolti, L.; Onorati, A.; Cerri, T.; Montenegro, G. 1D simulation of a turbocharged Diesel engine with comparison of short and long EGR route solutions. Appl. Energy 2013, 111, 1–15. [Google Scholar] [CrossRef]
  19. Bohbot, J.; Chryssakis, C.; Miche, M. Simulation of a 4-Cylinder Turbocharged Gasoline Direct Injection Engine Using a Direct Temporal Coupling Between a 1D Simulation Software and a 3D Combustion Code. SAE Int. 2006. [Google Scholar] [CrossRef]
  20. Inhestern, L.B. Measurement, Simulation, and 1D-Modeling of Turbocharger Radial Turbines at Design and Extreme Off-Design Conditions. Ph.D. Thesis, Universitat Politècnica de València, Valencia, Spain, 2019. [Google Scholar] [CrossRef]
  21. Tamaki, H.; Unno, M. Study on Flow Fields in Variable Area Nozzles for Radial Turbines. Int. J. Fluid Mach. Syst. 2008, 1, 47–56. [Google Scholar] [CrossRef]
  22. Eroglu, H.; Tabakoff, W. LDV Measurements and Investigation of Flow Field Through Radial Turbine Guide Vanes. J. Fluids Eng. Trans. ASME 1991, 113, 660–667. [Google Scholar] [CrossRef]
  23. Karamanis, N.; Martinez-Botas, R.F.; Su, C.C. Mixed Flow Turbines: Inlet and Exit Flow Under Steady and Pulsating Conditions. In Proceedings of the ASME Turbo Expo 2000: Power for Land, Sea, and Air, Munich, Germany, 8–11 May 2000; Volume 1. [Google Scholar] [CrossRef]
  24. Palfreyman, D.; Martinez-Botas, R.; Karamanis, N. Computational and Experimental Investigation of the Aerodynamics of Turbocharger Mixed-Flow Turbines. In Proceedings of the 7th International Conference on Turbochargers and Turbocharging, London, UK, 14 May 2002; pp. 45–60. [Google Scholar]
  25. Galindo, J.; Tiseira, A.; García-Cuevas, L.M.; Gómez, N.H. Experimental approach for the analysis of the flow behavior in the stator of a real centripetal turbine. Int. J. Engine Res. 2020. [Google Scholar] [CrossRef]
  26. Ioannou, E.; Costall, A.; Khairuddin, U.; Ramasamy, P.; Haigh, E. Turbocharger Turbine Aerodynamic Optimization for Reduced Fuel Consumption and CO2 Emissions from Heavy-Duty Diesel Engines: Experimental Validation and Flow Field Analysis. In Proceedings of the 13th International Conference on Turbochargers and Turbocharging, London, UK, 16–17 May 2018; pp. 373–388. [Google Scholar]
  27. Dufour, G.; Carbonneau, X.; Cazalbou, J.B.; Chassaing, P. Practical Use of Similarity and Scaling Laws for Centrifugal Compressor Design. In Proceedings of the ASME Turbo Expo 2006: Power for Land, Sea, and Air, Barcelona, Spain, 8–11 May 2006; Volume 6, pp. 1131–1140. [Google Scholar] [CrossRef]
  28. Tancreza, M.; Galindo, J.; Guardiola, C.; Fajardo, P.; Varnier, O. Turbine adapted maps for turbocharger engine matching. Exp. Therm. Fluid Sci. 2011, 35, 146–153. [Google Scholar] [CrossRef]
  29. SAE. Turbocharger gas stand test code SAE J1826. Soc. Automot. Eng. 1995. [Google Scholar]
  30. Perry, R. Perry’s Chemical Engineers’ Handbook, 6th ed.; McGraw-Hill: New York, NY, USA, 1984. [Google Scholar]
  31. Menter, F. Two-equation eddy-viscosity turbulence models for engineering applications. AIAA J. 1994, 32, 1598–1605. [Google Scholar] [CrossRef] [Green Version]
  32. Broatch, A.; Galindo, J.; Navarro, R.; García-Tíscar, J. Methodology for experimental validation of a CFD model for predicting noise generation in centrifugal compressors. Int. J. Heat Fluid Flow 2014, 50, 134–144. [Google Scholar] [CrossRef]
  33. Smirnov, P.; Hansen, T.; Menter, F. Numerical Simulation of Turbulent Flows in Centrifugal Compressor Stages With Different Radial Gaps. In Proceedings of the ASME Turbo Expo 2007: Power for Land, Sea, and Air, Montreal, QC, Canada, 14–17 May 2007; Volume 6, pp. 1029–1038. [Google Scholar] [CrossRef]
  34. Serrano, J.R.; Olmeda, P.; Arnau, F.J.; Dombrovsky, A.; Smith, L. Analysis and Methodology to Characterize Heat Transfer Phenomena in Automotive Turbochargers. J. Eng. Gas Turbines Power 2015, 137, 1–11. [Google Scholar] [CrossRef]
  35. Serrano, J.R.; Olmeda, P.; Arnau, F.J.; Dombrovsky, A.; Smith, L. Turbocharger heat transfer and mechanical losses influence in predicting engines performance by using one-dimensional simulation codes. Energy 2015, 86, 204–218. [Google Scholar] [CrossRef] [Green Version]
  36. Baar, R.; Biet, C.; Boxberger, V.; Mai, H.; Zimmermann, R. New Evaluation of Turbocharger Components Based on Turbine Outlet Temperature Measurements in Adiabatic Conditions. Int. Symp. Transp. Phenom. Dyn. Rotating Mach. 2014, 15. [Google Scholar]
  37. Zimmermann, R.; Baar, R.; Biet, C. Determine the isentropic turbine efficiency due to adiabatic measurements, and the validation of the conditions via a new criterion. In Proceedings of the 12th International Conference on Turbochargers and Turbocharging, London, UK, 17–18 May 2016. [Google Scholar]
  38. Serrano, J.R.; Tiseira, A.; García-Cuevas, L.M.; Inhestern, L.B.; Tartoussi, H. Radial turbine performance measurement under extreme off-design conditions. Energy 2017, 125, 72–84. [Google Scholar] [CrossRef] [Green Version]
  39. Serrano, J.R.; Gil, A.; Navarro, R.; Inhestern, L.B. Extremely Low Mass Flow at High Blade to Jet Speed Ratio in Variable Geometry Radial Turbines and its Influence on the Flow Pattern: A CFD Analysis. In Proceedings of the ASME Turbo Expo 2017: Power for Land, Sea, and Air, Charlotte, NC, USA, 26–30 June 2017; Volume 8. [Google Scholar] [CrossRef]
  40. Menter, F.R.; Kuntz, M.; Langtry, R. Ten years of industrial experience with the SST turbulence model. In Proceedings of the Volume 4th Internal Symposium, Turbulence, Heat and Mass Transfer, Antalya, Turkey, 12–17 October 2003; pp. 625–632. [Google Scholar]
  41. Serrano, J.R.; Navarro, R.; García-Cuevas, L.M.; Inhestern, L.B. Contribution to tip leakage loss modeling in radial turbines based on 3D flow analysis and 1D characterization. Int. J. Heat Fluid Flow 2019, 78, 108423. [Google Scholar] [CrossRef]
  42. Choi, M.; Baek, J.; Chung, H.; Oh, S.; Ko, H. Effects of the low Reynolds number on the loss characteristics in an axial compressor. Proc. Inst. Mech. Eng. Part A J. Power Energy 2008, 222, 209–218. [Google Scholar] [CrossRef]
  43. Klausner, J.E.; Gampe, U. Evaluation and Enhancement of a One-Dimensional Performance Analysis Method for Centrifugal Compressors. In Proceedings of the ASME Turbo Expo 2014: Turbomachinery Technical Conference and Exposition, Düsseldorf, Germany, 16–20 June 2014. [Google Scholar] [CrossRef]
  44. Tiainen, J.; Jaatinen-Värri, A.; Grönman, A.; Turunen-Saaresti, T.; Backman, J. Effect of freestream velocity definition on boundary layer thickness and losses in centrifugal compressors. J. Turbomach. 2018, 140. [Google Scholar] [CrossRef]
  45. Vinuesa, R.; Hosseini, S.M.; Hanifi, A.; Henningson, D.S.; Schlatter, P. Pressure-gradient turbulent boundary layers developing around a wing section. Flow Turbul. Combust. 2017, 99, 613–641. [Google Scholar] [CrossRef] [Green Version]
Figure 1. Scaled 3:1 turbine model.
Energies 13 02930 g001
Figure 2. Computational domain.
Energies 13 02930 g002
Figure 3. Turbine reduced mass flow map (a) and turbine efficiency map (b) with the selected operating point at 80% VGT opening and at 3890 rpm/K 0.5 .
Energies 13 02930 g003
Figure 4. (a) The difference of pressure loss with respect to the finest mesh vs. y + ; (b) flow acceleration vs. y + ; prism layer cells: A = 19; B = 15; C = 12; D = 8.
Energies 13 02930 g004
Figure 5. Final mesh: (a) overview; (b) side view with tip mesh detail.
Energies 13 02930 g005
Figure 6. Global Mach number distribution at the stator midspan.
Energies 13 02930 g006
Figure 7. Mach number distribution at the stator midspan.
Energies 13 02930 g007
Figure 8. Local total pressure ratio p t o t , i n l e t / p t o t at the stator midspan.
Energies 13 02930 g008
Figure 9. C p coefficient comparison at the midspan.
Energies 13 02930 g009
Figure 10. Local Reynolds number distribution in the tip gap.
Energies 13 02930 g010
Figure 11. Boundary layer thickness explanation scheme.
Energies 13 02930 g011
Figure 12. Evolution of the boundary layer in terms of thickness.
Energies 13 02930 g012
Figure 13. 3D printed scaled turbine.
Energies 13 02930 g013
Figure 14. Access PIV view.
Energies 13 02930 g014
Figure 15. Optical accesses for PIV.
Energies 13 02930 g015
Table 1. Geometry specifications.
Real TurbineScaled Turbine
Stator
Volute inlet diameter34 m m 102 m m
Nozzle vane height8 m m 24 m m
Separator pins3 ( D = 8   m m )-
Blade number1111
Chord length 17.5   m m 52.5   m m
Tip clearance 0.2   m m 0.5   m m
Rotor
Blade number9-
Inlet radius r tip , in 20.05   m m -
Outlet radius r tip , out 19 m m -
Leading edge thickness Δ θ 0.0195 rad-
Table 2. Boundary conditions.
S T R T M a R T R e R T M a , R e
m ˙ (kg/s)0.3140.0380.1130.105
m ˙ r e d . (kgK 0.5 s 1 bar 1 )5.4730.6081.2740.608
p t o t , i n l e t (bar)1.0651.1611.6433.195
p s t a t , o u t l e t (bar)1112.765
T t o t , i n l e t (K)343.15343.15343.15343.15
μ (Nsm 2 )1.855  × 10 5 1.855  × 10 5 1.855  × 10 5 1.855  × 10 5
I (-)0.010.040.040.04
l (m)0.010.0030.0030.003
Table 3. Tip mesh refinement.
CellsAR (-) Δ P Δ P Finest (Pa) y + (-)
121/5092.40.988
151/5060.40.984
161/5043.60.980
151/4033.10.982
151/5586.30.984

