Article

A Fast-Algorithmic Probabilistic Evaluation on Regional Rate of Change of Frequency (RoCoF) for Operational Planning of High Renewable Penetrated Power Systems

1
Department of Electrical Engineering, The Hong Kong Polytechnic University, Hong Kong, China
2
College of Information Science and Engineering, Northeastern University, Shenyang 110819, China
3
Power System Department, China Electric Power Research Institute, Haidian District, Beijing 100192, China
*
Author to whom correspondence should be addressed.
Energies 2020, 13(11), 2780; https://doi.org/10.3390/en13112780
Submission received: 5 May 2020 / Revised: 27 May 2020 / Accepted: 28 May 2020 / Published: 1 June 2020

Abstract

:
The high rate of change of frequency (RoCoF) issue incurred by the integration of renewable energy sources (RESs) into a modern power system significantly threatens the grid security, and thus needs to be carefully examined in the operational planning. However, severe fluctuation of regional frequency responses concerned by system operators could be concealed by the conventional assessment based on aggregated system frequency response. Moreover, the occurrence probability of a high RoCoF issue is actually a very vital factor during the system planner’s decision-making. Therefore, a fast-algorithmic evaluation method is proposed to determine the probabilistic distribution of regional RoCoF for the operational planning of a RES penetrated power system. First, an analytical sensitivity (AS) that quantifies the relationship between the regional RoCoF and the stochastic output of the RES is derived based on the generator and network information. Then a linear sensitivity-based analytical method (LSM) is established to calculate the regional RoCoF and the corresponding probabilistic distribution, which takes much less computational time when comparing with the scenario-based simulation (SBS) and involves much less complicated calculation procedure when comparing with the cumulant-based method (CBM). The effectiveness and efficiency of the proposed method are verified in a modified 16-machine 5-area IEEE benchmark system by numerical SBS and analytical CBM.

Graphical Abstract

1. Introduction

The integration of renewable energy sources (RESs) brings an increasing number of stochastic disturbances into power systems [1,2,3,4] and meanwhile considerably reduces the system inertia [5,6,7], which hence incurs higher rate of change of frequency (RoCoF) than ever before [8,9], and sometimes even serious incidents [10]. The recent London blackout on 9 August 2019 has drawn wide attention, and the official investigation report [10] indicates that a sudden reduction in the power output of the Hornsea offshore wind farm has worsened the RoCoF significantly, which further causes the enormous loss of both generations and demands. Hence, there is a pressing need to evaluate the impact of stochastic variation of RESs on the RoCoF in modern operational planning.
To accommodate the uncertainties brought by RESs, the safe operation of the system under the assumed “worst-case scenario” is guaranteed by reserving excessive conventional generation in real-time operation. However, the “worst-case scenario” where the uncertain disturbances of all the RESs reach maximum simultaneously rarely happens in a highly RES-penetrated power system because of spatiotemporal uncorrelation among the same or different types of the RESs in the network. For different types of RESs, wind power plants often reach the maximal output in the night while the photovoltaic plants only generate during the daytime. For the same type of RESs located in different places, the correlation of their stochastic output can be quite low. Both factors above significantly reduce the occurrence probability of the simultaneous maximal output of renewable energy plants. Thereby, a two-dimensional evaluation including both the severity and the occurrence probability of the event could be more beneficial for the system planner to make a decision, which may further increase the allowed penetration level of RESs. There are two common approaches to achieve the two-dimensional evaluation mentioned above [11,12,13,14]. (1) Monte Carlo simulation (MCS), which aims to compute the probabilistic distribution of the concerned indices by generating a large number of random variables and thus, simulation results. In [13], scenario-based simulation (SBS), similar to MCS, is proposed to calculate the maximal renewable energy penetration limits to maintain the frequency performance by considering numerous potential operational scenarios. The results from the SBS are accurate, but its calculation procedure is very time-consuming, which is normally regarded as a verification tool. (2) Analytical method, e.g., cumulant-based analytical method (CBM), calculates the distribution of the concerned indices based on the sensitivity and the series expansion. This method can comfortably accommodate arbitrary types of continuous or noncontinuous distribution and correlation of stochastic variables [14], which is proven to be the most efficient and accurate way to conduct probabilistic small-signal stability analysis in [15]. In [16], a probabilistic assessment framework on system RoCoF is proposed based on the CBM for the operational planning of a power system with RESs. However, the calculation procedure of the CBM is very complicated and not easy to implement.
The system frequency response (SFR), as an overall performance of the system frequency, is aggregated by frequency responses of the individual generator [17] and normally required to remain within a specific range set by the system operator [18]. While the heterogeneity of different regional frequency responses would be more obvious because of the increasing penetration level of distributed RESs and uneven distribution of inertia sources, which cannot be simply revealed by an integrated SFR [19,20,21]. Reference [13] reports that regional RoCoF violates the given limits, whereas the system RoCoF operates safely after the disturbance, which demonstrates the necessity of regional RoCoF assessment. Moreover, the RoCoF at the disturbance instant (i.e., t = 0+) is usually observed to be the worst RoCoF without any assistance from the system fast-acting control [19,22,23,24]. Hence, regional RoCoF deserves a careful investigation in the operational planning stage to avoid the potential risk of RoCoF violation.
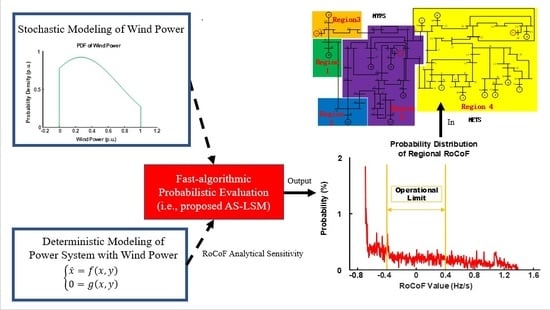
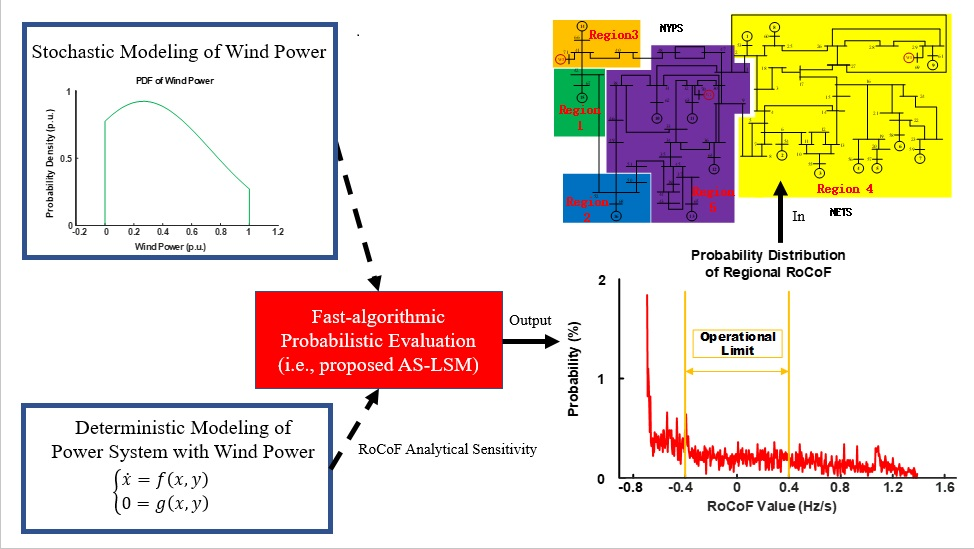
Taking all the points above into consideration, the paper proposes a novel fast-algorithmic evaluation to efficiently determine the probabilistic distribution of regional RoCoF, which demonstrates a clear superiority over the time-consuming SBS and the complicated CBM. The main contributions of the paper are listed below accordingly:
1. By combining the analytical sensitivity (AS) of RoCoF and the linear sensitivity-based method (LSM), AS-LSM is proposed to calculate the RoCoF. AS can adequately reflect the essential relationship between the variation of RESs and the RoCoF. Together with AS, LSM enables the evaluation of the RoCoF considering a complex multi-RES environment by using a superimposing technique, which considerably facilitates the understanding and implementation.
2. The proposed AS-LSM can facilitate the calculation for the probabilistic distribution of regional RoCoF. As a combination of numerical and analytical methods for probabilistic computation, the AS-LSM has a higher computing efficiency compared with SBS and a more straightforward calculation procedure compared with CBM.
3. The proposed AS-LSM could determine the probabilistic distribution of regional RoCoF influenced by the correlation of wind speed distribution more accurately than AS-CBM (i.e., CBM based on AS).
The rest of the paper is organized as follows. In Section 2, regional analytical sensitivity (AS) of RoCoF is derived based on the generator and network information. Based on the derived regional AS and the linear sensitivity-based method (LSM), regional RoCoF in a multi-RES penetrated power system is calculated by the proposed AS-LSM in Section 3. Case studies are conducted in Section 4 to verify the effectiveness and efficiency of the proposed method with consideration of different wind speed correlations. The conclusion is drawn in Section 5.

2. Analytical Sensitivity (AS) of Regional RoCoF w.r.t a Single Disturbance

For a single-machine system, the RoCoF is directly expressed as (1) according to [25]:
R o C o F = f ( t ) d t = 1 2 H P ( t )  
where H is the inertia, f ( t ) is the frequency deviation from the nominal frequency f 0 , and P ( t ) is the imposed active power disturbance.

2.1. Generator-Level Power Disturbance Propagation and Its Distribution Coefficient

At the moment of the disturbance occurring (t = 0+), the system active power disturbance ( P D i s t ), which is incurred by the sudden change of RES in this paper, would propagate in the system. The active power disturbance component distributed to each generator bus P i ( 0 + ) can be determined by the synchronizing power coefficients ( P s i k ) between the location of the RES and the individual generator [17]. The propagating procedure is illustrated by Figure 1.
First, the full network is reduced to the N+1 bus equivalent network, where N is the total number of the generators in the network, and “1” refers to the single RES. Second, the synchronizing power coefficients ( P s i k ) between RES, i.e., bus k and, the ith generator bus is calculated as (2) according to [17].
P s i k = V i V k ( B i k cos δ i k 0 G i k sin δ i k 0 )  
where V i and V k are the voltage magnitude of bus i and bus k, respectively. B i k and G i k are the imaginary and real parts of the equivalent admittance between bus i and bus k separately. δ i k 0 is the steady angle difference between bus i and bus k.
Then the distribution coefficient of power disturbance ( P c ) is defined as a percentage in (3), which quantifies what percentage of active power disturbance from a single RES could arrive at the individual generator bus [17]. The active power disturbance component allocated to each generator bus, i.e., P i ( 0 + ) w.r.t the stochastic output of RES ( P D i s t ) can be computed by (4).
P c i = P s i k i = 1 N P s i k  
P i ( 0 + ) = P c i P D i s t  

2.2. Regional Power Disturbance Propagation and Its Distribution Coefficient

Based on the above analysis, the active power disturbance component allocated to a region equals the sum of the active power disturbance distributed to the individual generator bus in this region.
P j ( 0 + ) = i = 1 G P i j ( 0 + )  
where, P j ( 0 + ) is the located active power disturbance component in the jth area, P i j is the active power disturbance distributed to the ith generator bus in the jth area and G is the number of generators in the jth area. Substituting (4) into (5), the regional active power disturbance distributed from system active power disturbance source is obtained in (6), where the regional distribution coefficient of power disturbance is defined in (7).
P j ( 0 + ) = i = 1 G P c i j   P D i s t = P c j   P D i s t  
P c j = i = 1 G P s i k i = 1 N P s i k  
where   P c j refers to the jth area   P c w.r.t the output of RES, and N is the total number of the generators in the network.

2.3. Analytical Sensitivity (AS) of Generator-Level RoCoF

The generator-level RoCoF is calculated as (8) by substituting (4) into (1), where the generator-level AS is defined in (9).
R o C o F i = 1 2 H i P c i P D i s t = A S i P D i s t  
A S i = 1 2 H i × P s i k i = 1 N P s i k  
where R o C o F i is the RoCoF of the ith generator and the A S i is the AS of R o C o F i w.r.t the output of the RES.

2.4. Analytical Sensitivity (AS) of Regional RoCoF

In a multi-machine system, an active power disturbance would cause various frequency responses of different generators in a power system. Traditionally, system frequency response, as an overall performance of all the frequency responses in the system, is aggregated based on the concept of the center of inertia (COI), where all generators are integrated into one equivalent generator with the sum of inertia under a base power capacity [17]. Hence, a similar method is applied here to calculate the regional center of inertia (RCOI), which is defined as follows.
First, the base power capacity of the system is selected, and the individual inertia constant under a base power capacity ( H i ) is acquired in (10):
H i = H i , o × ( S i S b a s e )
where H i , o is the ith inertia constant w.r.t its rated power capacity S i , and S b a s e is the base power capacity.
Then the RCOI of the jth area ( H j ) is defined in (11):
H j = i = 1 G H i j  
where   H i j is the inertia of the ith generator in the jth area, and G is the number of generators in the jth area. The superscript refers to the number of the area.
In [17], COI frequency is defined as f C O I = i = 1 N f i H i / i = 1 N H i , where f i is the frequency response of the ith generator, and N is the number of generators. It can be revealed that the COI frequency is the weighted average of the frequency response of each generator, and the weighted coefficient is the percentage of the inertia of individual generator over the system inertia. A similar approach is employed to calculate the RCOI frequency for the jth area ( f R C O I j ), as defined by (12):
f R C O I j = i = 1 G H i j f i j i = 1 G H i j  
where f i j is the frequency response of the ith generator in the jth area, and G is the number of the generators in the jth area.
By using the concept of a regional equivalent generator, the regional RoCoF ( R o C o F j ) is derived in (13) by substituting (6) and (11) into (1), where the regional analytical sensitivity ( A S j ) is defined in (14).
R o C o F j = 1 2 H j P j ( 0 + ) = 1 2 k = 1 G H k j P c j   P D i s t = A S j P D i s t  
A S j = 1 2 k = 1 G H k j × i = 1 G P s i k i = 1 N P s i k  
where R o C o F j is the RoCoF of the jth area, the A S j is the AS of the R o C o F j , and G is the number of the generators in the jth area.

3. Probabilistic Distribution of Regional RoCoF in a Multi-RES Penetrated Power System

3.1. Regional Active Power Disturbance Integration

From the above analysis, the propagation and distribution of system active power disturbance from the RES depend on the “electrical distance” between the RES and each generator bus at t = 0+ demonstrated by (4). In a multi-RES penetrated power system, it is reasonable to assume that the active power disturbance distributed to a generator bus equals the sum of the active power disturbance allocated to the same bus from different RESs, which is expressed by (15). As mentioned above the active power disturbance distributed to a region equals the sum of the active power allocated to the individual generator bus in a coherent area, the regional active power disturbance component in a multi-RESs penetrated system can be depicted in (16).
P i ( 0 + ) = l = 1 M P D i s t i l = l = 1 M P s i l i = 1 N P s i l P D i s t l = l = 1 M P c i l P D i s t l  
P j ( 0 + ) = i = 1 G   P i ( 0 + ) = i = 1 G l = 1 M P c i l P D i s t l    
where P D i s t i l and P c i l are the distributing active power and distribution coefficient of the ith generator bus from the lth RES, respectively. P D i s t l is the active power disturbance of the lth RES. M is the number of the RES in the system, and G is the number of generators in the jth area.
The propagating procedure of the active power disturbance from multiple RESs is illustrated in Figure 2. Assume there are M RESs and N generators in the system. First, each RES spreads the active power disturbance to individual generator bus through the reduced N + 1 network, where P D i s t i j is the active power allocated to the ith generator bus from the jth RES. Then, the total active power ( P i ) distributed to a single generator bus equals the sum of the active power distributed to this bus from different RESs. In addition, the regional active power disturbance equals the sum of the active power disturbance distributed to the generator bus in the coherent region. For example, when the first i generators are in Area 1, the active power disturbance distributed to Area 1 ( P 1 ) is equivalent to the sum of the active power distributed to the generator bus in Area 1, i.e.,   P k ,   k = 1 i , as shown in Figure 2.

3.2. Regional RoCoF Integration Based on Analytical Sensitivity and Linear Sensitivity-Based Method (AS-LSM)

A linear sensitivity-based method (LSM), which is capable of accommodating multiple stochastic variables (i.e., active power disturbance from RESs), is proposed here to compute the critical index (i.e., regional RoCoF) with a linear relationship (i.e., AS). Hence, the regional RoCoF based on AS-LSM is established in (17), and the full representation is given in (18).
R o C o F j = l = 1 M A S l j P D i s t l  
R o C o F j = 1 2 k = 1 G H k j i = 1 G l = 1 M P s i l i = 1 N P s i l P D i s t l   .  
where G and N are the number of the generator in the jth area and the system, respectively, and M is the number of RES in the system. A S l j . stands for AS of R o C o F j w.r.t the output of the lth RES.
The system-level RoCoF is a particular case of regional RoCoF when G = N and the (18) degrades to (19). Furthermore, when there is only one disturbance in the system, the (19) further degrades to (1).
R o C o F = 1 2 k = 1 N H k l = 1 M P D i s t l  

3.3. Calculation Procedure of Probabilistic Distribution of Regional RoCoF

The flow chart of the calculation procedure of probabilistic distribution of regional RoCoF by AS-LSM is illustrated in Figure 3 and described as follows: (1) The information of the RES is obtained including type, number, capacity, steady output, probabilistic distribution of natural source, and the correlation coefficient matrix, based on which active power variation sample series is generated; (2) the information of the generator and the network is acquired; (3) on the basis of the above data, an analytical coherency identification method, e.g., slow coherency identification [26], is implemented to divide the system into several areas and the interested region is selected; (4) the concerned regional AS w.r.t the output of individual RES is calculated according to (14), and (5) AS-LSM is employed to determine the regional RoCoF based on the stochastic output of individual RES and the related regional AS by (17). This step repeats to get the probabilistic distribution of the regional RoCoF, and the number of the iterations depends on the number of generated sample series in step 2.

4. Case Study

The effectiveness of the proposed AS-LSM is verified by SBS with 5000 times simulation, and AS-CBM is also applied to examine the probabilistic distribution of regional RoCoF for the first time because of its proven good performance on the probabilistic computation of system RoCoF [
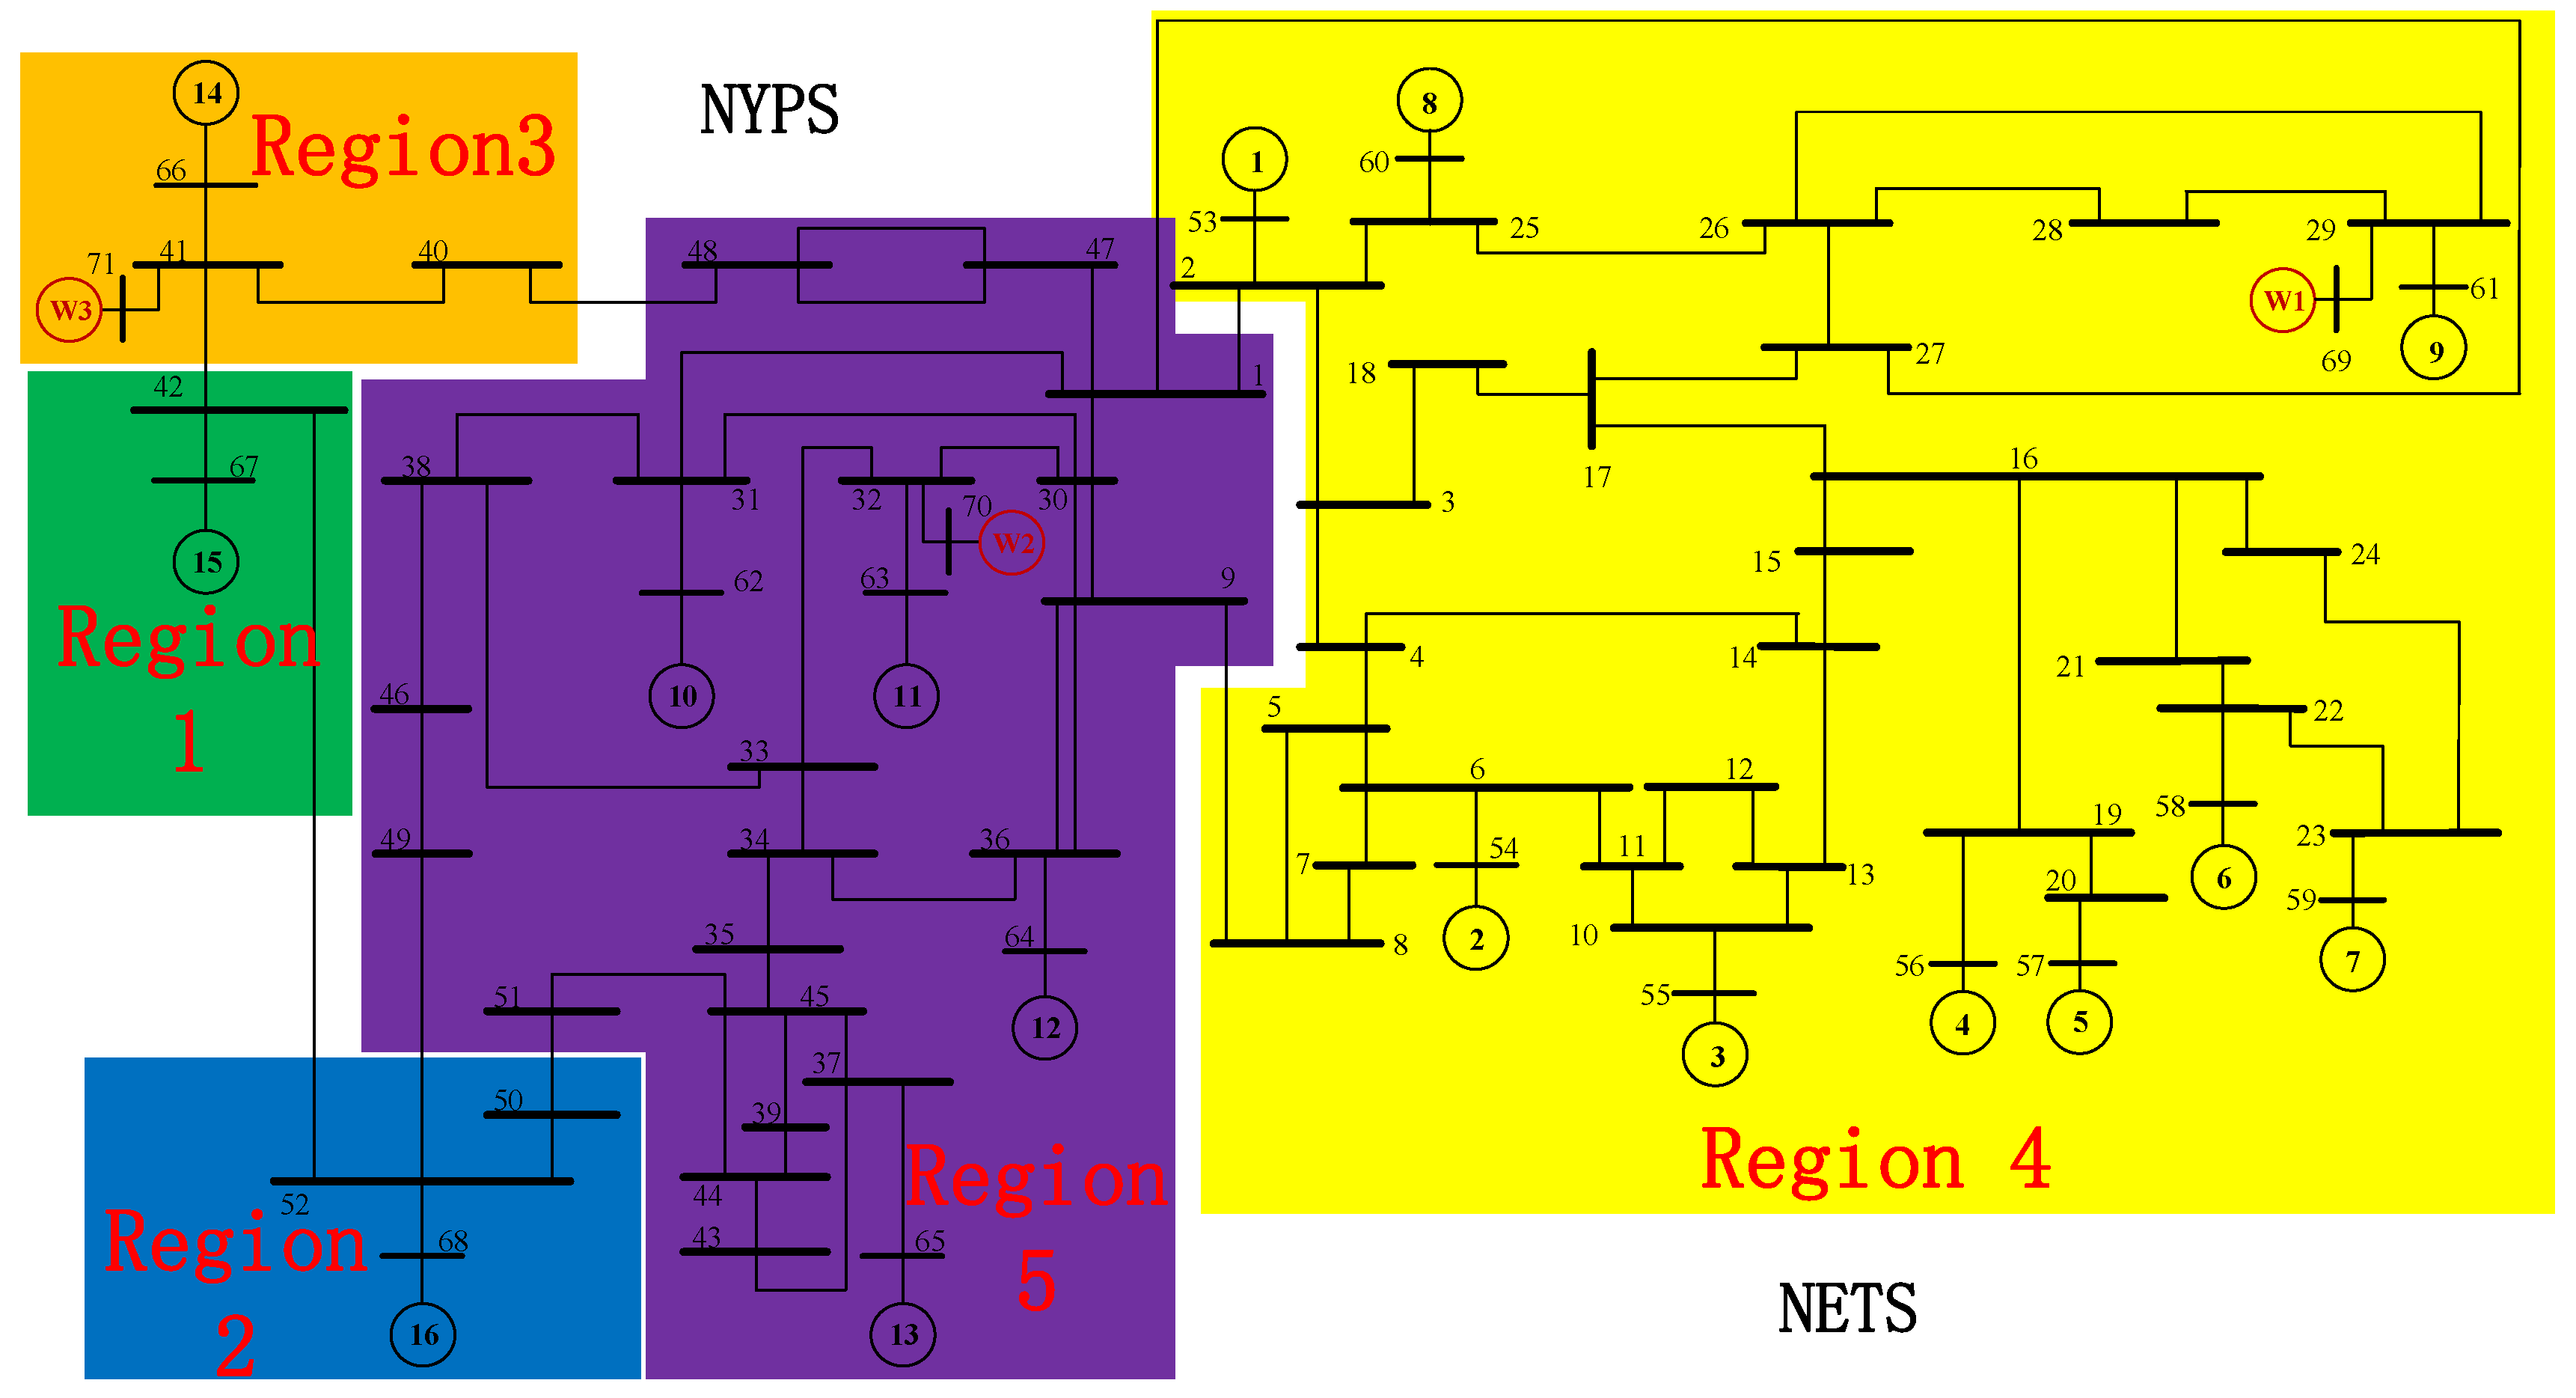
16]. The benchmark system is selected as a modified IEEE 16-machine 68-bus system with three wind farms (WFs) connected to bus 29, 32, and 41 respectively in Figure 4 partitioned by slow coherency identification method [26]. The probabilistic distributions of Region 4 and Region 5 are selected as the focus of the paper since they are the areas that contain more than one single generator. There are two scenarios studied in this section, i.e., with and without the correlations of wind speed.
The base capacity of the system is 100MVA. The operational state of the system decreases to 50% of the original level (system load, generation, and corresponding inertia). The capacity of each wind plant is 6 p.u, and the steady output is 2 p.u. The penetration of wind energy is defined by the ratio of the capacity of the WFs over the system load in [27], which is 19.7% in this section.
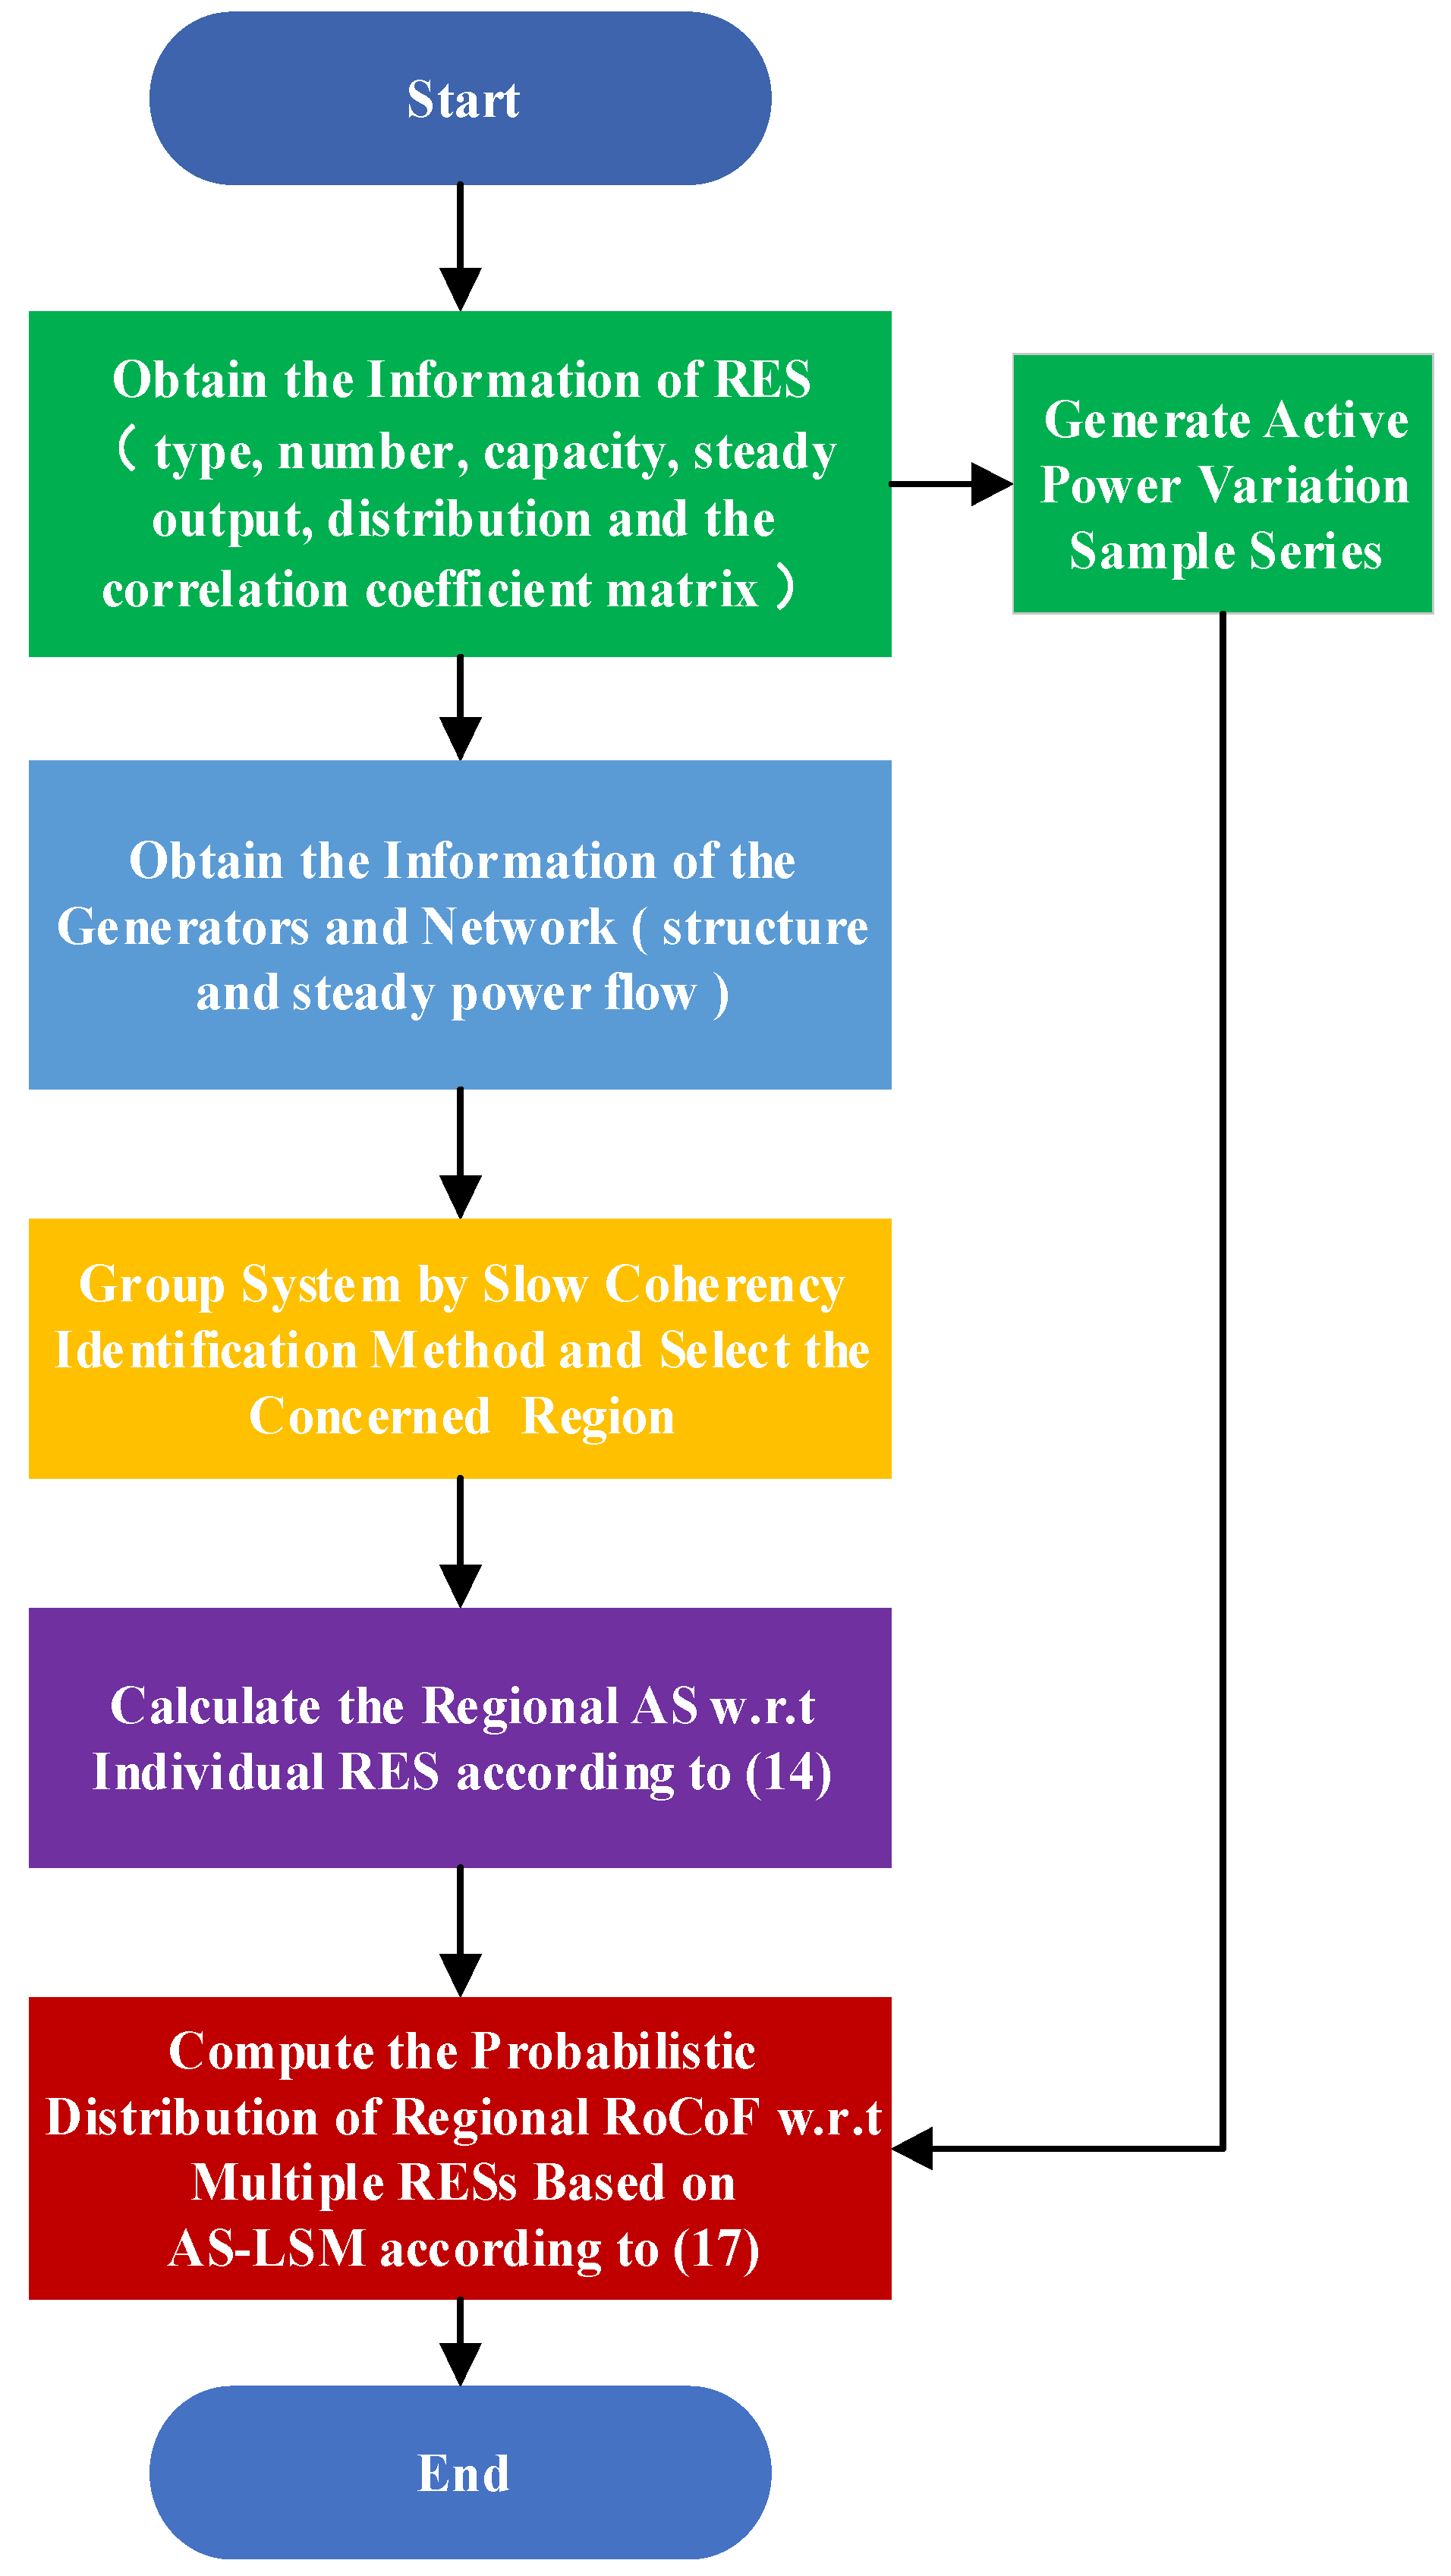
Based on the calculation procedure in Figure 3, after information acquisition and the system partition, the regional ASs w.r.t the output of individual WF are calculated according to (14), and the results are represented in Table 1. For system-level analysis, the system is equivalent to one generator without considering the “electric distance,” which is also proven by (14) when n equals g, and hence, the system AS w.r.t the output of different WFs are the same. However, there is a large difference among the AS of regional RoCoF w.r.t the output of different WFs due to the comprehensive influences from both “electric distance” and regional inertia. In details, the AS of Region 4 RoCoF w.r.t WF2 and 3 is small (i.e., 0.049267 and 0.004431), whereas the sensitivity w.r.t WF1 is relatively large (i.e., 0.294051), which is caused by different “electric distance.” Furthermore, the maximal and minimal ASs of all regional RoCoFs w.r.t WF1 are 0.294051 and 0.000983 respectively, and the difference stems from the various regional inertia.

4.1. Scenario One (Uncorrelated Wind Speed)

The correlation between two wind power sources is closely related to their geographical distance, based on which correlation coefficient matrix [ ρ i j ] m × m for m grid-connected wind power sources is established [28], and the wind speed distribution in [29] is applied. In this scenario, the distances among each two WFs are assumed to be larger than 1200 km, which means there is no correlation among each WF, and hence the correlation matrix is a unit matrix.
Based on the AS in 
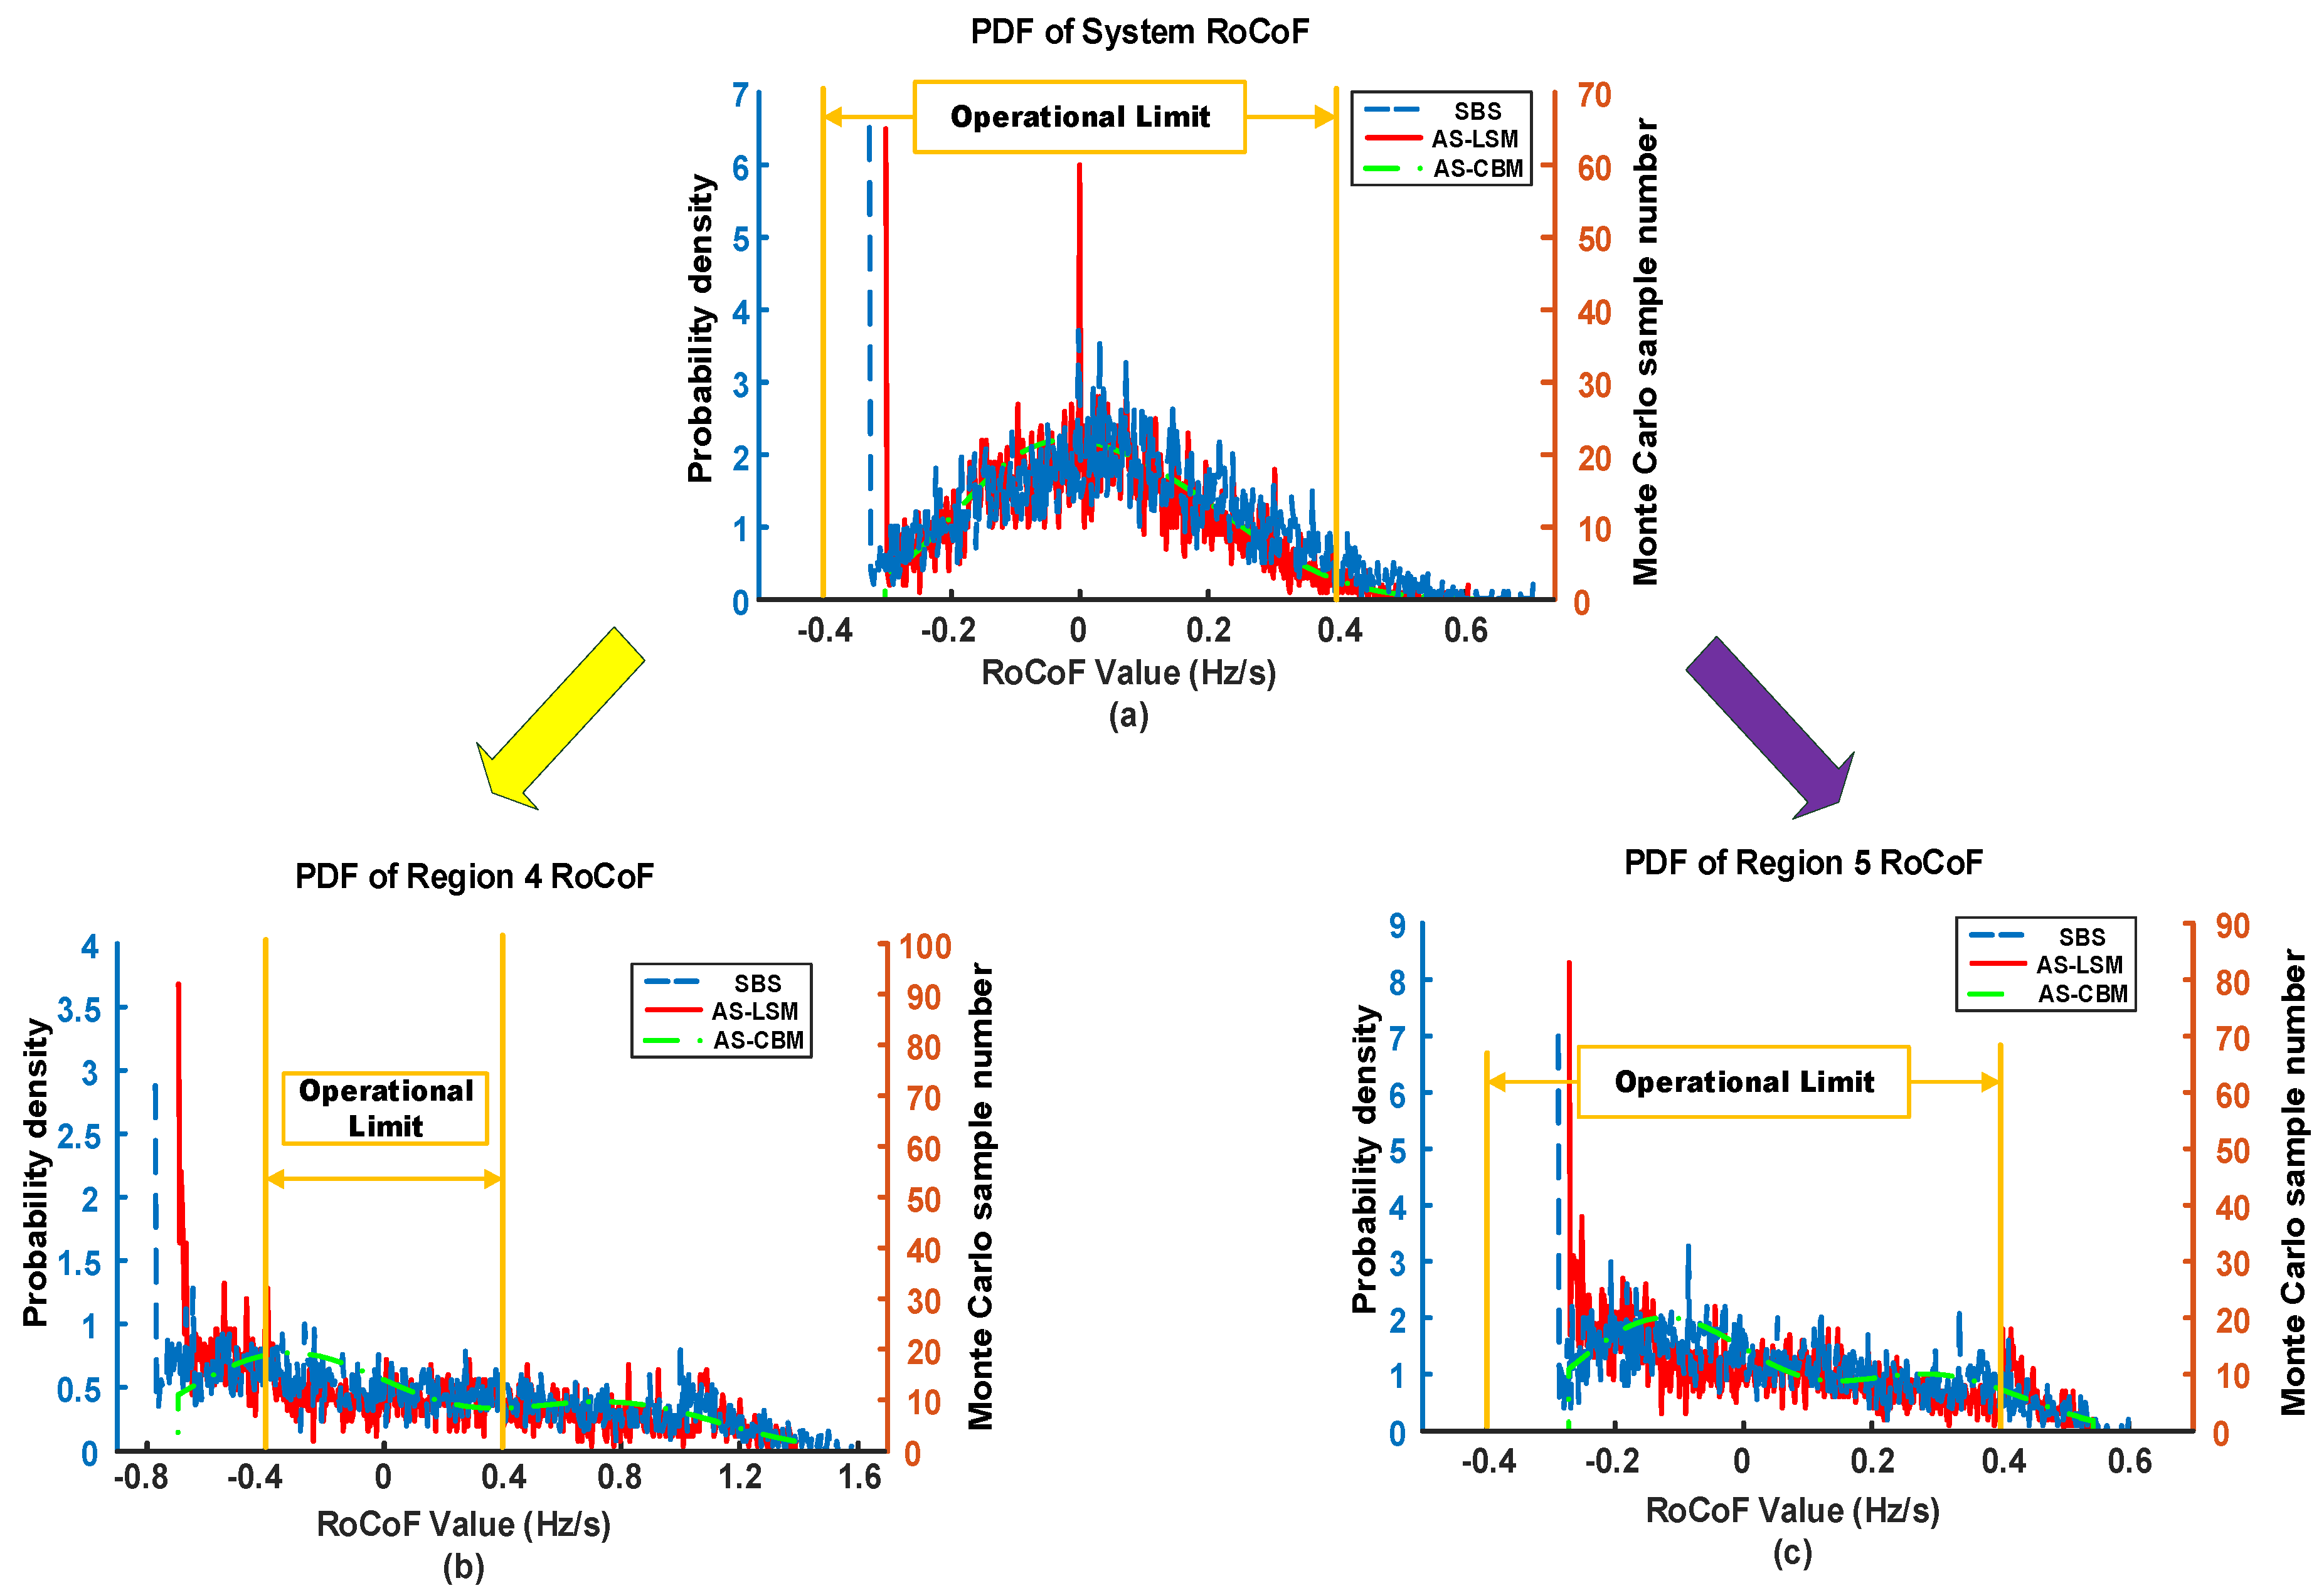
Table 1, AS-LSM and AS-CBM are employed to calculate the probabilistic distribution of the system/regional RoCoF, which are examined by SBS in Figure 5. The probabilistic density functions (PDFs) of the system, Region 4, and Region 5 RoCoF are exhibited in Figure 5a–c, respectively. The operational limit of the RoCoF is concerned by the system operator, which is set ±0.4 Hz/s for demonstration [16], and the detailed comparisons are given in Table 2 and Table 3.
The AS-LSM and AS-CBM perform well in computing the probabilistic distribution of the RoCoF in the system, Region 4, and Region 5 intuitively, as displayed in Figure 5. Furthermore, it is also discovered that the shapes of the probabilistic distributions of the system RoCoF and the regional RoCoFs are different, but both methods could approach the trend, which is verified by the detailed result in both Table 2 and Table 3. The absolute errors of the probabilistic results by both AS-LSM and AS-CBM, as presented in Table 3, reveal that the probabilistic distributions of system RoCoF calculated by both methods are relatively stable compared with that of regional RoCoFs. For example, the probabilistic result of Region 4 RoCoF can be estimated more accurately by AS-LSM than that by AS-CBM with less deviation (0.48% vs. 2.2733%). While the AS-CBM has a better performance than AS-LSM in calculating the probabilistic distribution of Region 5 RoCoF (0.1451% vs. 2.14%).
The computational time of each method are compared in Table 4. Both AS-LSM and AS-CBM are more than 1000 times faster than SBS, while the AS-LSM is a little faster because of the simple calculation procedure, which avoids a large amount of computation on Gram-Charlier expansion.

4.2. Scenario Two (Correlated Wind Speed)

In this scenario, the correlation coefficient between WF2 and WF3 is set to be 0.8 (highly correlated) as (20).
[ ρ ] 3 × 3 = [ 1 0 0 0 1 0.8 0 0.8 1 ]  
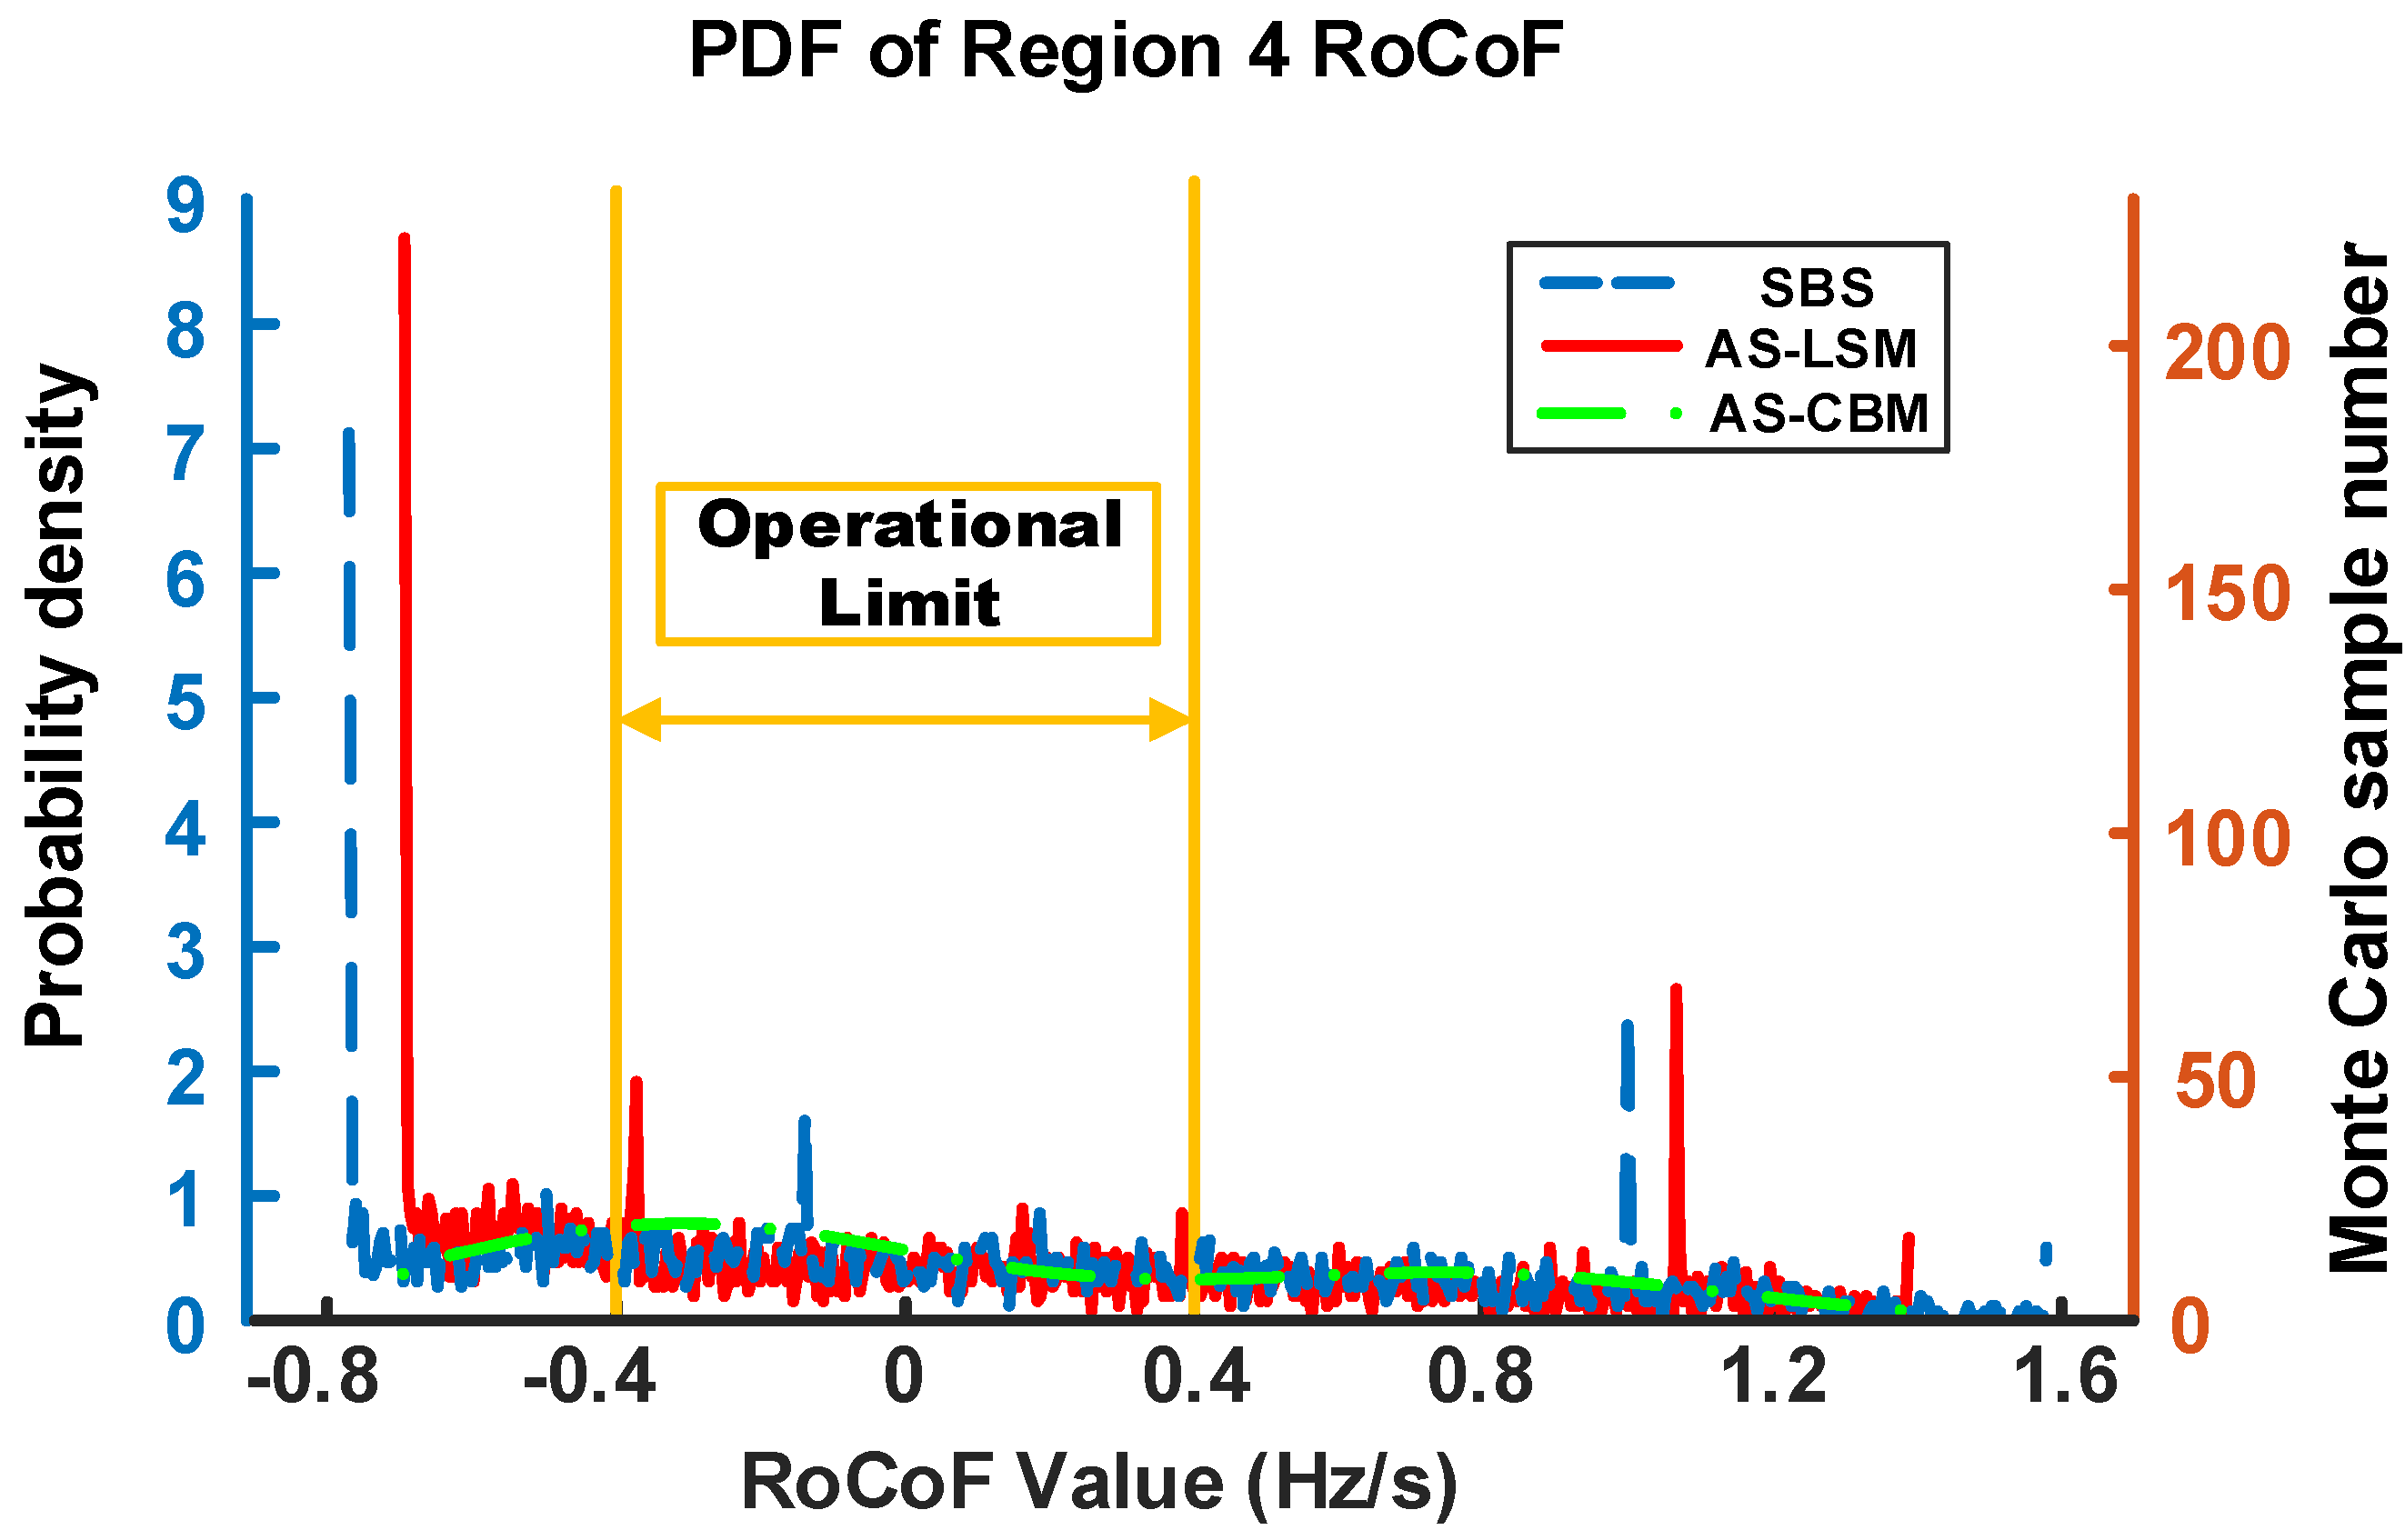
The PDFs of RoCoF on the system and Region 4 are given in Figure 6 and Figure 7, respectively, for illustration, while the PDF of RoCoF associated with Region 5 is not given due to similar outcomes. The detailed probabilistic results and errors are also listed in Table 5 and Table 6, respectively.
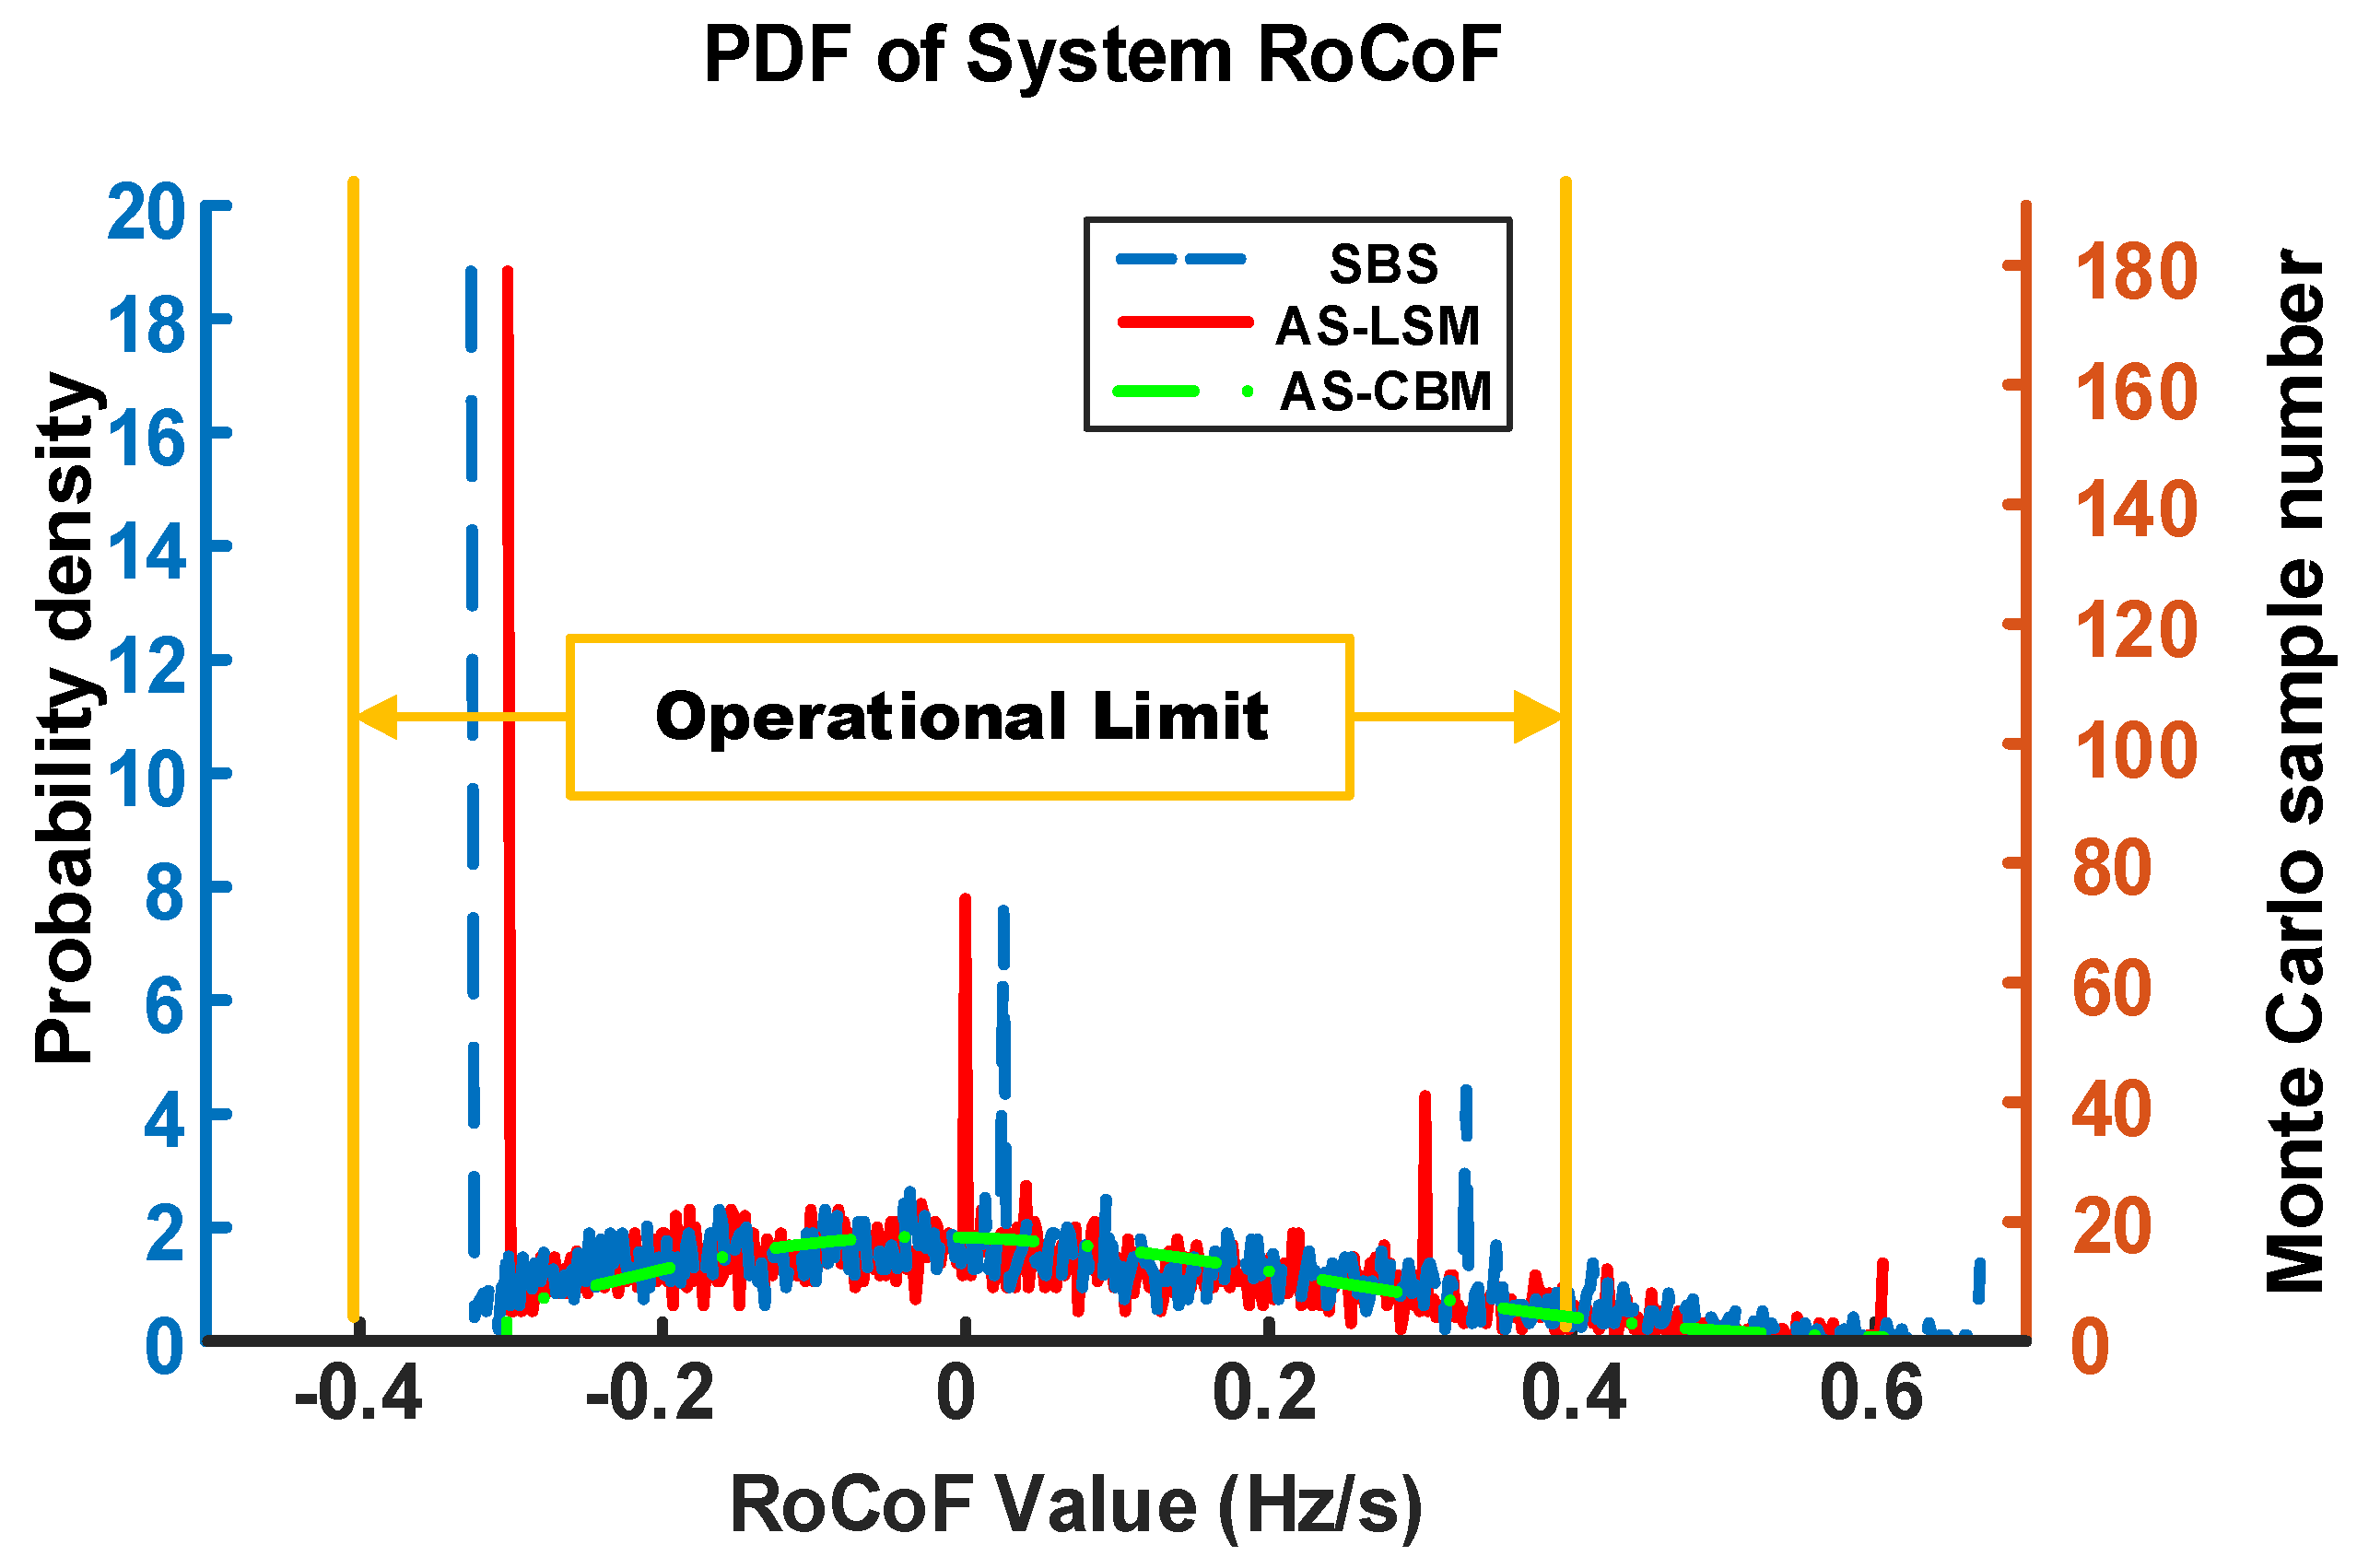
Figure 6 illustrates the probabilistic distribution of system RoCoF carried out by SBS, AS-LSM, and AS-CBM. Compared with the real probabilistic distribution of system RoCoF in Figure 5a, there are a few noticeable “impulses” (i.e., occurrence probability) at a few points on the horizontal ordinate (i.e., RoCoF value, including maximal/minimal system RoCoF), which increases the probability of the “worst-case scenario” and deserves careful consideration in operational planning. The most apparent “impulse” in Figure 6 is the probability at the lowest RoCoF value, which is larger than the probability of the steady state (0 Hz/s). On the other hand, the total probability is 1, and this leads to a few decreases in the probabilities of other RoCoF values, which presents a smooth curve in Figure 6. Both methods evaluate the system RoCoF well according to the detailed probabilistic results in Table 5 and Table 6.
As indicated in Figure 7, the “impulses” still occur in the probabilistic distribution of regional RoCoF, and the curve is much smoother compared with that in uncorrelated wind speed situations. The probabilistic distribution of regional RoCoF obtained by SBS is not bell-shaped, which could be depicted by both methods effectively, while the AS-LSM performs better than AS-CBM owing to less deviation, i.e., 0.9% vs. 1.2902% in Region 4 RoCoF and 0.54% vs. 1.255% in Region 5 RoCoF as given in Table 6.

5. Conclusions

The regional RoCoF is an important indicator for the safe operation of the power system, which needs to be carefully considered in operational planning. This paper proposes a fast-algorithmic assessment for the probabilistic distribution of regional RoCoF, which is more advantageous as it needs less time compared with SBS and provides a more straightforward calculating procedure than CBM. SBS validates the probabilistic results of both AS-LSM and AS-CBM with and without the consideration of wind speed correlation. Some important findings are summarized as follows:
(1) The probabilistic distributions of system RoCoF and regional RoCoF are different, i.e., bell-shaped vs. non-bell-shaped, which should be assessed separately. Both AS-LSM and AS-CBM can achieve the goal while AS-LSM has a better overall performance.
(2) When the wind speed correlation is considered, some evident “impulses” occur for the probabilistic distribution of both system and regional RoCoF as indicated by SBS. This phenomenon could be correctly reflected by both AS-LSM and AS-CBM, while AS-LSM performs better, which also demonstrates the flexibility and robustness of the proposed AS-LSM.
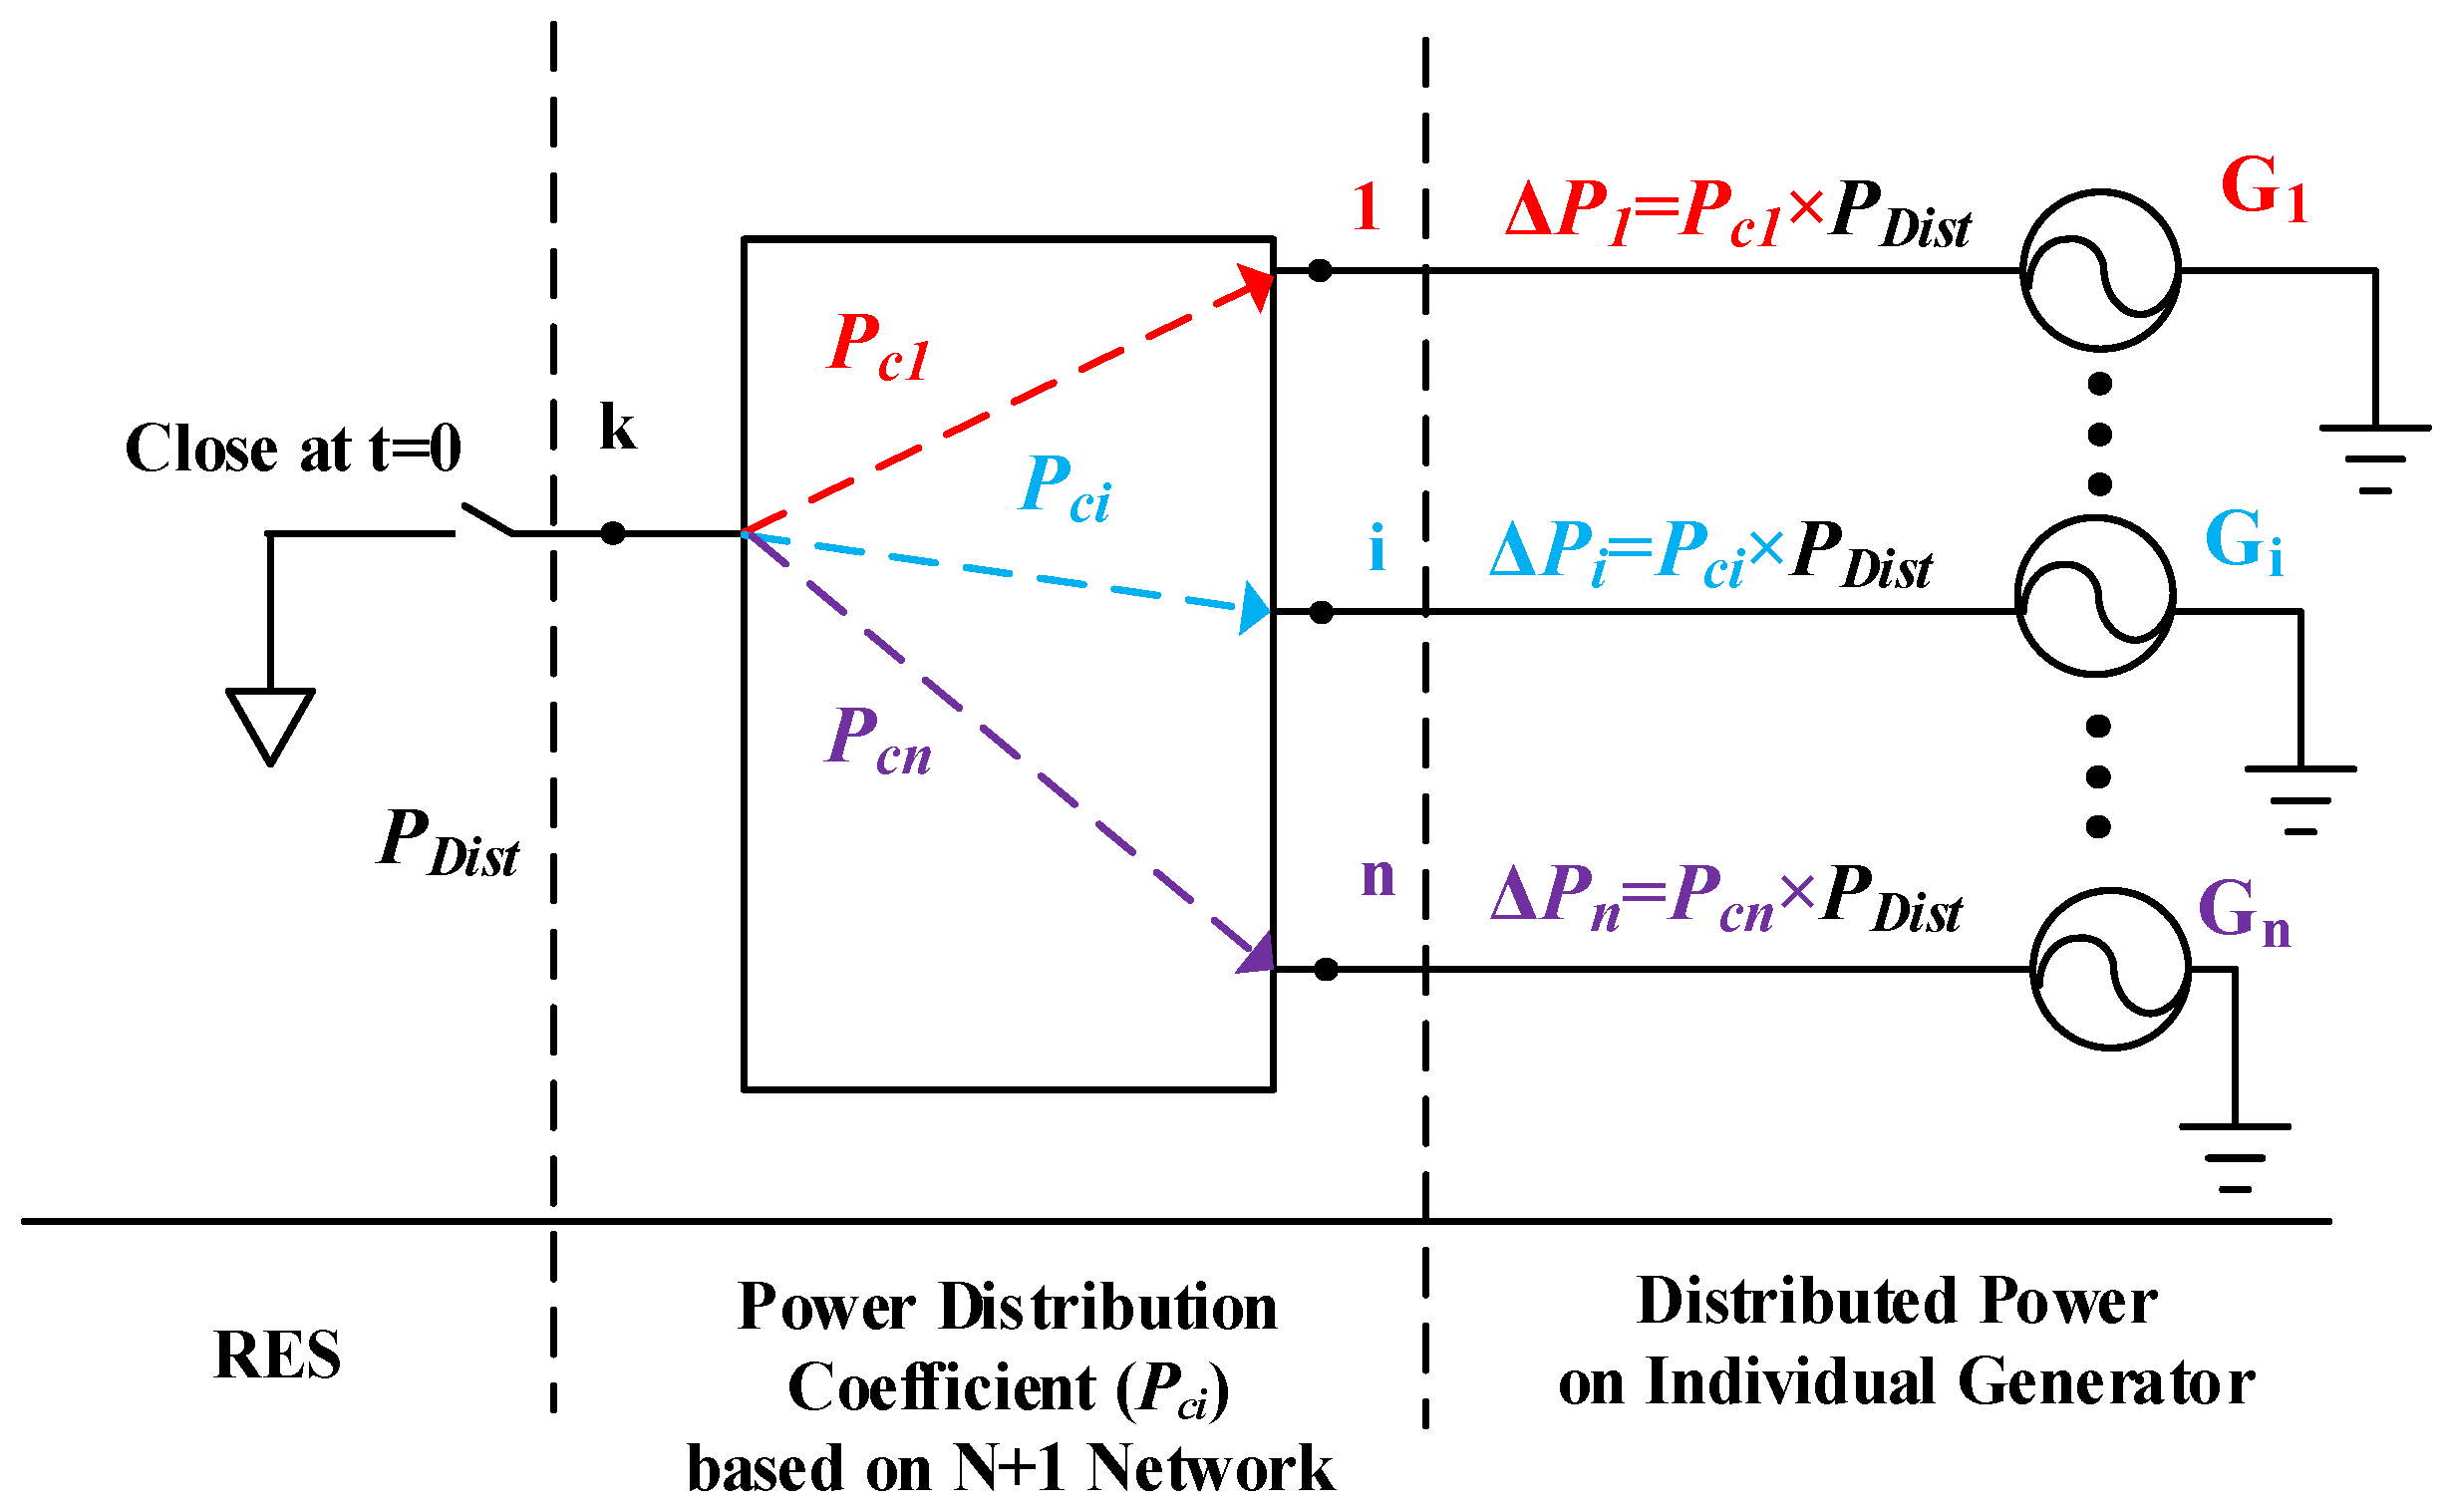
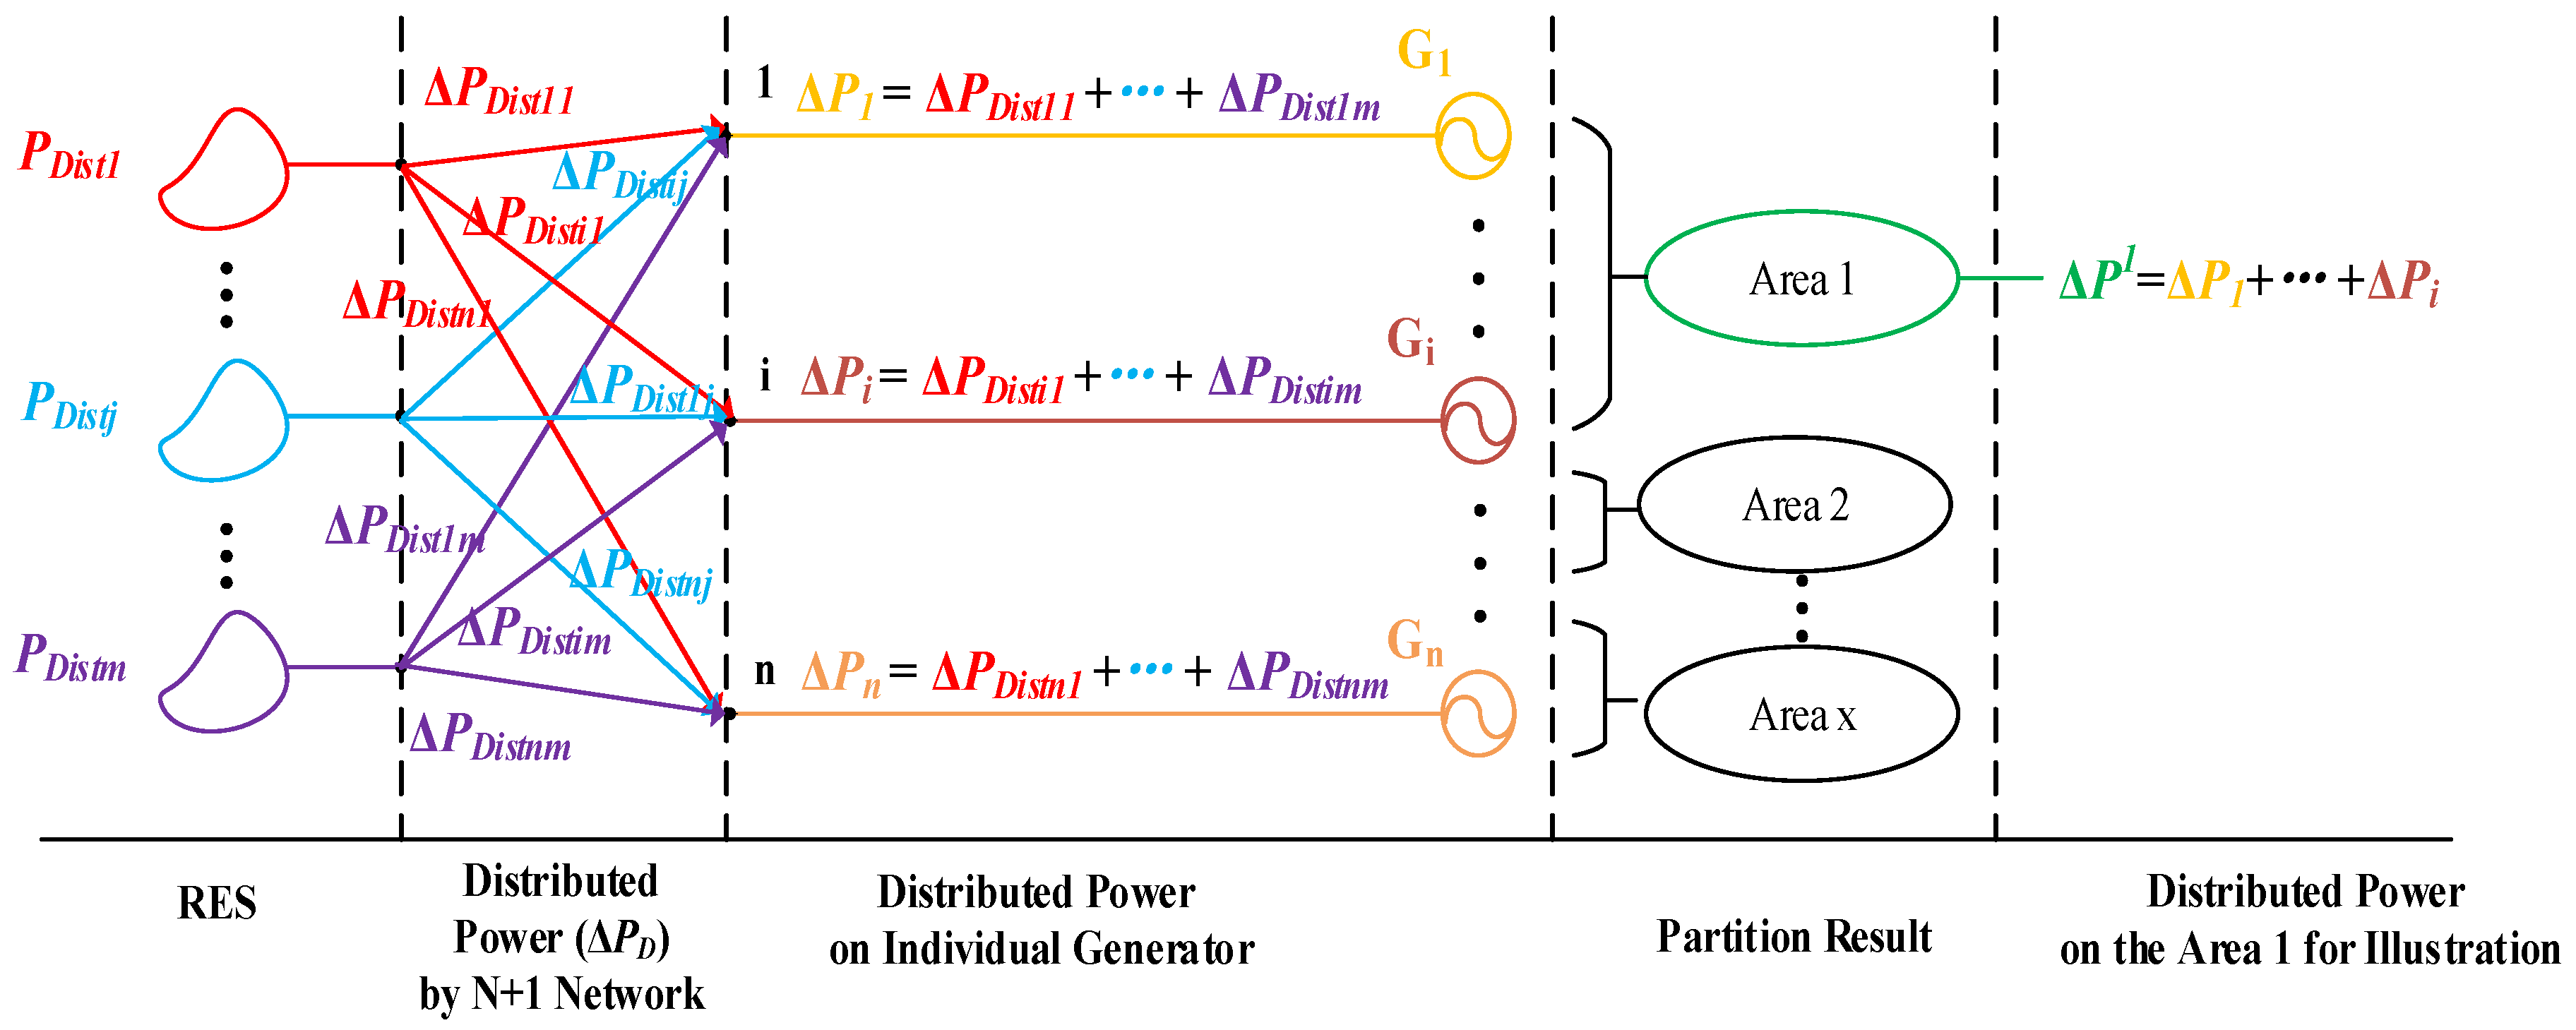
(3) The proposed AS-LSM converts a multi-disturbance problem into the superposition of a single-disturbance problem, which provides a more straightforward and convenient solution for their industrial implementation.

Author Contributions

J.W. completed the theory development and case study and wrote the paper. S.B. supervised the research throughout, coordinated the project, and revised the paper. B.Z., Q.C., and D.Y. provided guidance during the paper revision. All authors have read and agreed to the published version of the manuscript.

Funding

This research was funded by National Natural Science Foundation of China grant number (51807171), Guangdong Science and Technology Department grant number (2019A1515011226), Hong Kong Research Grant Council grant number (25203917), (15200418) and (15219619), and Department of Electrical Engineering, The Hong Kong Polytechnic University grant number (1-ZE68). The APC was funded by TPS Scheme of Hong Kong Polytechnic University.

Acknowledgments

The authors would like to acknowledge the support from National Natural Science Foundation of China for the Research Project (51807171), Guangdong Science and Technology Department for the Research Project (2019A1515011226), Hong Kong Research Grant Council for the Research Projects (25203917), (15200418) and (15219619), and Department of Electrical Engineering, The Hong Kong Polytechnic University for the Start-up Fund Research Project (1-ZE68).

Conflicts of Interest

The authors declare no conflict of interest.

Abbreviations

ASAnalytical sensitivity
CBMCumulant-based method
COICenter of inertia
LSMLinear sensitivity-based analytical method
MCSMonte Carlo Simulation
PDFProbabilistic density function
RCOIRegional center of inertia
RESRenewable energy source
RoCoFRate of change of frequency
SBSScenario-based simulation
SFRSystem frequency response
WFWind farm
AS-CBMCBM based on AS
AS-LSMLSM based on AS

References

  1. Cai, G.; Kong, L. Techno-economic analysis of wind curtailment/hydrogen production/fuel cell vehicle system with high wind penetration in China. CSEE J. Power Energy Syst. 2017, 3, 44–52. [Google Scholar] [CrossRef]
  2. Li, G.; Li, G.; Zhou, M. Model and application of renewable energy accommodation capacity calculation considering utilization level of inter-provincial tie-line. Prot. Control Mod. Power Syst. 2019, 4, 1. [Google Scholar] [CrossRef]
  3. Xu, D.; Wu, Q.; Zhou, B.; Li, C.; Bai, L.; Huang, S. Distributed multi-energy operation of coupled electricity, heating and natural gas networks. IEEE Trans. Sustain. Energy 2019, 1. [Google Scholar] [CrossRef]
  4. Zhou, B.; Xu, D.; Chan, K.W.; Li, C.; Cao, Y.; Bu, S. A two-stage framework for multiobjective energy management in distribution networks with a high penetration of wind energy. Energy 2017, 135, 754–766. [Google Scholar] [CrossRef]
  5. Xu, H.; Su, J.; Liu, N.; Shi, Y. A grid-supporting photovoltaic system implemented by a VSG with energy storage. Energies 2018, 11, 3152. [Google Scholar] [CrossRef] [Green Version]
  6. Mcelroy, M.B.; Chen, X. Wind and solar power in the united states: Status and prospects. CSEE J. Power Energy Syst. 2017, 3, 1–6. [Google Scholar] [CrossRef]
  7. Wu, D.; Javadi, M.; Jiang, J.N. A preliminary study of impact of reduced system inertia in a low-carbon power system. J. Mod. Power Syst. Clean Energy 2015, 3, 82–92. [Google Scholar] [CrossRef] [Green Version]
  8. Tielens, P.; Van Hertem, D. The relevance of inertia in power systems. Renew. Sustain. Energy Rev. 2016, 55, 999–1009. [Google Scholar] [CrossRef]
  9. Arkhangelski, J.; Roncero-Sánchez, P.; Abdou-Tankari, M.; Vázquez, J.; Lefebvre, G. Control and restrictions of a hybrid renewable energy system connected to the grid: A battery and supercapacitor storage case. Energies 2019, 12, 2776. [Google Scholar] [CrossRef] [Green Version]
  10. Ofgem. Technical Report on the Event of 9 August 2019; Ofgem: London, UK, 2019. [Google Scholar]
  11. Silva, A.M.L.D.; Castro, A.M.D. Risk assessment in probabilistic load flow via monte carlo simulation and cross-entropy method. IEEE Trans. Power Syst. 2019, 34, 1193–1202. [Google Scholar] [CrossRef]
  12. Berizzi, A.; Bovo, C.; Delfanti, M.; Merlo, M.; Pasquadibisceglie, M.S. A monte carlo approach for TTC evaluation. IEEE Trans. Power Syst. 2007, 22, 735–743. [Google Scholar] [CrossRef]
  13. Ahmadyar, A.S.; Riaz, S.; Verbic, G.; Chapman, A.; Hill, D.J. A framework for assessing renewable integration limits with respect to frequency performance. IEEE Trans. Power Syst. 2018, 33, 4444–4453. [Google Scholar] [CrossRef]
  14. Bu, S.Q.; Du, W.; Wang, H.F.; Chen, Z.; Xiao, L.Y.; Li, H.F. Probabilistic analysis of small-signal stability of large-scale power systems as affected by penetration of wind generation. IEEE Trans. Power Syst. 2012, 27, 762–770. [Google Scholar] [CrossRef]
  15. Preece, R.; Huang, K.; Milanović, J.V. Probabilistic small-disturbance stability assessment of uncertain power systems using efficient estimation methods. IEEE Trans. Power Syst. 2014, 29, 2509–2517. [Google Scholar] [CrossRef]
  16. Bu, S.; Wen, J.; Li, F. A generic framework for analytical probabilistic assessment of frequency stability in modern power system operational planning. IEEE Trans. Power Syst. 2019, 34, 3973–3976. [Google Scholar] [CrossRef]
  17. Anderson, P.M.; Fouad, A.A. Power System Control and Stability; Iowa State University Press: Ames, IA, USA, 1977. [Google Scholar]
  18. Operator, A.E.M. Integrating Renewable Energy-Wind Integration Studies Report; AEMO: Melbourne, Australia, 2013. [Google Scholar]
  19. Hong, Q.; Nedd, M.; Norris, S.; Abdulhadi, I.; Karimi, M.; Terzija, V.; Marshall, B.; Bell, K.; Booth, C. Fast frequency response for effective frequency control in power systems with low inertia. J. Eng. 2019, 2019, 1696–1702. [Google Scholar] [CrossRef]
  20. NationalgridESO. The Day in the Life of SOGL Series-Operational Planning Part 2; NationalgridESO: Warwickshire, UK, 2018. [Google Scholar]
  21. Huang, S.; Zhou, B.; Bu, S.; Li, C.; Zhang, C.; Wang, H.; Wang, T. Robust fixed-time sliding mode control for fractional-order nonlinear hydro-turbine governing system. Renew. Energy 2019, 139, 447–458. [Google Scholar] [CrossRef]
  22. Markovic, U.; Chu, Z.; Aristidou, P.; Hug, G. Fast frequency control scheme through adaptive virtual inertia emulation. In Proceedings of the 2018 IEEE Innovative Smart Grid Technologies-Asia (ISGT Asia), Singapore, 22–25 May 2018; pp. 787–792. [Google Scholar]
  23. Rubio, A.; Behrends, H.; Geißendörfer, S.; Maydell, V.K.; Agert, C. Determination of the required power response of inverters to provide fast frequency support in power systems with low synchronous inertia. Energies 2020, 13, 816. [Google Scholar] [CrossRef] [Green Version]
  24. Choi, Y.W.; Kook, S.K.; Yu, R.G. Control strategy of BESS for providing both virtual inertia and primary frequency response in the Korean Power System. Energies 2019, 12, 4060. [Google Scholar] [CrossRef] [Green Version]
  25. Gu, H.; Yan, R.; Saha, T.K. Minimum synchronous inertia requirement of renewable power systems. IEEE Trans. Power Syst. 2018, 33, 1533–1543. [Google Scholar] [CrossRef] [Green Version]
  26. Chow, J.H. Power Syetem Coherency and Model Reduction; Spring: New York, NY, USA, 2013. [Google Scholar]
  27. Ackermann, T. Wind Power in Power Systems, 2nd ed.; Hon Wiley & Sons: Chichester, UK, 2012. [Google Scholar]
  28. Freris, L.; Infield, D. Renewable Energy in Power Systems; Wiley: New York, NY, USA, 2008. [Google Scholar]
  29. Abouzahr, I.; Ramakumar, R. An approach to assess the performance of utility-interactive wind electric conversion systems. IEEE Trans. Energy Convers. 1991, 6, 627–638. [Google Scholar] [CrossRef]
Figure 1. Active power disturbance propagation from renewable energy sources (RES) (i.e., bus k) to each generator bus.
Energies 13 02780 g001
Figure 2. The propagating procedure of the active power disturbances in the multi-RES penetrated power system and the derivation of the regional active power disturbance.
Energies 13 02780 g002
Figure 3. Flowchart of the calculation procedure for probabilistic distribution of regional rate of change of frequency (RoCoF) by analytical sensitivity-linear sensitivity-based method (AS-LSM).
Energies 13 02780 g003
Figure 4. Line diagram of a modified IEEE 16-machine 5-area benchmark system with three wind farms.
Energies 13 02780 g004
Figure 5. Probabilistic density functions (PDFs) of system/regional RoCoF by scenario-based simulation (SBS), AS-LSM, and analytical sensitivity-cumulant-based method (AS-CBM); (a) system, (b) Region 4, and (c) Region 5.
Energies 13 02780 g005
Figure 6. PDF of system RoCoF by SBS, AS-LSM, and AS-CBM.
Energies 13 02780 g006
Figure 7. PDF of Region 4 RoCoF by SBS, AS-LSM, and AS-CBM.
Energies 13 02780 g007
Table 1. The AS of system/regional RoCoF w.r.t the output of individual wind farms (WFs).
WF1WF2WF3
System0.0505020.0505020.050502
Region 10.0009830.0035970.019503
Region 20.0036800.0177770.001502
Region 30.0066930.0134780.299779
Region 40.2940510.0492670.004431
Region 50.0199880.1126720.003533
Table 2. Probabilistic distribution of the system, region 4, and region 5 RoCoF using SBS, AS-LSM, and AS-CBM within operational limits (uncorrelated wind speed).
NoSBSAS-LSMAS-CBM
System96.9200%98.0800%98.0307%
Region 441.3200%40.8400%43.5933%
Region 592.8400%90.7000%92.9851%
Table 3. The absolute error of probabilities for the system, region 4, and region 5 RoCoF by AS-LSM and AS-CBM within operational limits (uncorrelated wind speed).
NoAS-LSMAS-CBM
System1.1600%1.1107%
Region 40.4800%2.2733%
Region 52.1400%0.1451%
Table 4. The computational time of SBS, AS-LSM, and AS-CBM.
SBSAS-LSMAS-CBM
Computational Time2691.72s1.95s2.57s
Table 5. Probabilistic distribution of the system, region 4, and region 5 RoCoF using SBS, AS-LSM, and AS-CBM within operational limits (correlated wind speed).
NoSBSAS-LSMAS-CBM
System93.6600%94.9800%95.2664%
Region 442.7000%41.8000%43.9902%
Region 591.4600%90.9200%92.7150%
Table 6. The absolute error of probabilities for the system, region 4, and region 5 RoCoF by AS-LSM and AS-CBM within operational limits (correlated wind speed).
NoAS-LSMAS-CBM
System1.3200%1.6064%
Region 40.9000%1.2902%
Region 50.5400%1.2550%

