Technique for Concurrent Internal Calibration during Data Acquisition for SAR Systems


Deutsches Zentrum für Luft- und Raumfahrt e.V., Institut für Hochfrequenztechnik und Radarsysteme, 82234 Weßling, Germany
*
Author to whom correspondence should be addressed.
Remote Sens. 2020, 12(11), 1773; https://doi.org/10.3390/rs12111773
Submission received: 30 April 2020
/
Revised: 20 May 2020
/
Accepted: 27 May 2020
/
Published: 1 June 2020
Abstract
:Nowadays, stringent requirements for the quality of SAR data products exist. The radiometric and image quality requirements can only be fulfilled by knowing the disturbances caused by the radar hardware itself. The internal calibration is a mechanism to estimate these disturbances from the real hardware. Unfortunately, most of the current internal calibration schemes interrupt the SAR data acquisition during internal calibration and hence cause a loss of azimuth samples and a degradation of the image quality. The calibration is thus often performed only before and after a data take. However, these two calibration events are hardly sufficient to estimate the instrument parameters during the whole acquisition especially for long data takes, which will become more common in future SAR system. In this paper, an internal calibration scheme is introduced which allows performing the internal calibration during nominal data acquisition by injecting a coded calibration signal into the receiver with very low power. This signal causes only minor degradation of the SAR image but can be retrieved from the data using adequate signal processing. This technique is described, the theoretical performance estimated, and finally demonstrated on real data from the TerraSAR-X mission. A selection of possible coding scheme is also analyzed with respect to their suitability for the proposed internal calibration scheme.
1. Introduction
The internal calibration facility of SAR systems ensures the stability of the SAR instrument over time and can be used to retrieve the transfer function of the instrument needed for full performance pulse compression. Already in the late 1980s a digital concept for monitoring the receiver chain and to derive the transfer function was introduced [1]. In the early 1990s, a complete internal calibration facility for an airborne SAR system was described [2], which also includes the generation of the complete transfer function covering both the transmit and the receive path. This enables using the measured transfer function to generate the replica for pulse compression in range direction and hence the compensation of drifts in the hardware, such as aging and thermal variations as well as frequency dependencies. For spaceborne SAR systems, the TerraSAR-X mission introduced an efficient technique to characterize a large number of individual receive and transmit modules (TRMs) [3,4] using an advanced internal calibration facility. This measured transfer function is also operationally used to focus the SAR image [5].
2. Classical Three Paths Internal Calibration
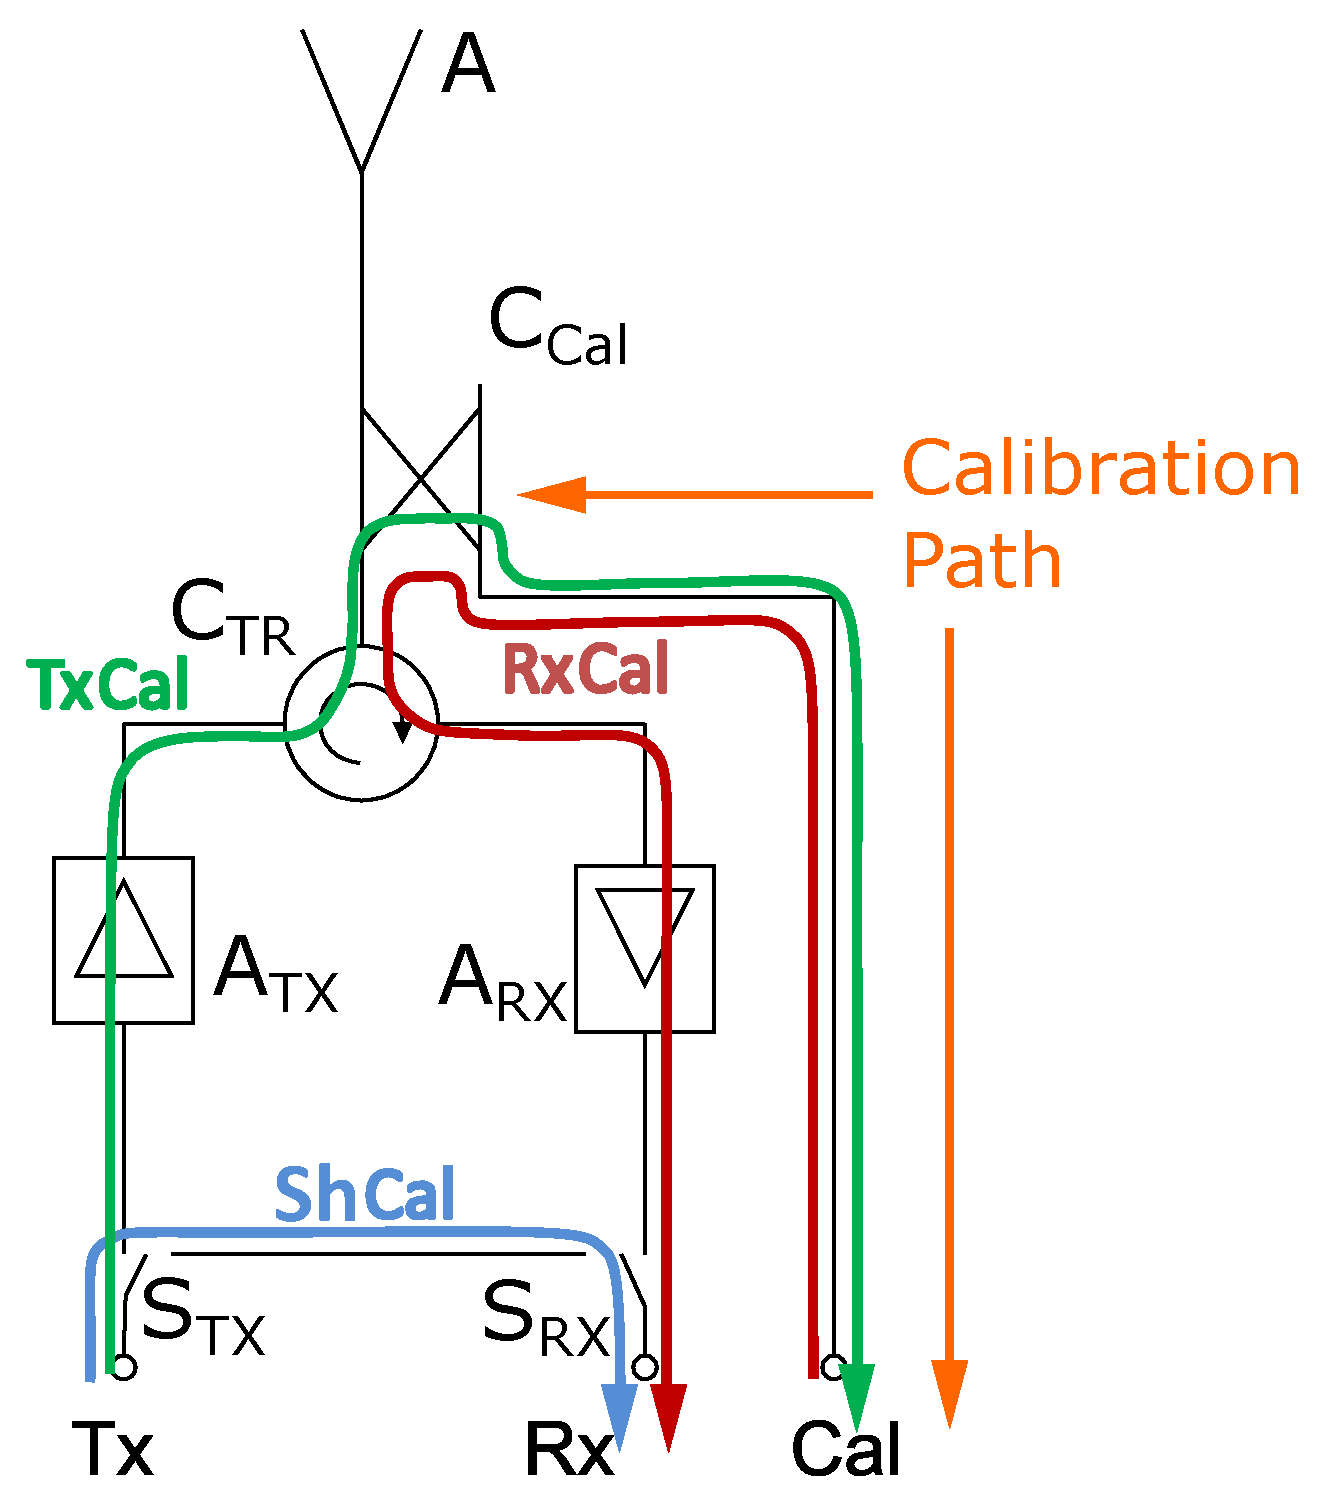
Transmit/receive modules are often used in active phased array antennas to feed the individual radiating elements, which allows for an electronic steering of the antenna beam towards different directions. Such a TRM (see Figure 1) is commonly comprised of a transmit section, often with a high-power amplifier (HPA) , a receive section, and a transmit/receive switch (e.g., a circulator) . The receive section is composed of a low-noise amplifier (LNA) and optionally a limiter, phase shifter, and variable attenuator (not shown in Figure 1). For internal calibration (Although often called internal calibration, the process of retrieving information about the transmit and receive hardware is not a calibration in the sense used in metrology but rather a monitoring of relative derivations. Calibration would require a known reference called standard which is preferable traceable to SI units. Nevertheless, the common term internal calibration is used here.), a coupler (often called calibration coupler) is placed close to the radiating element to cover most of the radar electronics within the calibration facility. All elements outside this calibration loop are not covered and cannot be monitored, and hence need to be characterized (Characterization is understood as a process of retrieving parameters of hardware representative for its operation.) on ground.
The calibration coupler near the antenna port allows injecting a known signal into the receive chain and monitoring the signal transmitted by the hardware. A dedicated calibration path () is used to connect the calibration coupler to the signal source or receiver, respectively.
The commonly used calibration scheme consists of three paths, which have to be measured by suitable signals to derive the transfer function of the hardware:
- transmit path ();
- receive path (); and
- short path ().
From these data, the transfer function in frequency-domain, from which the replica used to focus the SAR data can be derived, is calculated by:
where f is the frequency and is the transfer function of the calibration path which cannot be retrieved by the internal calibration itself. This path is normally characterized in laboratory instead.
To perform internal calibration, signals have to be routed through all three paths. Traditionally, the SAR imaging is interrupted during internal calibration to prevent interference between internal calibration signals and the SAR data acquisition. For the path, the calibration signal is injected into the nominal transmit path of the hardware. The signal to be radiated is monitored using the calibration coupler, which routes back a part of the transmitted energy to the receiver. The signal used for short path calibration () is directly routed back to the receiver without any amplification and acts as reference.
The path is especially critical as the signal drive level has to be low, ideally at the same power level as nominal radar echoes, to ensure realistic operational conditions for the hardware. As most systems do not allow the disconnection of the radar antenna from the receiver, no returns from the SAR scene, including any echoes from transmit pulses still traveling towards the scene or back, are allowed during the path evaluation. To prevent these undesired interferences, the internal calibration either has to be performed before and after a data take (which might not be sufficient for long data takes demanded by upcoming SAR missions) or additional guard times have to be added to the SAR data acquisition timeline. This ensures that no disturbing signal is received by the antenna while the calibration signal is routed through the path.
The guard times, inserted into the SAR acquisition timeline for internal calibration, cause missing samples in azimuth direction and hence degrade the SAR performance. Therefore, the time for internal calibration must be kept as short as possible. This again limits the measurement time for internal calibration (e.g., noise reduction by averaging) and consequently the achievable calibration accuracy.
Generally speaking, there is a fundamental conflict between time for SAR image acquisition and time for internal calibration in the current internal calibration approach, which can be translated into a trade-off between SAR imaging performance and internal calibration accuracy.
3. Internal Receive Path Calibration Using Coded Signals
While not yet implemented in most current SAR instruments, the signal can be routed through the hardware during nominal SAR imaging if the hardware is carefully designed and signal leakage is properly controlled. The transmitted signal is routed through the hardware using the nominal transmit path and radiated by the antenna while a small portion of the signal is coupled to the calibration path and recorded by the receiver. Conventionally, the radar receiver would be idle during radar transmission as most monostatic pulse radar instruments are not designed to receive and transmit electromagnetic waves simultaneously. In the hereby described case, the receiver is used to record a representation of the transmit pulse, which measures the path.
Similar to the signal, the signal can also be routed through the hardware during the transmit event if the switch in the transmit path (see Figure 1) is replaced by a coupler. This allows routing a part of the transmit signal through the path. With this modification, only for routing the signal a dedicated time slot is needed to perform the whole internal calibration (and the retrieval of the transfer function of the radar hardware).
To finally send the signal without interrupting the SAR acquisition, it is proposed to inject a low-power calibration signal during the nominal receive window simultaneously with the received echo from the ground. For this purpose, we propose to code the signal:
- to enable the retrieval of the calibration signal from the recorded signal mix; and
- to minimize the cross-talk to the received (unfocused) SAR echo and consequently the disturbances in the focused SAR image.
The calibration signal is retrieved from the mixed signal by means of correlation processing:
where is the correlation function between f and g with the independent variable n, * is the correlation operator, and is the conjugate complex of x.
4. Theoretical Performance Estimation for Receive Path Calibration Using Coded Signals
As shown above, the power level of the calibration signal is essential for the dimensioning of the calibration system. Let us consider a TerraSAR-X-like SAR system with a bandwidth of 150 MHz and 4 kHz pulse repetition frequency (PRF ). In fast time, a correlation gain of
can be achieved. If one additionally assumes a 10 s integration interval to retrieve a single estimate for the calibration (which assumes the SAR instrument to be stable within these 10 s), an additional slow time gain of
can be achieved (where N is the number of samples). This shows, with reasonable parameters, the calibration signal can be amplified by nearly 70 dB if properly coded.
Furthermore, the cross-talk between the calibration signal and the SAR signal has to be assessed. The cross-talk would vanish if orthogonal codes are used for the calibration signal and the SAR signal. The orthogonality of two signals ( and ) is hereby defined as:
It can be shown that, for a chirp , as often used for SAR instruments, and for the radar echo, which is a time and frequency shifted version of the transmitted chirp, no orthogonal signal exists if both signals ( and ) have to cover the same time–frequency space. However, codes can be found, where to minimize the interference between SAR and calibration signals.
The outcomes of this theoretical treatment can be used to design and optimize the internal calibration scheme to be applicable to SAR instruments as deployed today or being developed in the near future.
5. Performance Estimation Using Real TerraSAR-X Data
There are hardware implementations which allow routing the and signal though the hardware without interrupting the SAR acquisition. In addition, a first assessment was given that it is possible to retrieve a low power calibration signal injected during SAR receptions while minimal disturbances on the SAR signal is expected. Now, a quantitative analysis should be performed using the DLR experimental SAR processor TAXI [6] and a data take from the TerraSAR-X mission.
No extensive treatment of all potential coding schemes for the calibration signal is possible here, but some exemplary code sequence are further investigated:
- inverse chirp;
- binary phase shift keying; and
- phase coding using a pseudo noise code.
The effect of different coding schemes is evaluated in azimuth direction as the frequency modulation in this direction is fundamental (due to the SAR acquisition geometry) and cannot be changed. In range direction, an inverse chirp covering the whole receive window time and the whole bandwidth is used in all cases (calibration signal length N = 21,120 samples). Although the coding scheme in range direction can be changed as well, it is left constant here for simplicity.
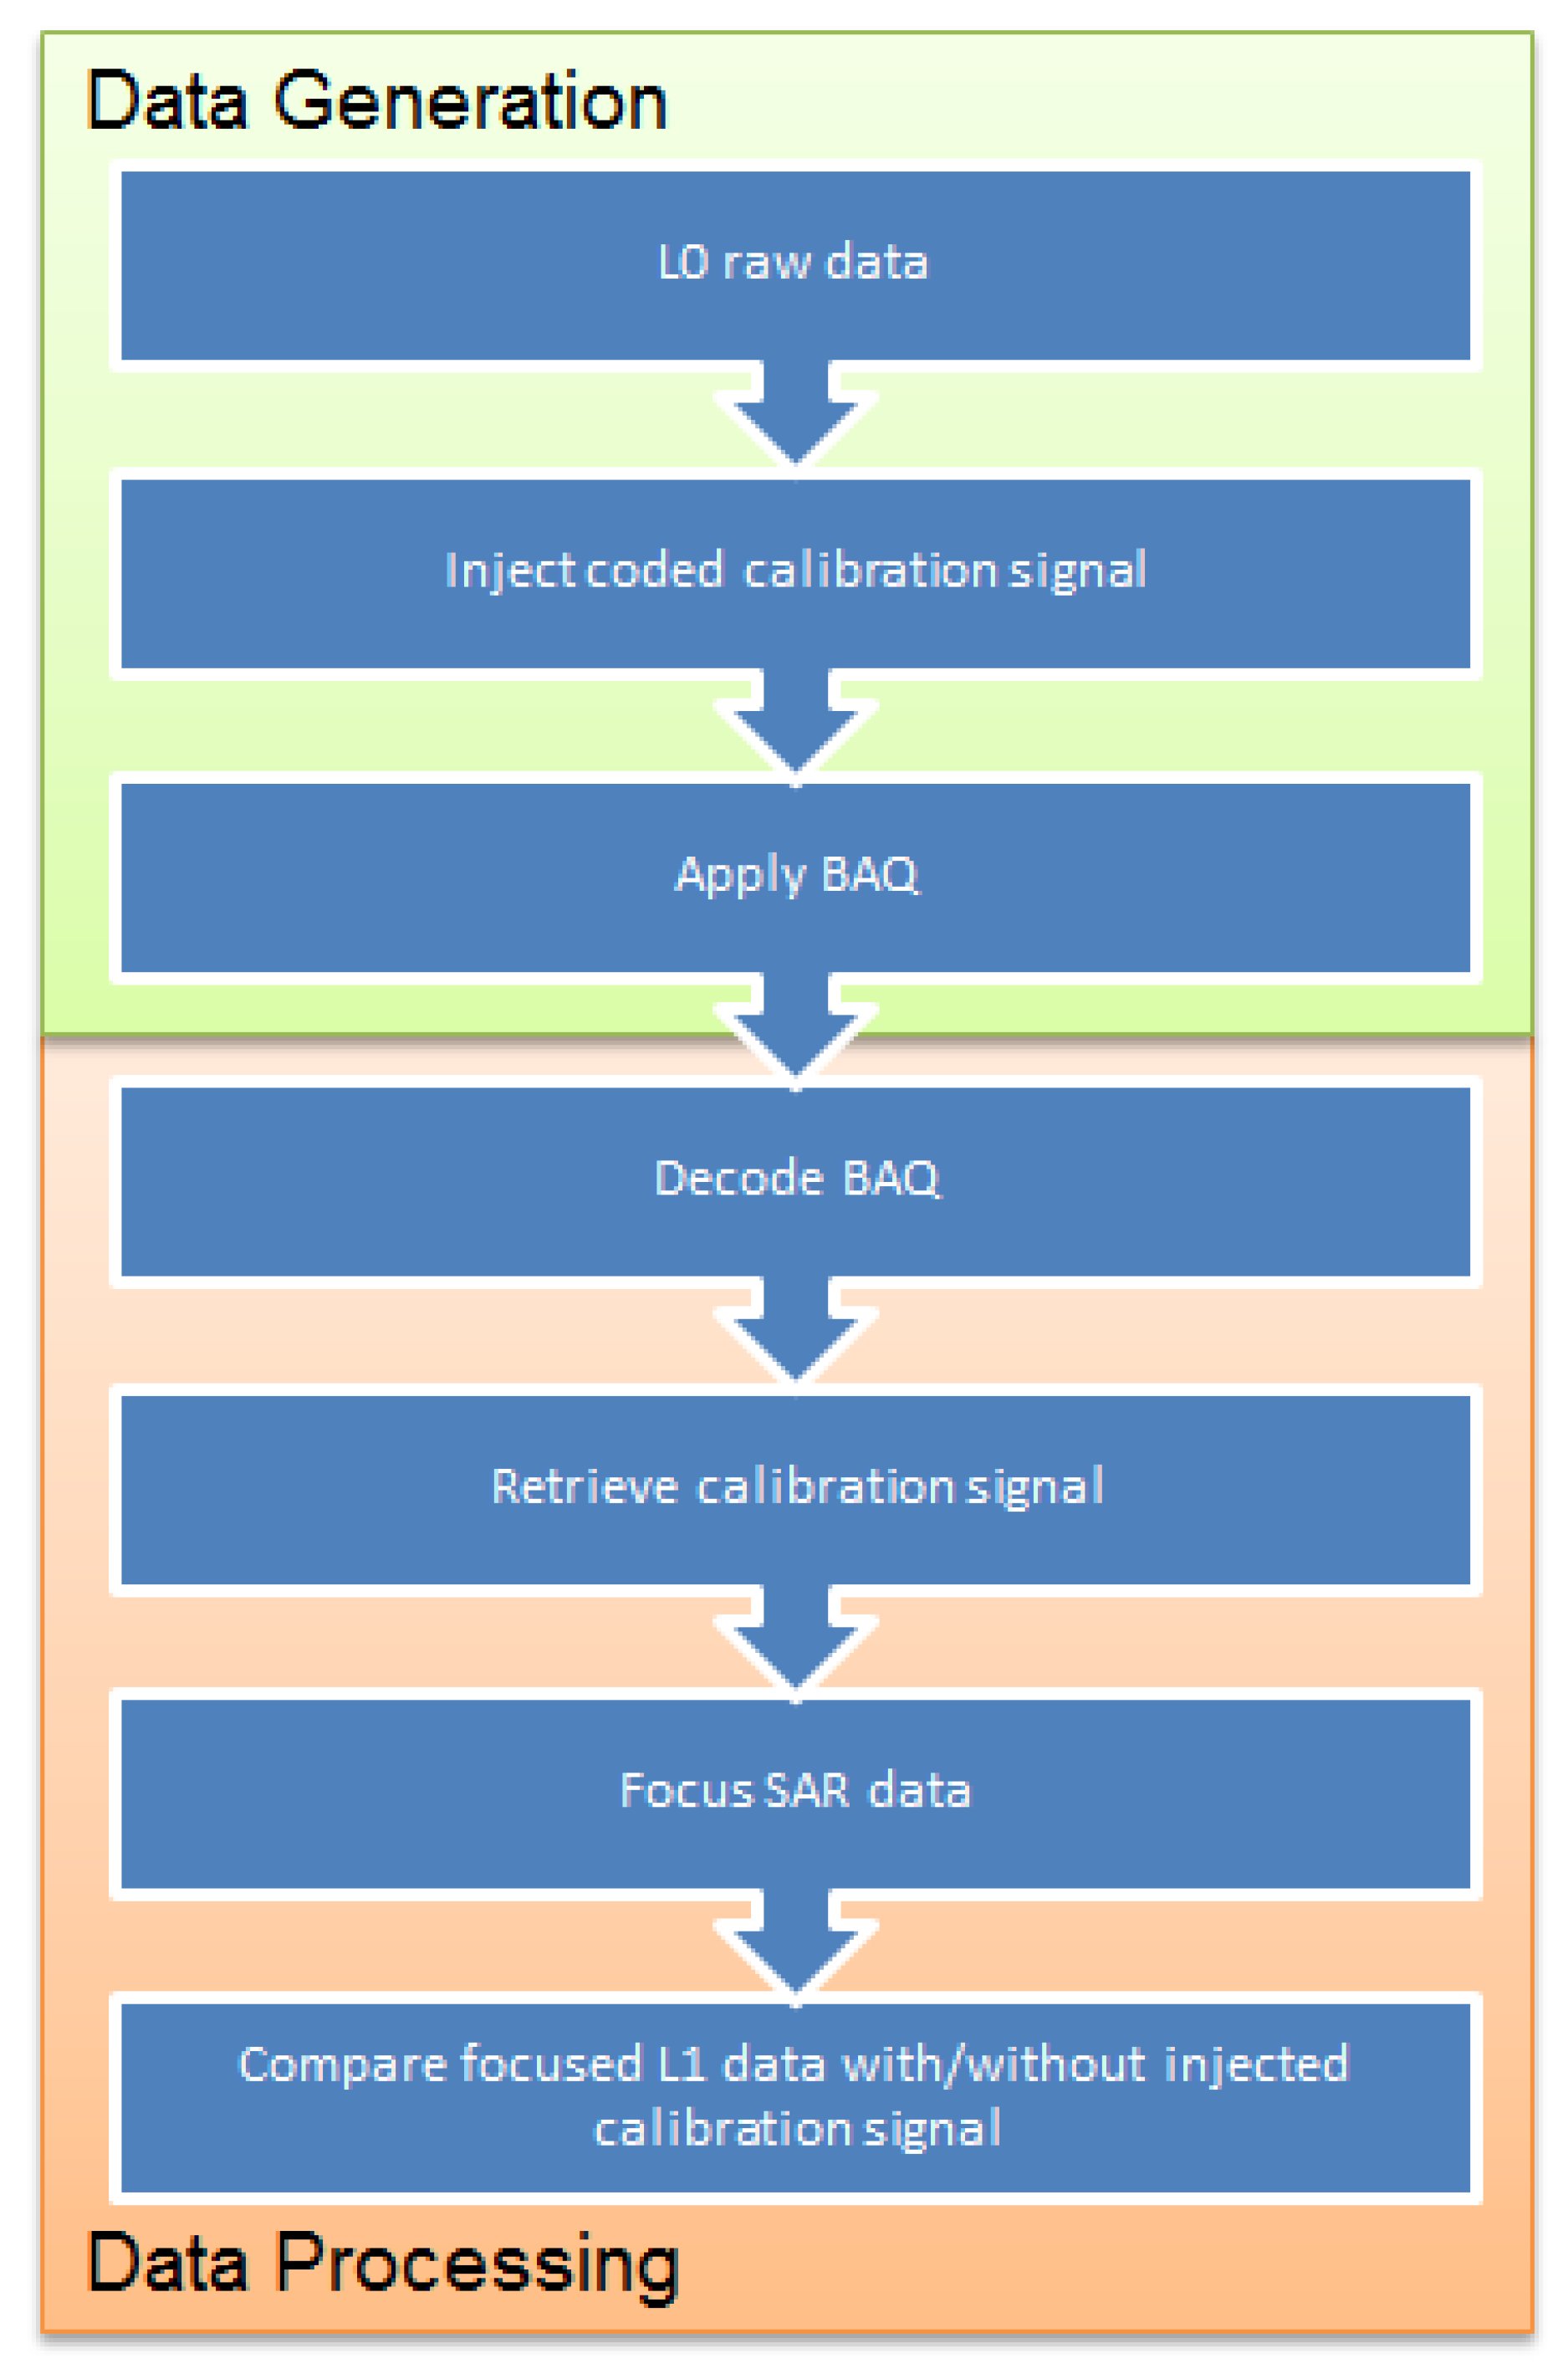
The calibration schemes mentioned above were simulated using real L0 SAR data from the TerraSAR-X mission. As the satellite does not support an injection of an analog calibration signal in its hardware, the calibration signal was synthetically injected into digitized L0 data on ground (see Figure 2). To assess the effect of the lossy BAQ compression, BAQ encoding and decoding were re-performed on the data. This simulation setup ensures SAR data which are most similar to data where the calibration signal would be injected into analog hardware during SAR reception (albeit the calibration signal does not carry any information about hardware disturbances).
The calibration signal injection in digital domain requires additional care. Due to the digital quantization, values smaller than 1 digit cannot be represented (integer values). To allow an injection of a calibration signal with very low power (and hence an amplitude > 1), an additional dithering has to be applied. Hence, white noise with 0.5 digit amplitude was added to the digital signal ([7]) in addition to the calibration signal to allow its representation in the data even in the quantized integer domain.
On these simulated SAR data, the nominal SAR focusing as well as the retrieval of the calibration signal can be performed. A quality ratio for the retrieved calibration signal can be defined which is estimated from the amplitude of the correlation peak to the total signal energy (relative correlation peak):
where is the index of correlation peak () and N is the length of the correlation function between the calibration signal and the SAR raw data.
The corruption caused in the focused SAR complex image can be estimated by pixel-wise comparison of the data with () and without () the injected calibration signal in amplitude and phase.
The mean power disturbance can then be calculated by
where and are the dimensions of the SAR image. Likewise, the phase error can be calculated, i.e., arithmetic mean and the unbiased estimation of a standard deviation.
6. Results of the Performance Estimation
The performance of the introduced calibration scheme was estimated for some exemplary coding schemes. The selection of coding schemes analyzed here is neither comprehensive nor complete. However, it gives some insight into possible coding schemes applicable to the proposed internal calibration technique. As the selection of the coding scheme should be widely independent of the SAR scene (or better the L0 data of the scene), an inhomogeneous scene was considered sufficient to estimate the performance of the technique. The different coding schemes were applied in azimuth direction, while similar results are expected if applied in range direction, too.
The selected scene is from a dataset acquired by the TerraSAR-X mission on 7 September 2010 using a 4/8 Block Adaptive Quantizer(BAQ). The scene covers the area from the city of Augsburg to the south of lake Starnberg in the southern part of Germany.
6.1. Inverse Chirp
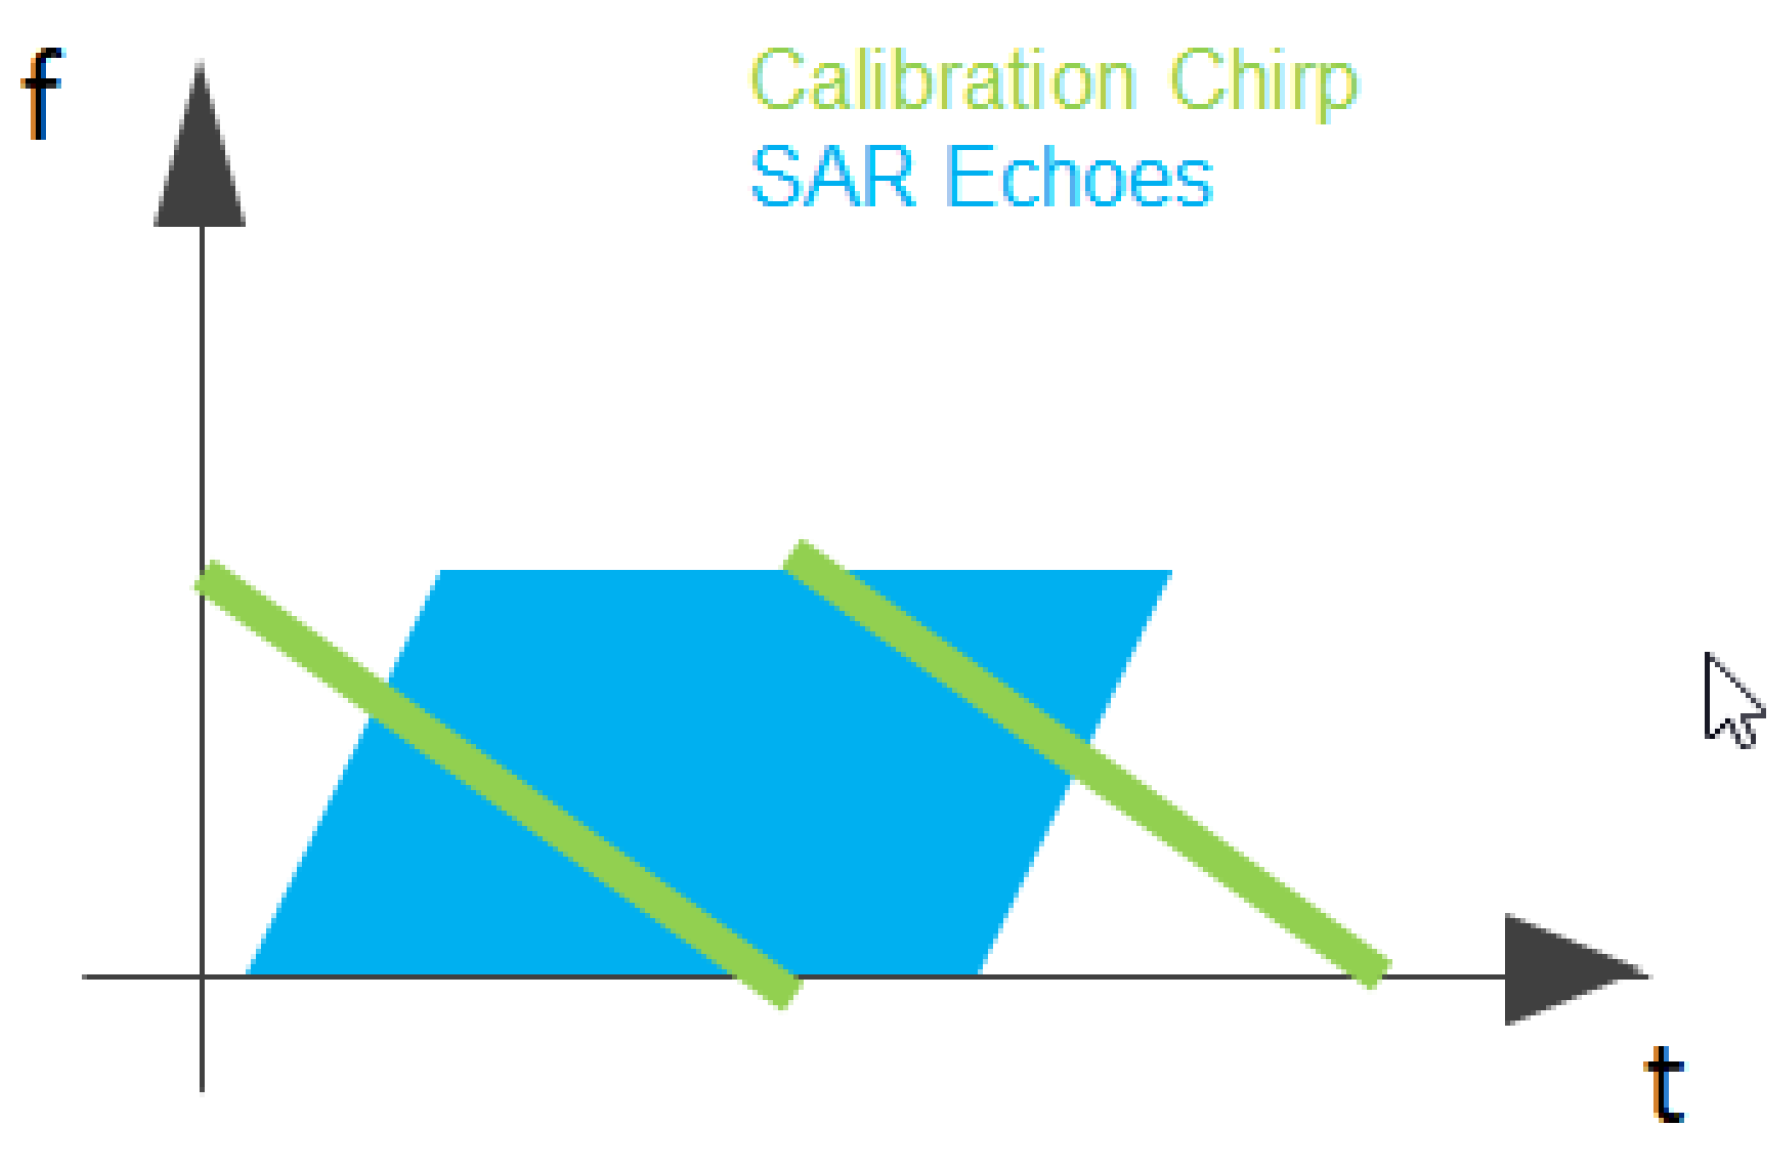
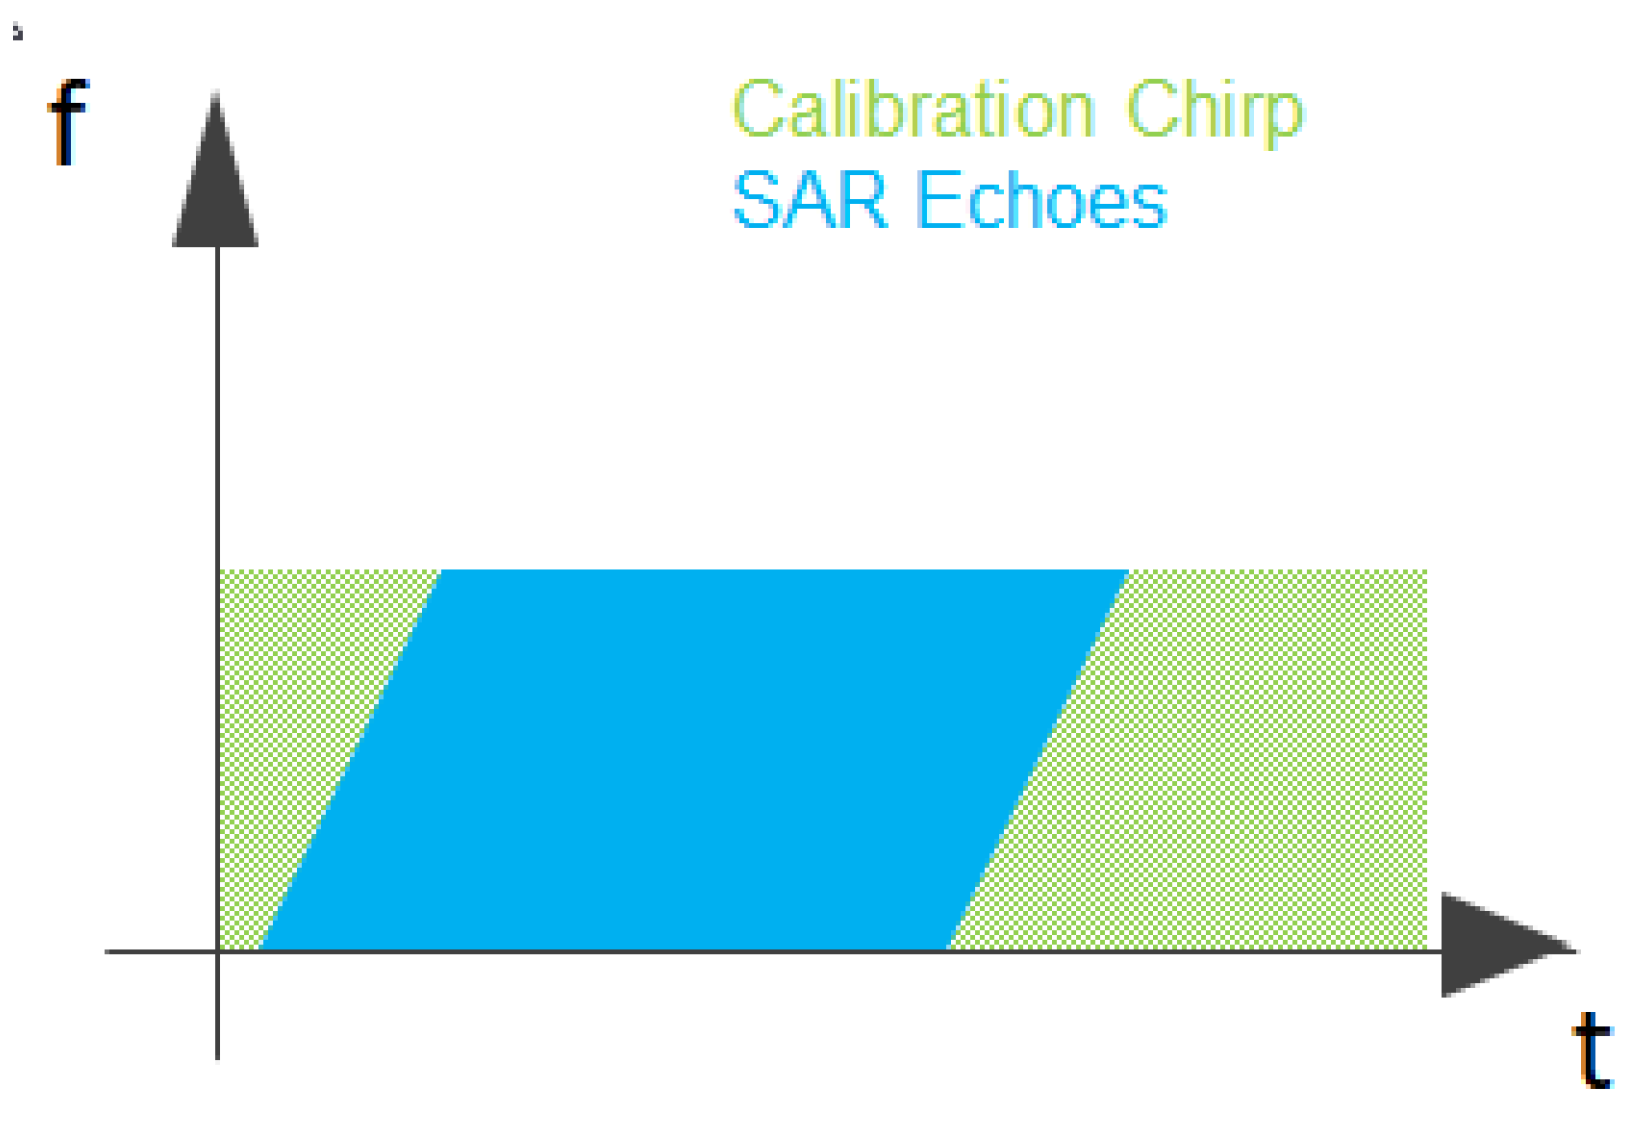
Due to the relative movement between the SAR satellite and the target, a Doppler shift is applied to the target echo in slow time. This Doppler shift is similar to the chirp transmitted in fast time forming the range direction. Hence, slow and fast time have similar signal characteristics. A chirp and its inverse (or down chirp) have little spectral overlap in the time frequency domain (Figure 3) which makes the down chirp well suitable as a simple coding scheme for the calibration signal. While, due to the large number of scatterers in the scene, virtually all Doppler shifts are present in the received echo, the injected calibration signal is coherent to the transmitted waveform and can easily be detected and retrieved from the compound signal. On the other hand, the energy of the calibration signal is spread over many targets in azimuth direction and hence causing only little disturbances on each target in the scene. By varying the chirp rate (or slope) of the inverse azimuth chirp used for the calibration signal (the bandwidth is limited by the PRF), the integration time can be adapted.
For an integration length of 32,767 pulses which equals about 8 s, the calibration signal can be retrieved with a quality ration of dB from the data while the mean image disturbance is as low as dB and deg in phase. The maximum image disturbance on a pixel-by-pixel basis is dB and a 180 deg phase shift. The large error in phase can easily be attributed to areas of low backscatter where even a small variation in the real or imaginary part of the signal causes large jumps in the phase.
6.2. 180 Binary Phase Shift Keying
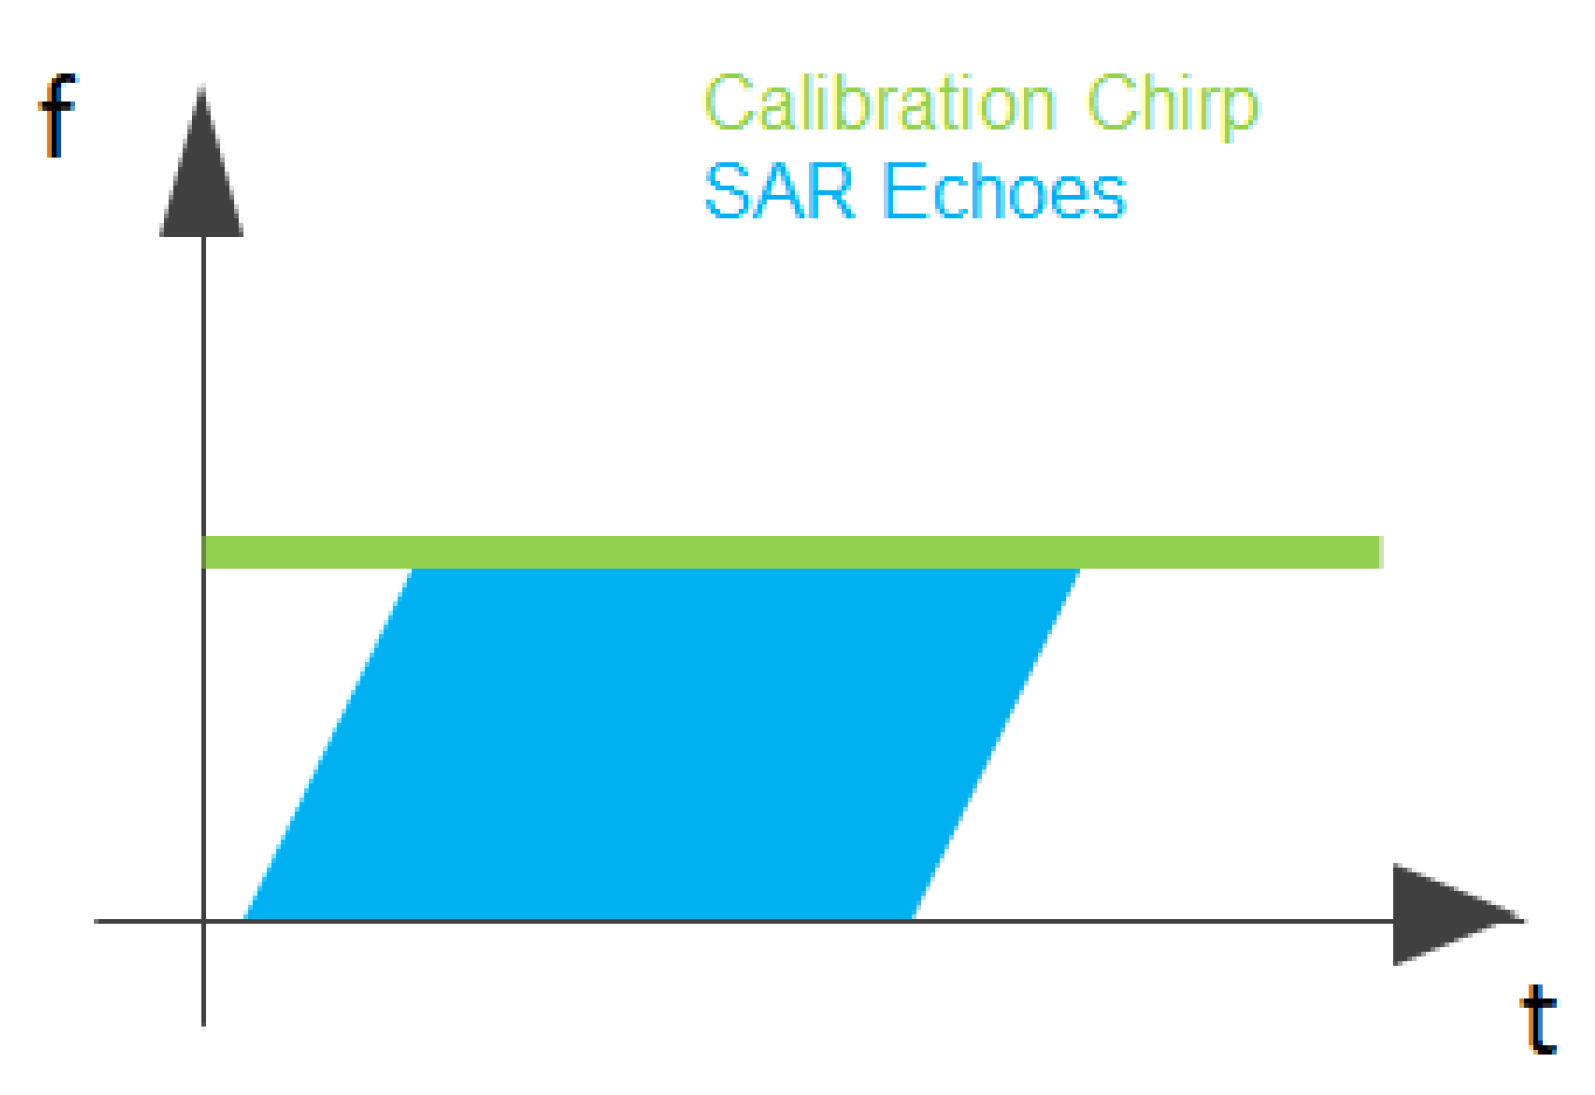
The binary phase shift keying is another coding scheme where the phase of the calibration signal is shifted by for every second radar pulse (this equals an alternating phase shift for every pulse). This coding is equal to a Walsh code [8] of length 2 that can be simply implemented in hardware. Similar to the coding using an inverse chirp, the calibration signal only affects a small frequency band in the frequency–time domain (see Figure 4). Thus, the results for the image disturbances are very similar to those of the down-chirp case: the mean of the pixel-wise image disturbance is dB and deg with a maximum error of dB and 180 deg. The rational for the large maximum phase error is the same as for the down chirp coding. Due to the smaller time-bandwidth product of this coding scheme, the quality ratio of the retrieved calibration signal is only dB. The retrieval of the calibration signal could be significantly improved if the code length were to be increased, i.e., using a Walsh code sequence longer than 2.
6.3. 180 Pseudo Noise Binary Phase Coding
In the coding scheme introduced thus far, the energy of the calibration signal is very concentrated in the frequency–time domain, which can lead to strong errors in some parts of the SAR image. The pseudo noise binary phase shift keying tries to spread the energy in the frequency time domain (see Figure 5). A 15-bit pseudo noise code is used in this case (generator ) leading to a sequence of 32,768 pulses or about 8 s.
For this code the image disturbance gets a bit higher with a mean error of dB and deg and a maximum error of dB. On the other hand, the quality ratio of the calibration signal increases to 24 dB, which would allow a lower signal level for the injected calibration signal and hence lower image disturbances.
6.4. Discussion
A problem in the available SAR dataset is the BAQ compression of 4 bit. Modifying already quantized data and re-compressing them can lead to artifacts in the data. To analyze the effect of the data processing (BAQ decompression, re-compression, and dithering) on the data, the whole processing was performed without adding any calibration signal to the data. The results are listed in Table 1 as ‘No coding’.
It can be seen from the sections above that there is a trade-off between the quality of the calibration signal and the disturbances caused in the SAR image. With the high correlation gain achievable (see Section 4), a very low power level can be selected for the calibration signal, which leads to smaller disturbances in the image. This trade space is enlarged by the selections of the coding scheme. The latter was not analyzed to its full extent. Nevertheless, the quality of the calibration signal and the disturbances caused in the image (see Table 1) are reasonable to allow an implementation in real SAR systems. Further optimization of the coding, the injected power level, and the acceptable image disturbances are part of an adaption of this technology to a specific SAR mission.
7. Conclusions
A scheme for internal calibration is introduced that does not require interrupting SAR data acquisition, which is important for future SAR missions with very long data takes. It is shown that the transmit and short path calibration of the traditional calibration approach can be performed during nominal radar transmission time by proper routing of the signal through the hardware. The receive path calibration is most critical due to its low signal power and its sensitivity to interference from outside the instrument. The introduced technique uses signal coding to retrieve a calibration signal continuously injected into the receive path during radar reception. Due to the compression gain achievable on the calibration signal, the signal power can be very low to cause only minor disturbances in the actual SAR image. The results of the introduced coding scheme are summarized in Table 1. As the SAR acquisition does not need to be interrupted using the described internal calibration scheme, the instrument commanding is simplified and the image quality can be improved. This is very beneficial for SAR modes such as staggered SAR [9] where missing samples significantly deteriorate the SAR focusing process.
Author Contributions
Conceptualization, J.R.; Formal analysis, J.R.; Methodology, J.R.; Software, J.R.; Supervision, M.S.; Visualization, J.R.; Writing—original draft, J.R.; and Writing—review and editing, M.S. All authors have read and agreed to the published version of the manuscript.
Funding
This research received no external funding.
Conflicts of Interest
The authors declare no conflict of interest.
References
- Larson, R.W.; Jackson, P.L.; Kasischke, E.S. A Digital Calibration Method for Synthetic Aperture Radar Systems. IEEE Trans. Geosci. Remote Sens. 1988, 26, 753–763. [Google Scholar] [CrossRef]
- Dall, J.; Skou, N.; Christensen, E.L. Pulse-Based Internal Calibration of Polarimetric SAR. In Proceedings of the IGARSS ’94—1994 IEEE International Geoscience and Remote Sensing Symposium, Pasadena, CA, USA, 8–12 August 1994. [Google Scholar]
- Bräutigam, B.; Schwerdt, M.; Bachmann, M. An Efficient Method for Performance Monitoring of Active Phased Array Antennas. IEEE Trans. Geosci. Remote Sens. 2009, 47, 1236–1243. [Google Scholar] [CrossRef] [Green Version]
- Hounam, D.; Schwerdt, M.; Zink, M. Active Antenna Module Characterisation by Pseudo-Noise Gating. In Proceedings of the 25th ESA Antenna Workshop on Satellite Antenna Technology, Noordwijk, The Netherlands, 18–20 September 2002. [Google Scholar]
- Breit, H.; Fritz, T.; Balss, U.; Lachaise, M.; Niedermeier, A.; Vonavka, M. TerraSAR-X SAR Processing and Products. IEEE Trans. Geosci. Remote Sens. 2010, 48, 727–740. [Google Scholar] [CrossRef]
- Prats, P.; Rodriguez-Cassola, M.; Marotti, L.; Naninni, M.; Wollstadt, S.; Schulze, D.; Tous-Ramon, N.; Younis, M.; Krieger, G.; Reigber, A. Taxi: A versatile processing chain for experimental TanDEM-X product evaluation. In Proceedings of the 2010 IEEE International Geoscience and Remote Sensing Symposium, Honolulu, HI, USA, 25–30 July 2010; pp. 4059–4062. [Google Scholar]
- Schuchman, L. Dither Signals and Their Effect on Quantization Noise. IEEE Trans. Commun. Technol. 1964, 12, 162–165. [Google Scholar] [CrossRef]
- Walsh, J.L. A Closed Set of Normal Orthogonal Functions. Am. J. Math. 1923, 45, 5–24. [Google Scholar] [CrossRef] [Green Version]
- Villano, M.; Krieger, G.; Moreira, A. Staggered SAR: High-Resolution Wide-Swath Imaging by Continuous PRI Variation. IEEE Trans. Geosci. Remote Sens. 2014, 52, 4462–4479. [Google Scholar] [CrossRef]
Figure 1.
Simplified scheme of a transmit and receive module (TRM) including the routing of the calibration signals. The calibration paths are: transmit (green), receive (red), and short (blue).
Figure 1.
Simplified scheme of a transmit and receive module (TRM) including the routing of the calibration signals. The calibration paths are: transmit (green), receive (red), and short (blue).

Figure 2.
Processing pipeline for the performance estimation using real TerraSAR-X data.

Figure 3.
Frequency–time domain for a SAR scene with a calibration signal coded as a down-chirp.

Figure 4.
Frequency–time domain for a SAR scene with a calibration signal coded using a binary phase shift keying code.
Figure 4.
Frequency–time domain for a SAR scene with a calibration signal coded using a binary phase shift keying code.

Figure 5.
Frequency–time domain for a SAR scene with a calibration signal coded using a pseudo noise binary phase shift keying code.
Figure 5.
Frequency–time domain for a SAR scene with a calibration signal coded using a pseudo noise binary phase shift keying code.


Table 1.
Summary of performance figures for the introduced internal calibration approach using selected coding schemes. The image disturbances were estimated over the whole SAR data take in comparison to the original L1 image without any injected calibration signal. In the “no coding” case, no calibration signal was injected, but only BAQ decoding and encoding including dithering noise were simulated for comparison purposes.
| Coding Scheme | Image Disturbances | Calibration Signal | |
|---|---|---|---|
| Mean | Max | Quality Ratio | |
| Inverse chirp | dB, 1.09 × 10 deg | dB, 180 deg | 19.36 dB |
| PSK | dB, 1.13 × 10 deg | dB, 180 deg | 5.47 dB |
| Pseudo noise | dB, 1.9 × 10 deg | dB, 180 deg | 24.0 dB |
| No coding | dB, 5.3 × 10 deg | dB, 174 deg | − |
© 2020 by the authors. Licensee MDPI, Basel, Switzerland. This article is an open access article distributed under the terms and conditions of the Creative Commons Attribution (CC BY) license (http://creativecommons.org/licenses/by/4.0/).
Share and Cite
MDPI and ACS Style
Reimann, J.; Schwerdt, M. Technique for Concurrent Internal Calibration during Data Acquisition for SAR Systems. Remote Sens. 2020, 12, 1773. https://doi.org/10.3390/rs12111773
AMA Style
Reimann J, Schwerdt M. Technique for Concurrent Internal Calibration during Data Acquisition for SAR Systems. Remote Sensing. 2020; 12(11):1773. https://doi.org/10.3390/rs12111773
Chicago/Turabian StyleReimann, Jens, and Marco Schwerdt. 2020. "Technique for Concurrent Internal Calibration during Data Acquisition for SAR Systems" Remote Sensing 12, no. 11: 1773. https://doi.org/10.3390/rs12111773
Note that from the first issue of 2016, this journal uses article numbers instead of page numbers. See further details here.