Changes of Nutrient Concentrations in the Western Baltic Sea in the Transition Between Inner Coastal Waters and the Central Basins: Time Series From 1995 to 2016 With Source Analysis
 Joachim Kuss1*
  Günther Nausch1
  Clemens Engelke2* Mario von Weber2 Hannah Lutterbeck3
  Michael Naumann4
  Joanna J. Waniek1
  Detlef E. Schulz-Bull1
- 1Department of Marine Chemistry, Leibniz Institute for Baltic Sea Research Warnemünde (IOW), Rostock, Germany
- 2Department of Geology, Water and Soil, State Agency for Environment, Nature Conservation and Geology Mecklenburg-Vorpommern (LUNG), Güstrow, Germany
- 3Department of Water, State Agency for Agriculture, Environment and Rural Areas Schleswig-Holstein (LLUR), Flintbek, Germany
- 4Department of Physical Oceanography and Instrumentation, Leibniz Institute for Baltic Sea Research Warnemünde (IOW), Rostock, Germany
Anthropogenic nitrogen input to the western Baltic Sea has continued to decline by about 30% since 1995, whereas phosphorus input, after a strong decrease of 25% from 1995 to 2000, remained almost on the same level. Despite this development, the Arkona Sea and Belt Sea apparently show no strong changes of nutrient concentrations in the last two decades. In this study, we investigate the concentrations of nitrate, nitrite, ammonium, dissolved inorganic nitrogen (DIN), dissolved inorganic phosphorus (DIP), total nitrogen (TN), and total phosphorus (TP), as the substances of major concern in respect to the eutrophication of the Baltic Sea. To link open-sea nutrient concentrations with nutrient supply by freshwater drain, we used nutrient vs. salinity linear fits, including data from coastal waters obtained during regular German monitoring campaigns. Therefore, the data set was grouped according to differently sized areas to identify regional differences and was subsequently analyzed for four time intervals: 1995–1999, 2000–2004, 2005–2009, and 2010–2016. By extrapolation to a salinity of “zero,” we obtained hypothetical freshwater end-members of the different N and P parameters. Most of these end-members indicated a decline during the four time intervals, supporting a reduction of freshwater-borne N and P supply to the western Baltic Sea. For the period 1995–1999, the freshwater end-members of TN were determined between 200 and 400 μM. This improved to a TN range between 150 and about 300 μM in 2010–2016. TP ranged from about 2.3 to 5.4 μM in 2010–2016, with previous values of slightly above 4 μM and up to almost 15 μM in the period 1995–1999. The end-members determined by our method would fulfill limnic–marine target values of the EU Water Framework Directive of TN = 186 μM and river-type-specific target values of TP between 3 and 5 μM for some areas of the western Baltic Sea in recent years, because the method includes removal processes in the transition zone. Finally, the end-member values were compared with area-specific averages of measured values at the limnic–marine transition point.
Introduction
The western Baltic Sea is subjected to various anthropogenic stressors caused by agriculture, shipping, fishing, aquaculture, tourism and water sports, exploitation of natural resources (e.g., sand), and off-shore installations (Newton et al., 2014). Effluents from land contribute to hypertrophication of the coastal waters of the western Baltic Sea, although modern wastewater treatment plants were shown to have reduced the burdens (Nausch et al., 2011). Large inputs of N and P with additionally unbalanced N/P ratio still cause growth of opportunistic green algae (Korpinen et al., 2007), development of strong algae blooms that appear more or less harmful (Majaneva et al., 2012), loss of seagrass, and the formation of hypoxic and anoxic bottom waters (Conley et al., 2011), leading to decreased diversities of benthos organisms, fish, and birds (Newton et al., 2014). Thus, there is a strong and far-reaching impact of excess nutrient supply to western Baltic Sea coastal waters.
The Baltic Sea is a semi-enclosed sea with a limited water exchange with the North Sea via shallow and narrow straits (Lass et al., 2005). The freshwater is drained from a catchment area in the humid part of Europe that is more than four times larger than the Baltic Sea itself. The brackish water system is characterized by a net outflow and episodic inflows of haline North Sea waters. Brackish water leaves the Baltic Sea through the Danish Straits after an average residence time of 30 years (Reissmann et al., 2009) and modifications. The nutrient concentration of the surface water is determined by locally added nutrients, supplied by rivers, direct discharges (e.g., mariculture), shipping, and atmospheric deposition superimposed on internal nutrient recycling and removal processes.
Atmospheric deposition contributes to nutrient supply in addition to direct and diffuse sources from land mainly carried by rivers. According to the sixth pollution load compilation (PLC-6) (HELCOM, 2018), the annual nitrogen input to the western Baltic Sea (Danish Straits/Belt Sea, and Arkona Sea) has declined from 130,000 Mg in 1995 to 90,000 Mg in 2014, whereas phosphorus dropped from 3,900 Mg in 1995 to 2,900 Mg in 2000 and remained relatively stable thereafter. This corresponded to a reduction of nitrogen by 30% and of phosphorus by 25% over the whole time span.
The concentrations of inorganic nitrogen and phosphorus compounds in Baltic Sea surface waters are characterized by a pronounced seasonality. High concentrations are observed in winter, with low primary production as well as deep winter mixing, although these concentrations decrease to extremely low values in the period of high primary productivity and a shallow mixed layer between spring and midsummer (Nausch et al., 2008).
The coastal ecosystem partially utilizes, removes, and transforms the supplied nutrients and can thus contribute to reductions in nutrient concentrations by various mechanisms (Asmala et al., 2017). Nutrient uptake by high biomass and low nutrient turnover plants (e.g., seagrass) could lead to a long-term fixation of nutrients, showing a “good coastal filter functioning,” whereas unattached ephemeral algae with low biomass and high nutrient turnover rates reflect a marginal ecosystem service in this sense (McGlathery et al., 2007). The western Baltic Sea shows different ecosystem types, comprising open coast, embayment, estuary, and lagoon. Embayments and especially estuaries are regions of elevated sedimentations, whereas lagoons are prone to denitrification and sedimentation, and the open coast provides no important coastal filtering function (Asmala et al., 2017).
The aim of the study is to elucidate long-term changes of nutrient concentrations and the N/P ratio in western Baltic Sea waters in the salinity gradient during the last 20 years. The data set consists of the parameters nitrate, nitrite, phosphate [dissolved inorganic phosphorus (DIP)], dissolved inorganic nitrogen (DIN: the sum of nitrate, nitrite, and ammonium), total nitrogen (TN), total phosphorus (TP), the ratios TN/TP, and DIN/DIP combined with position, time of sampling, and sampling depth and of course salinity and temperature. The hypothesis is that a reduction in nutrient supply by freshwater should be visible in corresponding decrease of the y-axis intercepts of the significant regression lines of the nutrient parameters versus salinity. The y-axis intercept reflects a hypothetical freshwater end-member, which is compared between four time periods in the last two decades to show temporal changes. In addition, we investigate two different salinity ranges: one more focused on the low salinity range and one going up to the median of the respective subset of the data. The comparison of the same region/parameter combination between a reduced and a wider salinity range revealed deviations from conservative mixing (Officer, 1979). In this way, removal or supply processes during mixing of the less haline water with seawater from the central basins were indicated. Finally, the theoretical freshwater end-member values were compared with measured values for the so-called limnic–marine transition (LMT) point, at the border between river water and brackish seawater.
Materials and Methods
Study Area
The study was carried out using data obtained from German territorial waters of the western Baltic Sea including river estuaries, lagoons, and bordering open-sea areas during regular monitoring activities (Figure 1). The German part of the drainage area sums up to 28,600 km2, of which 18,200 km2 drains in the Baltic Proper and 10,400 km2 into the Belt Sea (BLANO, 2014). Coastal and inner coastal waters were monitored by the State Agency for Environment, Nature Conservation and Geology Mecklenburg-Vorpommern (LUNG), and the State Agency for Agriculture, Environment and Rural Areas Schleswig-Holstein (LLUR) in their particular water bodies. The data sets (Leibniz Institute for Baltic Sea Research Warnemünde, 2014; German Environment Agency, 2018) were combined for the time period of January 1995 to December 2016 from monthly monitoring of coastal waters (LUNG and LLUR) and of open-sea waters (Leibniz Institute for Baltic Sea Research Warnemünde, IOW). The open sea was mainly studied by the IOW during five campaigns each year in February, March, May, July/August, and October/November. We investigated the southwestern Belt Sea, the southern Arkona Sea, and the Odra Lagoon including the Odra Bank area. The latter represents the southeastern part of the study area, already part of the Bornholm Sea. The study comprises coastal waters: oligohaline (0.5 ≤ S ≤ 5) and mesohaline (5 ≤ S ≤ 18) inner as well as open coastal waters, meso-polyhaline (10 ≤ S ≤ 30) open coastal waters with seasonal stratification, and the open-sea waters comprising the exclusive economic zones of Germany, Denmark, and Sweden.
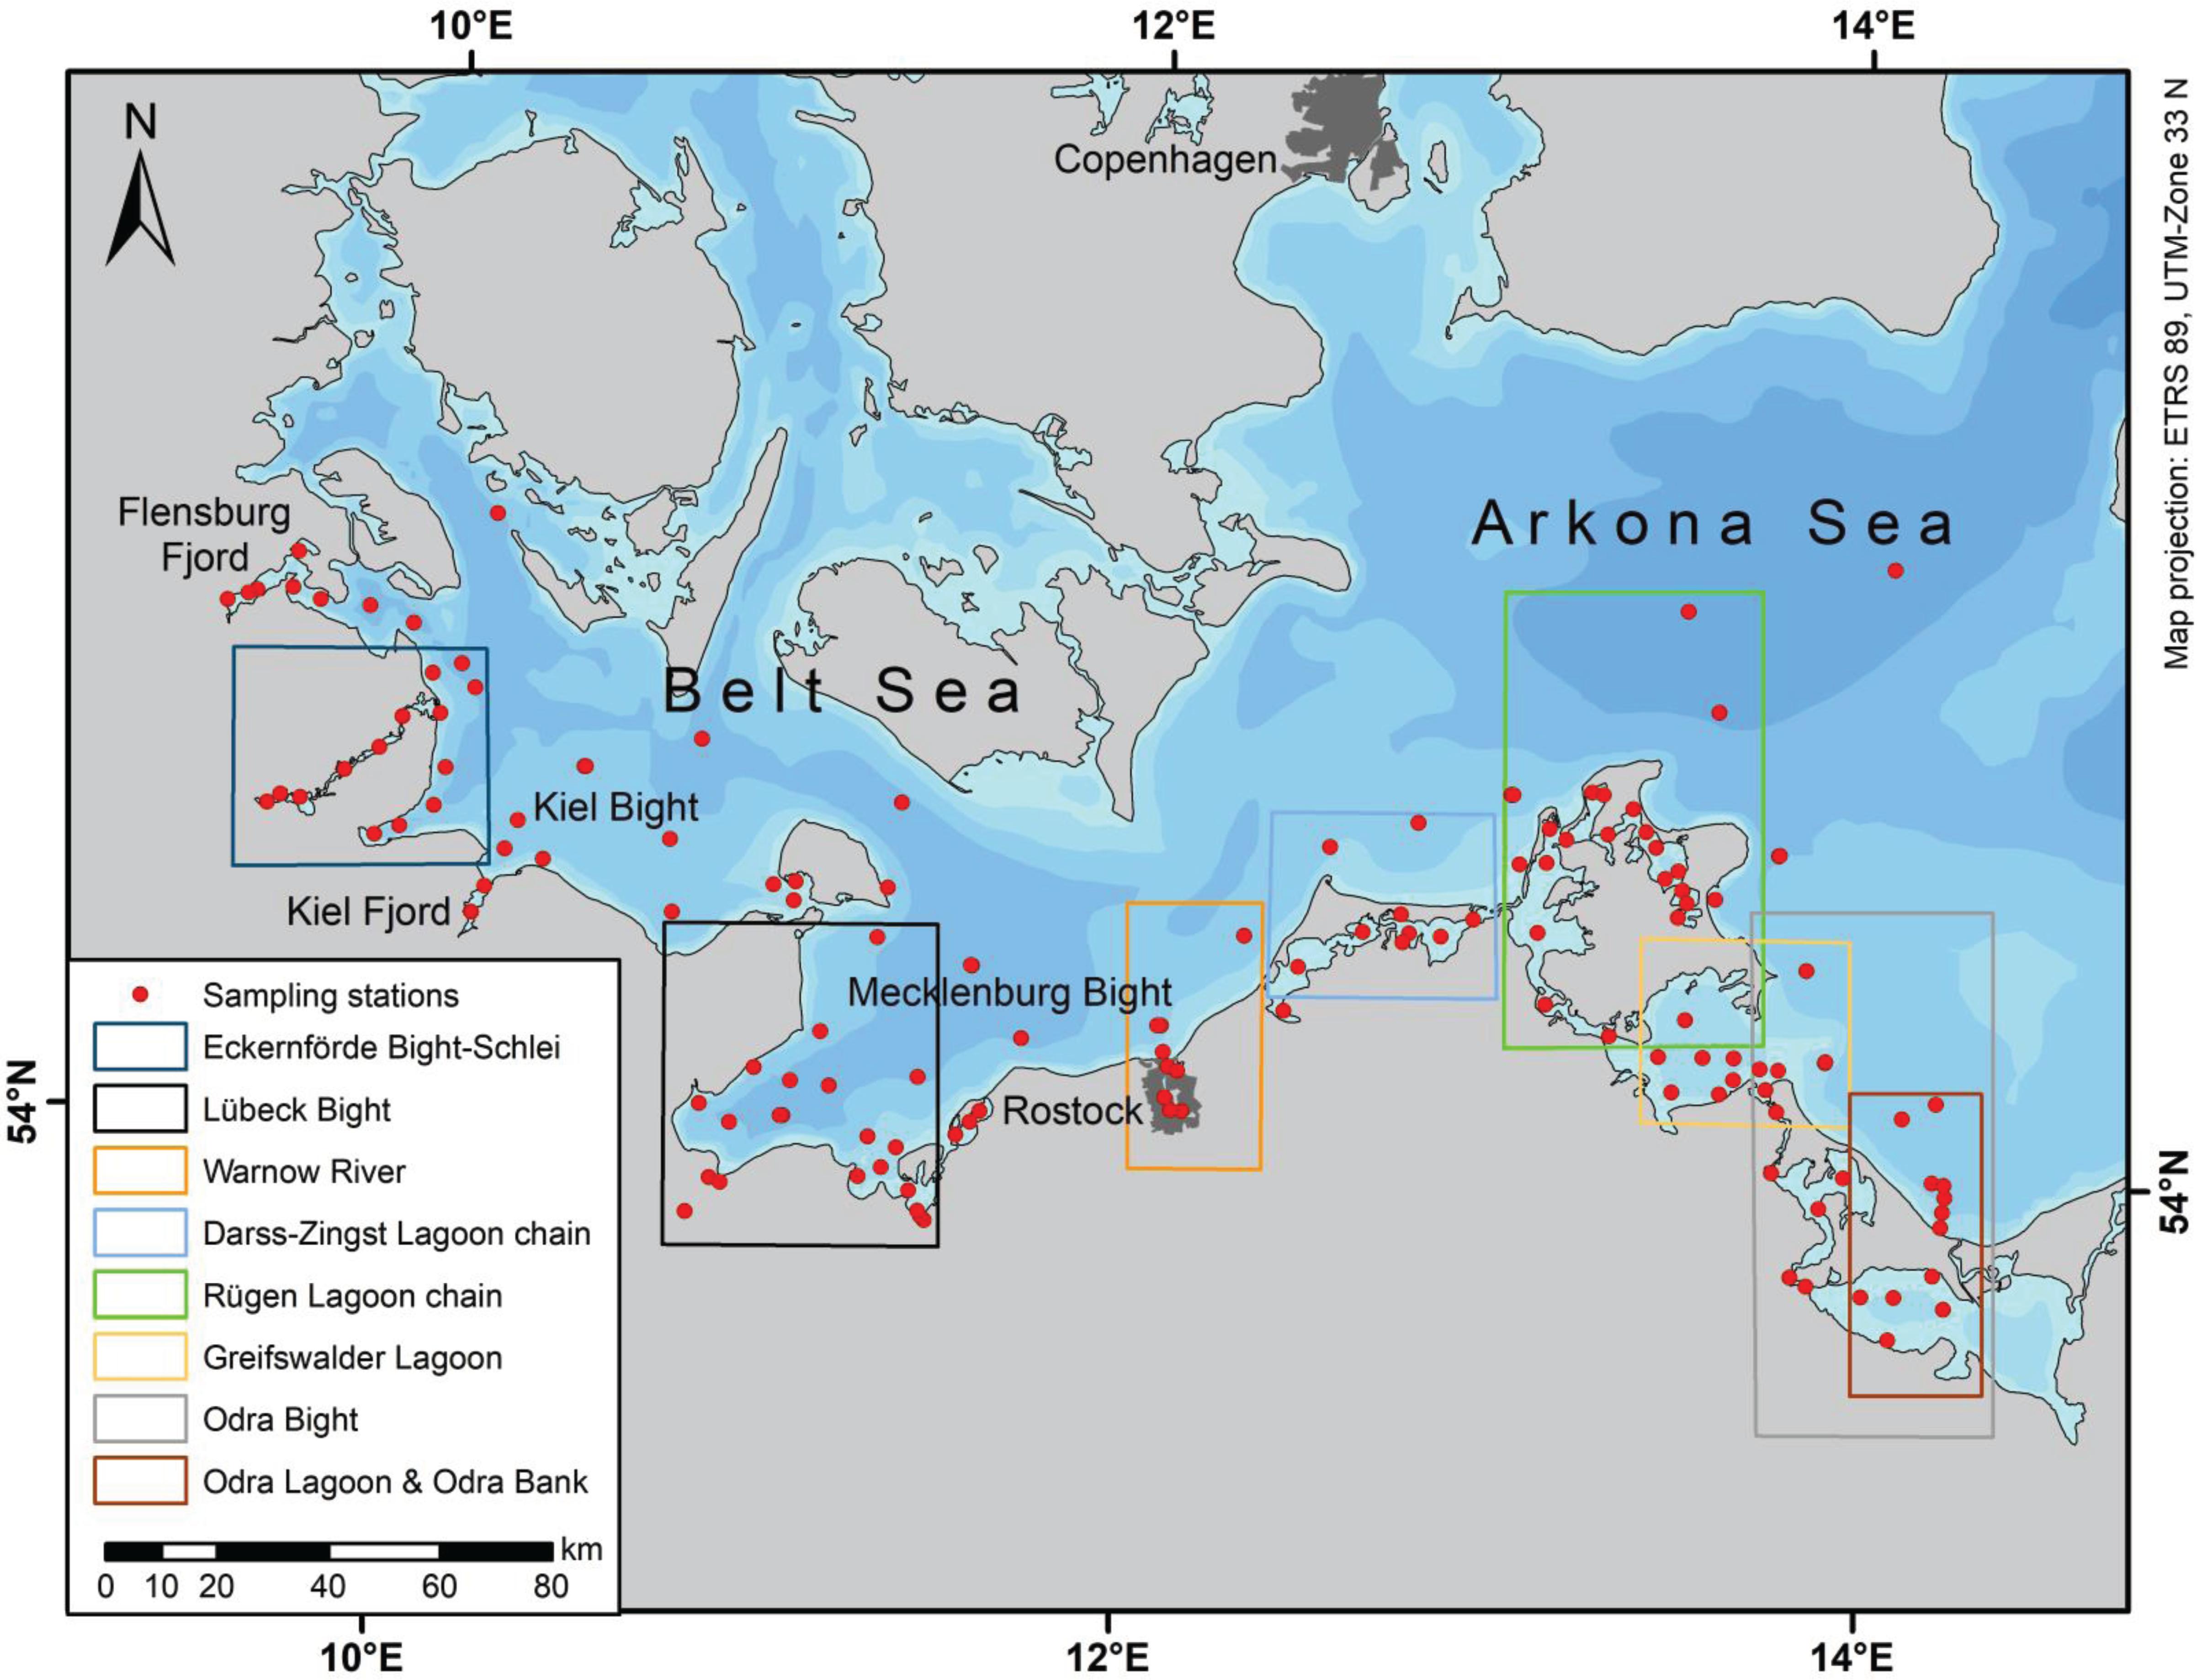
Figure 1. Map of the study area with stations monitored by the LLUR, IOW, and LUNG used in the study; the analyzed regions are indicated in the map by frames or by names.
The western Baltic Sea reflects the transition zone between the brackish Baltic Proper and the North Sea, which shows almost oceanic salinity of >34. The area is characterized in the western part by narrow straits between German and Danish islands and the mainland of Denmark, Sweden, and Germany and by relative shallow basins in the east. Only relatively small rivers supply freshwater into the German coastal waters, for example, the Füsinger and Loiter Meadows via the Schlei Fjord, Schwentine, Trave, Warnow, Recknitz, Barthe, Ryck, Peene, and Uecker Rivers; however, a major contributor is the Odra River with a fraction of 4.7% drained from German territory, and the other part comes from Poland 89.9% and the Czech Republic 5.4%. It is estimated that about 15% Odra River outflow is directly released to German coastal waters at the southeastern part of the study area (BLANO, 2014). At the southern coast, lagoons form large freshwater–seawater transition regions, whereas in the western part, the coast is structured by fjords and bights with an almost direct river input to the sea. An exception reflects the Schlei Fjord in the northwestern part of the Belt Sea (Figure 1) that stretches along 40 km with a salinity range from a few to above 20 until the open Kiel Bight is reached (Rieper, 1976). It should be mentioned that also groundwater discharge in the nearby Eckernförde Bight supplies freshwater to the sea, and because of the negligible surface runoff by rivers, this reflects a significant pathway within the hydrological cycle of this coastal region (Schlüter et al., 2004). The lagoons and semi-enclosed bays of the southern coast of the Baltic Sea were formed during glacial times by denudation by pleistocenic inland ice and by flooding after the melting of the ice cover and the sea level rise. Subsequent transformation by bay bars and spits by sediment relocation in easterly direction led to the current shape of the coast (Lampe, 1994). The chains of linked lagoons show a freshwater inlet at the western or central part and the outlet being often at the eastern end of the lagoon chain. Thus, the lagoons function as a cascade of filters with the river load subjected to chemical, physical, and biological transformation processes and sedimentation (Lampe, 1994).
Chemical Analyses
Nitrate, Nitrite, and Phosphate (Dissolved Inorganic Phosphorus): Water samples were analyzed by manual or automated air-segmented continuous-flow spectrophotometry. The respective nutrient compounds were converted by wet-chemical treatment into colored compounds with high molar absorptivity (Hansen and Koroleff, 1999) that enabled low detection limits of the substances of interest.
Nitrite was analyzed as a red azo dye that is formed with sulfanilamide and a naphthylamine derivate. Nitrate was measured as the sum of nitrate and nitrite after reduction by using a column filled with a copper-coated cadmium as the same azo dye. Subsequently, nitrate was determined by subtraction of nitrite from the sum of nitrate and nitrite.
Phosphate was quantified with ammonium molybdate at pH < 1 by reduction of the formed heteropolymolybdate phosphoric acid to molybdenum blue.
Ammonium: For quantification, ammonium is transformed with hypochlorite and phenol to the indophenol blue dye and determined by photometric measurements, taking care to avoid contamination by airborne ammonia and ammonium compounds.
DIN was calculated from the sum of nitrate, nitrite, and ammonium concentrations, only if all three parameters were available. LLUR also measured nutrients from unfiltered samples, and if no DIN from filtered sample was available, DIN determination on unfiltered water was used.
Total Nitrogen and Total Phosphorus: For analyses of TN as nitrate and TP as phosphate, the compounds of the unfiltered samples were digested by peroxodisulfate in pressure vessels, heated by using either a microwave oven (IOW and LUNG) or an autoclave with a high-temperature thermostat (LLUR). Final analysis was then done by spectrophotometry as described for nitrate and phosphate.
There is a long tradition of strict quality assurance in nutrient analysis (Grasshoff, 1976) for monitoring purposes that has meanwhile been accredited according to the ISO/IEC 17025.
Data Synthesis and Analysis
For data analysis, Microsoft Excel 2016 functions as well as the MATLAB Release 2014a statistical tools were used. We selected suitable nutrient parameters that indicate eutrophication, nitrate (μM), DIN (μM), phosphate (DIP, μM), TN (μM), and TP (μM). Ammonium and nitrite contributed to the sum-parameter DIN but appeared to be less informative in terms of eutrophication of coastal surface waters. Moreover, the ratios TN/TP (mol/mol) and DIN/DIP mol/mol were considered. A low ratio of the latter indicates phosphate excess situations that could foster blooms of diazotrophic cyanobacteria.
First, we looked at open-sea data for the 20-year time period from IOW only. Thereby, the time series of surface and bottom water nutrient concentrations were investigated for each season separately. Second, nutrient–salinity relations of surface waters of the upper 10 m were subsequently deduced by including near-coastal, inner coastal, and river water data from LLUR and LUNG. Especially, the extrapolated y-axis intercepts that represent hypothetical freshwater end-members of the respective nutrient concentration were aimed for further interpretations. In contrast to direct measurements of freshwater, this method accounts for the contributions of diffuse and direct sources as well as for water column processes and sediment interaction. We compared nutrient–salinity relations of the 5-year periods 1995–1999, 2000–2004, and 2005–2009 as well as the 7-year period 2010–2016. Therefore, the data set was restricted to the months October to May excluding summer values, because it was found that the occurrence of low nutrient concentrations in surface waters over a broad salinity range during summer clearly negatively impacted the regression analysis. A change in the freshwater source concentrations is thus assumed to be revealed by the change of the regression lines and the corresponding end-members during different phases of the two decades. To emphasize the weight of the low salinity range, the median salinity of the respective subset of data was calculated and used as an upper limit for the correlation. Subsequently, measured nutrient concentrations at the LMT point were used in the Discussion section for comparison with the end-member values. Therefore, the measured values were averaged according to the discharges of the respective rivers or meadows of the investigated areas to obtain comparable weighted averages. For consistency, also summer values were excluded from the averaging process.
To address potential enrichment or removal processes during transport to the open sea, also, a further restricted salinity range was investigated for the end-member calculation. An F-test on homogeneity of variance revealed for five areas with up to four parameters and almost all time intervals a significant difference (>99%) for the two salinity ranges. This was certainly supported by the usually large number of data used for the correlations (n = 114–1104) that somehow balances the natural scatter of data. However, in two cases, for the Warnow river area (n = 28–51) and the Odra Bight, a significance level of only 95% was fulfilled, and in the Mecklenburg Bight, a parameter was not significantly different for the two salinity ranges in a certain time period.
The data set was geographically split into subsets according to specified regions (Figure 1) to investigate the contribution of each subregions to certain open-sea areas or the open Western Baltic Sea. First, the study area was separated at the Darss Sill into the main sea areas, the Belt Sea, and the Arkona Sea with respective coastal zones. Second, the next group of larger areas represented the combined Eckernförde Bight–Schlei region, the Kiel Bight, the Mecklenburg Bight, the Darss-Zingst region (“Darss-Zingst Lagoon chain”) with the Saaler and Barther Lagoons. The area comprises the Island of Rügen with surrounding waters. The Kubitz Lagoon, Great Jasmund Lagoon, Strelasund, and Greifswald Lagoon are summarized here as the Rügen Lagoon chain. Further southeast is the Odra Bight region. Third, a few smaller subregions were selected: Flensburg Fjord, Schlei, Eckernförde Bight, Kiel Fjord, Lübeck Bight, Warnow River, Greifswald Lagoon, and Odra Lagoon with Odra Bank (Figure 1). As far as possible, a clear land–sea gradient was realized by the selection of stations, which means that nearby off-shore stations were included. Hence, the large data set was split into data subsets by simply defined boxes, which are not chosen to precisely follow defined geographical areas. We think that this simplification does not bias the analysis significantly. However, an important criterion was that the obtained regression lines were significant. We used a t-test with a significance level of >99%.
Results
Time Series of the Open-Sea Surface and Bottom Waters From 1995 to 2016
The decline of the anthropogenic nutrient input to the western Baltic Sea was assessed by various Pollution Load Compilations for the last decades (HELCOM, 2004, 2011, 2018). The question addressed here is how the changes are reflected in the nutrient concentrations found in the open western Baltic Sea waters. It is expected that surface water as well as deep water reflects the highest variability on the regional and temporal scales. The surface water data are restricted here to the upper 8-m depth, showing the influence of river water supply. The bottom water data were taken from the lowest 3 m of the water column, reflecting the impact of sedimented material.
The IOW nutrient data of February, March, May, July/August, and October/November of 1995 to 2016 were plotted according to the particular seasons of sampling versus the year. Especially, the TP and TN data allow a good overview about temporal nutrient changes, because all kinds of phosphorus and nitrogen compounds are included (Figure 2). The concentration of TP was usually below 2 μM. Only summer and autumn of the first decade of the study period TP showed elevated values. Mainly in bottom waters, the TP concentration reached up to 4 μM (Figures 2C,D). In summer, increased values were found in 1997, 2000, 2001, 2010, and 2014 of above ∼ 2 μM and in autumn 1995, 1997, and 2002 of few single values of about TP = 3 μM. The highest concentrations of TN were found in spring in surface waters in the first half of the investigated time span (1995–2004). The concentration of TN scatters around 25 μM in winter, of ∼40 μM of TN in spring until 2005, and of about 25 μM of TN thereafter, with higher values in surface waters. In summer and autumn, TN was slightly lower at about 20 μM. Also, a weak sinuous pattern is recorded during the two decades with minima in 1998 and 2007, which is best seen in autumn (Figure 2H). In summary, the monitoring of nutrients showed a relatively stable annual variability with no clear trend since 1995, neither in the surface water nor in the bottom water. In order to determine if a temporal trend could be shown, we investigate the nutrient–salinity relationships between 1995 and 2016.
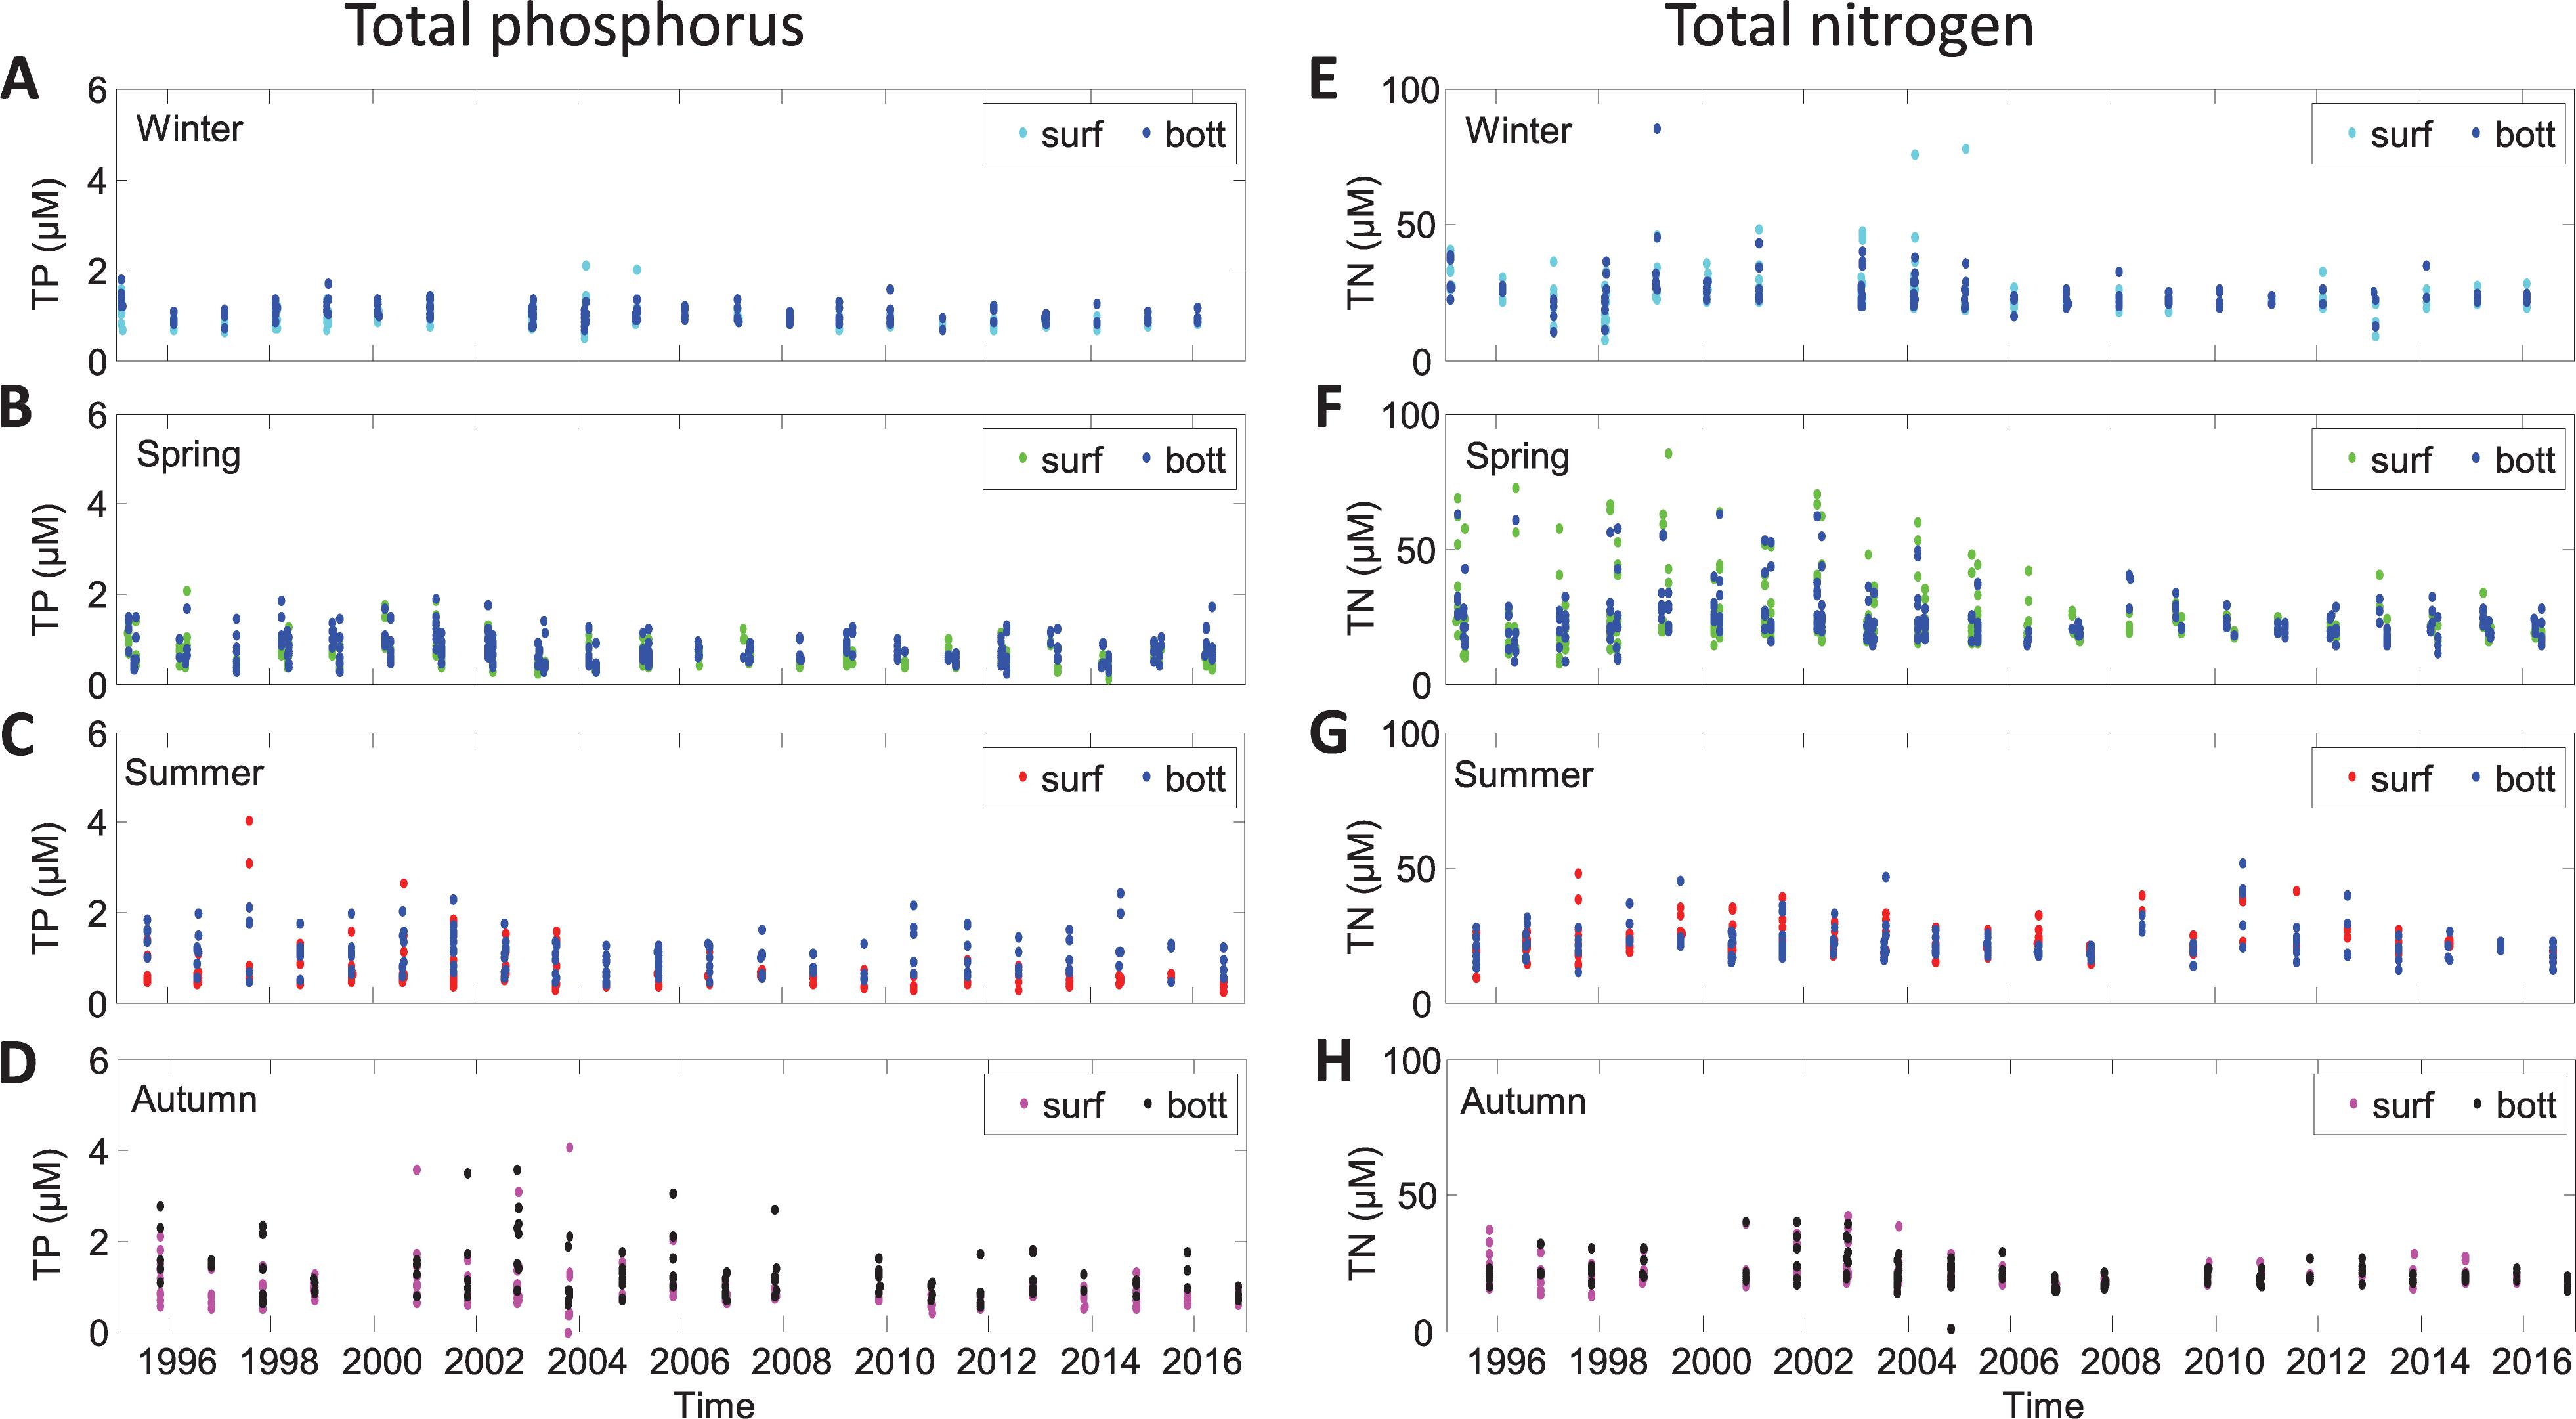
Figure 2. Time series of surface and bottom water concentration of total nitrogen and total phosphorus in open-sea waters of the western Baltic Sea according tothe seasons winter (A,E), spring (B,F), summer (C,G), and autumn (D,H).
Nutrient–Salinity Regression Analysis and the Interpretation of the y-Axis Intercepts
The nutrient–salinity data set of the surface waters was subsequently grouped according to the selected regions. The regression analysis was then done on data obtained from samples with a salinity equal to or below the median for the four time periods separately. Here, we show TN and TP for the Rügen Lagoon chain as an example (Figure 3). The scatter of the data is obvious and caused by the spatial heterogeneity of the regions in combination with temporal variability during spring, autumn, and winter of several years. For the correlation, a linear fit was applied; and the slopes, the y-axis intercepts, and the confidence intervals were calculated (Table 1). The slopes were always negative in the sense that we observed increasing nutrient concentrations with decreasing salinities, hence, in the direction of the freshwater source. Thereby, the slopes were mainly determined by nutrient values at low salinity, because the open-sea nutrient concentrations ranged at clearly lower levels.
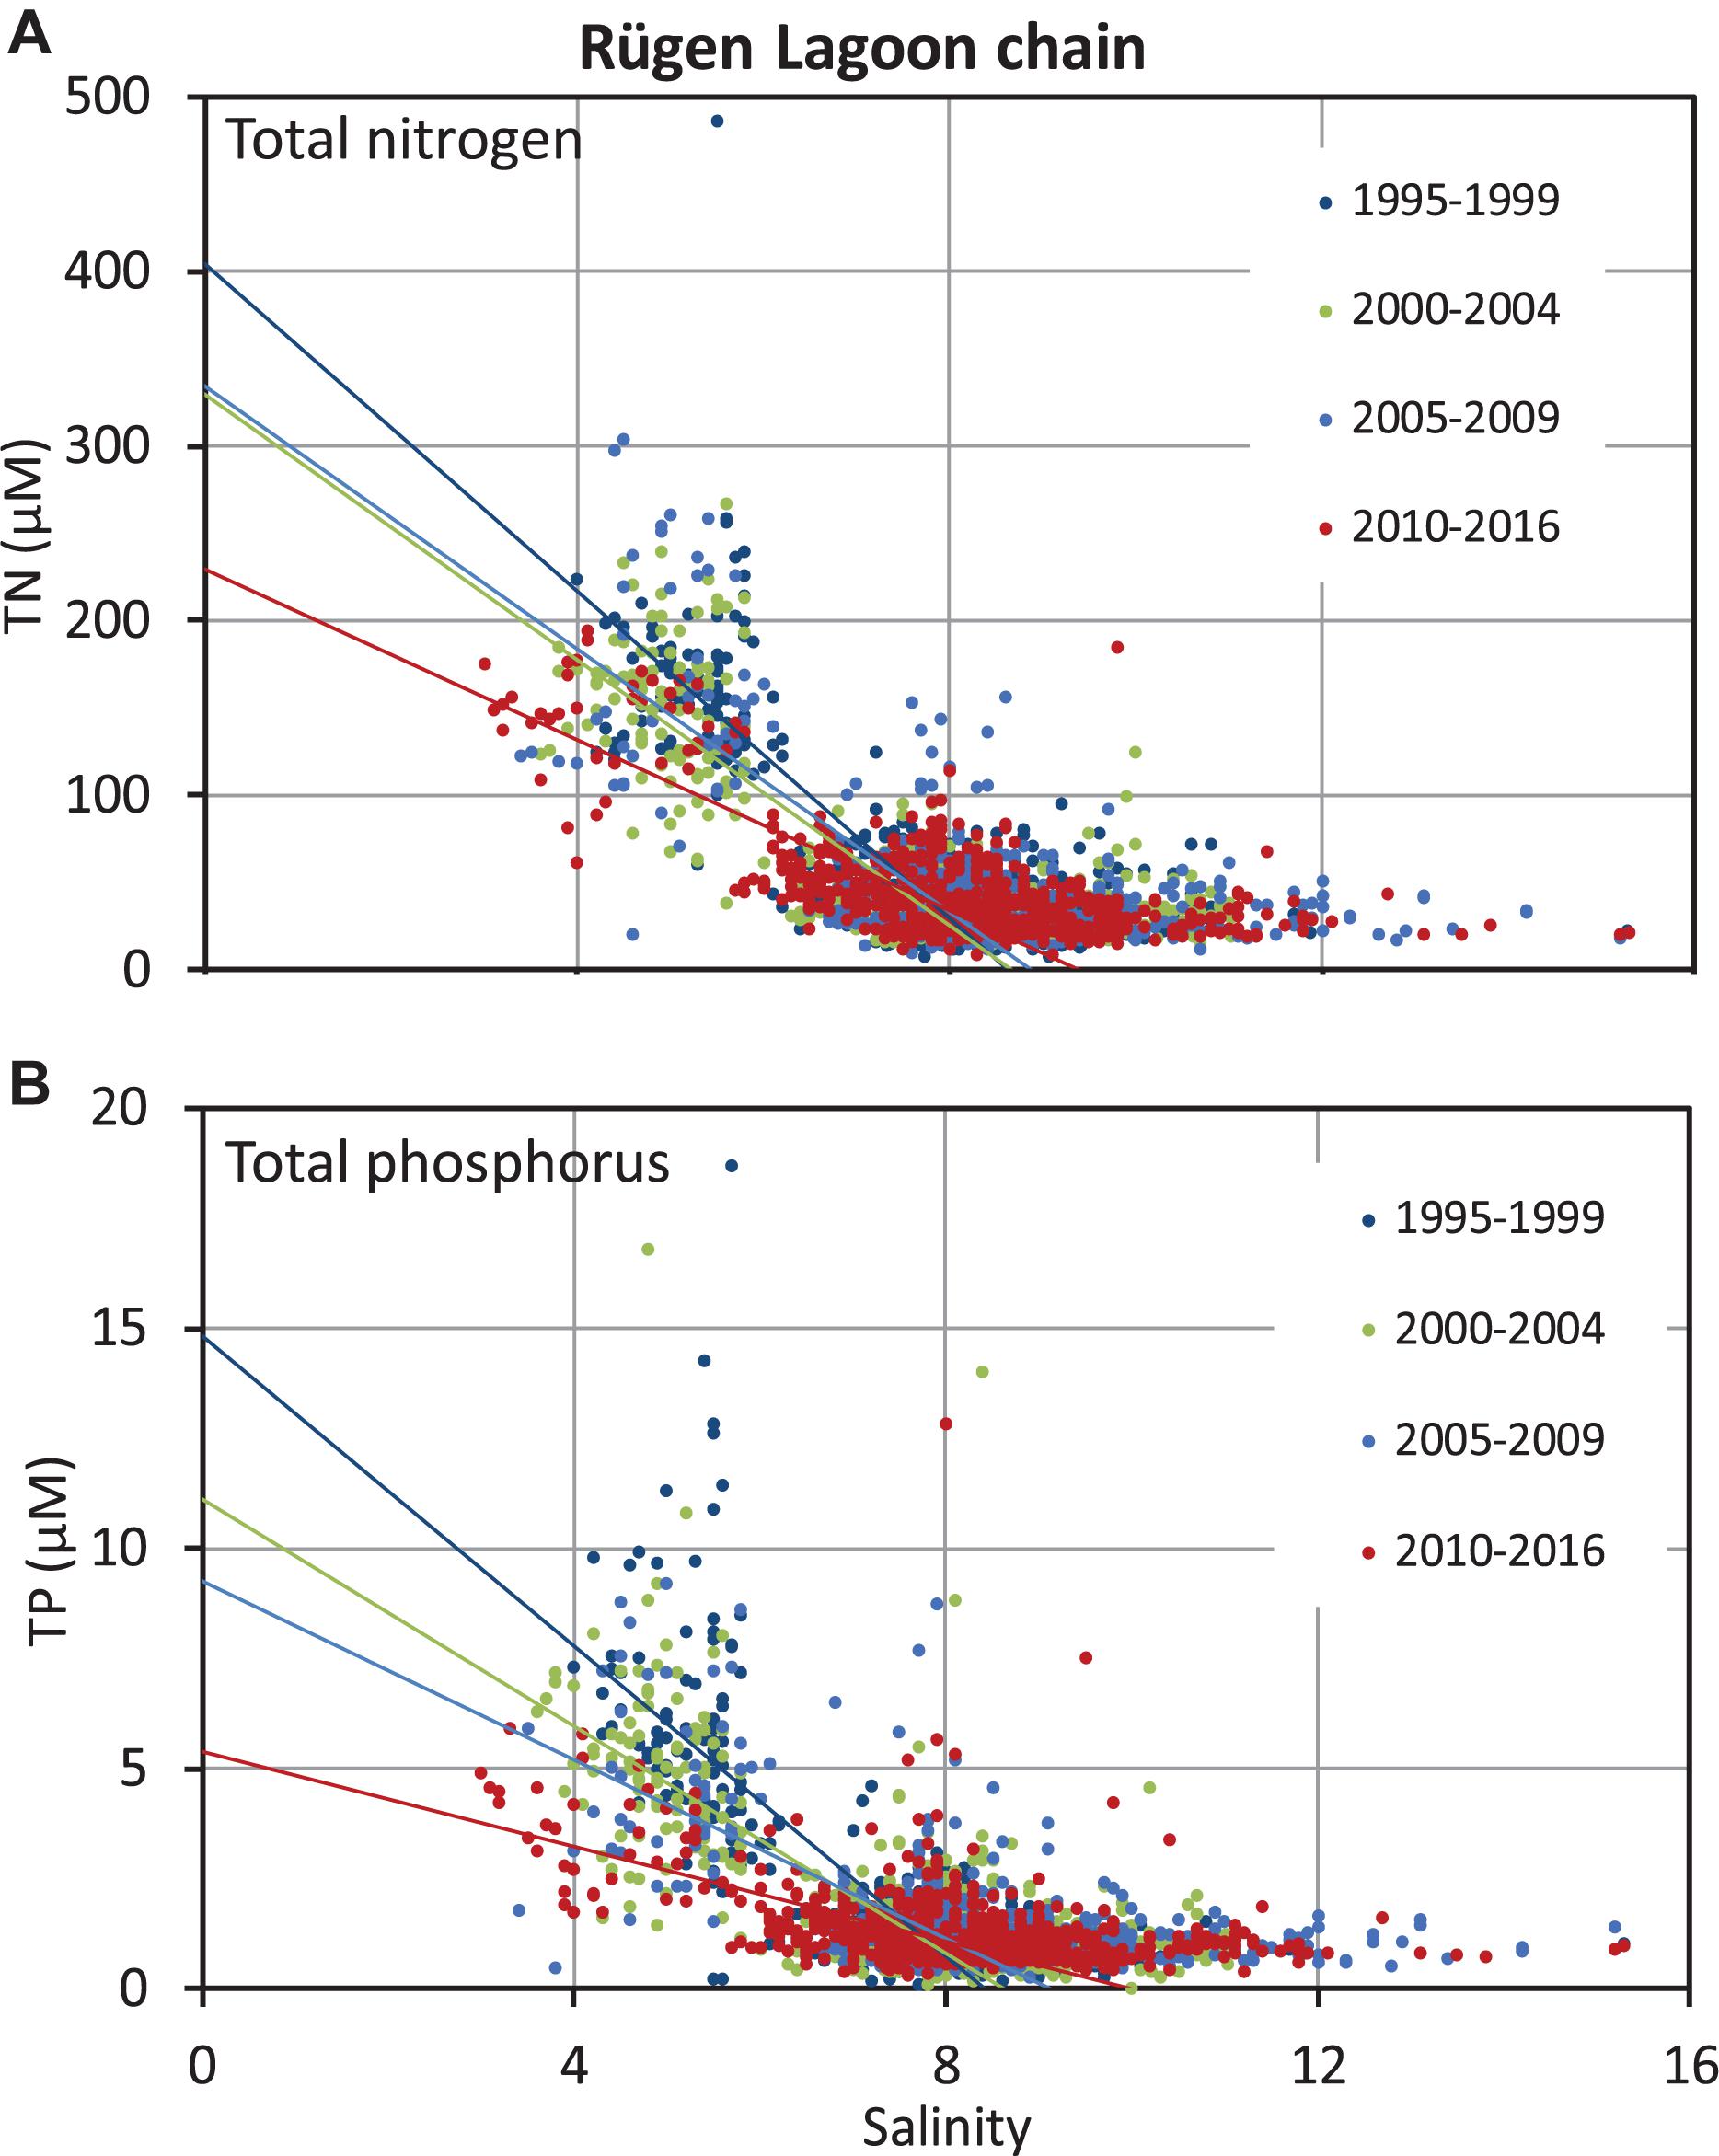
Figure 3. Evaluation of the regression lines for the selected timeperiods for the area of the Rügen Lagoon chain for total nitrogen (A) and total phosphorus (B) for theupper 10 m of the water column; the fits were done in this case for a salinity range equal to or below 8.
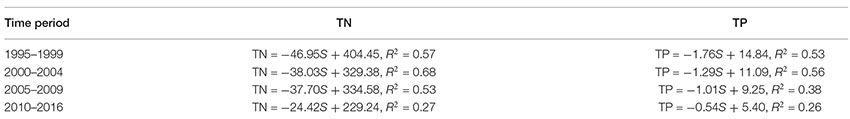
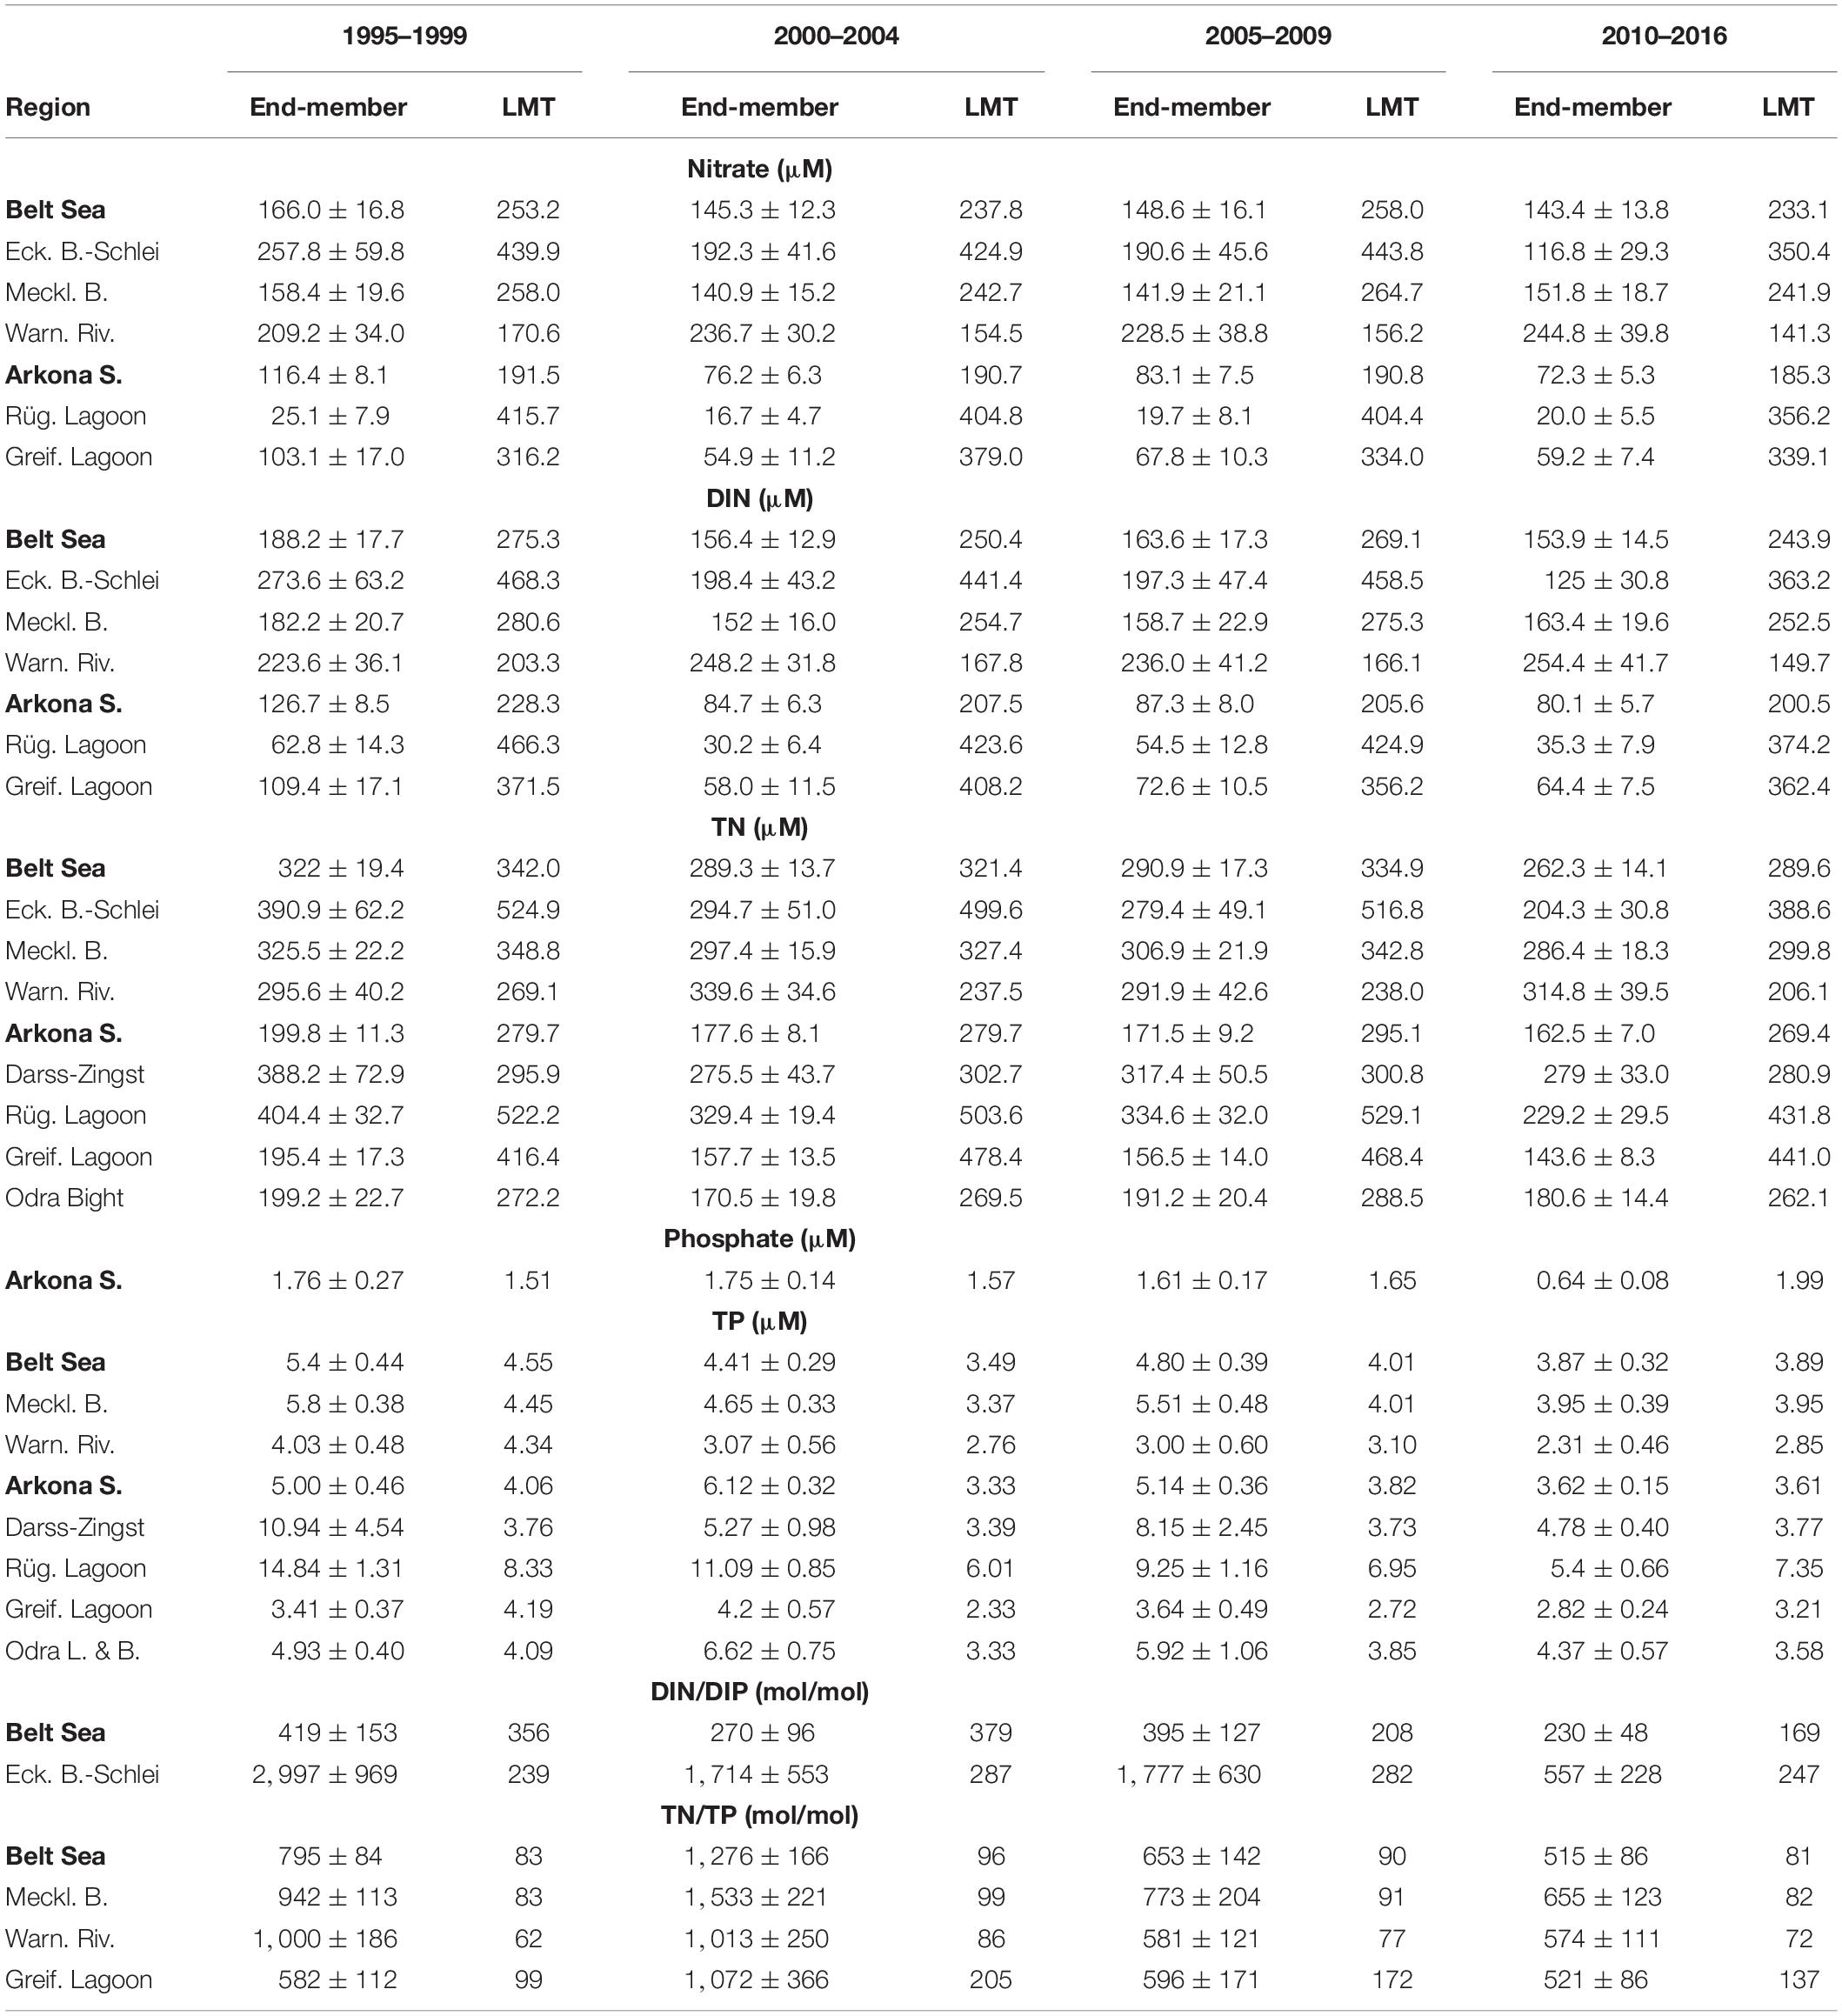
Table 1. Freshwater end-members (y-axis intercepts) from regression lines of parameter–region pairs for all four investigated time periods with >99% significance, the range (±) of the 95% confidence interval, and average measured values for the limnic–marine transition (LMT) given for comparison.
To investigate the trend, only significant regression lines for all four time periods were used. This reduced the amount of correlations (15 regions, 7 parameters) to 35. The determined freshwater end-members were subsequently plotted for the respective nutrient parameters versus the time periods for a better overview (Figure 4). The different regions were grouped from larger to small size and according to the geographical localization from the northwest to the southeast of the study area. The regions that show significant correlations versus salinity are given for nitrate in Figures 4A,B; phosphate in Figure 4C; DIN in Figures 4D,F; TN in Figures 4G–I; and TP in Figures 4J–L. It turned out that the end-members mostly decreased from 1995–1999 to 2010–2016. Only in two cases concerning the Warnow River was an increase determined. Thereby, we obtained different patterns, an almost continuous decline, a plateau from the second to third interval, or even an intermittent increase from the first to second or from the second to third period. Also, a strong decline from the first to second time period and no significant change thereafter were found.
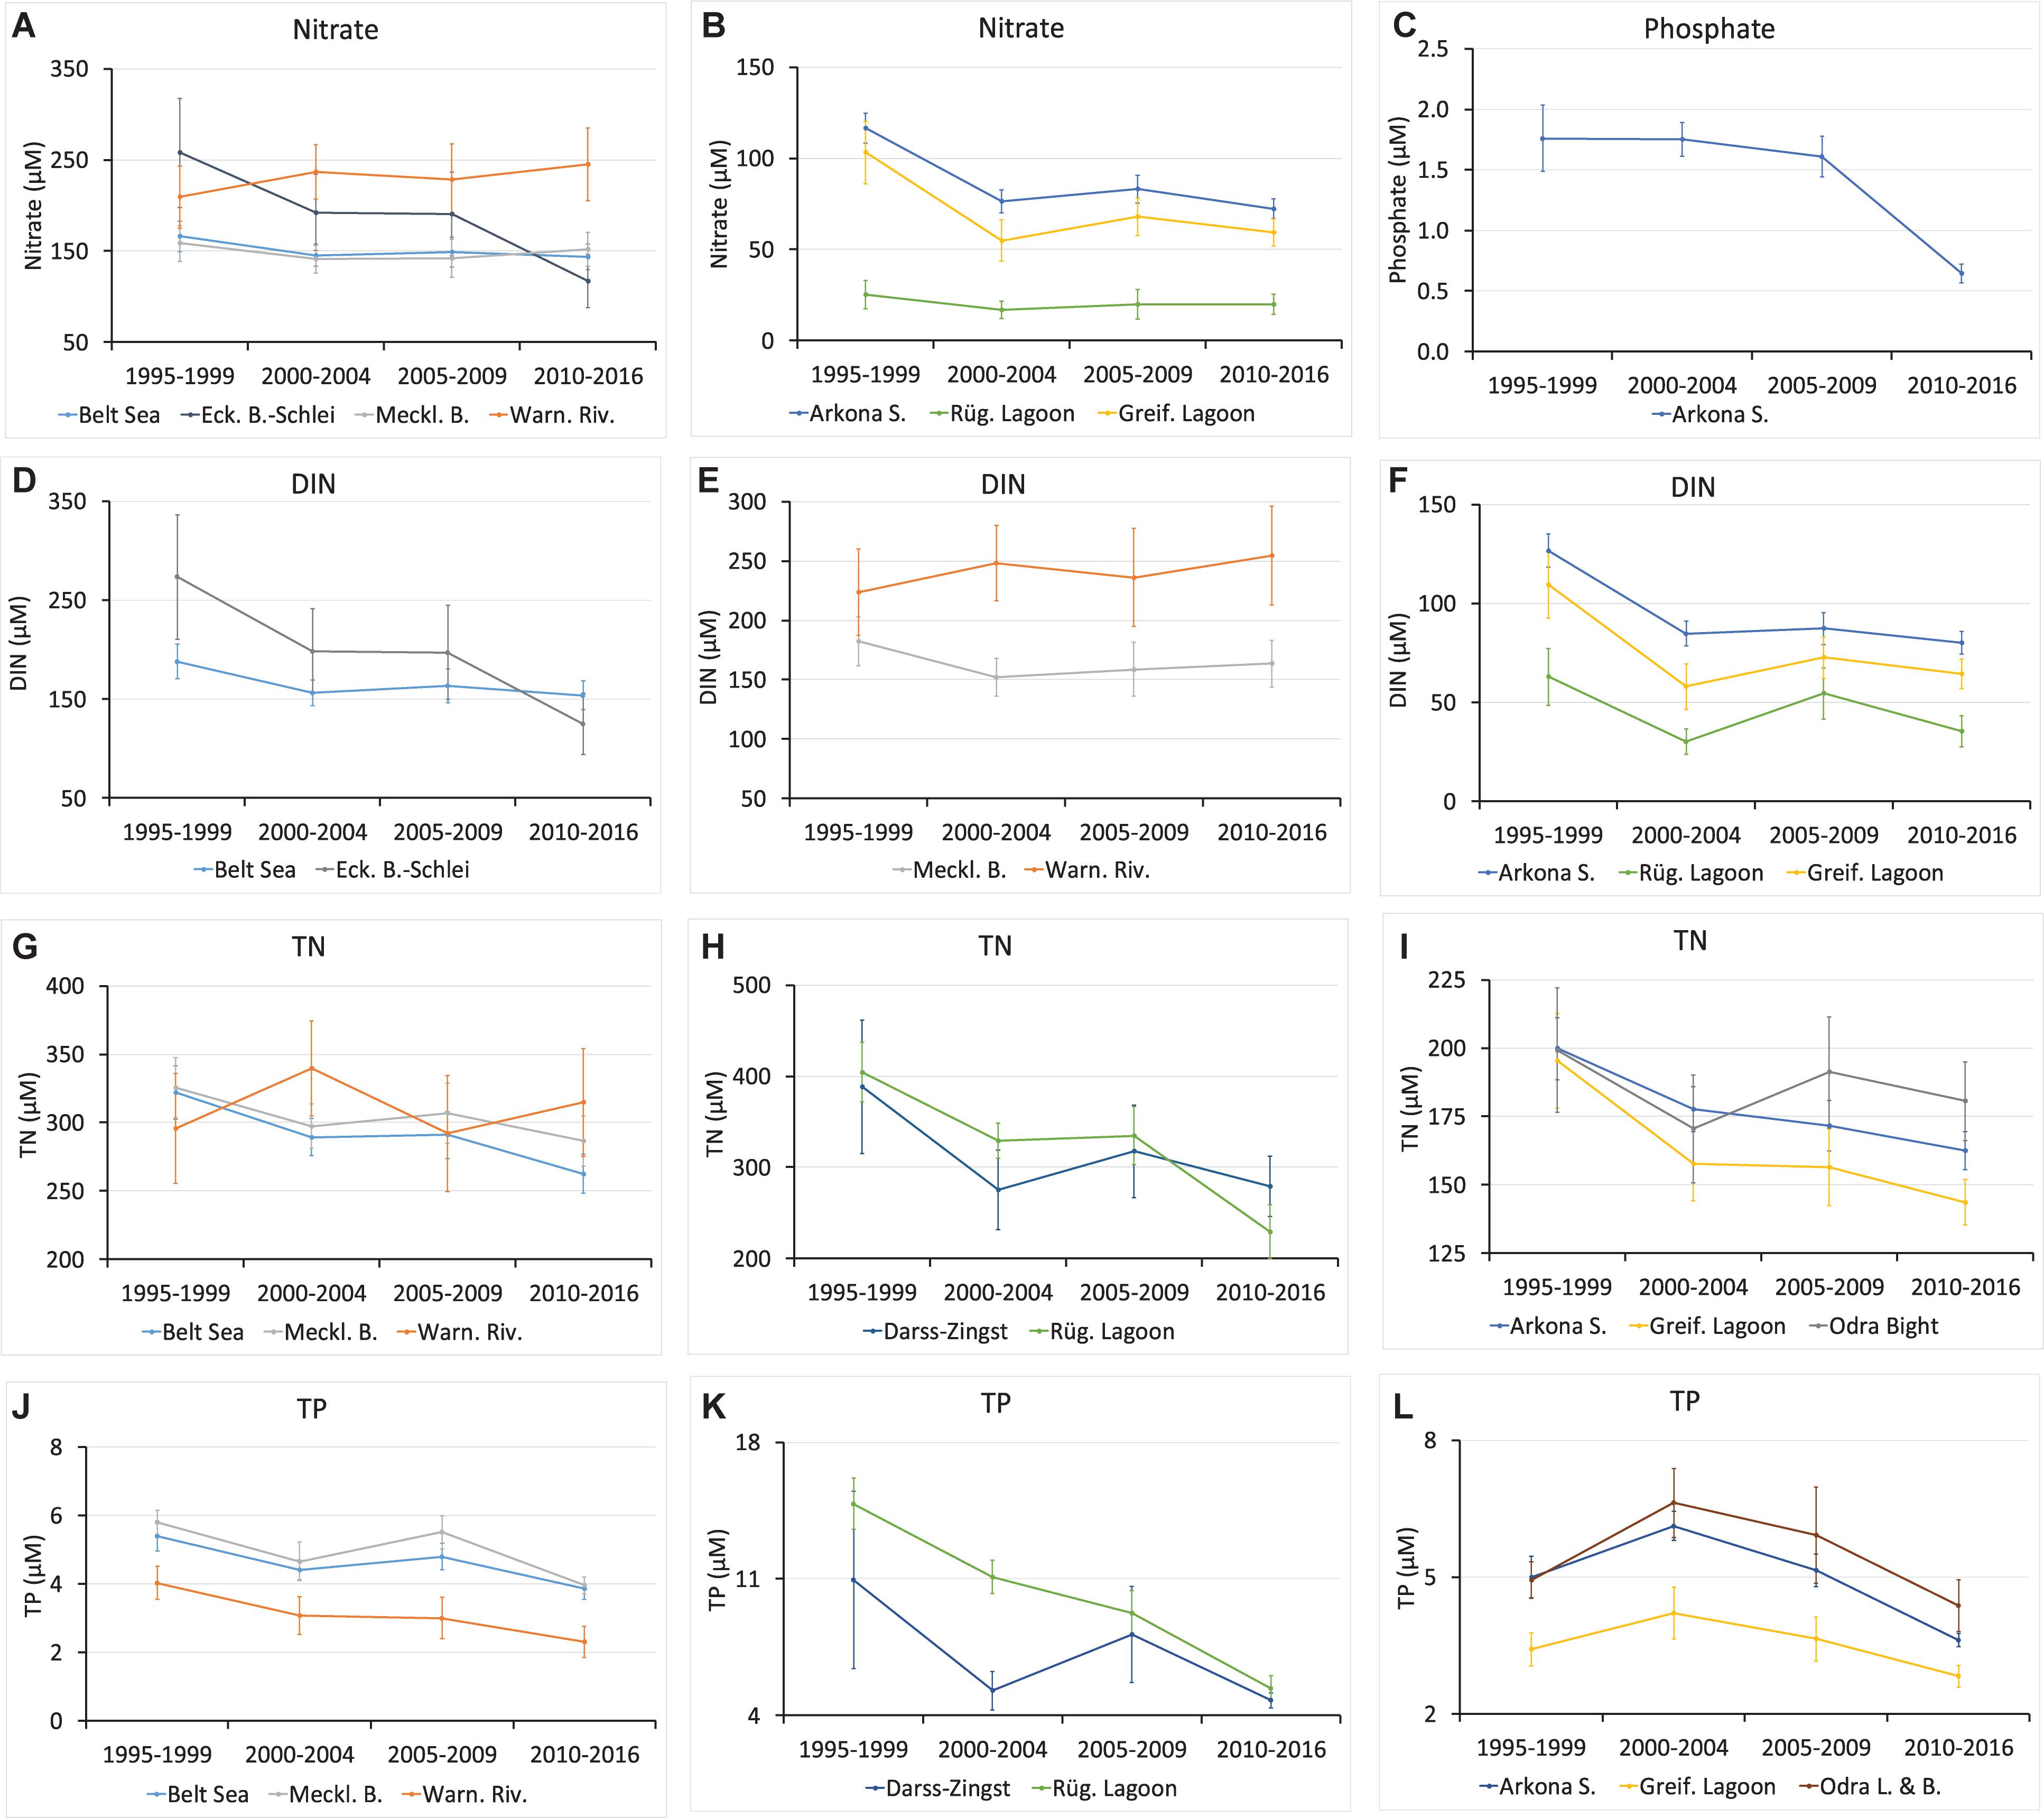
Figure 4. Freshwater end-member concentrations of the investigated nutrients, nitrate (A,B), phosphate (C), DIN (D–F), TN (G–I), and TP (J–L) versus the time periods from significant regression lines (>99%); the upper andlower boundaries of the 95% confidence interval are given as error bars (see Table 1).
Remarkable changes during two decades were determined for nitrate and DIN with an overall strong decrease in the Eckernförde Bight–Schlei (Figures 4A,D) and an increase of nitrate by 20% and DIN by 10% (Figures 4A,E, Table 1) in the Warnow River. However, both show a plateau between the second 2000–2004 and the third 2005–2009 period. In the Rügen Lagoon chain, the DIN end-member reflected an intermittent maximum for 2005–2009 (Figure 4F). The decline of nitrate and DIN end-members determined for the Belt Sea (Figures 4A,D), the Arkona Sea (Figures 4B,F), and the Greifswald Lagoon (Figures 4B,F) basically happened from the first to second period (1995–1999 to 2000–2004), and there were no significant changes thereafter.
Also, TN decreased during the two decades, in the Belt Sea (Figure 4G), the Rügen Lagoon chain (Figure 4H), and the Greifswald Lagoon (Figure 4I) but showed stable end-member concentrations between the second 2000–2004 and third 2005–2009 periods. The overall decrease in the Mecklenburg Bight (Figure 4G) and in the Darss-Zingst Lagoon chain (Figure 4H) is interrupted by intermittent TN maxima in the 2005–2009, whereas TN in the Arkona Sea showed an almost continuous decline by ∼20% (Figure 4I). The TN end-member development in the Warnow River during the whole time period with the maximum in the 2000–2004 period followed by a minimum in 2005–2009 (Figure 4G) as well as for the Odra Bight with a minimum in 2000–2004 and a maximum in 2005–2009 (Figure 4I) just reflects variability, which is supported by the broad confidence ranges.
Phosphate remained relatively stable between the first and third periods and declined subsequently to 2010–2016 by about 40% in the Arkona Sea area (Figure 4C), which represented the eastern half of the study area.
The Warnow River area showed a TP end-member decline by ∼40% from 1995–1999 to 2010–2016 with relative stable values between the second and third periods (Figure 4J, Table 1). In the Darss-Zingst Lagoon chain, TP declined overall by more than 50% but also showed a strong maximum in 2005–2009 (Figure 4K). In the Rügen Lagoon chain, an almost continuous decline down to one-third (Figure 4K) was determined. A decrease of TP is documented in the Arkona Sea, the Greifswald Lagoon, and the Odra Lagoon with Odra Bank (Figure 4L), especially after the maximum in the 2000–2004 period.
The end-members of the DIN/DIP and TN/TP ratios generally seem to decrease in the last two decades (Table 1). However, a clear maximum in the second period from 2000–2004 is documented for TN/TP in the Belt Sea and the Mecklenburg Bight as well as in the Greifswald Lagoon. A relative nitrogen deficit compared with phosphorus cannot be deduced, because the DIN/DIP end-members of about a few hundred mole per mole (Table 1) are far beyond the Redfield ratio (Redfield et al., 1963). Thus, cyanobacteria growth seems not to be supported by the freshwater source in these regions.
It could be highlighted that in the period 2010–2016, the freshwater end-members of nitrate differed between 20 μM in the Rügen Lagoon chain and 245 μM for the Warnow River area (Table 1). Accordingly, DIN was clearly below about 100 μM in the Rügen Lagoon chain, the Greifswald Lagoon, and for the whole Arkona Sea area, whereas in the Belt Sea area, with the Eckernförde Bight–Schlei, Mecklenburg Bight, and Warnow River, the DIN end-member concentrations ranged between 125 and above 250 μM in that period. Similarly, for these regions, the TN end-members were determined from below 150 to more than 300 μM in the recent period (2010–2016). TP ranged from about 2.3 μM in the Warnow River to 5.4 μM in the Rügen Lagoon chain in this time interval, with corresponding values of slightly above 4 μM in the Warnow River and almost 15 μM in the Rügen Lagoon chain in the 1995–1999 period. Phosphate showed significant correlations only for the Arkona Sea with a decline from 1.76 to 0.64 μM within 20 years. For comparison, weighted averages of the nutrient concentrations at the river mouths, so-called LMT points for assessments, were given for the respective regions in Table 1. Potential differences of these values with the extrapolated end-member nutrient concentrations could indicate changes during mixing and transportation of the water ingredients on the way to the open sea. Overall, 17 German meadows and rivers were included for the Belt Sea and 7 rivers for the Arkona Sea to obtain weighted averages of the measured nutrient concentration for all investigated areas.
Changes of the End-Member Values by Considering Different Salinity Ranges for the Regression Analysis
Another interesting point was a potential deviation of the slope of the nutrient concentrations versus salinity from linearity. Just conservative mixing of the freshwater with seawater would cause a linear relationship, but removal and supply processes lead to deviations from the strict linear relation. A slope below the straight line would indicate removal processes, whereas a positive aberration would indicate a supply process. However, the scatter of the data failed to support curve-shaped slopes in comparison with linear relationships. We therefore follow the alternative approach, to further restrict the salinity range to investigate if the end-members change. Subsequently, we limit the salinity to a maximum of 0.75 times the median of the data subset (restricted S range in Table 2). This still revealed 14 area–parameter pairs with significant correlation for the four time intervals (Table 2): Belt Sea (nitrate, DIN, TN, TP, and TN/TP), Mecklenburg Bight (nitrate, DIN, TN, TP, and TN/TP), Warnow River (TN), Arkona Sea (nitrate and DIN), and the Odra Bight (TN).
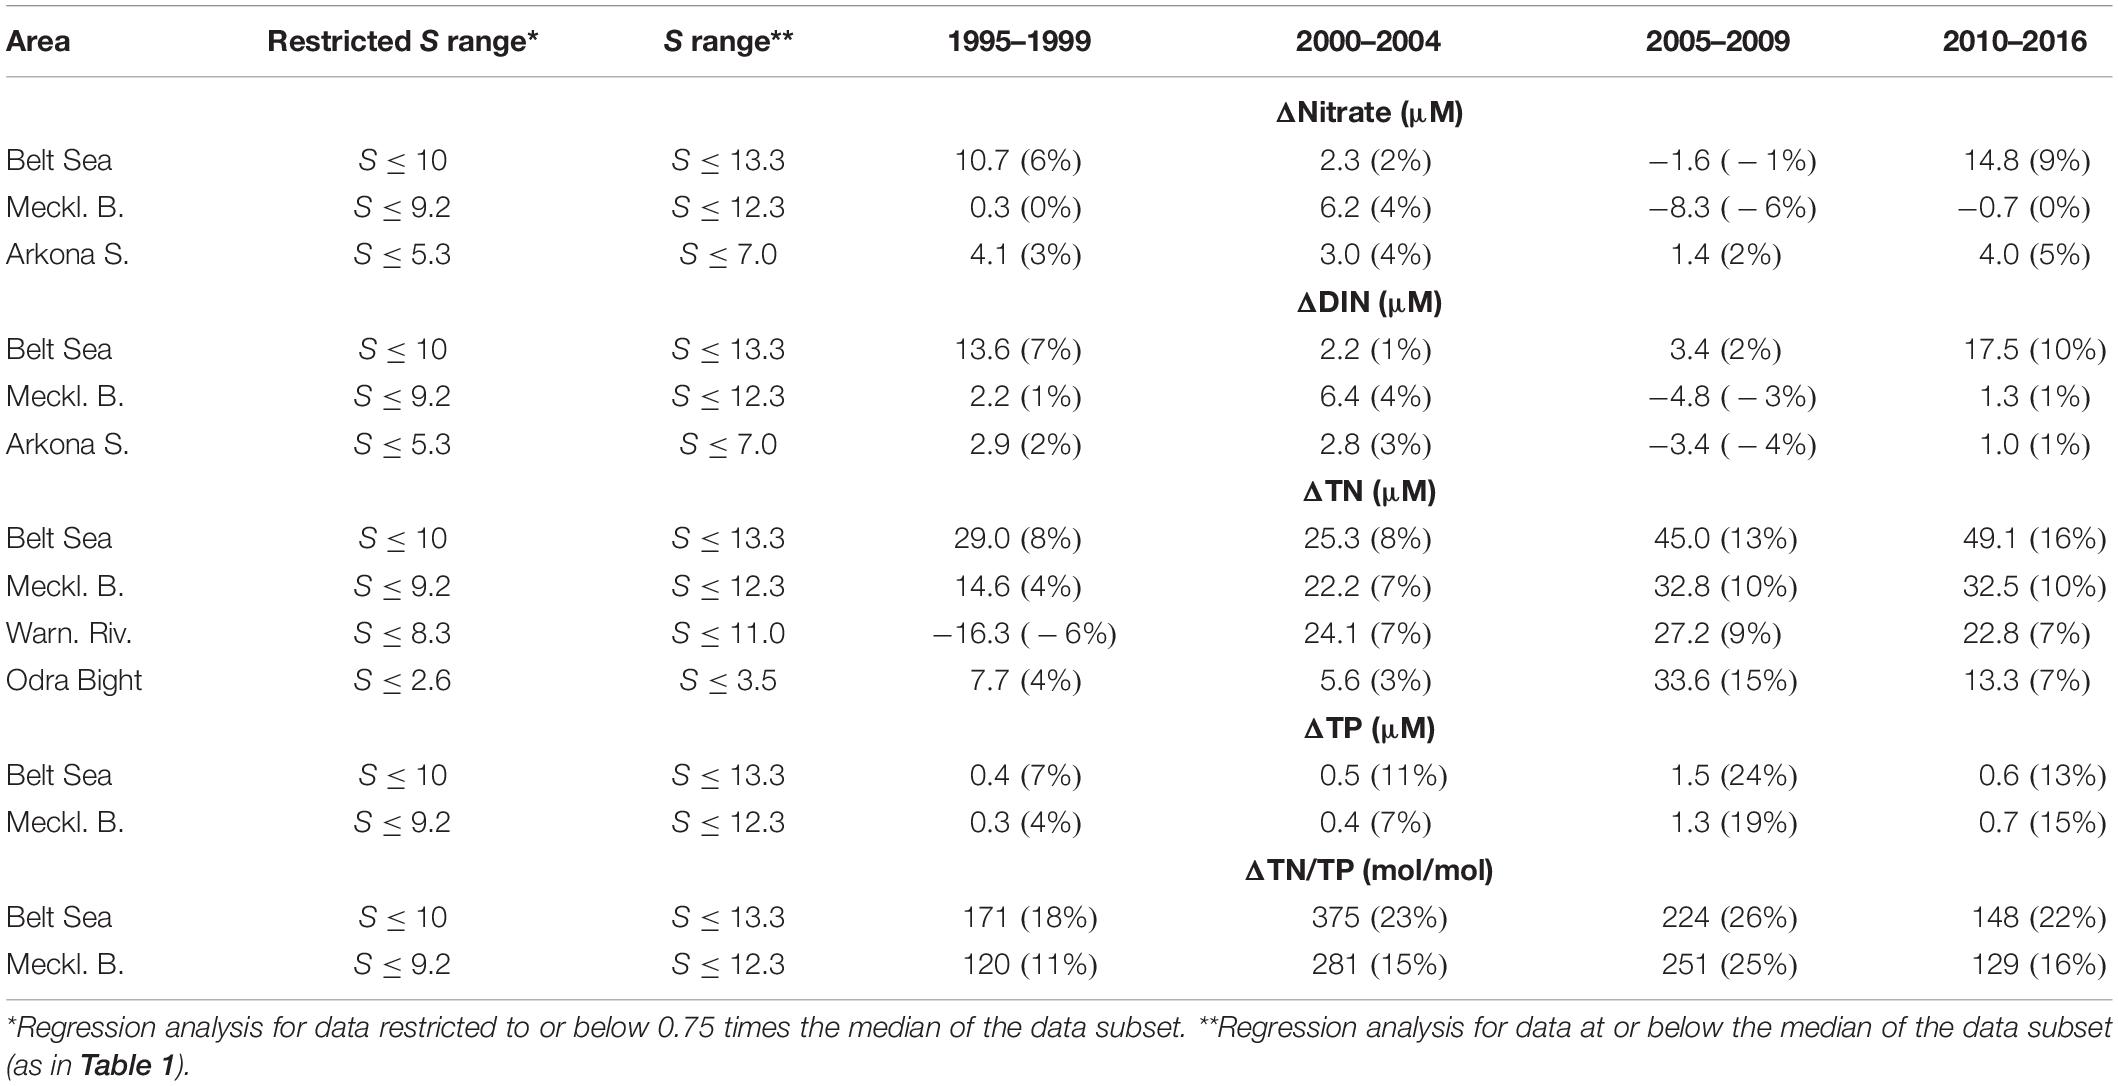
Table 2. Calculated differences of the nutrient concentration end-members (>99% significance) of the restricted salinity (S) range* and the salinity range until the median; the change is given in% in brackets (see text for further information).
Subsequently, the end-members of the same area–parameter pairs of the original salinity range were compared with the ones of the salinity range restricted closer to the freshwater side. The comparison revealed that the latter end-members were in general significantly higher, indicating an increased steepness of the nutrient–salinity relations to lower salinity (Figure 5). This in turn supported the hypothesis that removal processes are operating during mixing and transport between river and open sea for certain compounds and regions. The differences were in the range of mostly a few percent up to 24% (Table 2). A significant reduction of nitrogen compounds during transport to the open sea was thus deduced for the Belt Sea (Figures 5A–C). For the narrower salinity range, it showed a 9% higher hypothetical end-member for nitrate and of 10% for DIN in 2010–2016, as well as of 13% in 2005–2009 and 16% 2010–2016 for TN. In agreement with this observation, the subregion Mecklenburg Bight showed a 10% higher TN end-member for the narrower salinity range in the last two time periods (Figure 5G). For DIN and nitrate, the changes varied and partly changed sign in the Mecklenburg Bight (Figures 5E,F). The TN differences in the Warnow River area since 2000–2004 (Figure 5I) show considerable differences of 7%, 9%, and 7% but were less significant (>95%) in the 2000–2004 interval. For the Arkona Sea area as whole (Figures 5J,K), changes are notified for nitrate of 3%, 4%, 2%, and 5% for the time intervals between 1995 and 2016, and for DIN, only weak changes were determined with changing sign. It should be mentioned that also for the Odra Bight area, TN end-members differed by 15% in the 2005–2009 and 7% in 2010–2016 periods (Figure 5L).
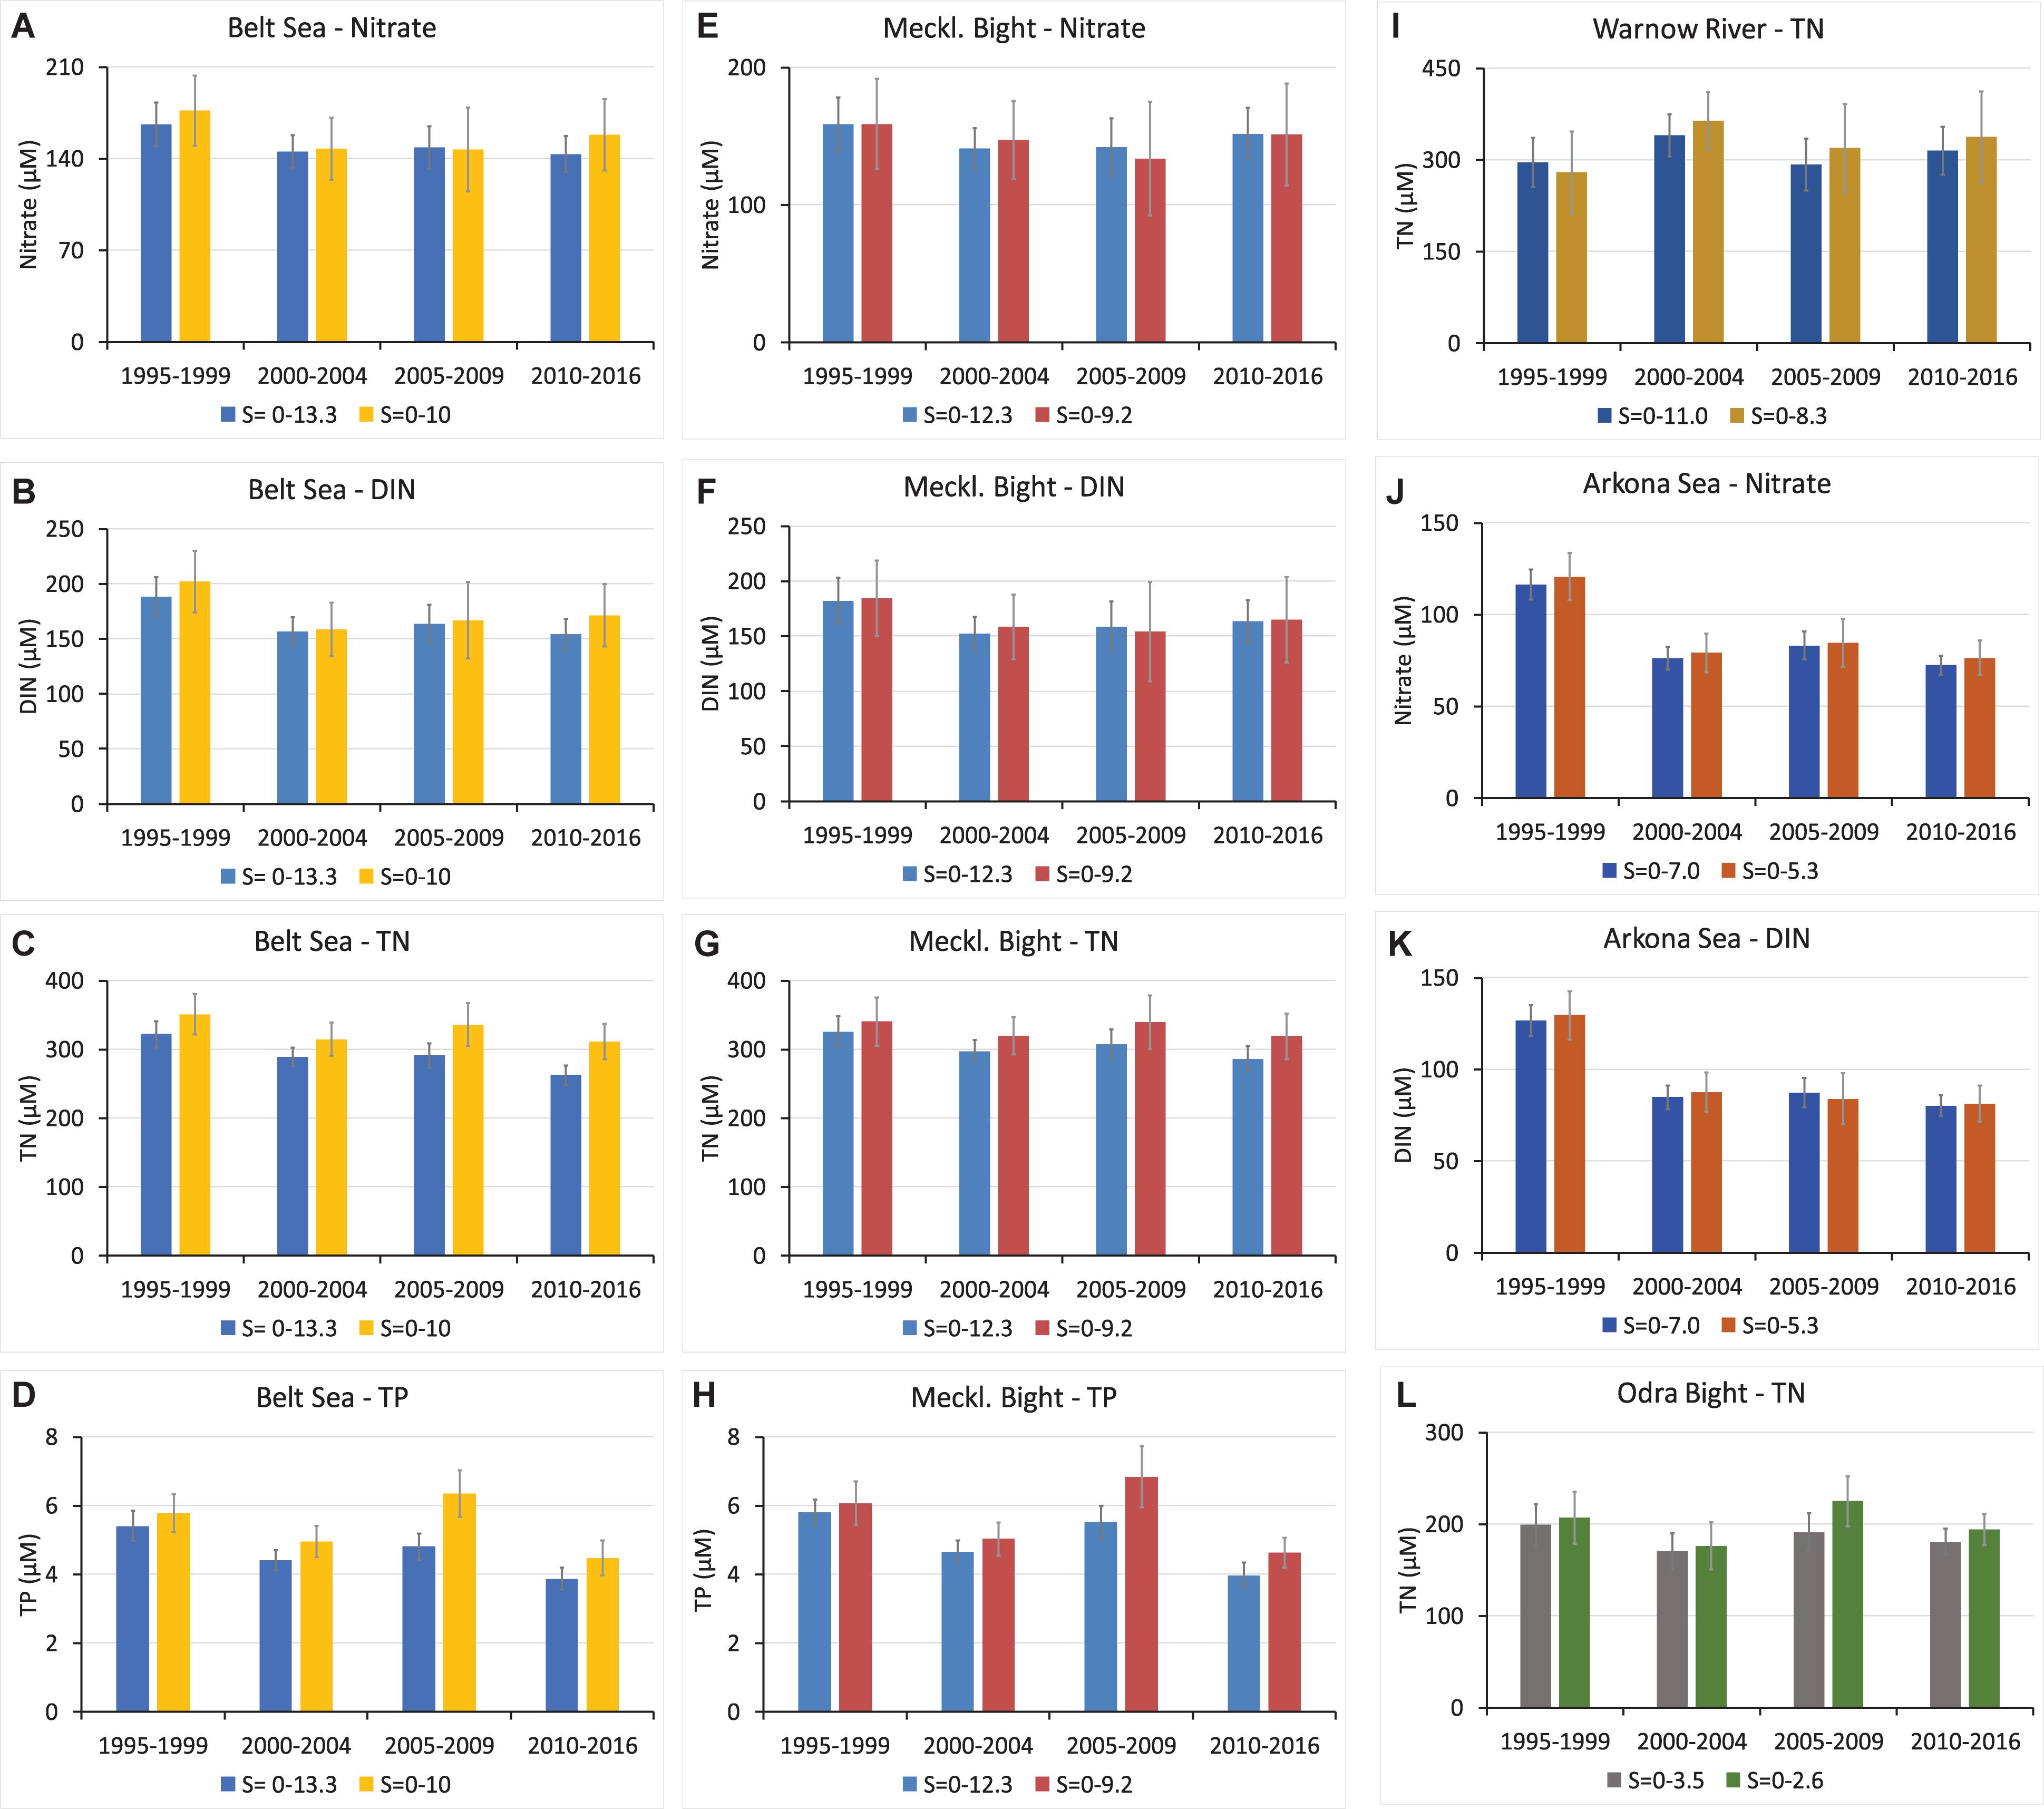
Figure 5. Comparison of the freshwater end-members of Figure 4 (left bars) for the Belt Sea: nitrate (A), DIN (B), TN (C), and TP (D), for the Mecklenburg Bight: nitrate (E), DIN (F), TN (G), and TP (H), for Warnow River TN (I), for Arkona Sea nitrate (J), and DIN (K), and for Odra Bight TN (L) with the results for the restricted salinity ranges (right bars, significant, >99%) as anindicator of changes of the respective parameter during transport to the open sea (see Table 2); the 95% confidence intervals are given as error bars.
For the TP end-members, the changes between the two salinity ranges were 7% (1995–1999), 11% (2000–2004), 24% (2005–2009), and 13% (2010–2016) for the Belt Sea area (Figure 5D), as well as 19% (2005–2009) and 15% (2010–2016) in the Mecklenburg Bight (Figure 5H) in the last decade of the study. This indicated strong removal processes for 2005–2009 in the Belt Sea and the Mecklenburg Bight transition zones, but in 2010–2016, the difference was less significant (>95%) for the Mecklenburg Bight. Also, the TP differences in the Mecklenburg Bight (Figure 5H) show difference of 19% for 2005–2009 and 15% for 2010–2016 for the two salinity ranges. The latter was however significant on the 95% level only.
Discussion
The central hypothesis of the study is that changes of nutrient supply by rivers and groundwater discharges to the sea should be visible in temporal changes of the nutrient–salinity relationships. Moreover, depending on the selected salinity range, removal or supply sources from river mouths to the open sea could be revealed.
The temporal evolution of the nutrient concentrations in open waters generally appears stable between 1995 and 2016 (Figure 2) with regard to the efforts undertaken to reduce nutrient supply to the Baltic Sea. However, using the nutrient–salinity relationships, a view from the open sea in direction to the freshwater source provides additional information.
The principal hydrographical difference between the southern coast, which is characterized by lagoons, and the western coast, showing bays and fjords seem to influence the outcome of the analysis. In bays and fjords, the transition area between freshwater and seawater is restricted to a relative small distance, whereas at the coast of Mecklenburg-Vorpommern, the transport occurs over a long distance (Lampe, 1994). The latter certainly enabled processes additional to conservative mixing compared with the more or less direct discharge at the western coast. This makes statistically robust nutrient–salinity correlations for the latter region less probable. Moreover, the freshwater supply by rivers is less important in the Kiel Bight compared with the Mecklenburg Bight because the Warnow and Trave Rivers account for more than 50% of the freshwater supply from the German drainage basin to the Belt Sea, whereas only about 12% is supplied to the Kiel Bight (BLANO, 2014). Likely, this is the reason that the Flensburg Fjord, the Eckernförde Bight, the Kiel Fjord and the Kiel Bight, and the Lübeck Bight did not show correlation that could be analyzed and interpreted between 1995 and 2016. An exception was the Schlei where the mixing of freshwater supplied by the Füsinger and Loiter Meadows with seawater also stretches along a few tens of kilometers. However, several areas have been identified, providing some insight into changes during the about 20 years’ time period of this study.
The end-member method revealed the hypothetical freshwater concentration but did not provide information about the load. The impact of nutrient end-member concentrations of certain regions could be seen by comparison with the next larger and a neighboring region and finally with the corresponding basin, Arkona Sea or Belt Sea. In some cases, the pattern of the end-member versus the time periods showed clear similarity for certain geographical regions and subregions, for example, for nitrate and DIN in the Greifswald Lagoon and the Arkona Sea (Figures 4B,F) and for TP in the Warnow River, the Mecklenburg Bight, and the Belt Sea (Figure 4J). The same is true for TP in the Greifswald Lagoon, the Odra Lagoon with Odra Bank area, and the Arkona Sea (Figure 4L). This finding indicates that these rivers and potential processes of the mixing zone have a dominant impact.
With caution, this end-member values could be compared with the target nutrient concentrations defined at the LMT point of 186 μM (2.6 mg/L) of TN (BLANO, 2014; LUNG, 2015) and river-type-specific targets of 3–5 μM (0.1–0.15 mg/L) of TP (BLANO, 2014). In the Arkona Sea, the Greifswald Lagoon, and the Odra Bight, hypothetical end-members were below the target values for the LMT since 2000, with the period 2005–2009 TN = 191 μM in the Odra Bight being slightly above the value (Table 1). Most areas showed end-member values equal or lower for the selected time periods, if we compare the TP end-members to TP = 5 μM as threshold value: Belt Sea (since 2000–2004), Mecklenburg Bight (in 2000–2004 and 2010–2016), Warnow River (since 1995–1999), Arkona Sea (in 1995–1999 and 2010–2016), Darss-Zingst Lagoon chain (2010–2016), Greifswald Lagoon (since 1995–1999), and Odra Lagoon with Odra Bight (in 1995–1999 and 2010–2016). The TP end-member values of the Warnow River (since 2005–2009) and the Greifswald Lagoon (since 2010–2016) would meet or were below the TP target value of 3 μM. This shows that the filter function in coastal zone is operating and indicates a sink for nitrogen compounds, likely by denitrification under the precondition of low oxygen. For phosphorous compounds, it can be assumed that removal means accumulation in sediments, piling up a legacy stock. However, these values are still clearly different to the pristine conditions of the rivers of the German Baltic Sea catchment that were estimated to be below ∼70 μM (∼1,000 μg/L) of TN and 1.6 μM (∼50 μg/L) of TP (Hirt et al., 2014).
Measured Nutrient Concentrations at the Limnic–Marine Transition Compared With the End-Members
The comparison (Table 1) of calculated end-member values with the measured values at the LMT for the respective nutrient parameter and areas could indicate a potential filter function of the coastal areas or possibly a source in the respective regions. So for most regions and nutrient parameters, the LMT values are about (40 ± 30)% higher. This already would suggest important nutrient removal processes. However, especially Rügen Lagoon chain and the slightly less strong Greifswald Lagoon chain reflect factors of 17 to 24, and 3 to 7, respectively, which are higher LMT values for nitrate and similarly for DIN compared with the end-member values. This indeed indicates a strong filter function for inorganic nitrogen compounds in those areas. In comparison with DIN, TN values obtained from the end-member approach were in reasonable agreement with LMT values. So for TN, the ratio LMT/end-member scatters around 1 (0.7–1.9) with the exception of the Greifswald Lagoon showing an average of 2.8, indicating a stronger removal process here.
For the Arkona Sea area, phosphate shows similar LMT and end-member values of ∼ 1.6 μM. Only for the last time interval 2010–2016 was an end-member found to be considerably lower, potentially indicating exceptional removal of phosphate during that time in the Arkona Sea area that, however, remains unexplained. For TP, the ratio LMT/end-member scatters around 1 (0.3–1.4) with an average of 0.8 (0.3 represents an exception), showing some agreement between the two methods. Moreover, 0.8 likely indicates slight TP contribution during passage of the coastal area from diffusive sources or sediments. The DIN/DIP ratio of the end-member approach and the LMT measurements is in reasonable agreement for the Belt Sea (0.5–1.4) as a whole. For the subregion Eckernförde Bight–Schlei, the end-member DIN/DIP ratio is up to one order of magnitude higher than the LMT value. This shows a shift to higher nitrogen/lower phosphorus values during transition to the open sea. The TN/TP ratio is about a magnitude higher for the end-member values compared with the LMT values for the Belt Sea region, the Mecklenburg Bight, and the Warnow River and a factor of 4 to 6 for the Greifswald Lagoon, indicating a strong shift to higher nitrogen and/or lower phosphorus values during mixing. This might be explained by a faster remineralization/redissolution of phosphorus from particulate material compared with nitrogen and subsequent removal to the sediment. Thereby, usually, no clear temporal change during the two decades is indicated, except for the Eckernförde Bight–Schlei area where the LMT values decrease slower than the end-member values for nitrate and DIN, showing an increasing importance of nitrogen removal processes there. A more drastic exception reflects the Warnow River. The measured values at LMT decline from about 80%, 90% (1995–1999) to 60%, 65% (2010–2016) for nitrate and DIN, respectively, of the end-member values indicate additional contributions of nitrogen compounds during mixing. Likely, this originates from diffusive fluxes or from sediments with an increasing tendency in the last 20 years.
An explicit judgment of the end-member values is difficult, because the end-members of the nutrient concentrations depend on the underlying salinity range. From Table 2, it is clear that the end-members increased at least by several percent and often more than 10% above the values of Table 1. The end-members likely would proceed to increase by further restriction of the salinity range but could not be analyzed because of a lack of significance. However, an increase of the end-member values from the broader to the narrower salinity interval indicates a significant loss during mixing and passage through the coastal zone. The loss could be permanent, as in the case of removal by, for example, denitrification or by sedimentation with subsequent burial. A retention or temporary loss is caused during uptake by algae or seagrass, which is followed by remineralization of matter (Asmala et al., 2017). An efficient long-term reduction would indicate a clear ecosystem service and might prove its relative health. However, the latter is certainly not the case during denitrification, which is accompanied by a strong oxygen deficiency. From the comparison of the end-members for the narrower and the wider salinity range, in some cases, also the opposite is seen, indicating a supply process during transport to the open sea. Potential mechanisms could be groundwater discharge or contact and remobilization with sediments or bottom waters, potentially enriched by legacy deposits. Nitrate and TN gain during mixing in the Warnow River between 1995–1999 and Mecklenburg Bight 2005–2009 may indicate re-dissolution from sediments or supply from other discharge sites in combination with a probably stressed ecosystem.
Conclusion
The Baltic Sea is naturally burdened by its special hydrography that seems to amplify disturbances. However, a responsible governance by HELCOM and the European Union (EU) led to an overall improvement in the ecosystem status of the Baltic Sea (Reusch et al., 2018), which is for the first time indicated on the basis of seawater nutrient concentrations in the western Baltic Sea. Thereby, the end-member approach does integrate the freshwater concentrations on the one hand, but on the other hand, it accounts for processes in the river/sea transition zone. However, it requires precise definition of the salinity range and the time intervals that are subjected to analysis to secure comparability. It appears that the extrapolated concentrations are mostly lower than measured freshwater values.
A strategy to further reduce anthropogenic nutrient supply requires atmospheric emission reduction of, for example, nitrogen oxides and ammonium compounds and a decline of the nutrient load from drainage areas. A principal approach to manage diffuse phosphorus sources emphasized low cost measures at the source for phosphorus reduction, conservation, and mitigation of losses (Macintosh et al., 2018). Otherwise, removing phosphorus from aquatic sinks and finally recovery of diffuse phosphorus would require increased expenses. Besides innovative technologies and food waste reduction, circular economy sustainability solutions include supporting local food supply chains with less waste, closing nutrient loops, pricing the true cost of resource consumption and losses in natural capital, and creating policy mechanisms to promote recovery and reduce loss of critical raw materials in particular (Jurgilevich et al., 2016). A compilation of measures from the German government include “Agricultural cooperation project on reducing direct inputs into coastal waters via drainage systems”; “Strengthening the assimilative capacity of estuaries, using the example of the River Ems,” “Promotion measures to reduce NOx inputs from shipping”; and “Supporting the designation of a Nitrogen Emission Control Area (NECA) in the North and Baltic Seas” (BMUB, 2016).
Author Contributions
The study was initiated by DS-B. Preliminary results were presented by JK, GN, MN, and DS-B at the 2nd Baltic Earth Conference in Helsingør, Denmark “Variability of nutrient concentrations in the western Baltic Sea between 1995 and 2017.” Data synthesis and analysis were done by JK, JW, GN, HL, and MW. JK wrote the draft version and synoptically implemented the revisions by CE, JW, MW, HL, GN, MN, JW, and DS-B. MN and JK prepared the graphics.
Conflict of Interest
The authors declare that the research was conducted in the absence of any commercial or financial relationships that could be construed as a potential conflict of interest.
Acknowledgments
We especially thank our colleagues at the nutrient labs of IOW (in the last years run by Birgit Sadkowiak and Lars Kreuzer) and the LLUR (by Gerda Rünger, Claudia Roschinski, Petra Schramm, and George Borchert) for their skillful and high-quality work. We also thank the staff involved in the sampling campaigns, as well as the people that maintain the long-term database of IOW and the MUDAB. We acknowledge the organization effort of chief scientists and the cooperation of the captain and the crews of many research vessels that have been involved in multiple monitoring campaigns. We are grateful to the Federal Maritime and Hydrographic Agency of Germany for funding of the HELCOM monitoring carried out by IOW.
References
Asmala, E., Carstensen, J., Conley, D. J., Slomp, C. P., Stadmark, J., and Voss, M. (2017). Efficiency of the coastal filter: Nitrogen and phosphorus removal in the Baltic Sea. Limnol. Oceanogr. 62, S222–S238. doi: 10.1002/lno.10644
BLANO (2014). Harmonisierte Hintergrund- und Orientierungswerte für Nährstoffe und Chlorophyll-a in den deutschen Küstengewässern der Ostsee sowie Zielfrachten und Zielkonzentrationen für die Einträge über die Gewässer. Bonn: Bund/Länder-Ausschuss Nord- und Ostsee (BLANO).
BMUB (2016). English Summary - MSFD Programme of Measures for Marine Protection in the German Parts of the North Sea and the Baltic Sea - Report pursuant to Article 45h(1) of the Federal Water Act. Bonn: Federal Ministry of the Environment, Nature Conservation, Construction and Nuclear Safety of Germany (BMUB).
Conley, D. J., Carstensen, J., Aigars, J., Axe, P., Bonsdorff, E., Eremina, T., et al. (2011). Hypoxia is increasing in the coastal zone of the Baltic Sea. Environ. Sci. Tech. 45, 6777–6783. doi: 10.1021/es201212r
German Environment Agency (2018). Meeresumwelt Datenbank - MUDAB (Data Base of the Marine Environment. Koblenz: The German Federal Institute of Hydrology - BfG.
Hansen, H. P., and Koroleff, F. (1999). “Determination of nutrients,” in Methods of Seawater Analysis, 3rd Edn, eds K. Grasshoff, K. Kremling, and M. Ehrhardt (Weinheim: Wiley-VCH), 159–228.
HELCOM (2004). “The fourth Baltic Sea pollution load compilation (PLC-4),” in Proceedings of the Baltic Sea Environment proceedings, (Helsinki: HELCOM).
HELCOM (2011). “The fifth Baltic Sea pollution load compilation (PLC-5),” in Baltic Proceedings of the Sea Environment proceedings, (Helsinki: HELCOM).
HELCOM (2018). Sources and pathways of nutrients to the Baltic Sea - HELCOM PLC-6. Helsinki: HELCOM.
Hirt, U., Mahnkopf, J., Gadegast, M., Czudowski, L., Mischke, U., Heidecke, C., et al. (2014). Reference conditions for rivers of the German Baltic Sea catchment: reconstructing nutrient regimes using the model MONERIS. Reg. Environ. Chang. 14, 1123–1138. doi: 10.1007/s10113-013-0559-7
Jurgilevich, A., Birge, T., Kentala-Lehtonen, J., Korhonen-Kurki, K., Pietikäinen, J., Saikku, L., et al. (2016). Transition towards circular economy in the food system. Sustainability 8:69. doi: 10.3390/su8010069
Korpinen, S., Honkanen, T., Vesakoski, O., Hemmi, A., Koivikko, R., Loponen, J., et al. (2007). Macroalgal communities face the challenge of changing biotic interactions: review with focus on the Baltic Sea. AMBIO 36, 203–211. doi: 10.1579/0044-7447(2007)36[203:mcftco]2.0.co;2
Lampe, R. (1994). Die vorpommerschen Boddengewässer - Hydrographie, Bodenablagerungen und Küstendynamik. Die Küste 56, 25–49.
Lass, H. U., Mohrholz, V., and Seifert, T. (2005). On pathways and residence time of saltwater plumes in the Arkona sea. J. Geophys. Res. 110, 1–24. doi: 10.1029/2004JC002848
Leibniz Institute for Baltic Sea Research Warnemünde (2014). IOWDB - the oceanographic data base of IOW. Warnemünde: Leibniz Institute for Baltic Sea Research Warnemünde.
LUNG (2015). Aktualisierung des Maßnahmenprogramms nach §82 WHG bzw. Artikel 11 der Richtlinie 2000/60/EG für die Flussgebietseinheit Warnow/Peene für den Zeitraum von 2016 bis 2021. Güstrow: Landesamt für Umwelt, Naturschutz und Geologie Mecklenburg-Vorpommern.
Macintosh, K. A., Mayer, B. K., McDowell, R. W., Powers, S. M., Baker, L. A., Boyer, T. H., et al. (2018). Managing diffuse phosphorus at the source versus at the sink. Environ. Sci. Tech. 52, 11995–12009. doi: 10.1021/acs.est.8b01143
Majaneva, M., Rintala, J.-M., Hajdu, S., Hällfors, S., Hällfors, G., Skjevik, A.-T., et al. (2012). The extensive bloom of alternate-stage Prymnesium polylepis (Haptophyta) in the Baltic Sea during autumn–spring 2007–2008. Eur. J. Phycol. 47, 310–320. doi: 10.1080/09670262.2012.713997
McGlathery, K. J., Sundbäck, K., and Anderson, I. C. (2007). Eutrophication in shallow coastal bays and lagoons: the role of plants in the coastal filter. Mar. Ecol. Prog. Ser. 348, 1–18. doi: 10.3354/meps07132
Nausch, G., Bachor, A., Petenati, T., Voss, J., and Weber, M. (2011). Nährstoffe in den deutschen Küstengewässern der Ostsee und angrenzenden Seegebieten. Meeresumwelt Aktuell Nord- und Ostsee 1, 1–16.
Nausch, G., Nehring, D., and Nagel, K. (2008). “Nutrient concentrations, trends and their relation to eutrophication,” in State and Evolution of the Baltic Sea, 1952-2005, eds R. Feistel, G. Nausch, and N. Wasmund (Hoboken, NJ: John Wiley & Sons, Inc), 337–366.
Newton, A., Icely, J., Cristina, S., Brito, A., Cardoso, A. C., Colijn, F., et al. (2014). An overview of ecological status, vulnerability and future perspectives of European large shallow, semi-enclosed coastal systems, lagoons and transitional waters. Estuar. Coast. Shelf Sci. 140, 95–122. doi: 10.1016/j.ecss.2013.05.023
Officer, C. B. (1979). Discussion of the behaviour of nonconservative dissolved constituents in estuaries. Estuar. Coast. Mar. Sci. 9, 91–94. doi: 10.1016/0302-3524(79)90009-4
Redfield, A. C., Ketchum, B. H., and Richards, F. A. (1963). “The influence of organisms on the composition of sea water,” in The Sea, ed. M. N. Hill (New York, NY: J. Wiley), 26–77.
Reissmann, J. H., Burchard, H., Feistel, R., Hagen, E., Lass, H. U., Mohrholz, V., et al. (2009). Vertical mixing in the Baltic Sea and consequences for eutrophication – A review. Prog. Oceanogr. 82, 47–80. doi: 10.1016/j.pocean.2007.10.004
Reusch, T. B. H., Dierking, J., Andersson, H. C., Bonsdorff, E., Carstensen, J., Casini, M., et al. (2018). The Baltic Sea as a time machine for the future coastal ocean. Sci. Adv. 4:eaar8195. doi: 10.1126/sciadv.aar8195
Rieper, M. (1976). Investigations on the relationships between algal blooms and bacterial populations in the Schlei Fjord (western Baltic Sea). Helgoländer Wissenschaftliche Meeresuntersuchungen 28, 1–18. doi: 10.1007/BF01610792
Keywords: nutrients, eutrophication, salinity gradient, coastal waters, freshwater end-member, limnic–marine transition, western Baltic Sea, coastal filter
Citation: Kuss J, Nausch G, Engelke C, Weber M, Lutterbeck H, Naumann M, Waniek JJ and Schulz-Bull DE (2020) Changes of Nutrient Concentrations in the Western Baltic Sea in the Transition Between Inner Coastal Waters and the Central Basins: Time Series From 1995 to 2016 With Source Analysis. Front. Earth Sci. 8:106. doi: 10.3389/feart.2020.00106
Received: 03 December 2018; Accepted: 24 March 2020;
Published: 05 May 2020.
Edited by:
Hayley Jane Fowler, Newcastle University, United KingdomReviewed by:
Justus Van Beusekom, Helmholtz Centre for Materials and Coastal Research (HZG), GermanyMarcus Reckermann, Helmholtz Centre for Materials and Coastal Research (HZG), Germany
Copyright © 2020 Kuss, Nausch, Engelke, Weber, Lutterbeck, Naumann, Waniek and Schulz-Bull. This is an open-access article distributed under the terms of the Creative Commons Attribution License (CC BY). The use, distribution or reproduction in other forums is permitted, provided the original author(s) and the copyright owner(s) are credited and that the original publication in this journal is cited, in accordance with accepted academic practice. No use, distribution or reproduction is permitted which does not comply with these terms.
*Correspondence: Joachim Kuss, joachim.kuss@io-warnemuende.de; Clemens Engelke, Clemens.Engelke@lung.mv-regierung.de