Article

Torrefaction of Straw from Oats and Maize for Use as a Fuel and Additive to Organic Fertilizers—TGA Analysis, Kinetics as Products for Agricultural Purposes

1
Faculty of Process and Environmental Engineering, Lodz University of Technology, Wolczanska 213, 90-924 Lodz, Poland
2
Faculty of Economics and Management, University of Zielona Góra, ul. Licealna 9, 65-246 Zielona Góra, Poland
3
Faculty of Biology and Environmental Science, University of Kardynal Stefan Wyszyński, Dewajtis 5, 01-815 Warszawa, Poland
4
Chemical Faculty, University of Lodz, Tamka 13, 91-403 Lodz, Poland
5
Faculty of Energy and Fuels, AGH University of Science and Technology, al. Mickiewicza 30, 30-059 Krakow, Poland
*
Author to whom correspondence should be addressed.
Energies 2020, 13(8), 2064; https://doi.org/10.3390/en13082064
Submission received: 14 February 2020 / Revised: 10 April 2020 / Accepted: 11 April 2020 / Published: 21 April 2020

Abstract

:
This publication presents research work which contains the optimum parameters of the agri-biomass: maize and oat straws torrefaction process. Parameters which are the most important for the torrefaction process and its products are temperature and residence time. Thermogravimetric analysis was performed as well as the torrefaction process using an electrical furnace on a laboratory scale at a temperature between 250–525 °C. These biomass torrefaction process parameters—residence time and temperature—were necessary to perform the design and construction of semi-pilot scale biomass torrefaction installations with a regimental dryer and a woody and agri-biomass regimental torrefaction reactor to perform a continuous torrefaction process using superheated steam. In the design installation the authors also focused on biochar, a bi-product of biofuel which will be used as an additive for natural bio-fertilizers. Kinetic analysis of torrefaction process using maize and oat straws was performed using NETZSCH Neo Kinetics software. It was found that kinetic analysis methods conducted with multiple heating rate experiments were much more efficient than the use of a single heating rate. The best representations of the experimental data for the straw from maize straw were found for the n-order reaction model. A thermogravimetric analysis, TG-MS analysis and VOC analysis combined with electrical furnace installation were performed on the maize and oat straw torrefaction process. The new approach in the work presented is different from that of current scientific achievements due to the fact that until now researchers have worked on performing processes on oat and maize straws by means of the torrefaction process for the production of a biochar as an additive for natural bio-fertilizers. None of them looked for economically reasonable mass loss ratios. In this work the authors made the assumption that a mass loss in the area of 45–50% is the most reasonable loss for the two mentioned agri-biomass processes. On this basis, a semi-pilot installation could be produced in a further BIOCARBON project step. The kinetic parameters which were calculated will be used to estimate the size of the apparatuses, the biomass dryer, and biomass torrefaction reactor.

1. Introduction

Worldwide, big agriculture, agri-food processing and individual farmers produce a very large amount of agri-waste each year. Taking into account straw, husks plus other various types of husk and shell, and also biomass from energy crops, it accounts for 50 billion metric tons per year. The mass of straw collected in Poland is estimated at 25–33 million Mg per year [1]. A huge amount of oats and maize waste is produced annually, as maize is one of the most common staple crops worldwide. Little research [2,3,4] has been carried out on the handling or reuse of oats and maize waste as biomass. The latter two biomasses are converted through processes such as drying and roasting to homogenize their physicochemical properties. In this research, the torrefaction process of the most available and quite low-cost effective feedstock, oats and maize waste, was carried out in a thermogravimetric analyzer and laboratory scale furnace in the presence of nitrogen, argon, and CO2 gas. Other methods to treat oat and maize straw are conversion to bioethanol and to a natural fertilizer using bio-treatment methods [5]. Nevertheless, those conversion techniques generate a large amount of waste [6]. In effect the soil is acidic, poor, and usually has a yellowish color grubbing up and clearing the forest quickly: most cultivated plants quickly deteriorate on it [7]. Biochar as an additive for fertilizer has a high utility potential in agriculture [8], as a base for natural dedicated fertilizers for horticulture and greenhouse cultivation and for large-scale agriculture. In addition to litter and fodder in industrial breeding of poultry and animals, it is a liquid manure absorber and dynamic of manure composter. Its use will respond to market needs related to improving soil properties, limiting the use of mineral fertilizers and plant protection chemicals and carbon sequestration in soil. The effects of soil biochar application include PH regulation, improvement of soil water properties and soil thermal properties, better use of fertilizers by plants, reduction of water pollution, positive impact on growth and yield of plants, impact on increasing activity of microorganisms, better soil (process improvement soil-forming), long-lasting effects, carbon dioxide (CO2) sequestration, impact on mitigation of climate change, increase of the organic content in soil, increase of soil moisture, and impact on increasing the mass and quality of the system root. The application of biochar in 2014 contributed to an increase in root colonization by mycorrhizal fungi; vegetable growth; and yield of apple, peach, and nectarine trees in 2015. The application of biochar also contributed to an increase in the water status of soil and plants [7]. Biochar, due to its properties, is also an excellent structuring additive for composting: it improves the air and water conditions of the process [9]. It significantly reduces ammonia emissions, thus reducing nitrogen losses and improving the quality of the fertilizer received. It reduces gas emissions. Using biochar in soil aids retention, thermal properties, and gas. Biochar, thanks to its ionic capacity, promotes better use of fertilizers by plants and reduces the amount of pollution outflow [10]. The global biocoal market size was estimated at 283.2 Gg in 2015. The worldwide increase of consumption of bio-organic food and the capacity of biochar to increase soil fertility and plant growth is expected to be a most important factor moving market growth. The global market is composed of regimented and unregimented producers of biocoal. In China, Brazil, Japan, and Mexico large amounts of production come from the unregimented sector. The global biocoal market is expected to reach USD 3.14 billion by 2025. According to the European Biochar Foundation, the volume of biocoal production in Europe at the end of 2014 was over 9000 Mg per year. This is constantly increasing, which, taking into consideration the slow pyrolysis (30% output of biocoal from feed), gives an annual volume of biomass of 30,000 Mg, and with fast pyrolysis up to approx. 100,000 Mg per year. The European biocoal market is predicted to increase its revenue from $193 million to $875 million in the period 2017 to 2025, growing at an estimated compound annual growth rate (CAGR) of 17.70%. Currently, the entire production of certified biocoal in Europe is carried out in seven industrial lines located in four countries: Germany, Austria, Switzerland, and the United Kingdom. It is estimated that the volume of biocoal production in Europe is even higher due to the large number of local, small installations (perhaps more than 100). The development of the biochar market in Poland will be driven by the demand not only for biocoal as a product but primarily for the products manufactured by its use [11]. Straw from maize and oats are used in Poland for fertilizing fields. After deduction of the needs for litter and feed, as well as the amount needed for plowing, there are overflows for different use. The volume of extra production of straw according to different sources is approx. 8–13 million Mg annually [12,13]. One solution for this situation is to use straw overflows in the energy and power sector. The heating value of straw ranges from 14.3 to 15.2 MJ/kg. In terms of energy, 1.5 Mg of straw are equivalent to about one Mg of coal [14,15,16]. The mass of straw that can be combusted as a solid biofuel in the energy sector is equal to a calorific value of approx. 14 million Mg of coal, which is 10% of annual coal mining production in Poland. The limit in the widespread use of straw in the energy and power sector is its dispersed diversification of physicochemical properties [1,17,18,19,20]. Another very important factor is that straw is a volumetric material, which has an impact on logistic costs such as transport and storage [21,22,23]. The implementation of the European Commission’s policy on sustainable development, the reduction of natural resources, the development and application of waste-efficient technologies, and the development of new biodegradable and environmentally friendly products is driving the growth of this market.

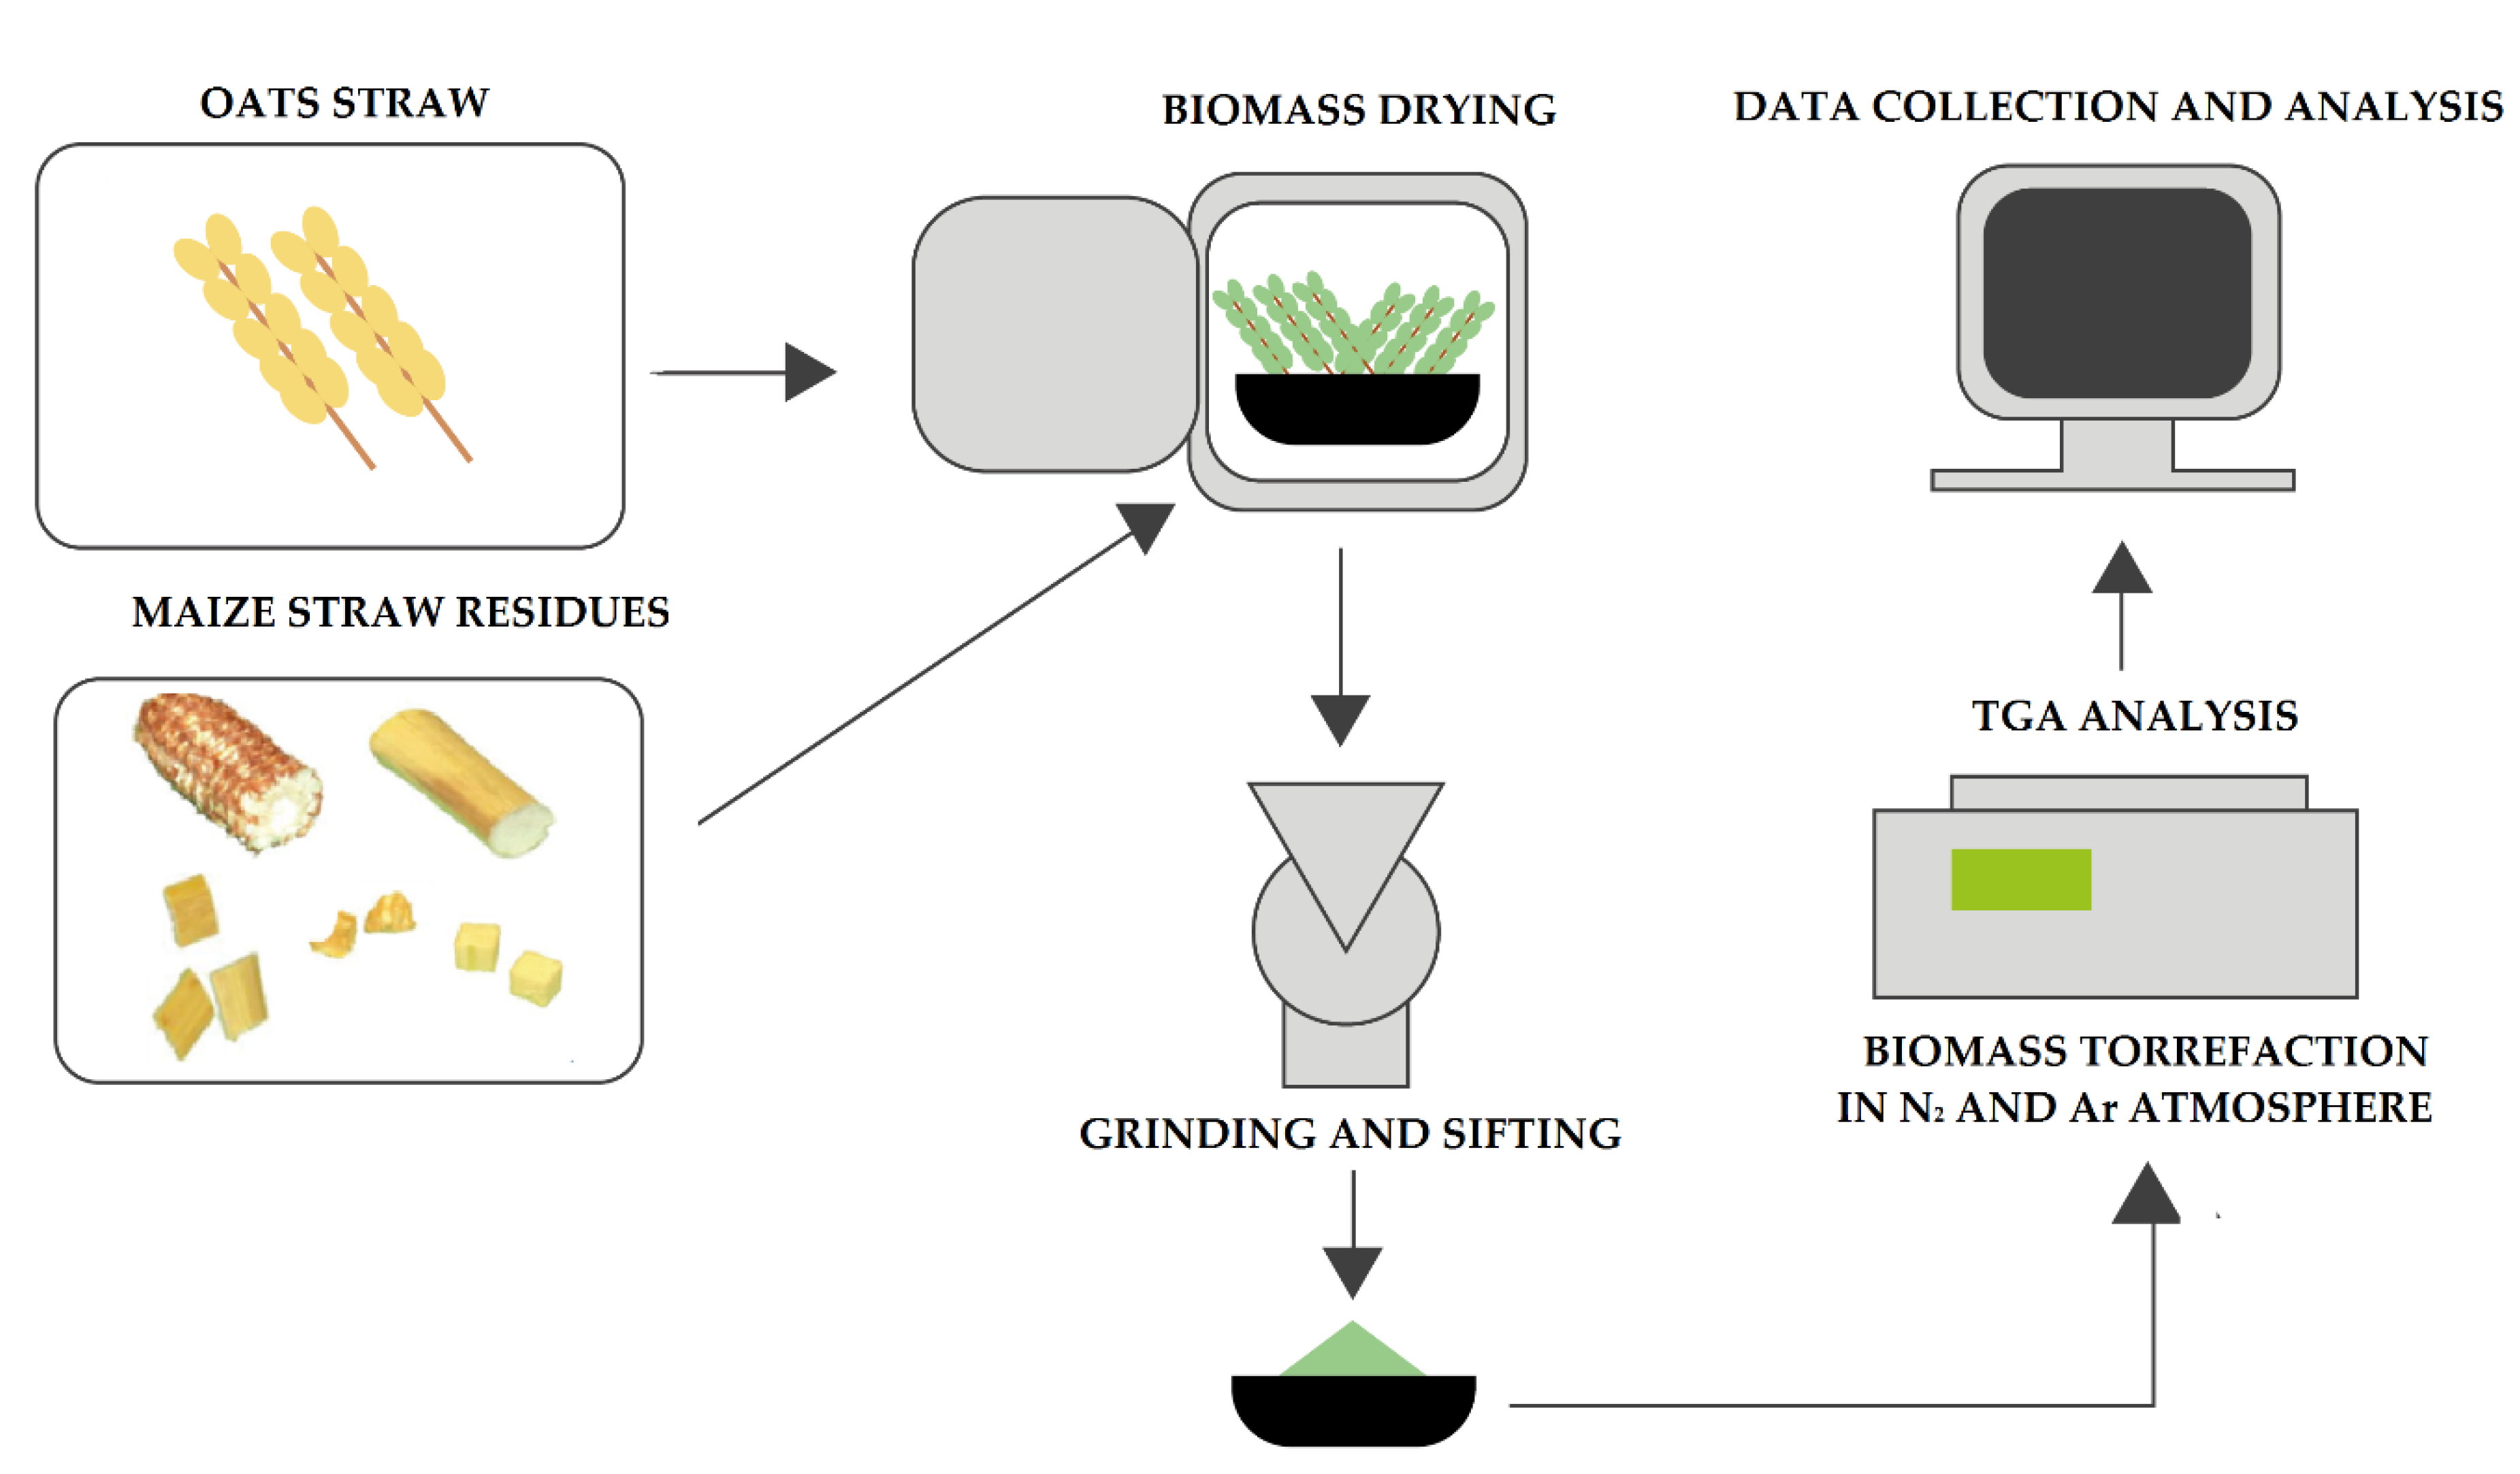
2. Materials and Methods

2.1. Methods

The experimental work focused on two types of agri-biomass: straw from oats and straw from maize. Thermogravimetric analysis (TGA) was used to estimate the weight loss kinetics of carbonized maize and oat straw before the design of a semi-scale set-up where a continuous working dryer and biomass torrefaction reactor. In this work, a TG 209 Tarsus Netzsch TGA was used to perform the torrefaction process. Installation with a regimental biomass dryer and regimental reactor feed with steam will be designed in the next stage to achieve the optimal mass loss to energy loss ratio (to obtain the highest energy density). The biomass torrefaction process was done using a specifically designed set-up with a TGA analyzer for torrefaction process in inert nitrogen atmosphere—Figure 1.
Agri-biomasses were subjected to analysis in accordance with ISO standard [24,25,26,27]. A proximate and ultimate analysis were also done after the torrefaction process. High heating values (HHVs) of the maize and oat straw after the torrefaction process were estimated in accordance with ISO standard [28]. The HHVs were determined using a bomb calorimeter (Parr Instrument Co., Model 1672, Moline, IL, USA). C, H, N, S, and O estimation analysis of the untreated biomass and torrefied samples was performed using an elemental analyzer.

2.2. Thermal Gravimetric Analysis and Kinetics

The thermogravimetric analysis (TGA) of the oats and maize straw torrefaction was done using 10 mg samples. To get an inert atmosphere, nitrogen was injected with a flow rate of 20 mL/min. The samples of oats and maize straws were placed inside the TGA analyzer furnace. The laboratory set-up with electrical furnace and TOC analyzer was calibrated with a precise (0.01 g resolution) electronic balance for the estimation of the mass drop during the process. The parameters (temperature and sample mass) were recorded using PC. For TG-MS analysis a thermogravimetric Luxx 409 PG Netzsch, coupled with a mass spectrometer QMS 403D Aeolos Netzsch were used. The tests were carried out in an argon atmosphere at 25 mL/min. Due to the need to stabilize the weight with a water jacket, the initial temperature of the 40 °C content was set. The weight of the biomass samples for the torrefaction process using TG-MS analysis was 5.0 mg. The samples were placed in 6 mm diameter Al2O3 crucibles.
The kinetics were determined using special NETZSCH Kinetics Neo software. Software allowed us to obtain reaction kinetics or chemical kinetics. This measures the rates of chemical processes and helps to determine reaction rates. It also takes the factors that control these rates into consideration. Information related to those points can give deep insights into the detailed molecular mechanisms behind elementary reactions. The above software is used to analyze chemical processes. NETZSCH Kinetics Neo software allows for the analysis of the biomass torrefaction process and other temperature-dependent processes. One result of such an analysis is a kinetics model which correctly corresponds to the nature of experimental data under varied temperature conditions [29]. Use of the kinetic model helps to predict a chemical system’s behavior under user-defined temperature conditions [30]. Alternatively, this kind of model could be used for process optimization.

2.3. Composition of Total Organic Carbon

The value of the pollutant emission index (VOC) Wz (in mg of the pollutant tested per 1 g of fuel burned) was calculated on the basis of the relationship
w z = Q · c a v r · τ m p
where: Q   —air flow rate (m3/s),
m p —sample mass (mg),
τ —sample torrefaction time (s),
c a v r —average concentration of pollutants (mg/m3), calculated from the dependencies :
c a v r = 1 τ 0 t c ( τ ) d t

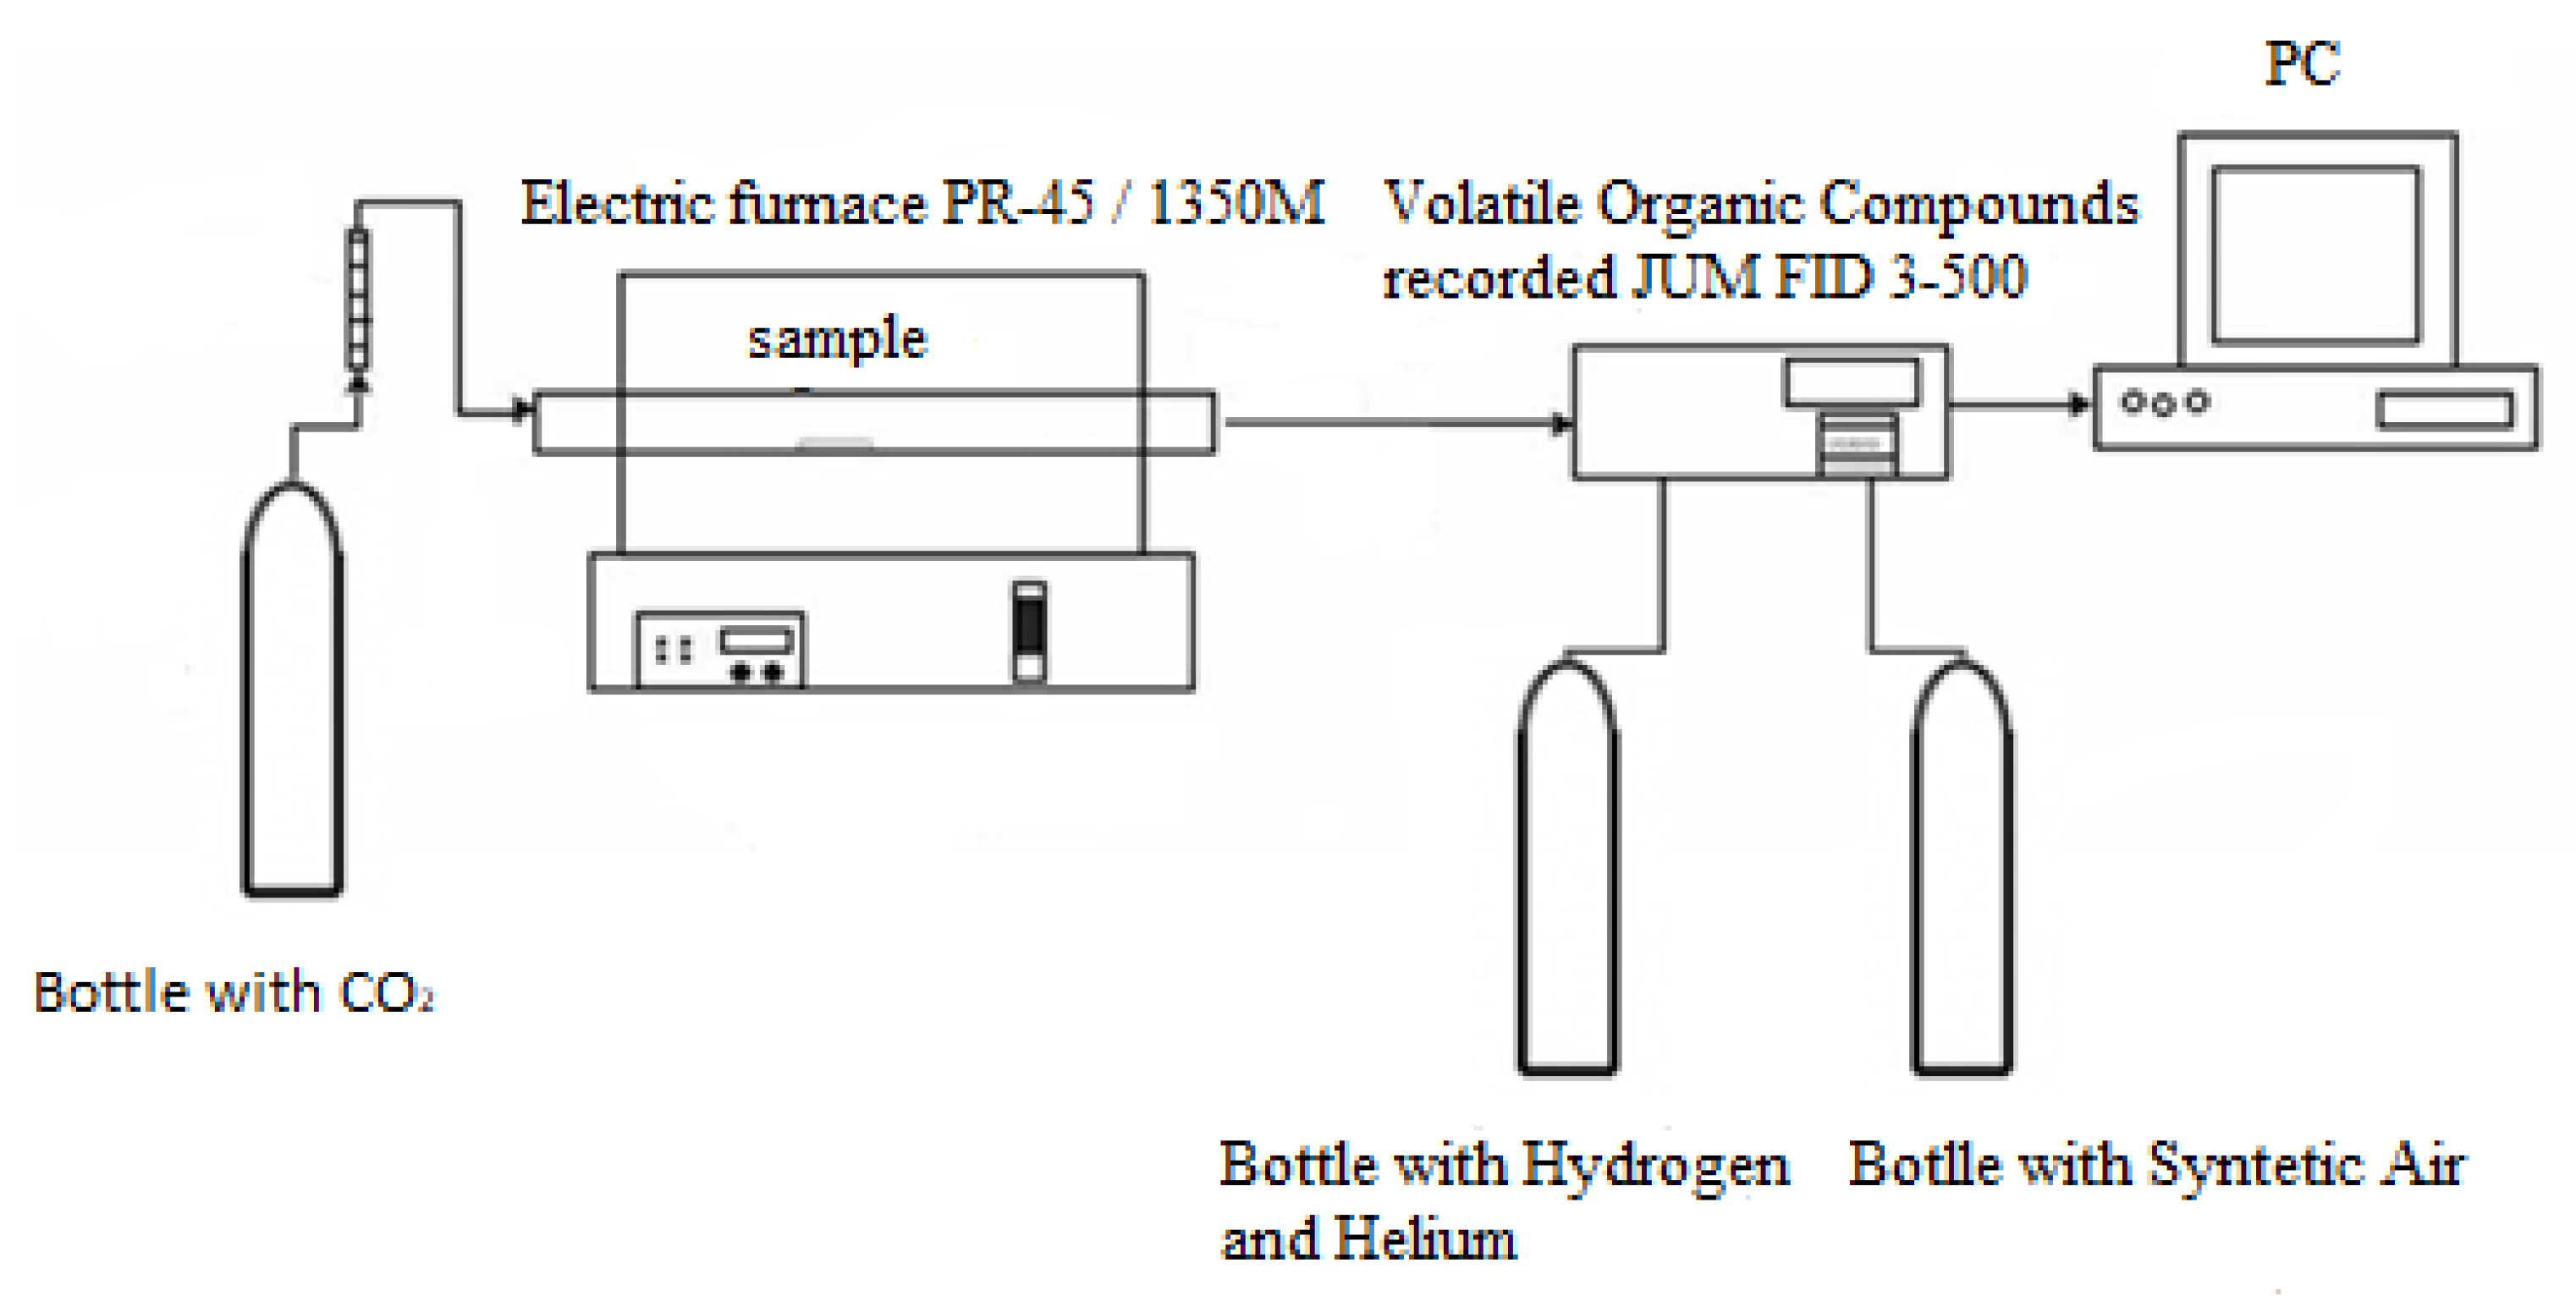
3. Experimental Procedure and Device

The samples were dried so as to have homogeneous experimental conditions in an electrical oven for 4 h at 110 °C. In the experiment, each sample was processed using 2 g of sample under atmospheric pressure. In this work, a horizontal tubular reactor with a length of 600 mm and an internal diameter of 150 mm was used to perform the biomass torrefaction process, as schematically shown in Figure 2. A specific amount of biomass sample was weighed and placed in a crucible. Carbon dioxide flushing was done until the concentration of oxygen in the electrical furnace reactor was less than 1%. After flushing the reactor with CO2 (2 L/min) the temperatures of the electrical oven chamber were increased to different temperatures set between 250 and 350 °C at a constant heating rate of 10 °C/min. After the torrefaction temperature reached the necessary experimental conditions, the heating reactor was stopped, and the inert gas was shut down. The torrefied biomass sample was then instantly removed and was weighed. The tests for the biomass torrefaction holding time were done at various holding times from 0 min to 50 min for 250, 300, 350 and 525 °C. In this experiment, the residence time in the biomass torrefaction process means the holding time after reaching a certain temperature [2,31].
The torrefaction process was conducted in a resistance electric oven PR-45/1350M in a carbon dioxide atmosphere. A previously dried sample weighing 2–2.5 g was placed on a quartz glass boat, which was put into an oven heated to the appropriate temperature for 1 h. The analysis was carried out at the following temperatures: 225, 250, 275, 300, and 525 °C. The carbon dioxide flow was 1 L/min. During this time, the emission of the sum of volatile organic compounds recorded in the JUM FID 3-500 stationary analyzer was measured. The frequency of VOC reading was 10 s. Three repetitions were performed for each temperature value. After the torrefaction process, the sample was weighed again to determine mass loss.

4. Results and Discussion
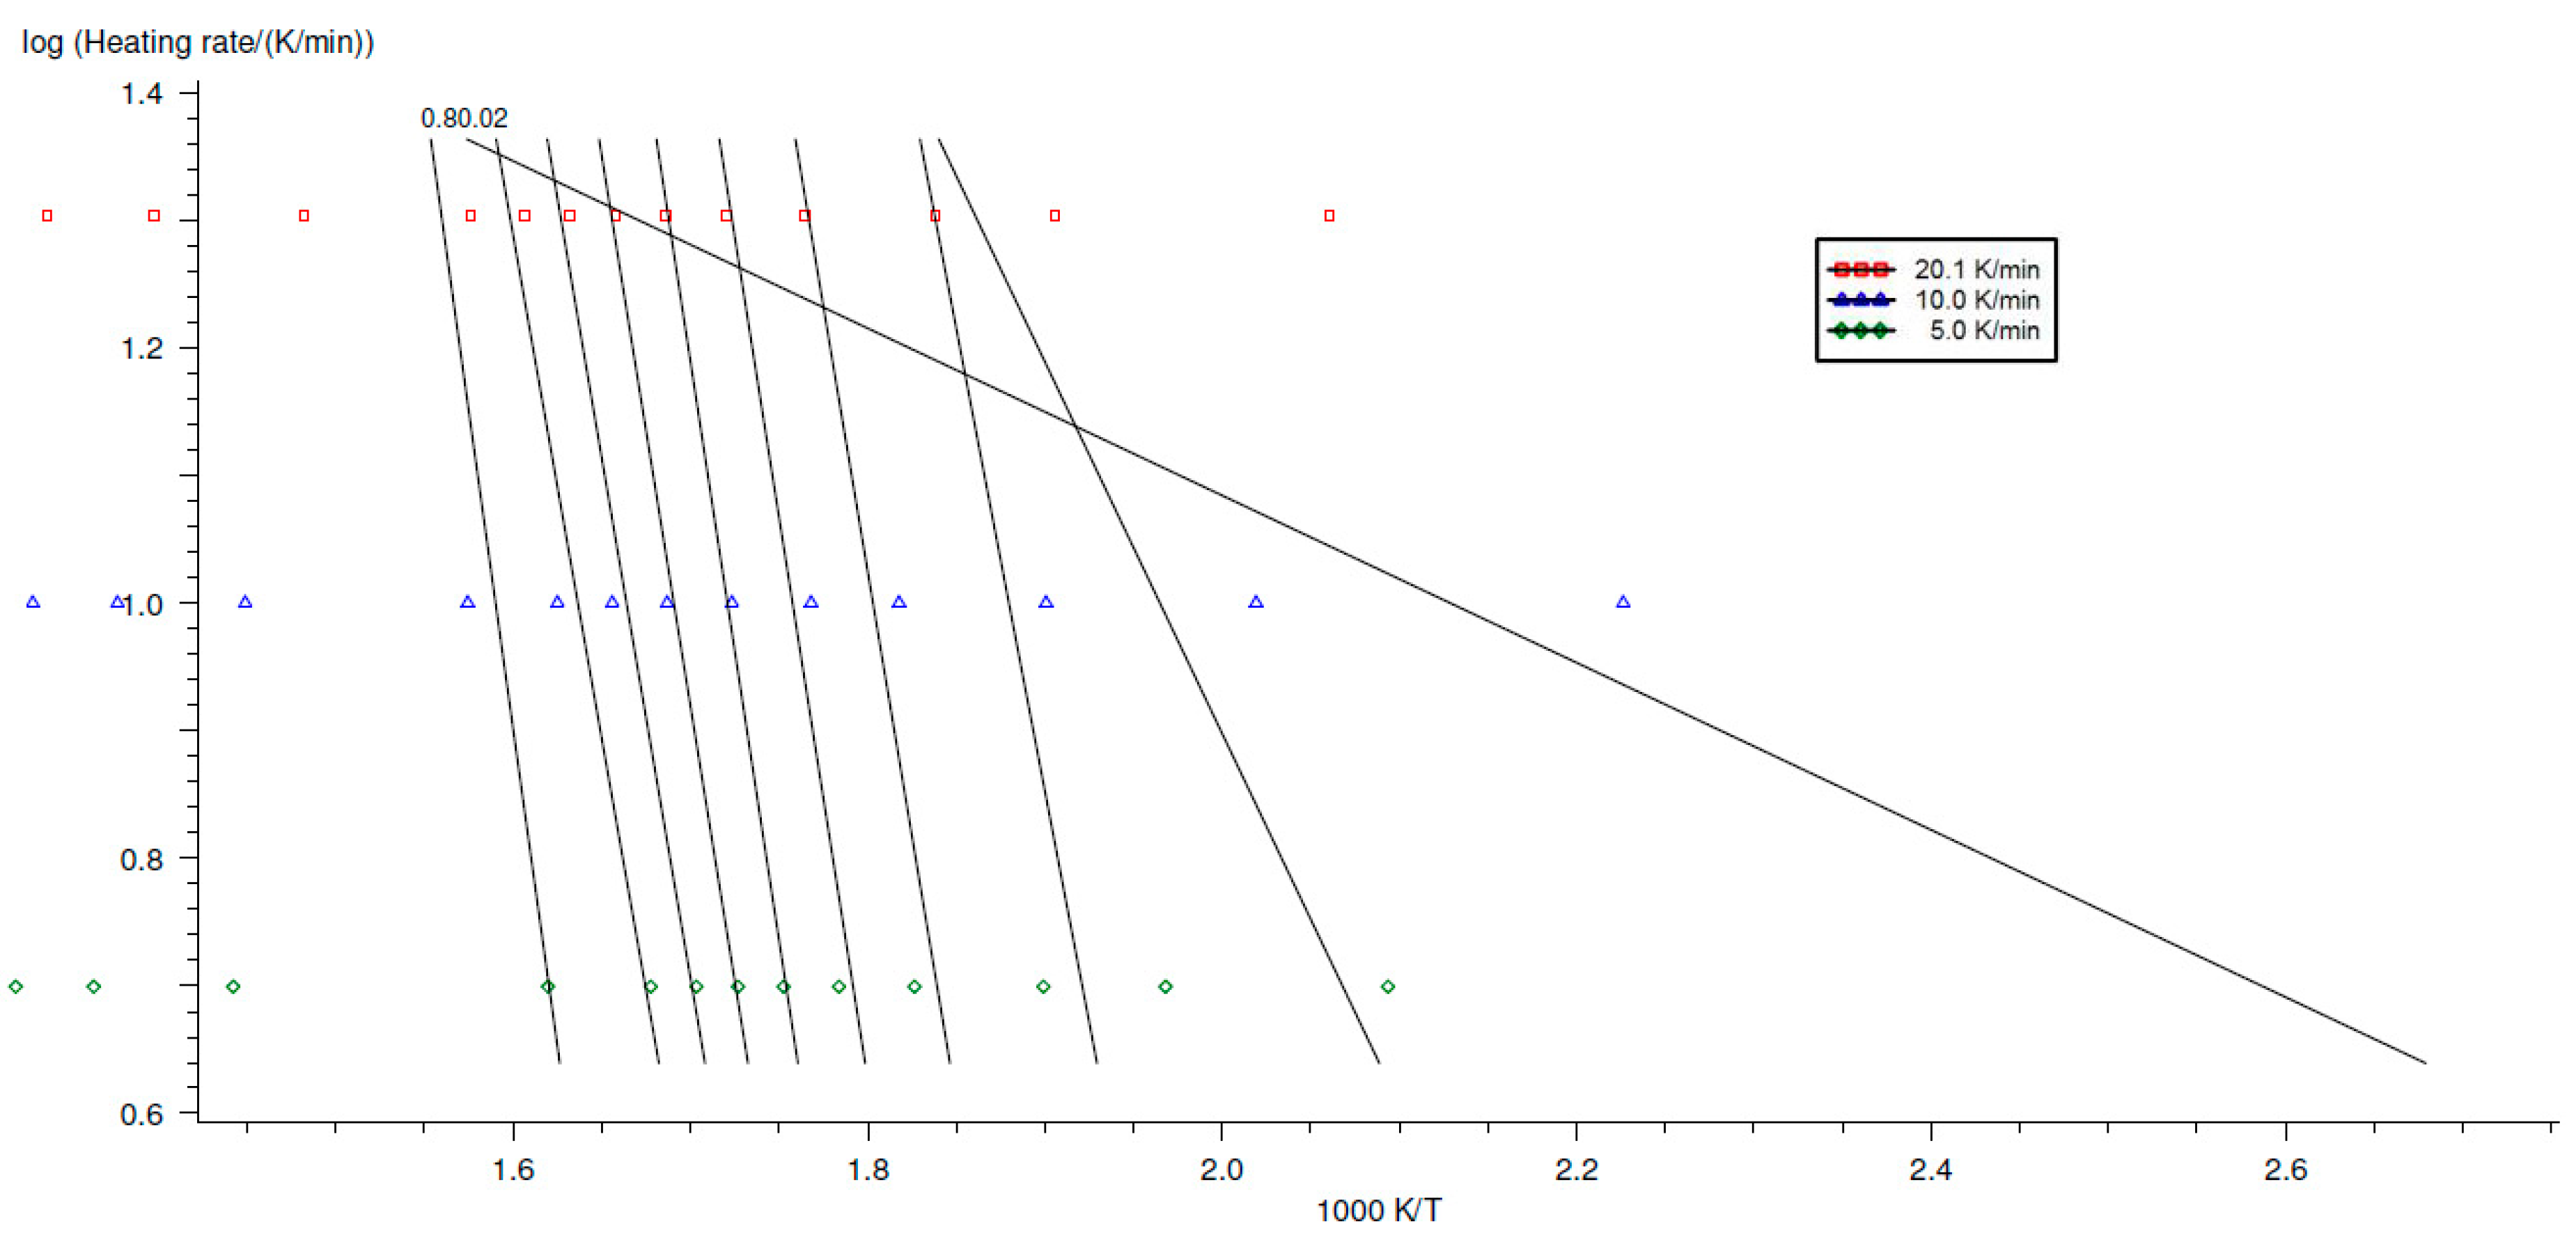
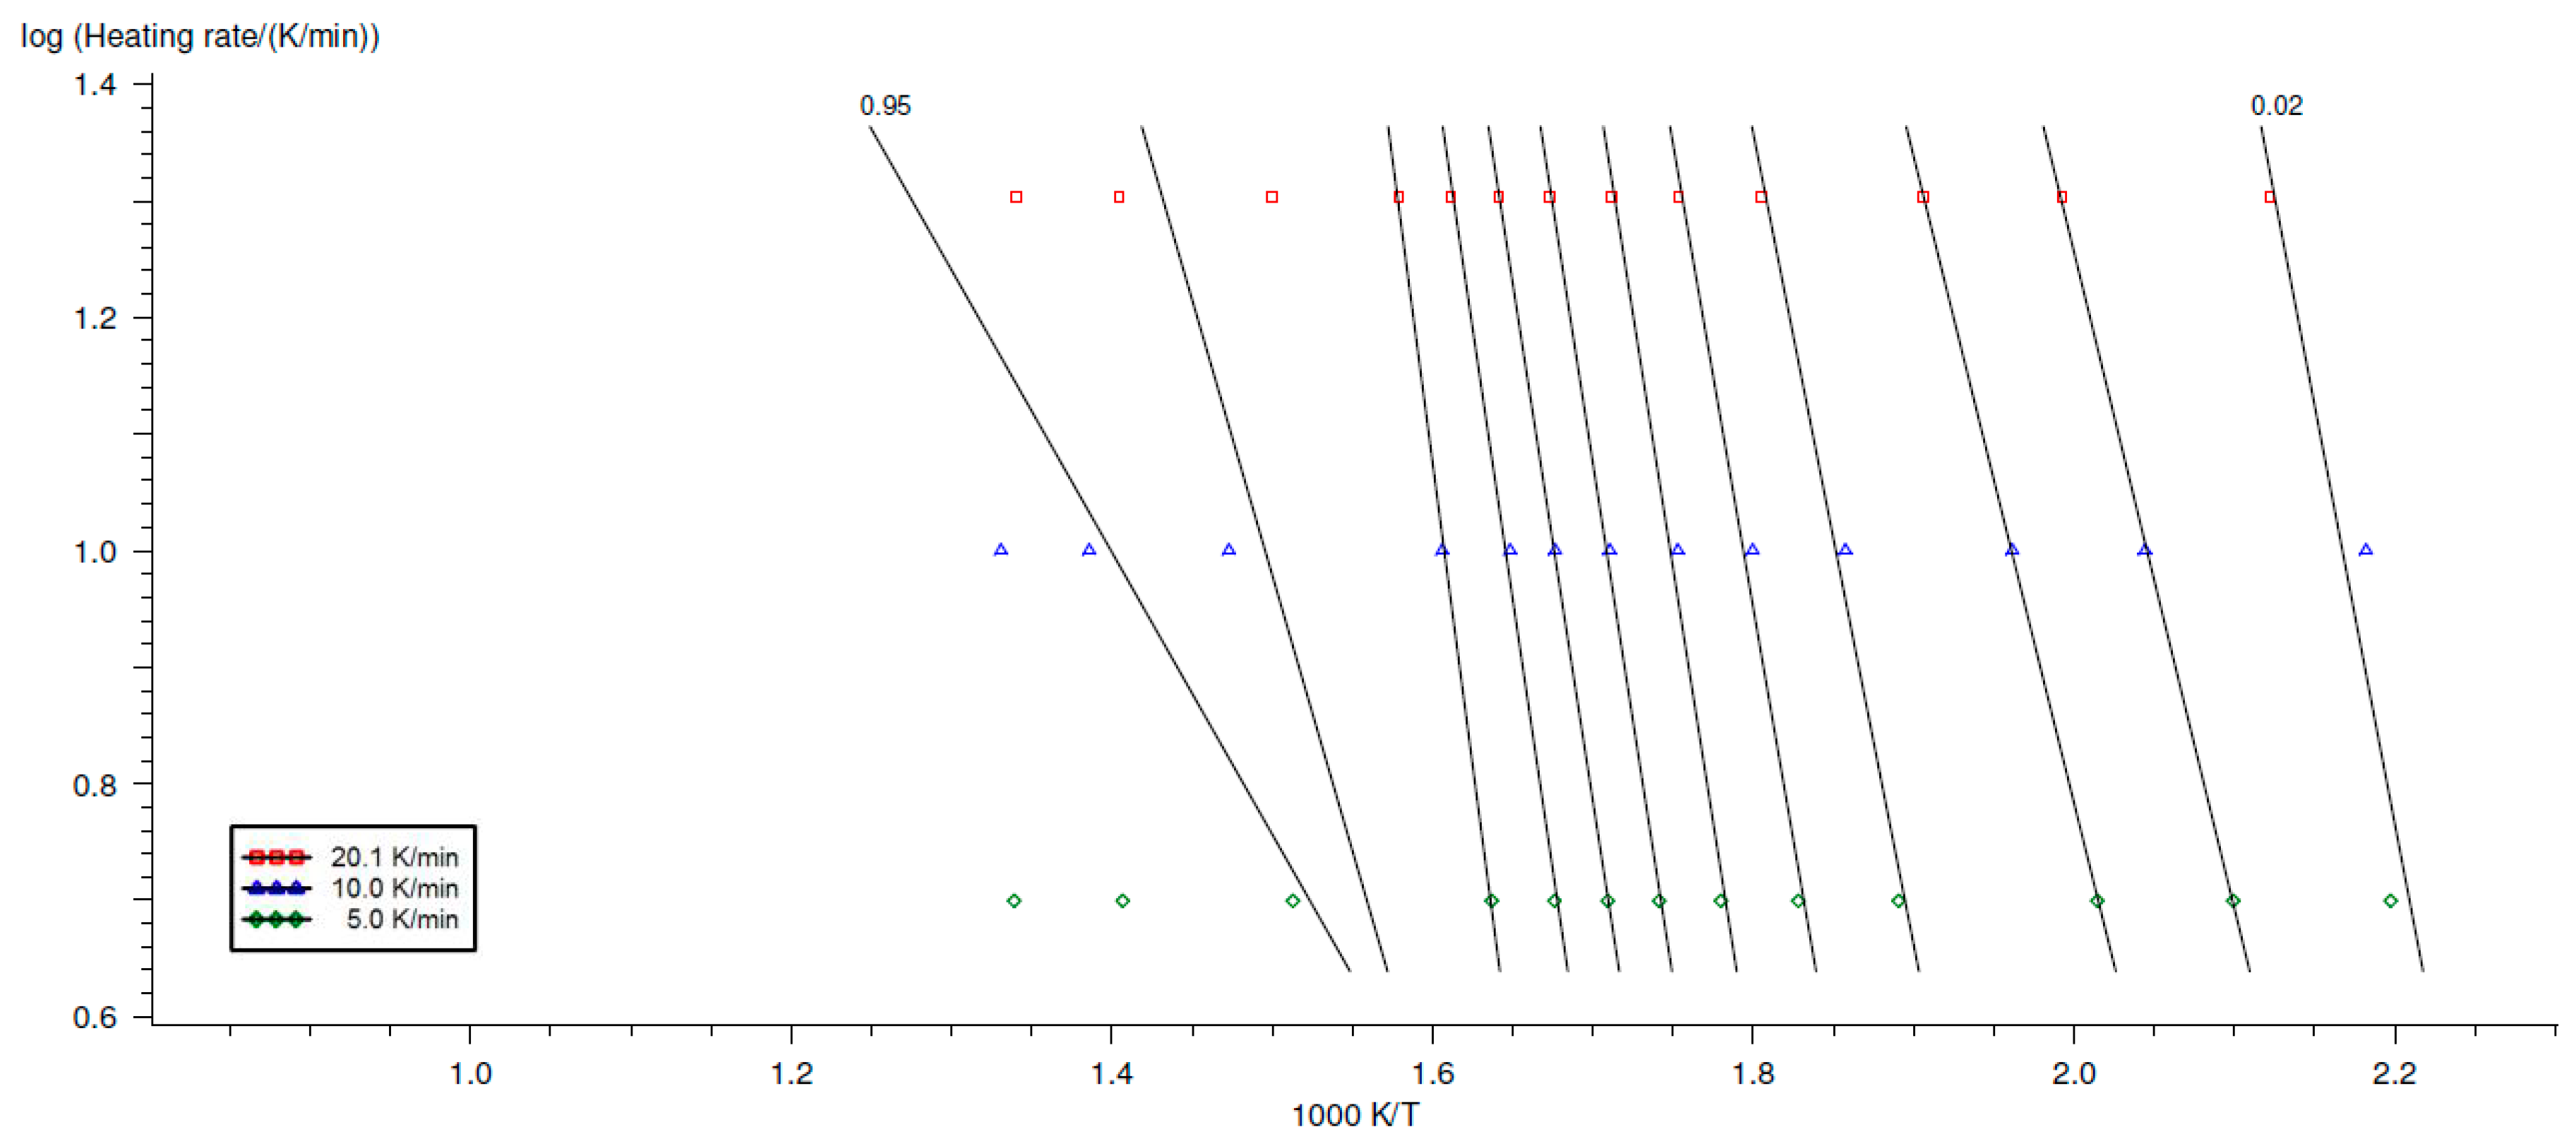
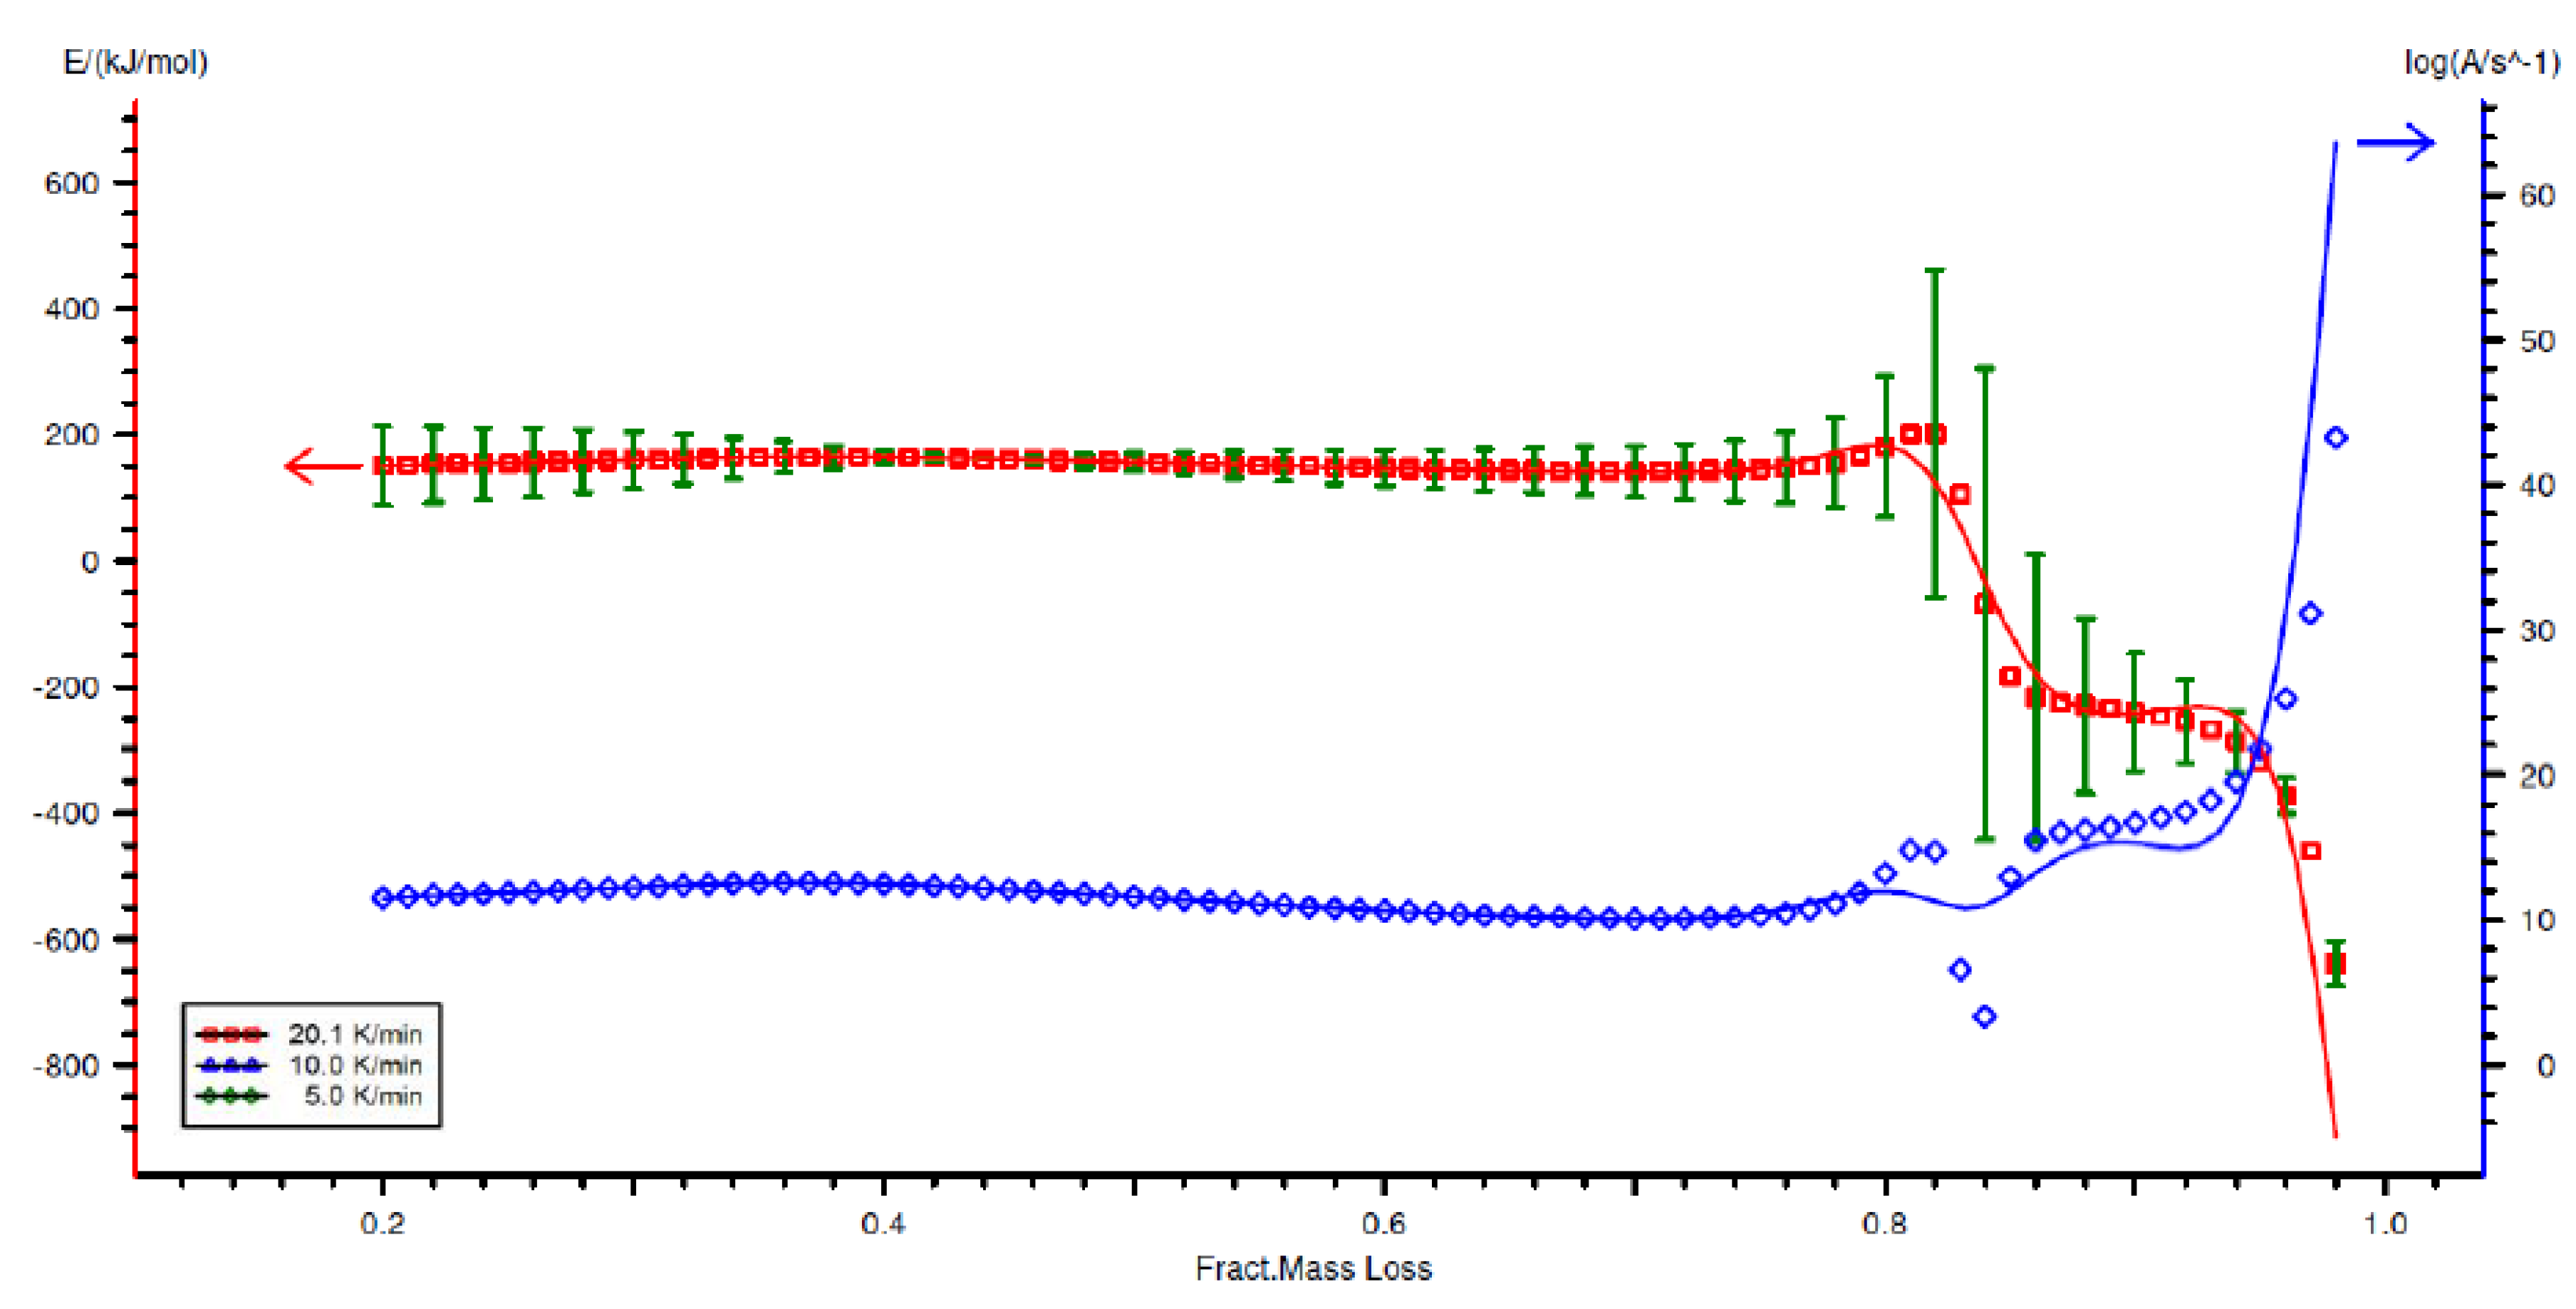
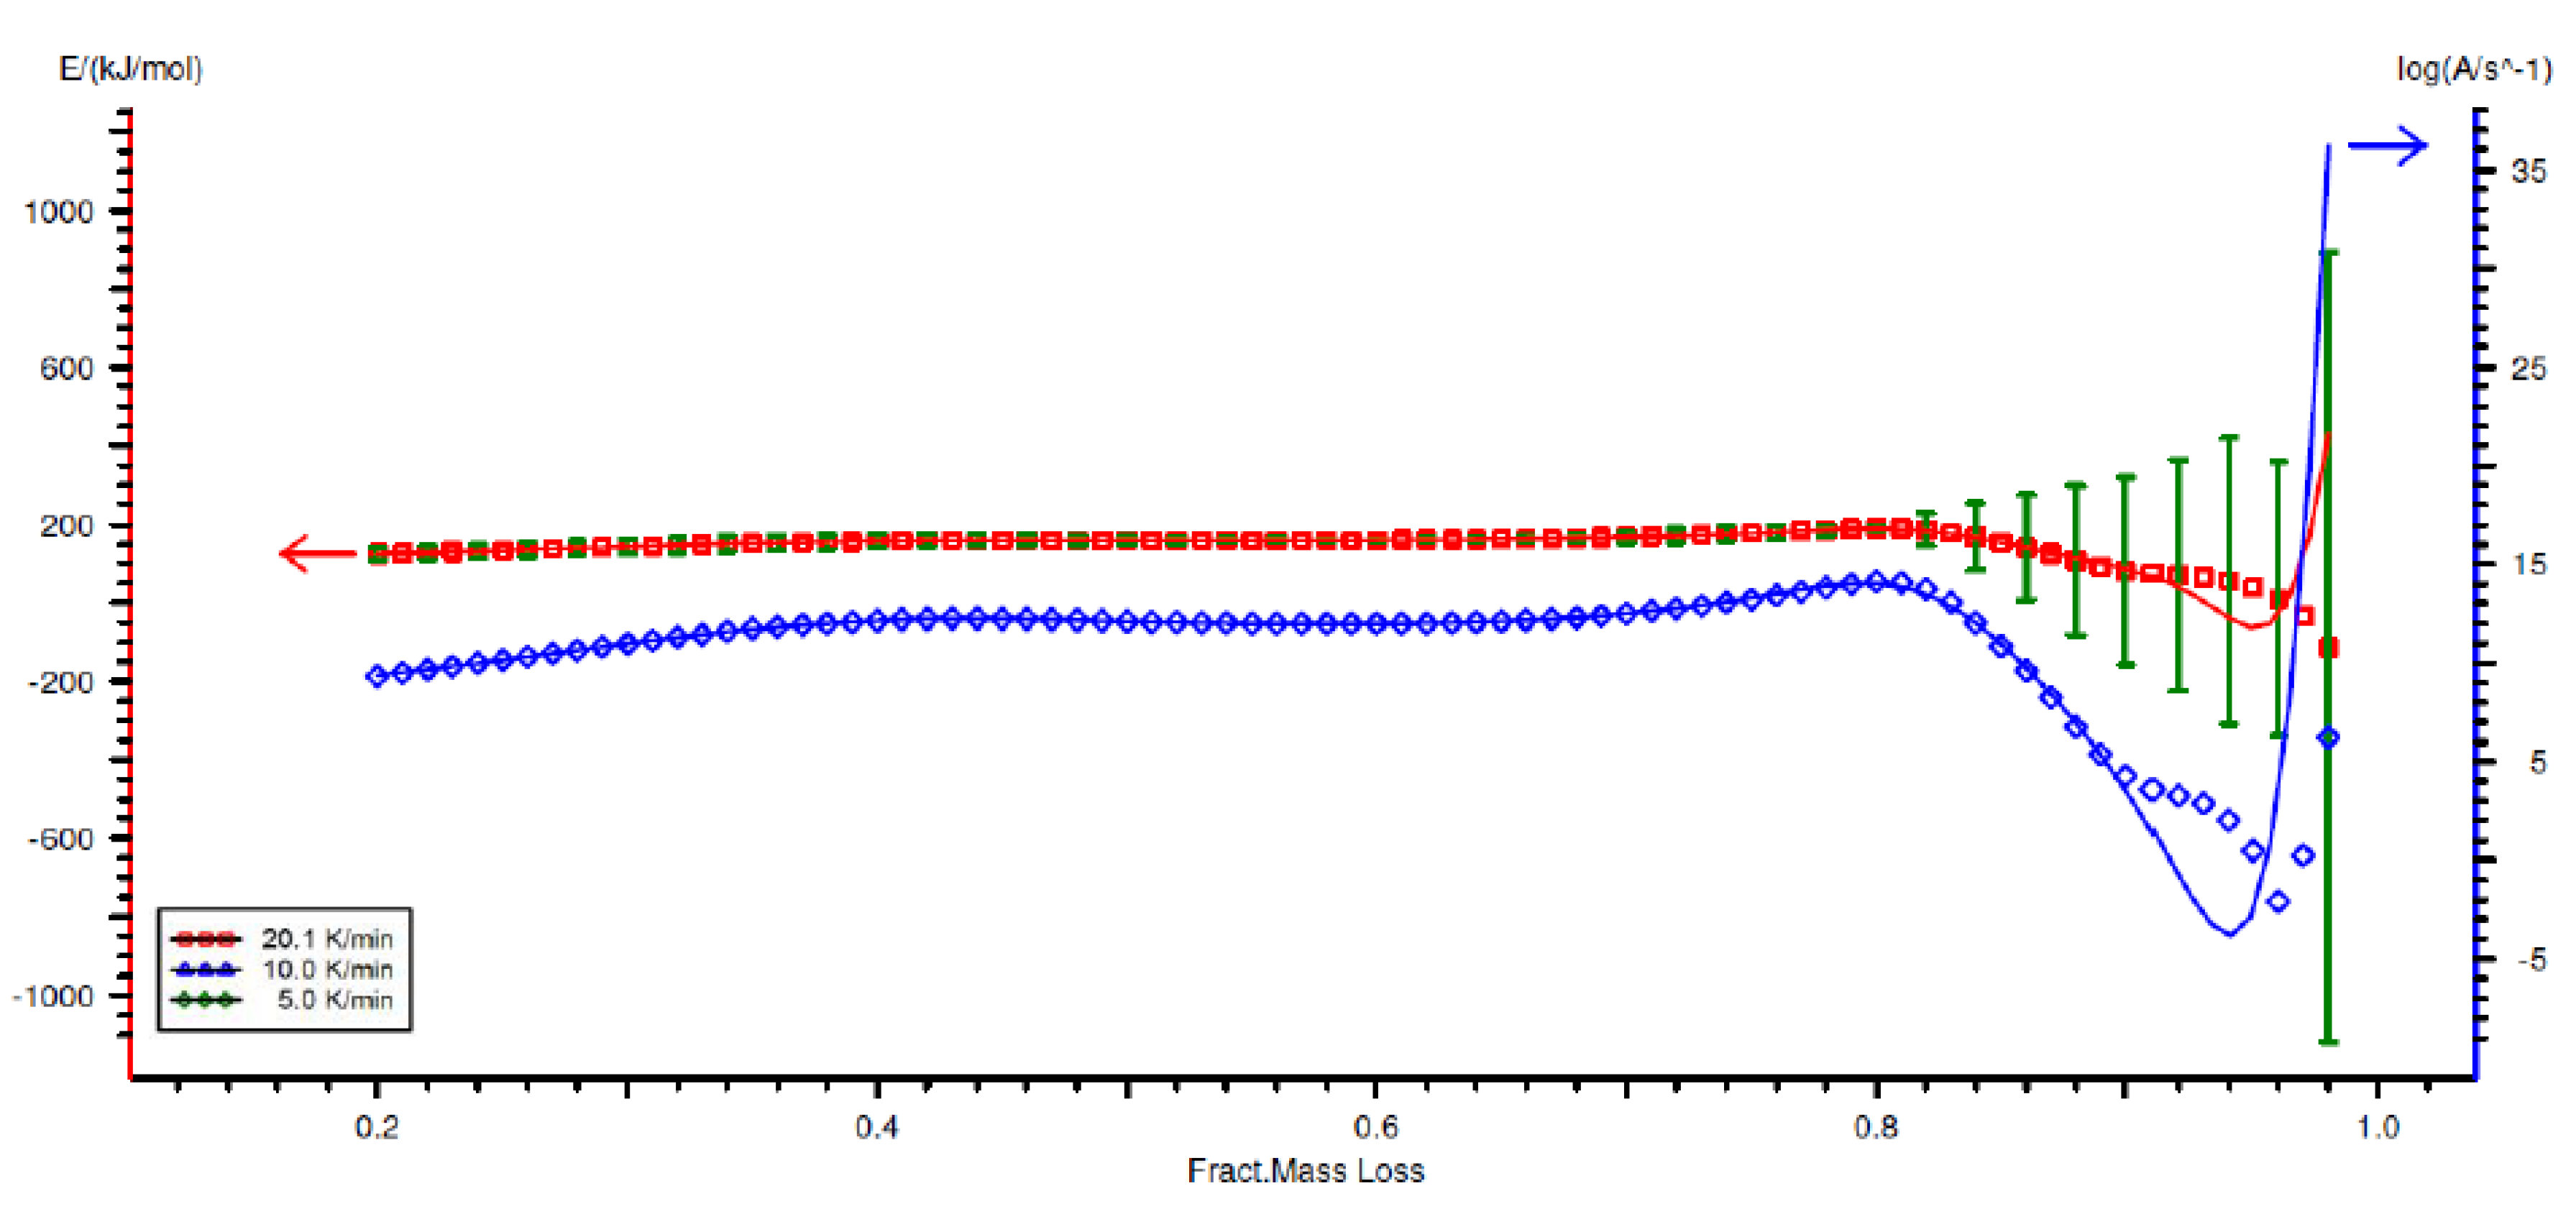
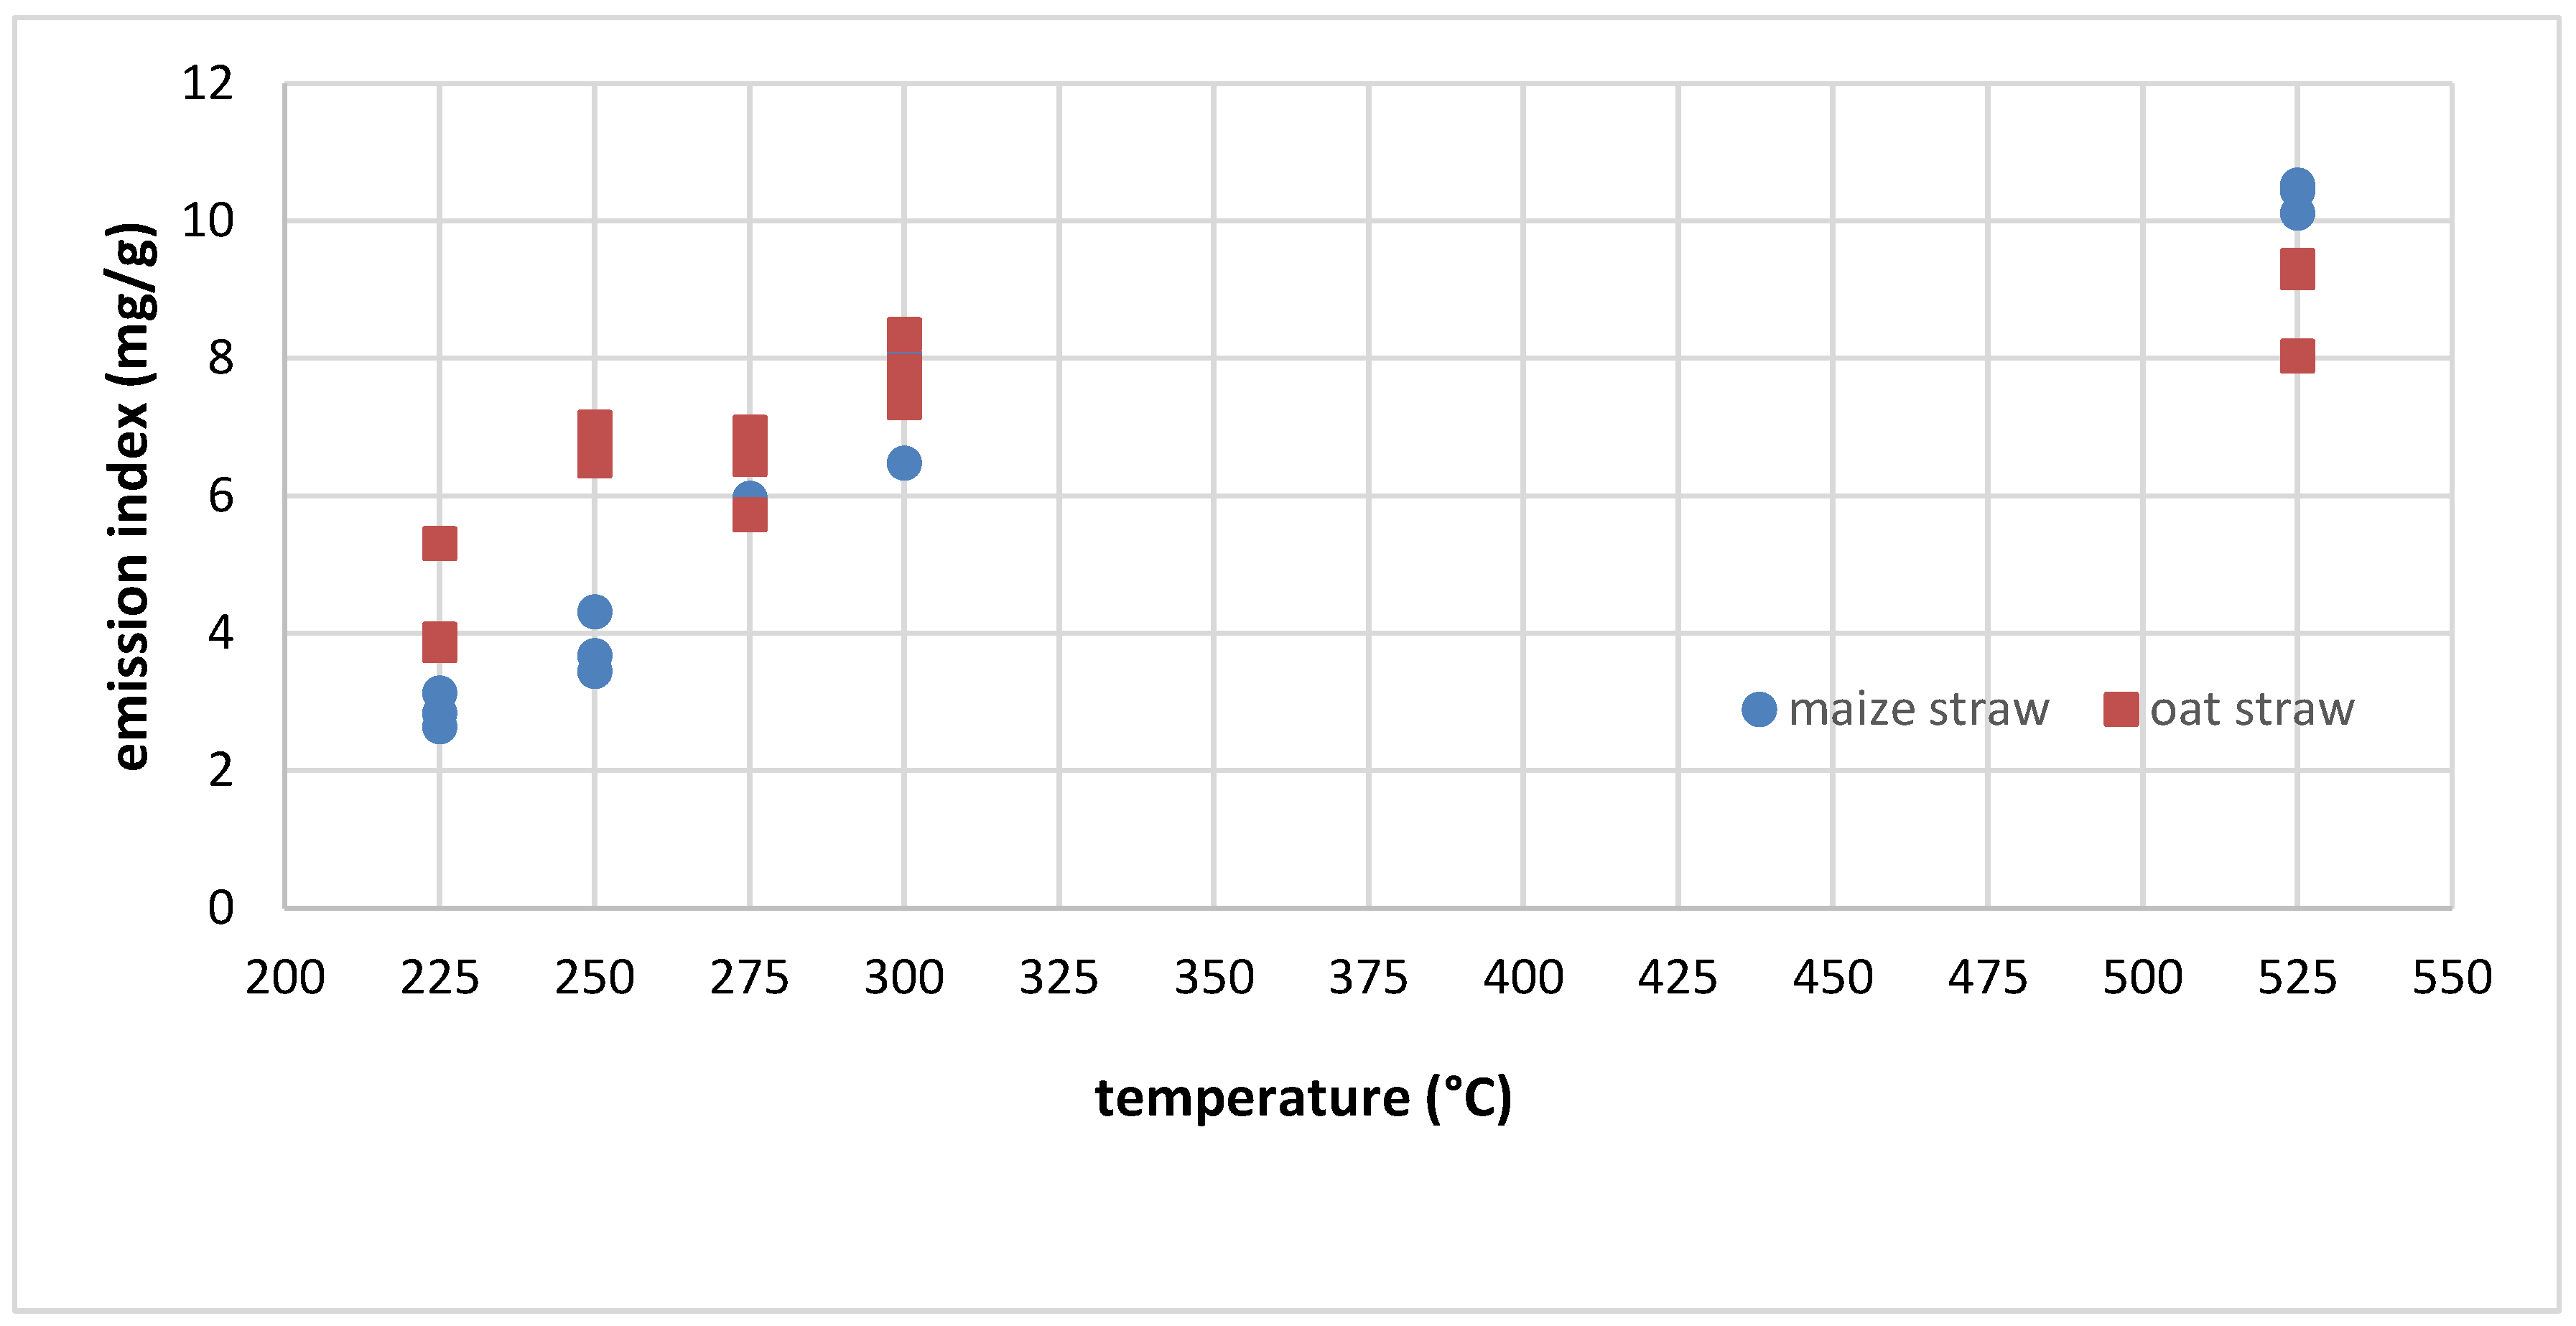
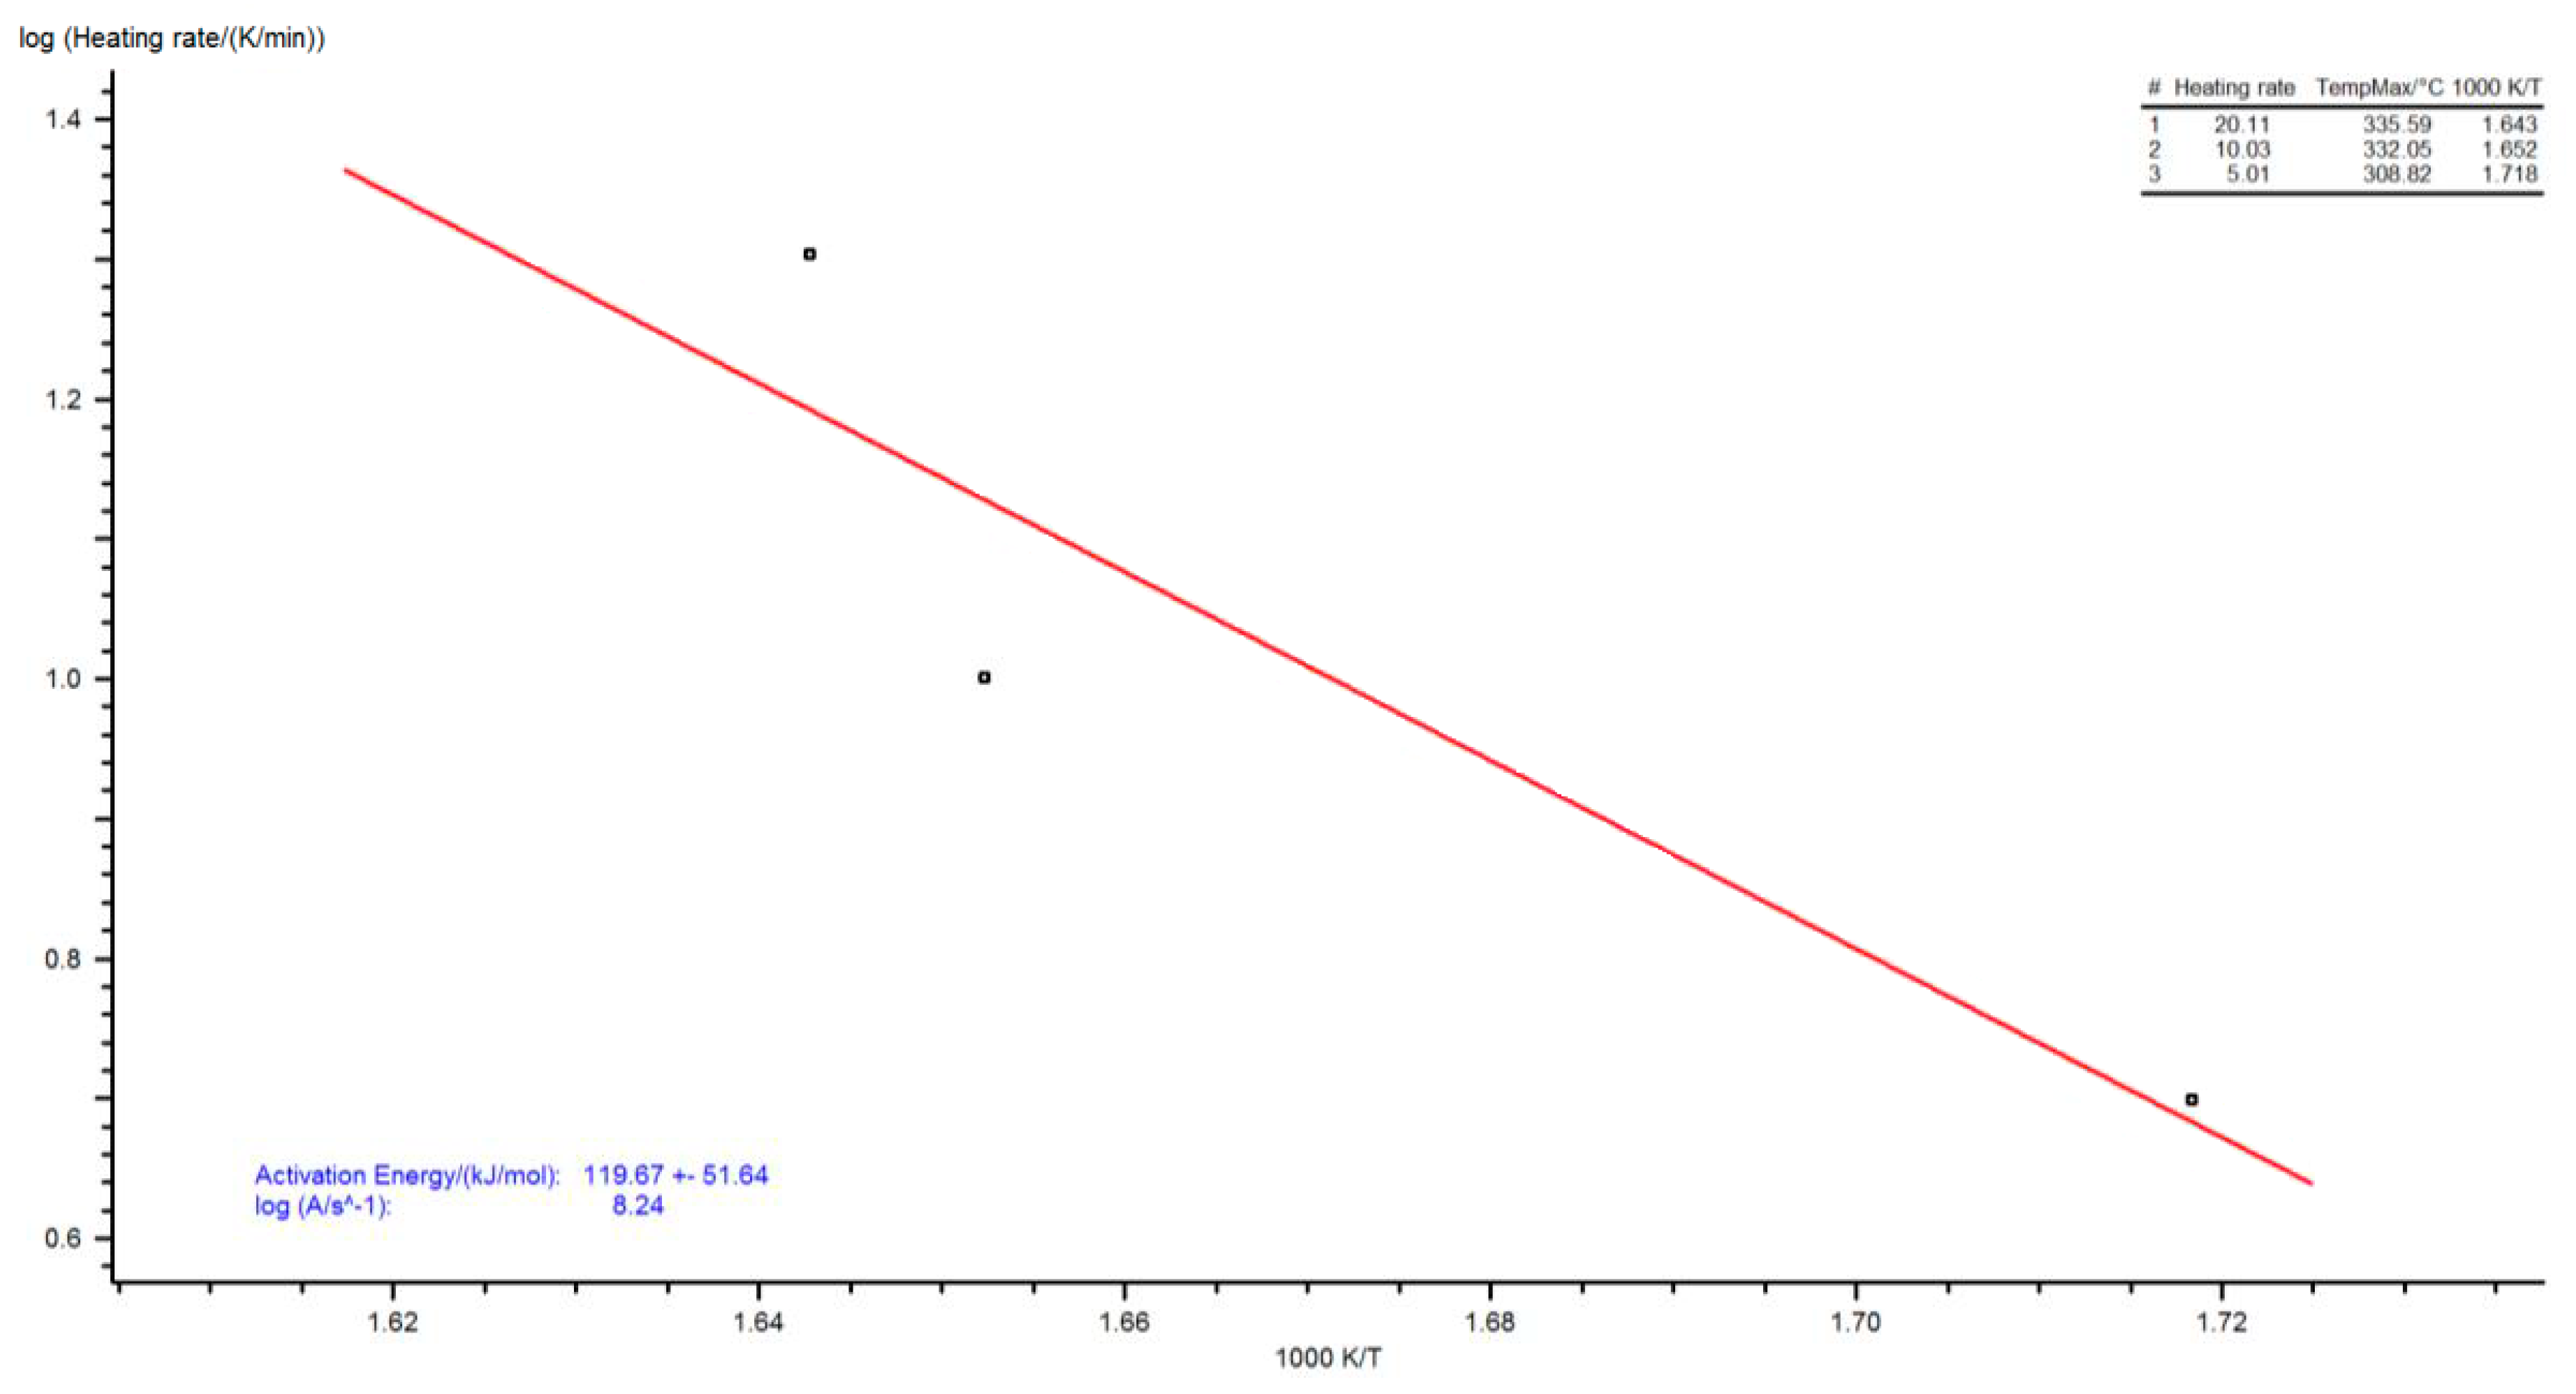
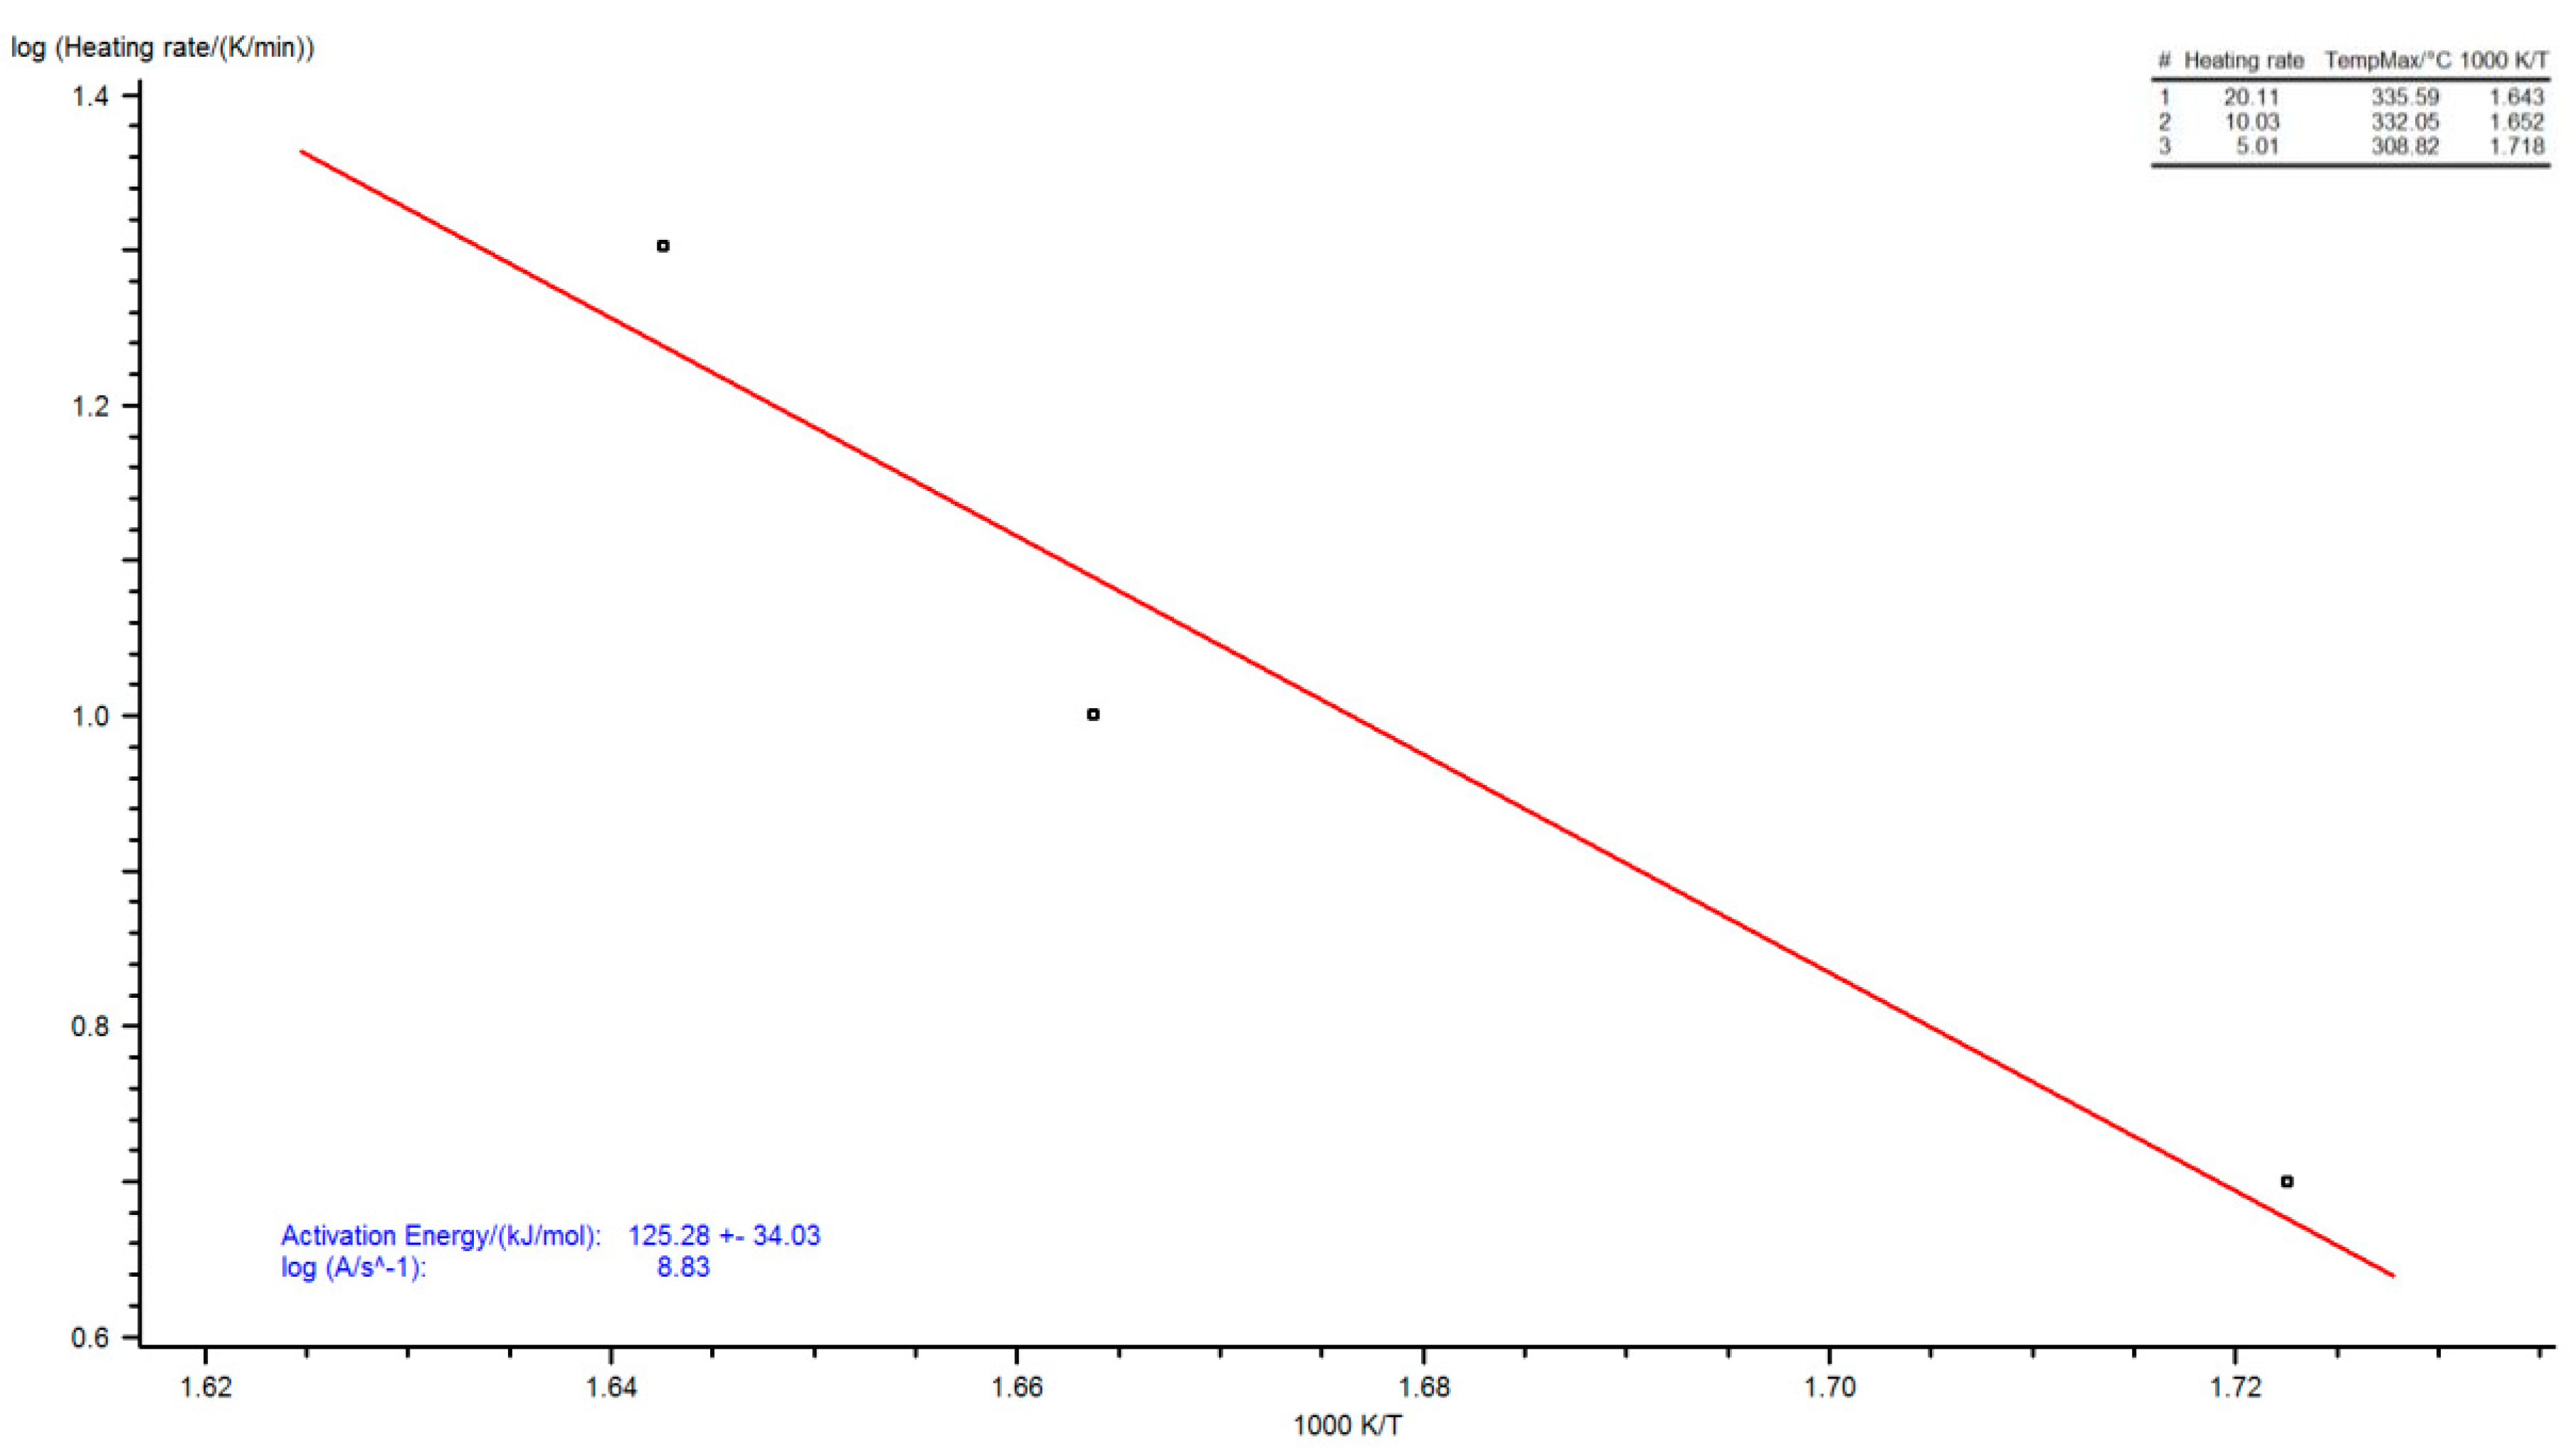
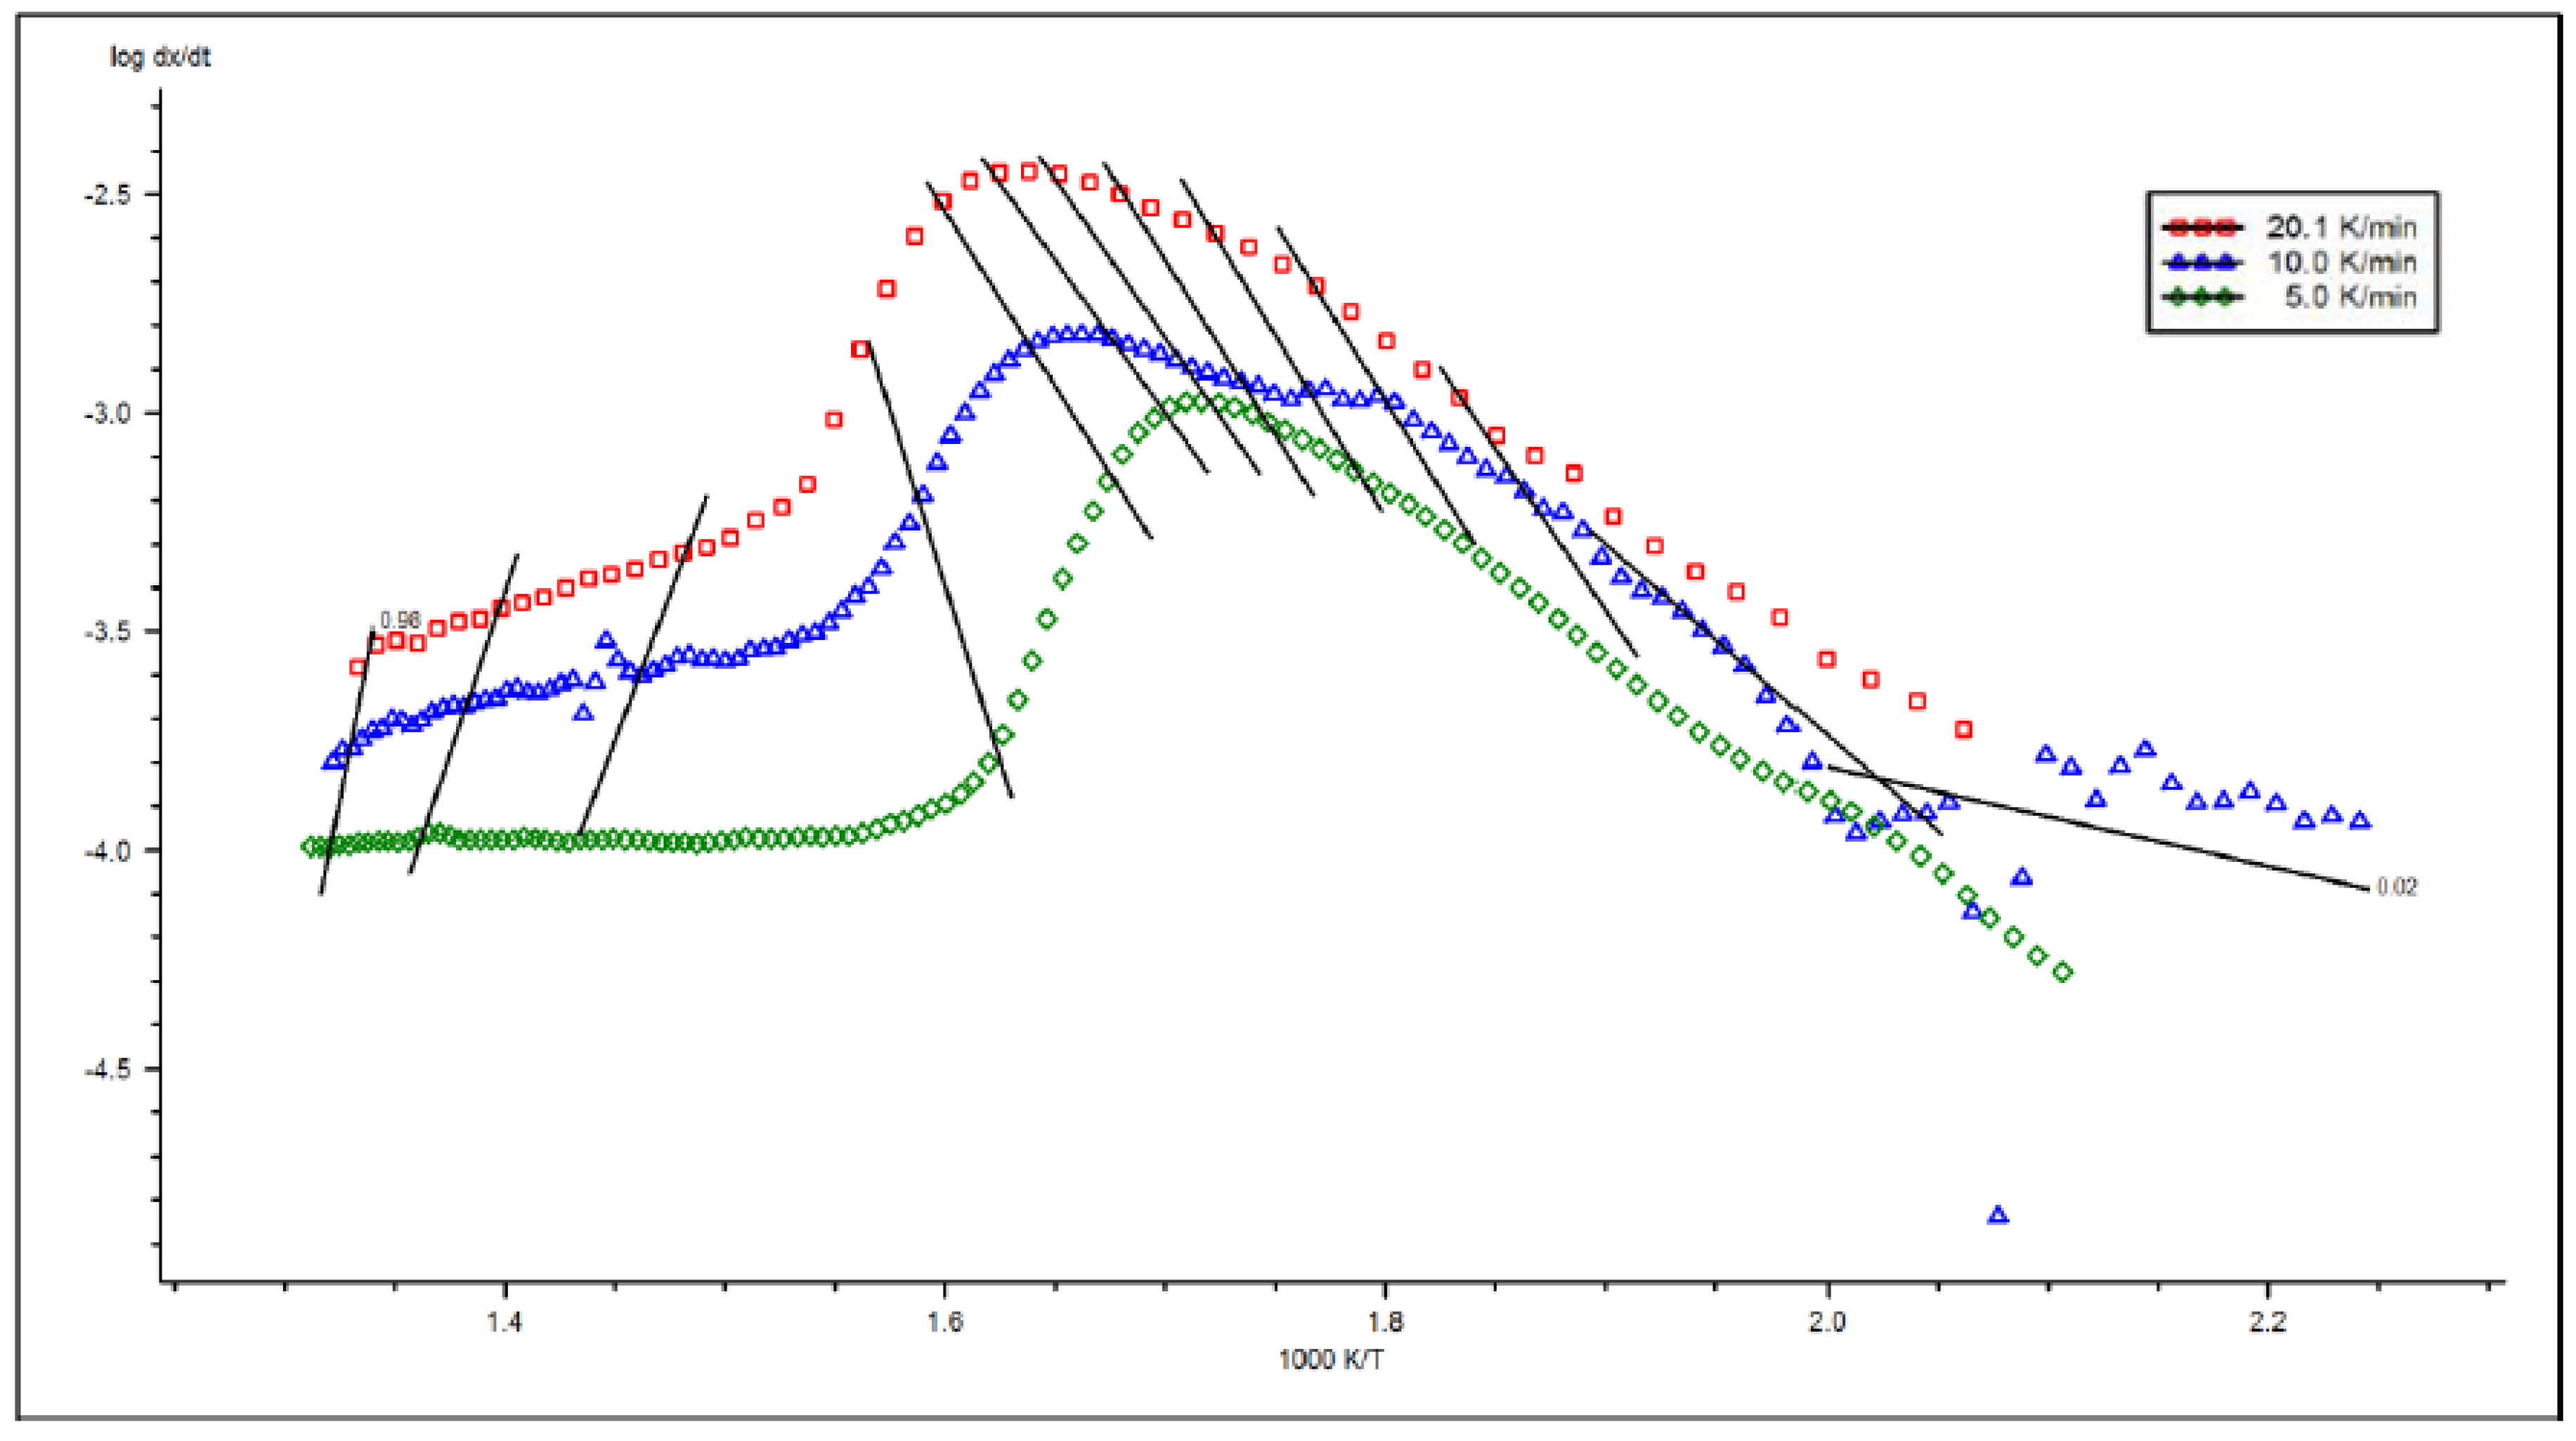
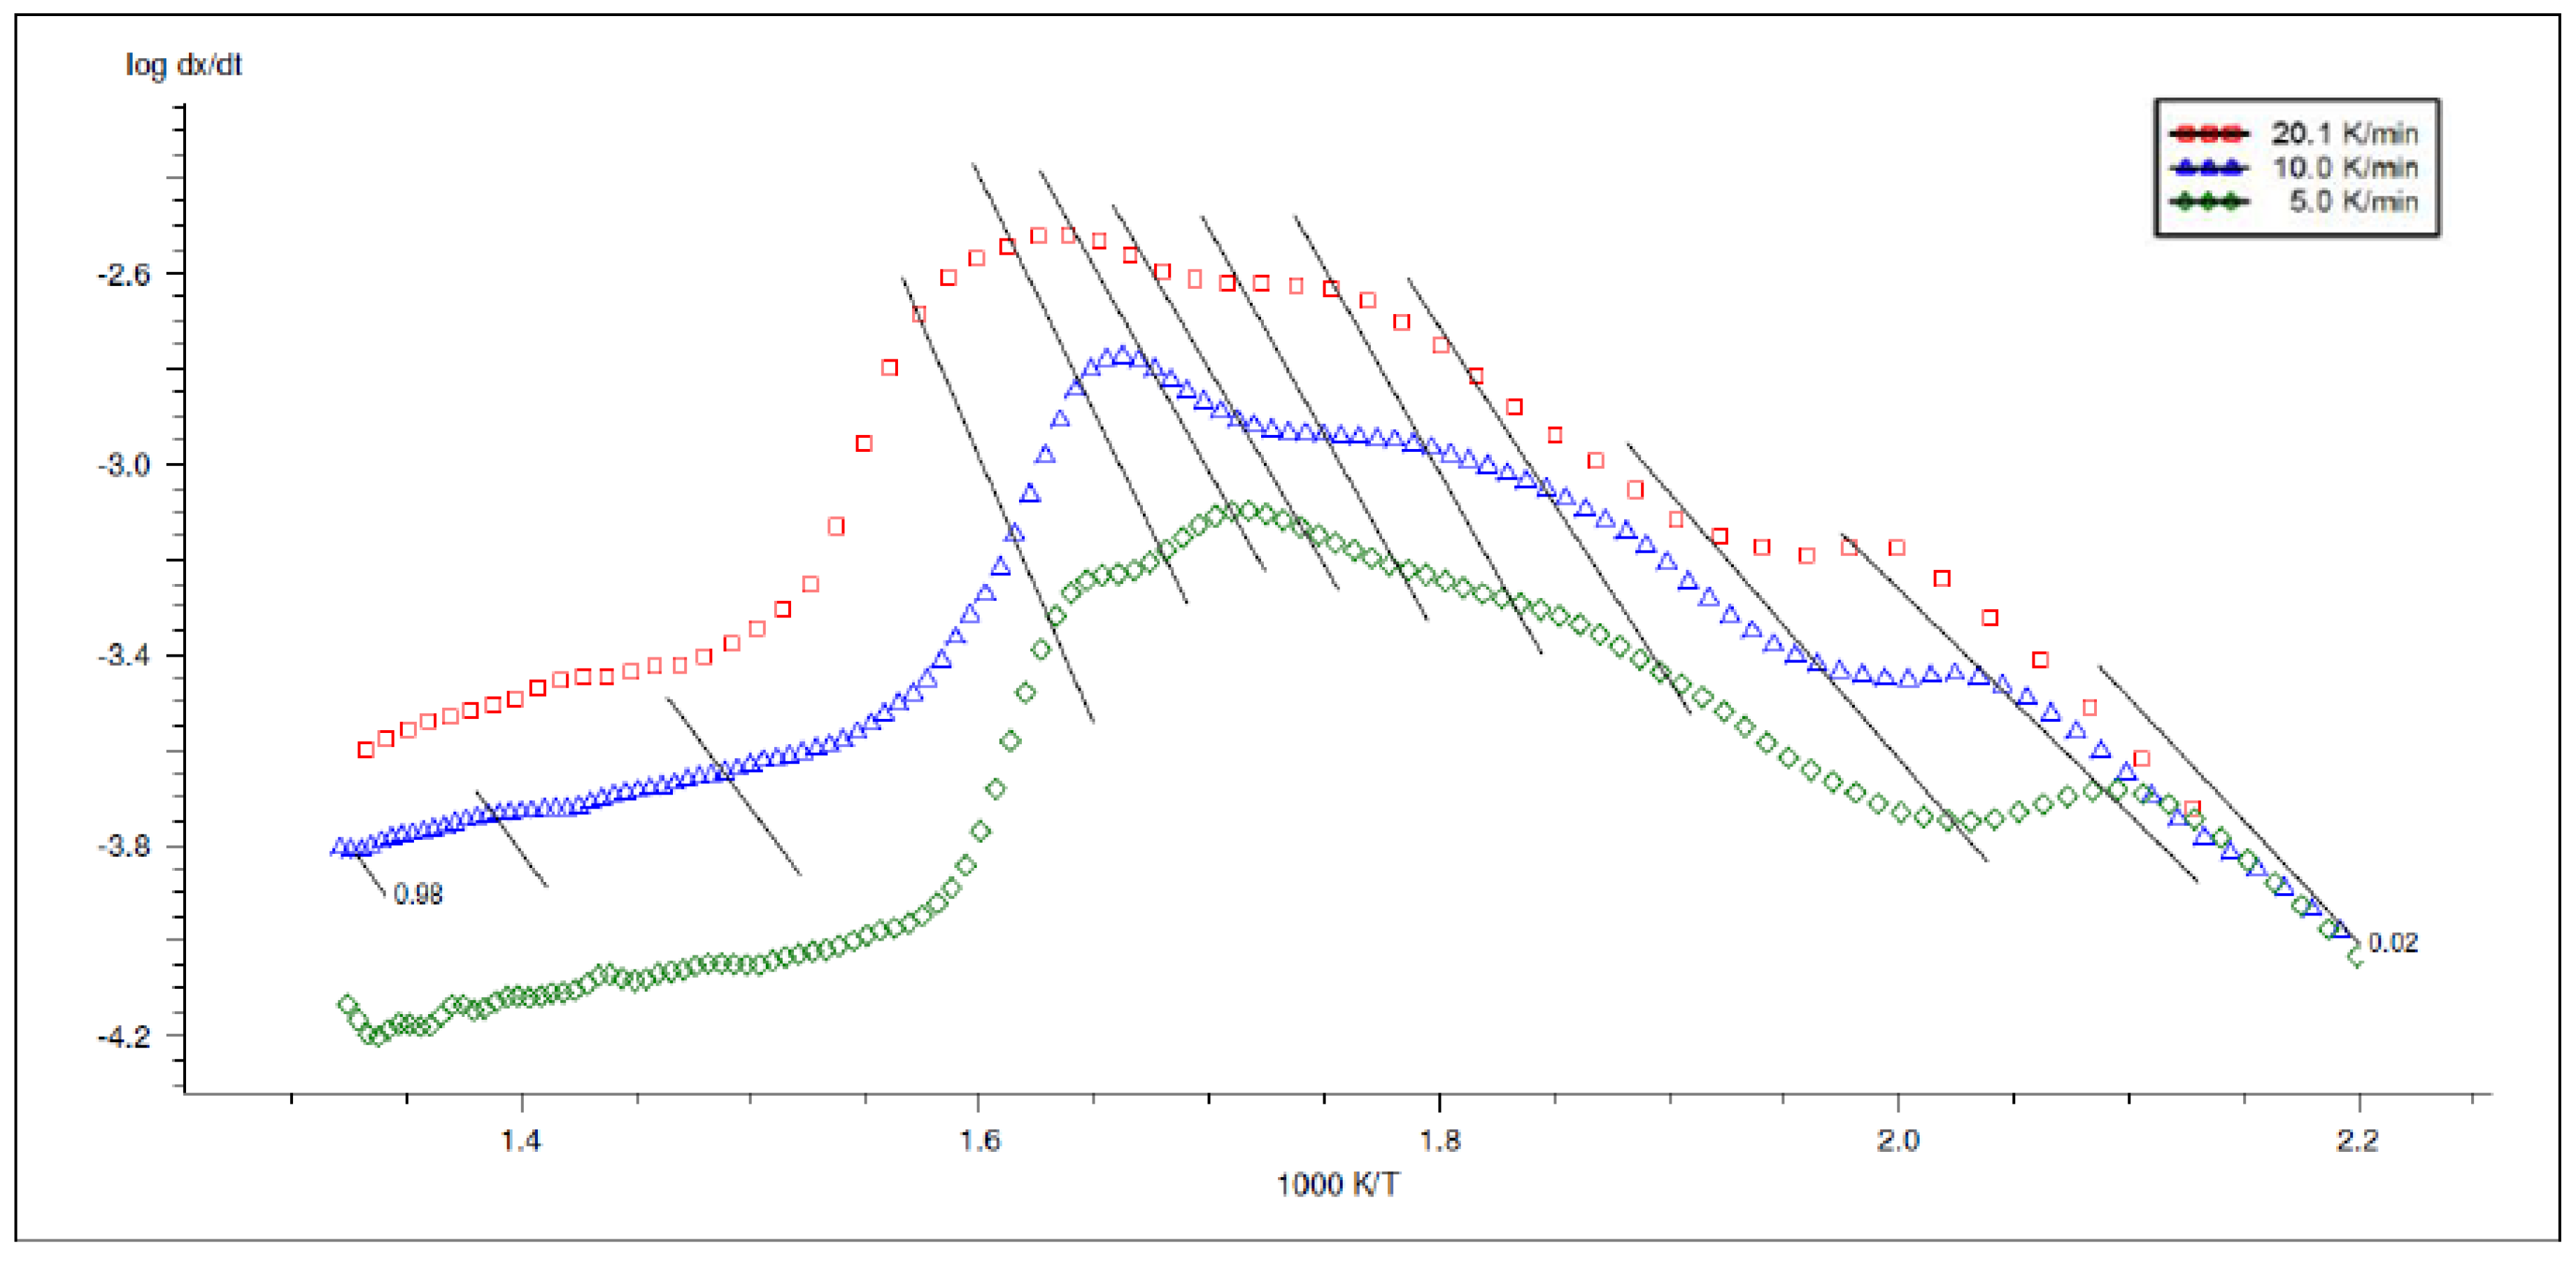
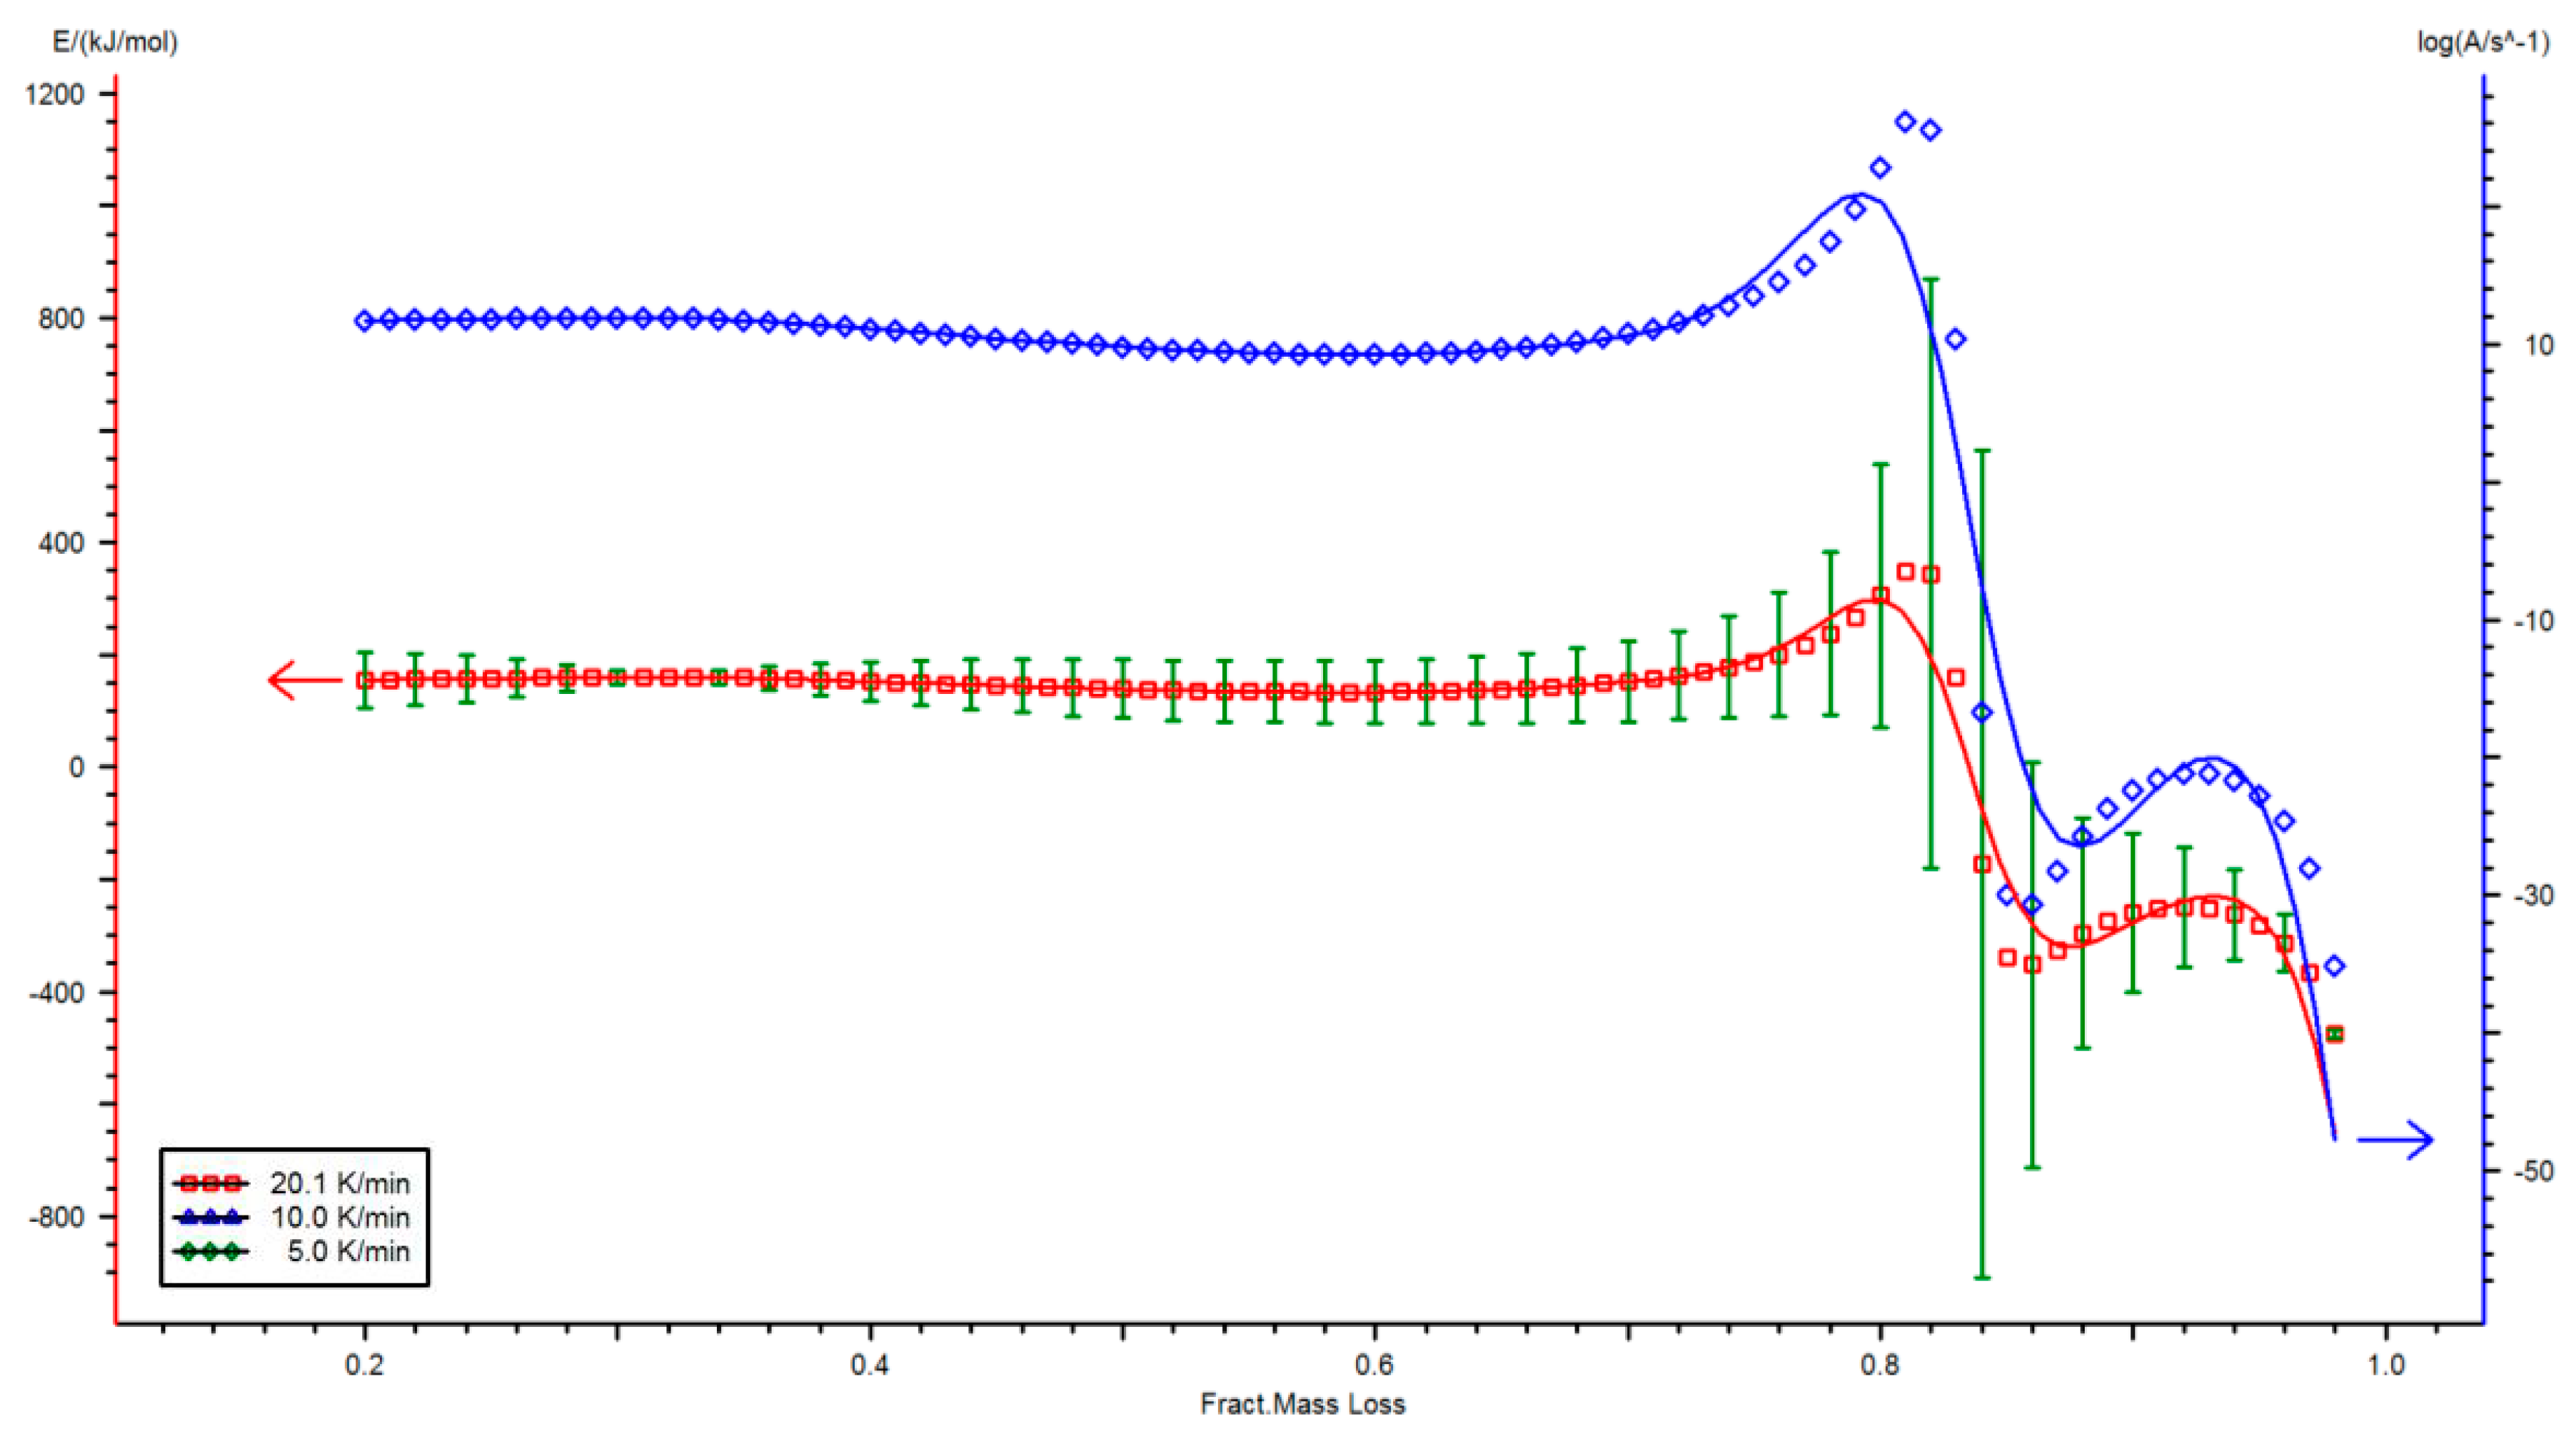
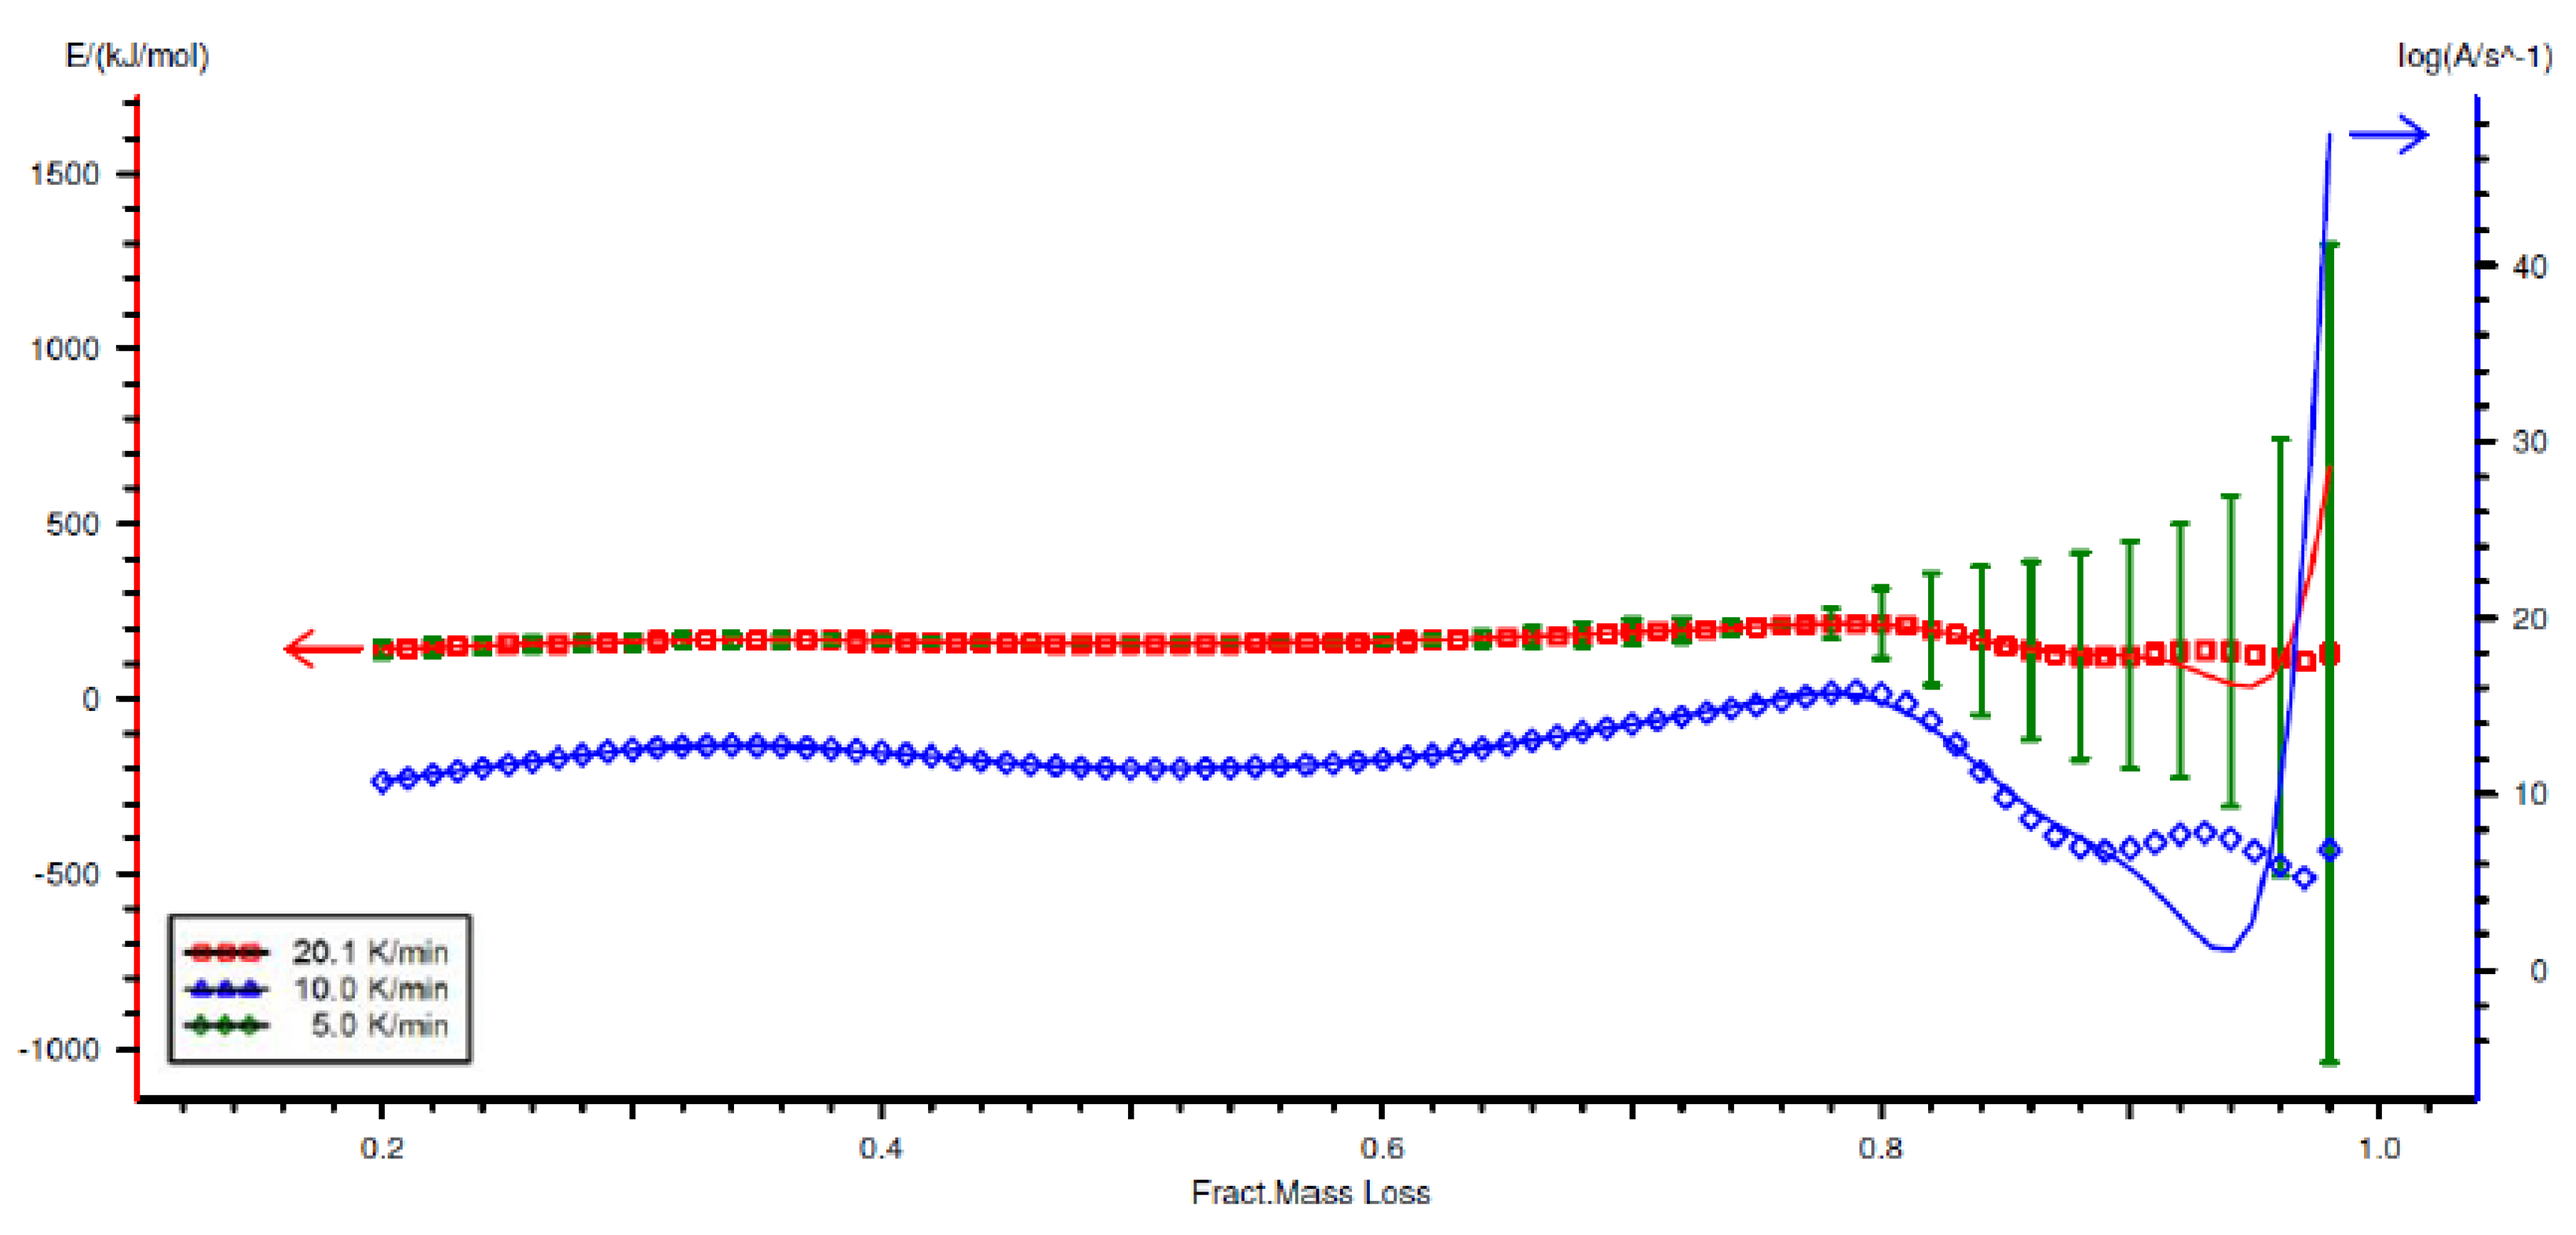
4.1. Kinetics

Kinetic analysis of the pyrolysis process of two biomass samples, maize and oats, was made based on thermogravimetric measurements using three heating rates (5, 10, and 20 K/min.). Sample weights were 10.0 ± 2 mg. For the kinetic analysis, data in a temperature range of 150–500 °C was used. Data analysis was performed using Netzsch Kinetics 3 software. Isoconversion analysis was first to be performed. This allows us to calculate the activation energy without knowing the reaction model [30]. Results of TGA analysis for the maize and oat straws are shown in Figure 3 and Figure 4.
After performing TGA analysis on maize and oat straws using 3 heating ratios, 5, 10, and 20 K/min the kinetic analysis was done using NETZSCH Kinetics Software. The first method used was a Kissinger analysis in accordance with ASTM E698 based on the assumption that the maximum (in this case the maximum of the DTG curve, i.e., the temperature at which the mass loss rate is the highest) of a one-step reaction is achieved with the same degree of conversion regardless of the heating rate. Although this assumption is only partly correct, the resulting errors are low. The Kissinger method based on Equation (1) allows the calculation of the activation energy of the thermal decomposition reaction of a solid by plotting the logarithm of the sample heating rate as a function of the inverse of temperature at the moment of the highest mass loss speed [31]
ln β T m a x 2 = E a R T m a x
where: β—sample heating speed [K/min]. Tmax—temperature at which the sample mass loss rate is the highest [K], A—pre-exponential coefficient [-], Ea—activation energy [J/mol], R—gas constant [J/mol·K].
f ( T ) = A e E e R T
[31], where
A—pre-exponential factor (rate constant) (1/s),
Ea—activation energy (J/mol),
R—gas constant (J/mol·K),
T—temperature (K)
Friedman analysis consists of determining the logarithm of the degree of conversion and the function of temperature inverse according to Equation (5) [31]
ln d x d t = ln A E a R T m a x + ln f ( x )
The Ozawa–Flynn–Walla method is based on the integral form of the equation [31]
G ( x ) =   d x f ( x ) = A β T o T e x p ( E a R T ) d t
Assuming the stability f(x) for a given degree of conversion, this method allows plotting the logarithm dx/dt as a function of temperature inverse and calculating activation energy (Figure 5 and Figure 6) and pre-exponential coefficients for individual conversion levels without knowing the reaction mechanism which is presented on Figure 7 and Figure 8.
For the analyzed biomass samples, it was assumed that the torrefaction process proceeds in one step according to the scheme
A 1 B
where:
B—is the biomass after torrefaction process
Under dynamic conditions, the kinetic equation becomes a thermo-kinetic equation [31].
If
β = d T d t =   const   > 0 ,   then   d X d t = f ( T ) β f ( X )
In linear form, the thermokinetic equation takes the form [31]
ln g ( X ) T = ln A β E R T
On the basis of the TG curves obtained as a function of temperature, using the Kinetics 3 program, an attempt was made to mathematically fit one of the models of thermal decomposition reaction. Taking into account the assumed reaction model, kinetic parameters were determined, i.e., the velocity constant (pre-exponential factor) k and activation energy Ea, as well as the fitting factor R2 (Table 1 and Table 2). In Appendix A: Table A3 summarizes the theoretical equations of the solid-state distribution models of g(X), which were used to find the best fit.
The best fit for the experimental data for the oat straw sample was found for the n-order reaction model in Appendix A: Table A3 for n = 3.4235. The R2 correlation coefficient was 0.9972, the pre-exponential coefficient 10.8466, and the activation energy 142 kJ/mol [1]. Figure 9 and Figure 10 represent the fit of the equation with estimated coefficients fit to the experimental data.
The best fit for the experimental data for the maize straw sample was obtained for the n-order reaction model for n = 2.8859. The R2 correlation coefficient was 0.9966, the pre-exponential coefficient 8.1309, and the activation energy 112 kJ/mol. Figure 9 shows the fit of the equation with calculated coefficients to the experimental data.
It should be borne in mind that the calculated kinetic triplet is only the optimal mathematical fit of the equation to the experimental data and has no strict physical significance (reaction order) in this case. The activation energy calculated in this way is apparent: it only serves to correlate the model with the experimental data and has no meaning as in the definition [32]. It was also concluded that the methods of kinetic analysis using various heating rate results were more efficient than the method involving a single heating rate [2].

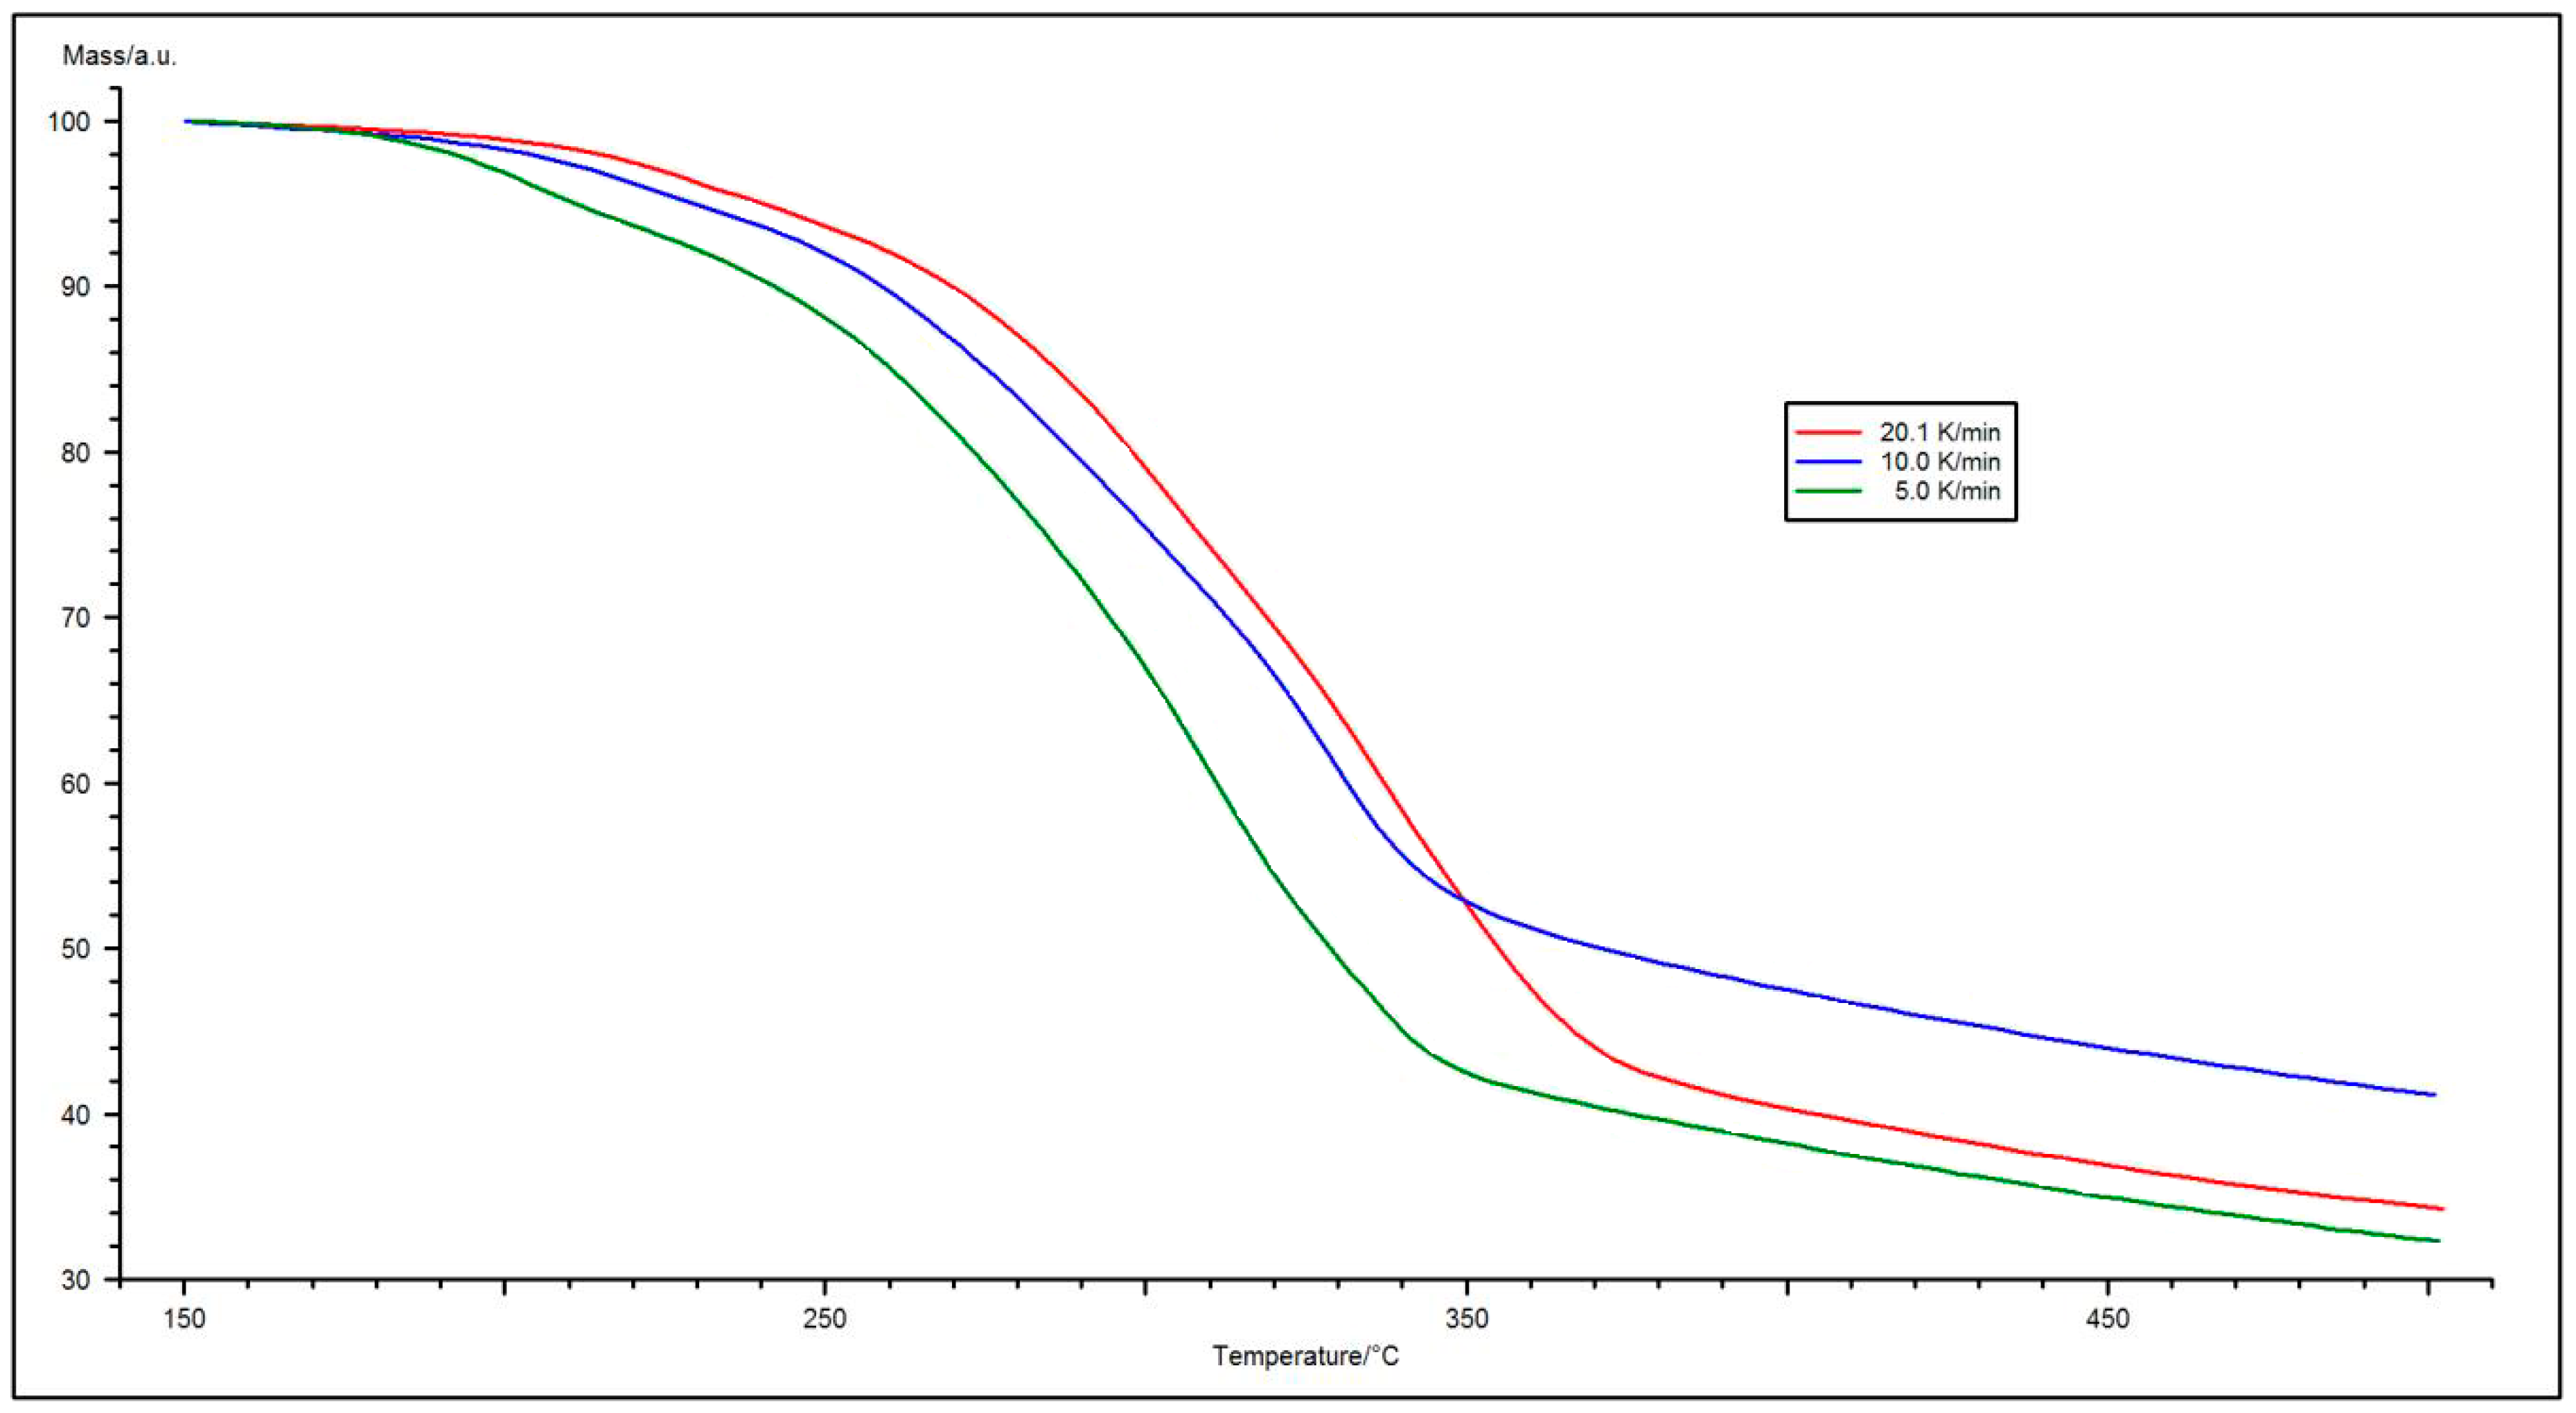
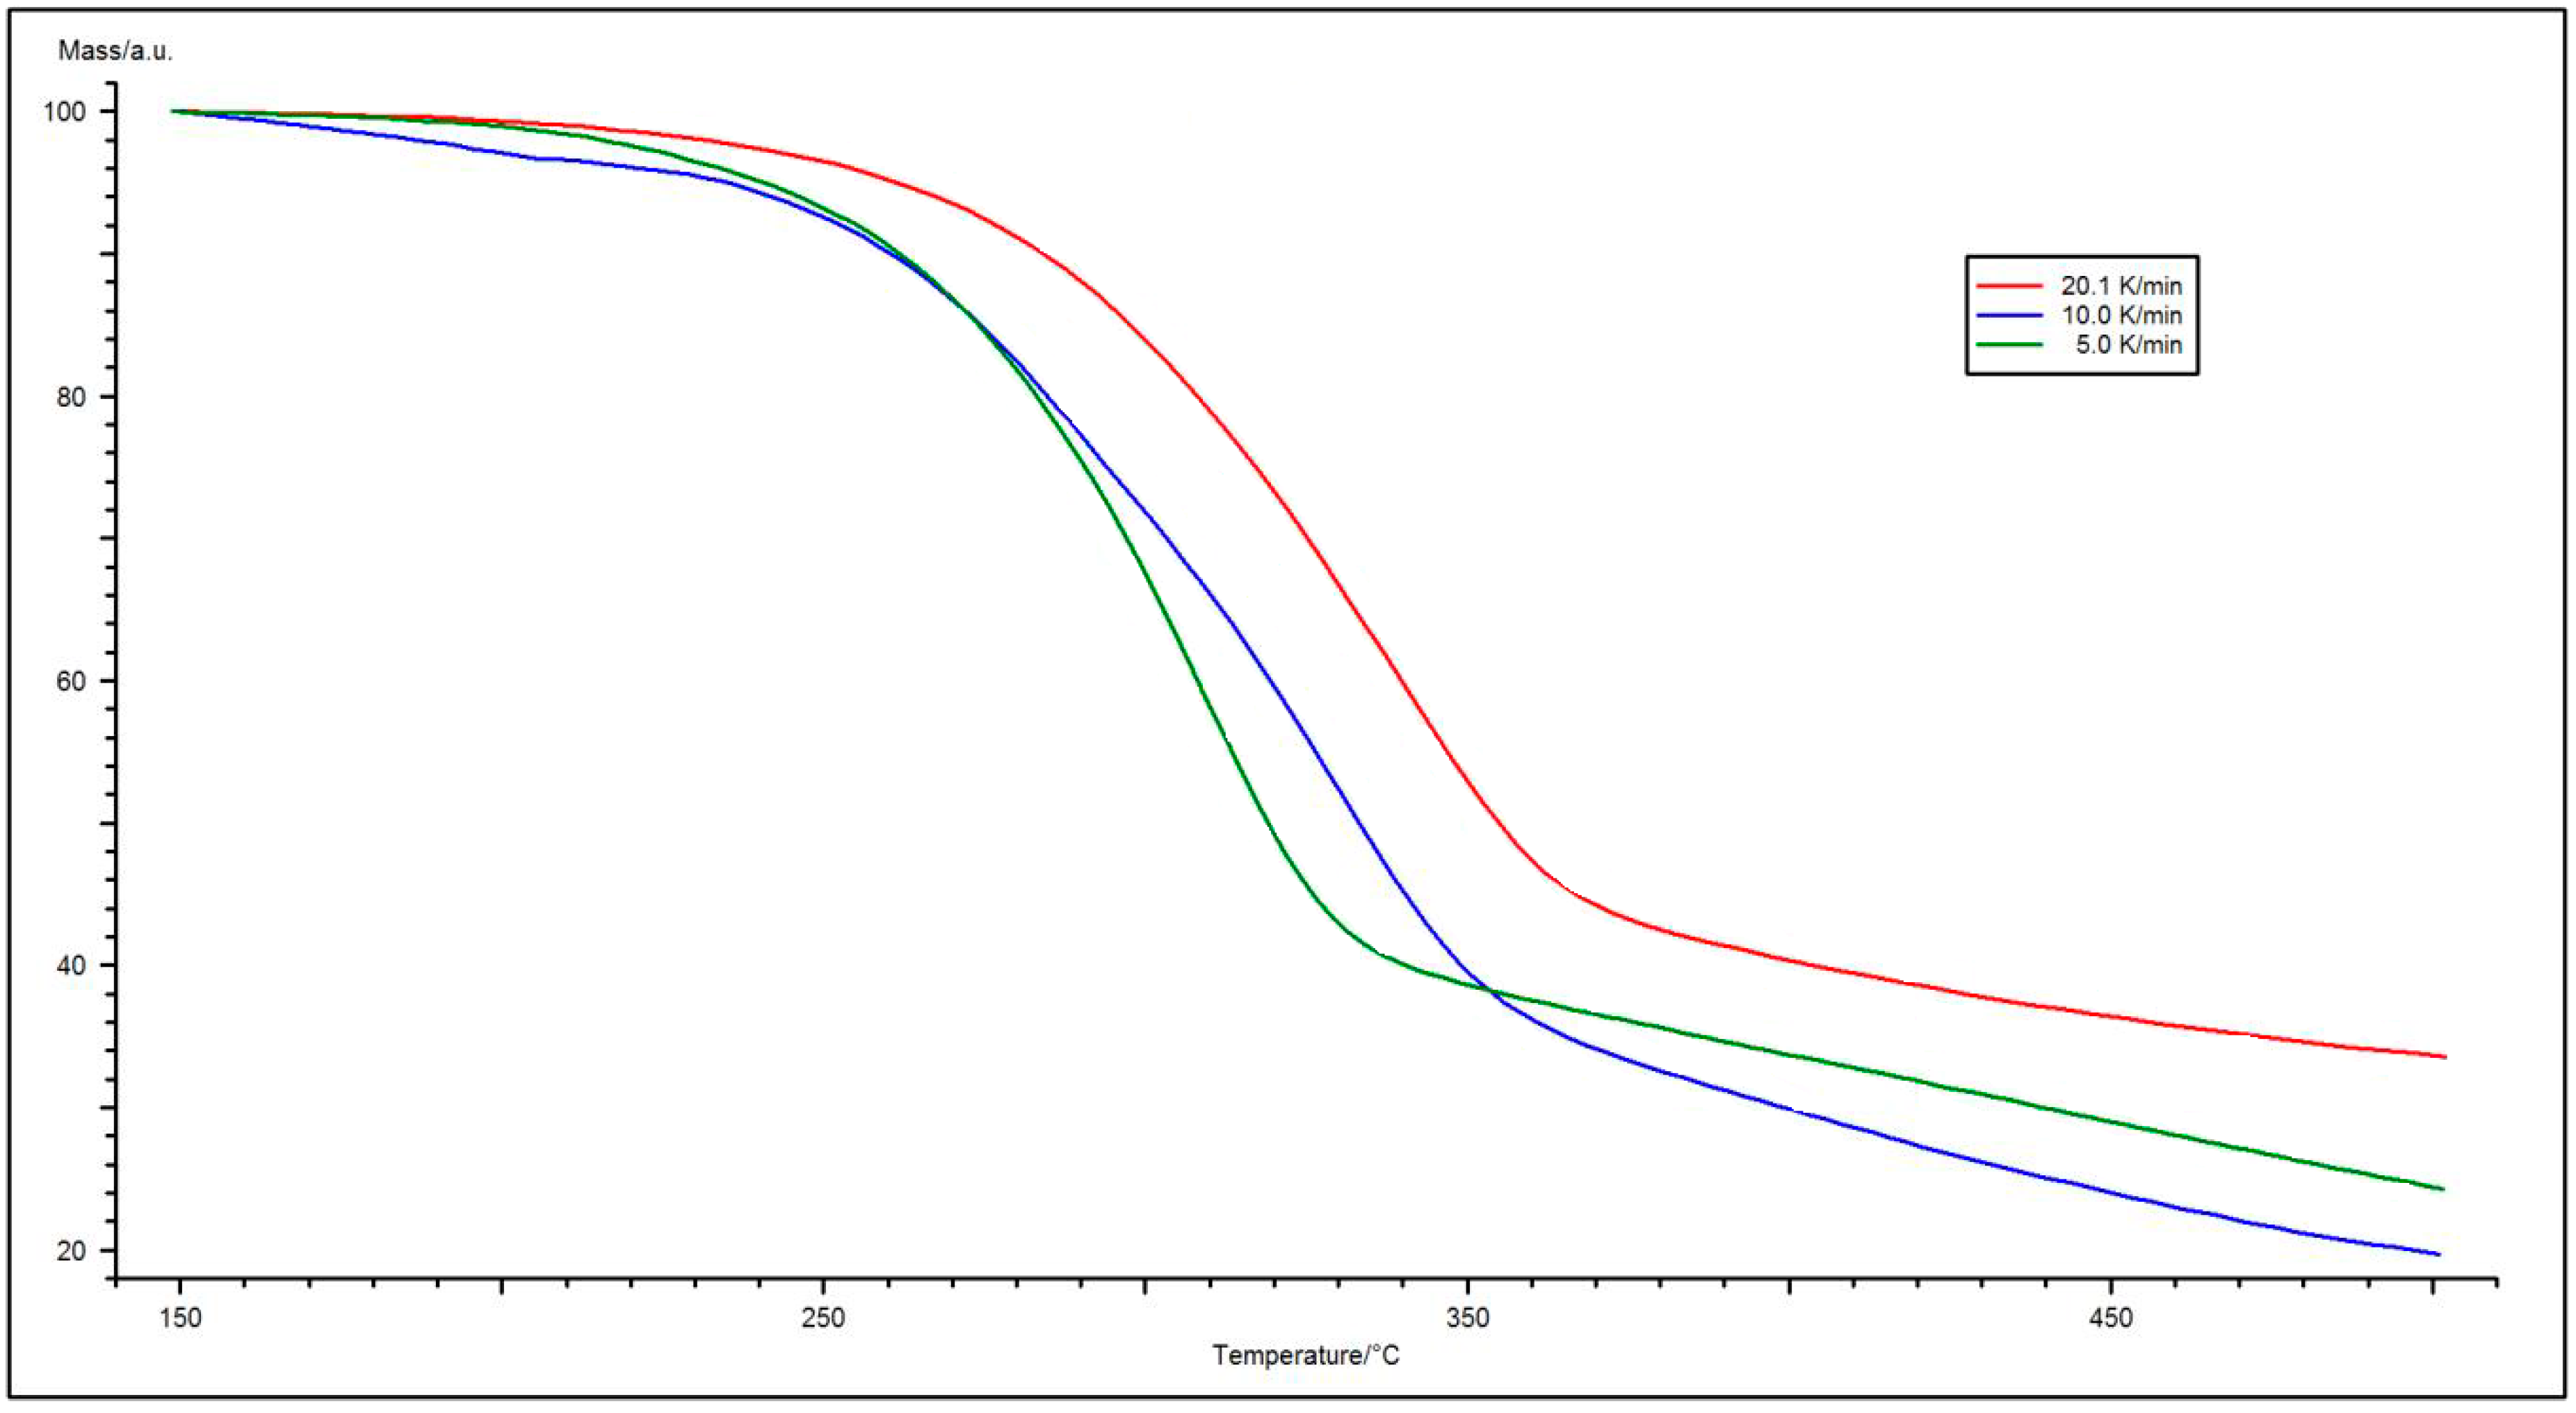
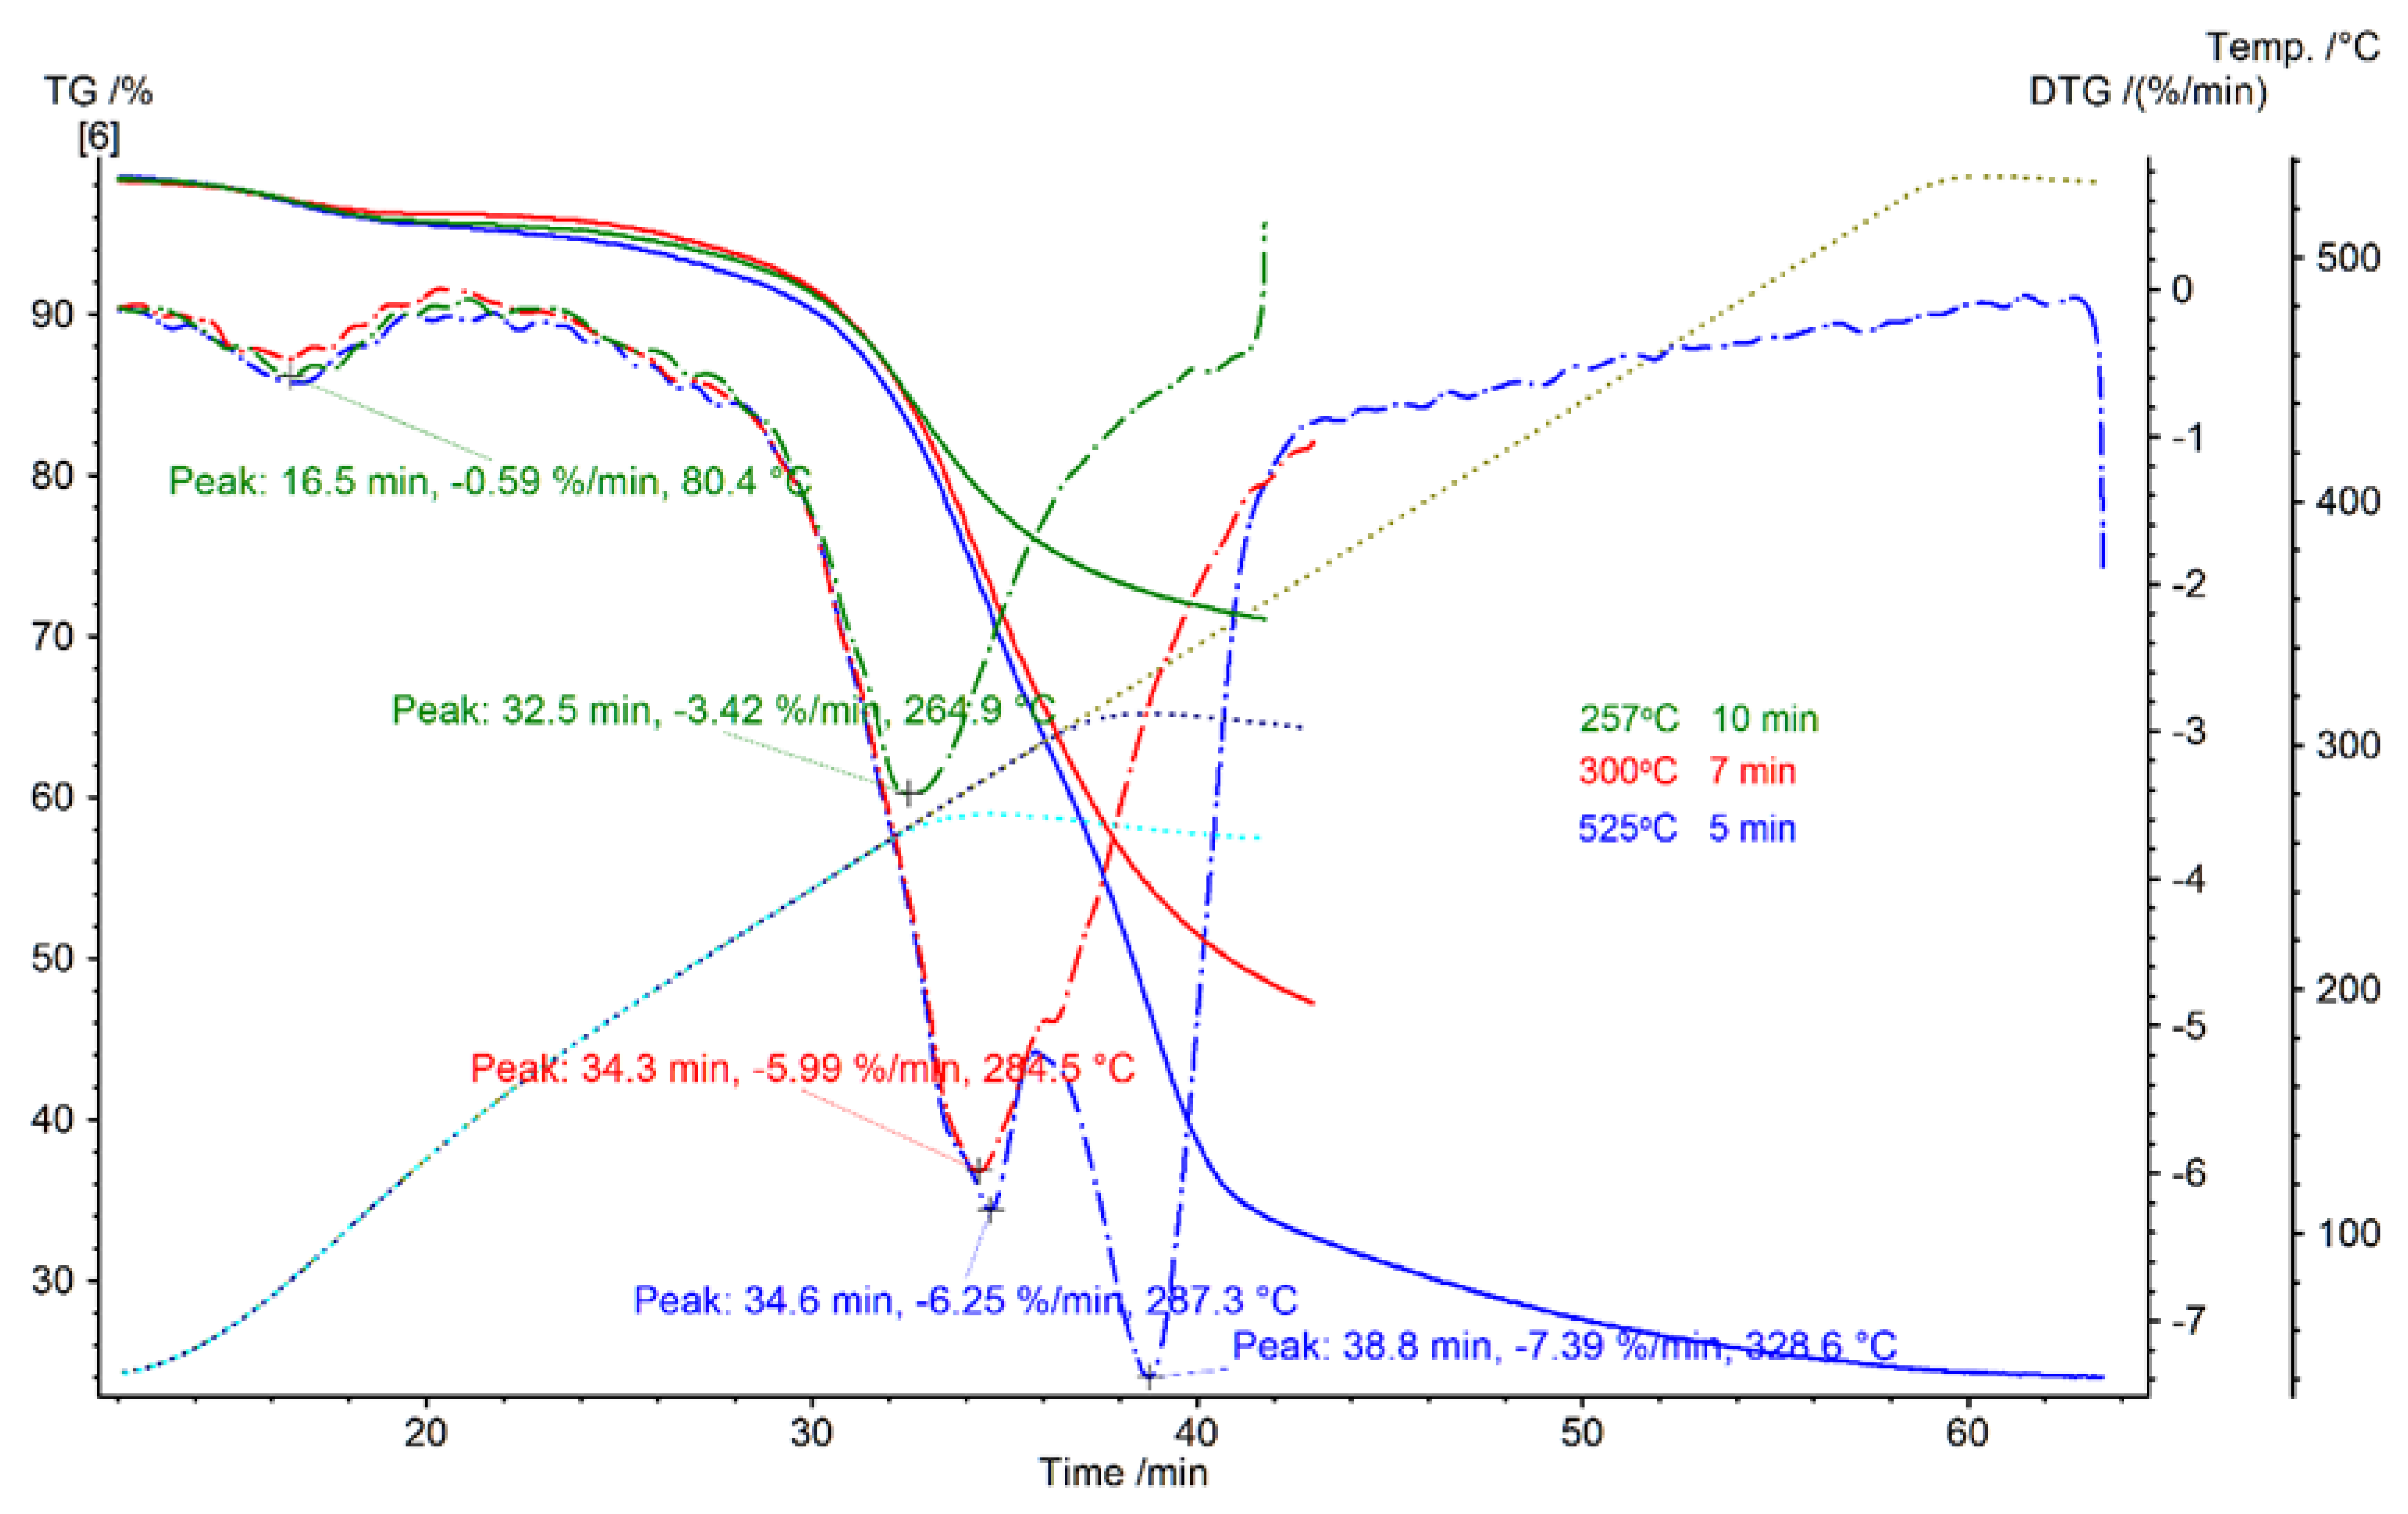
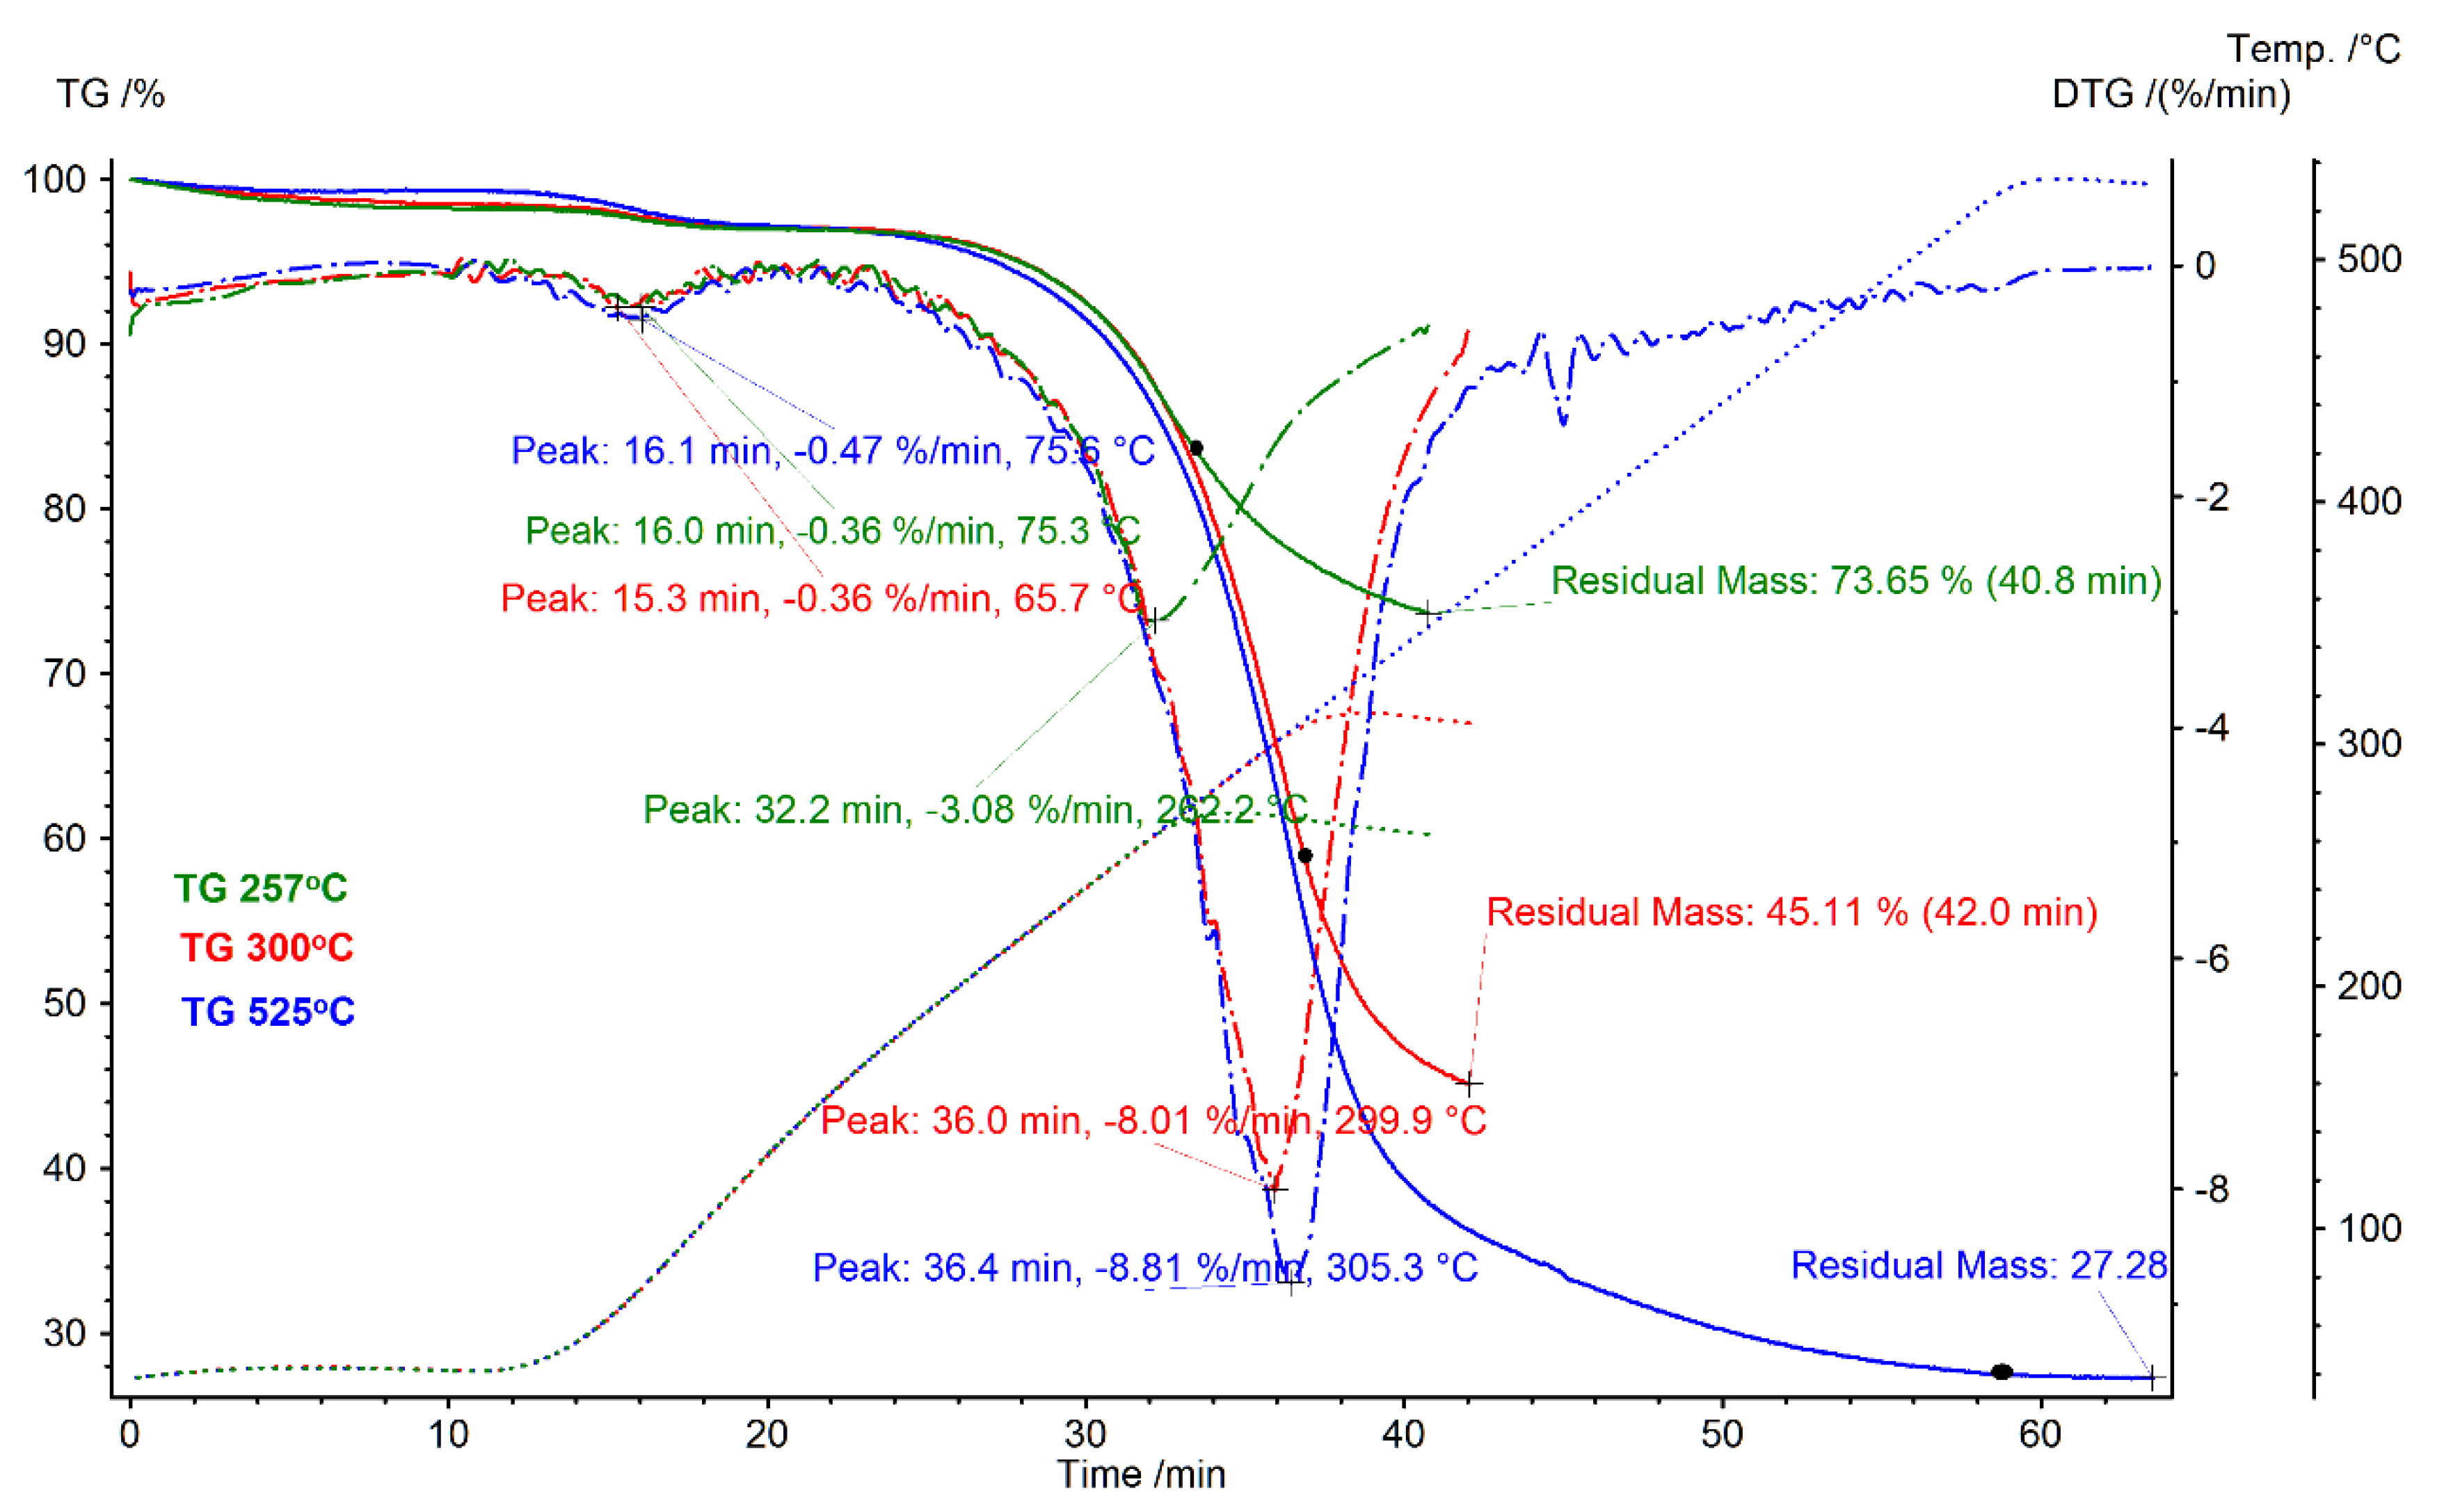
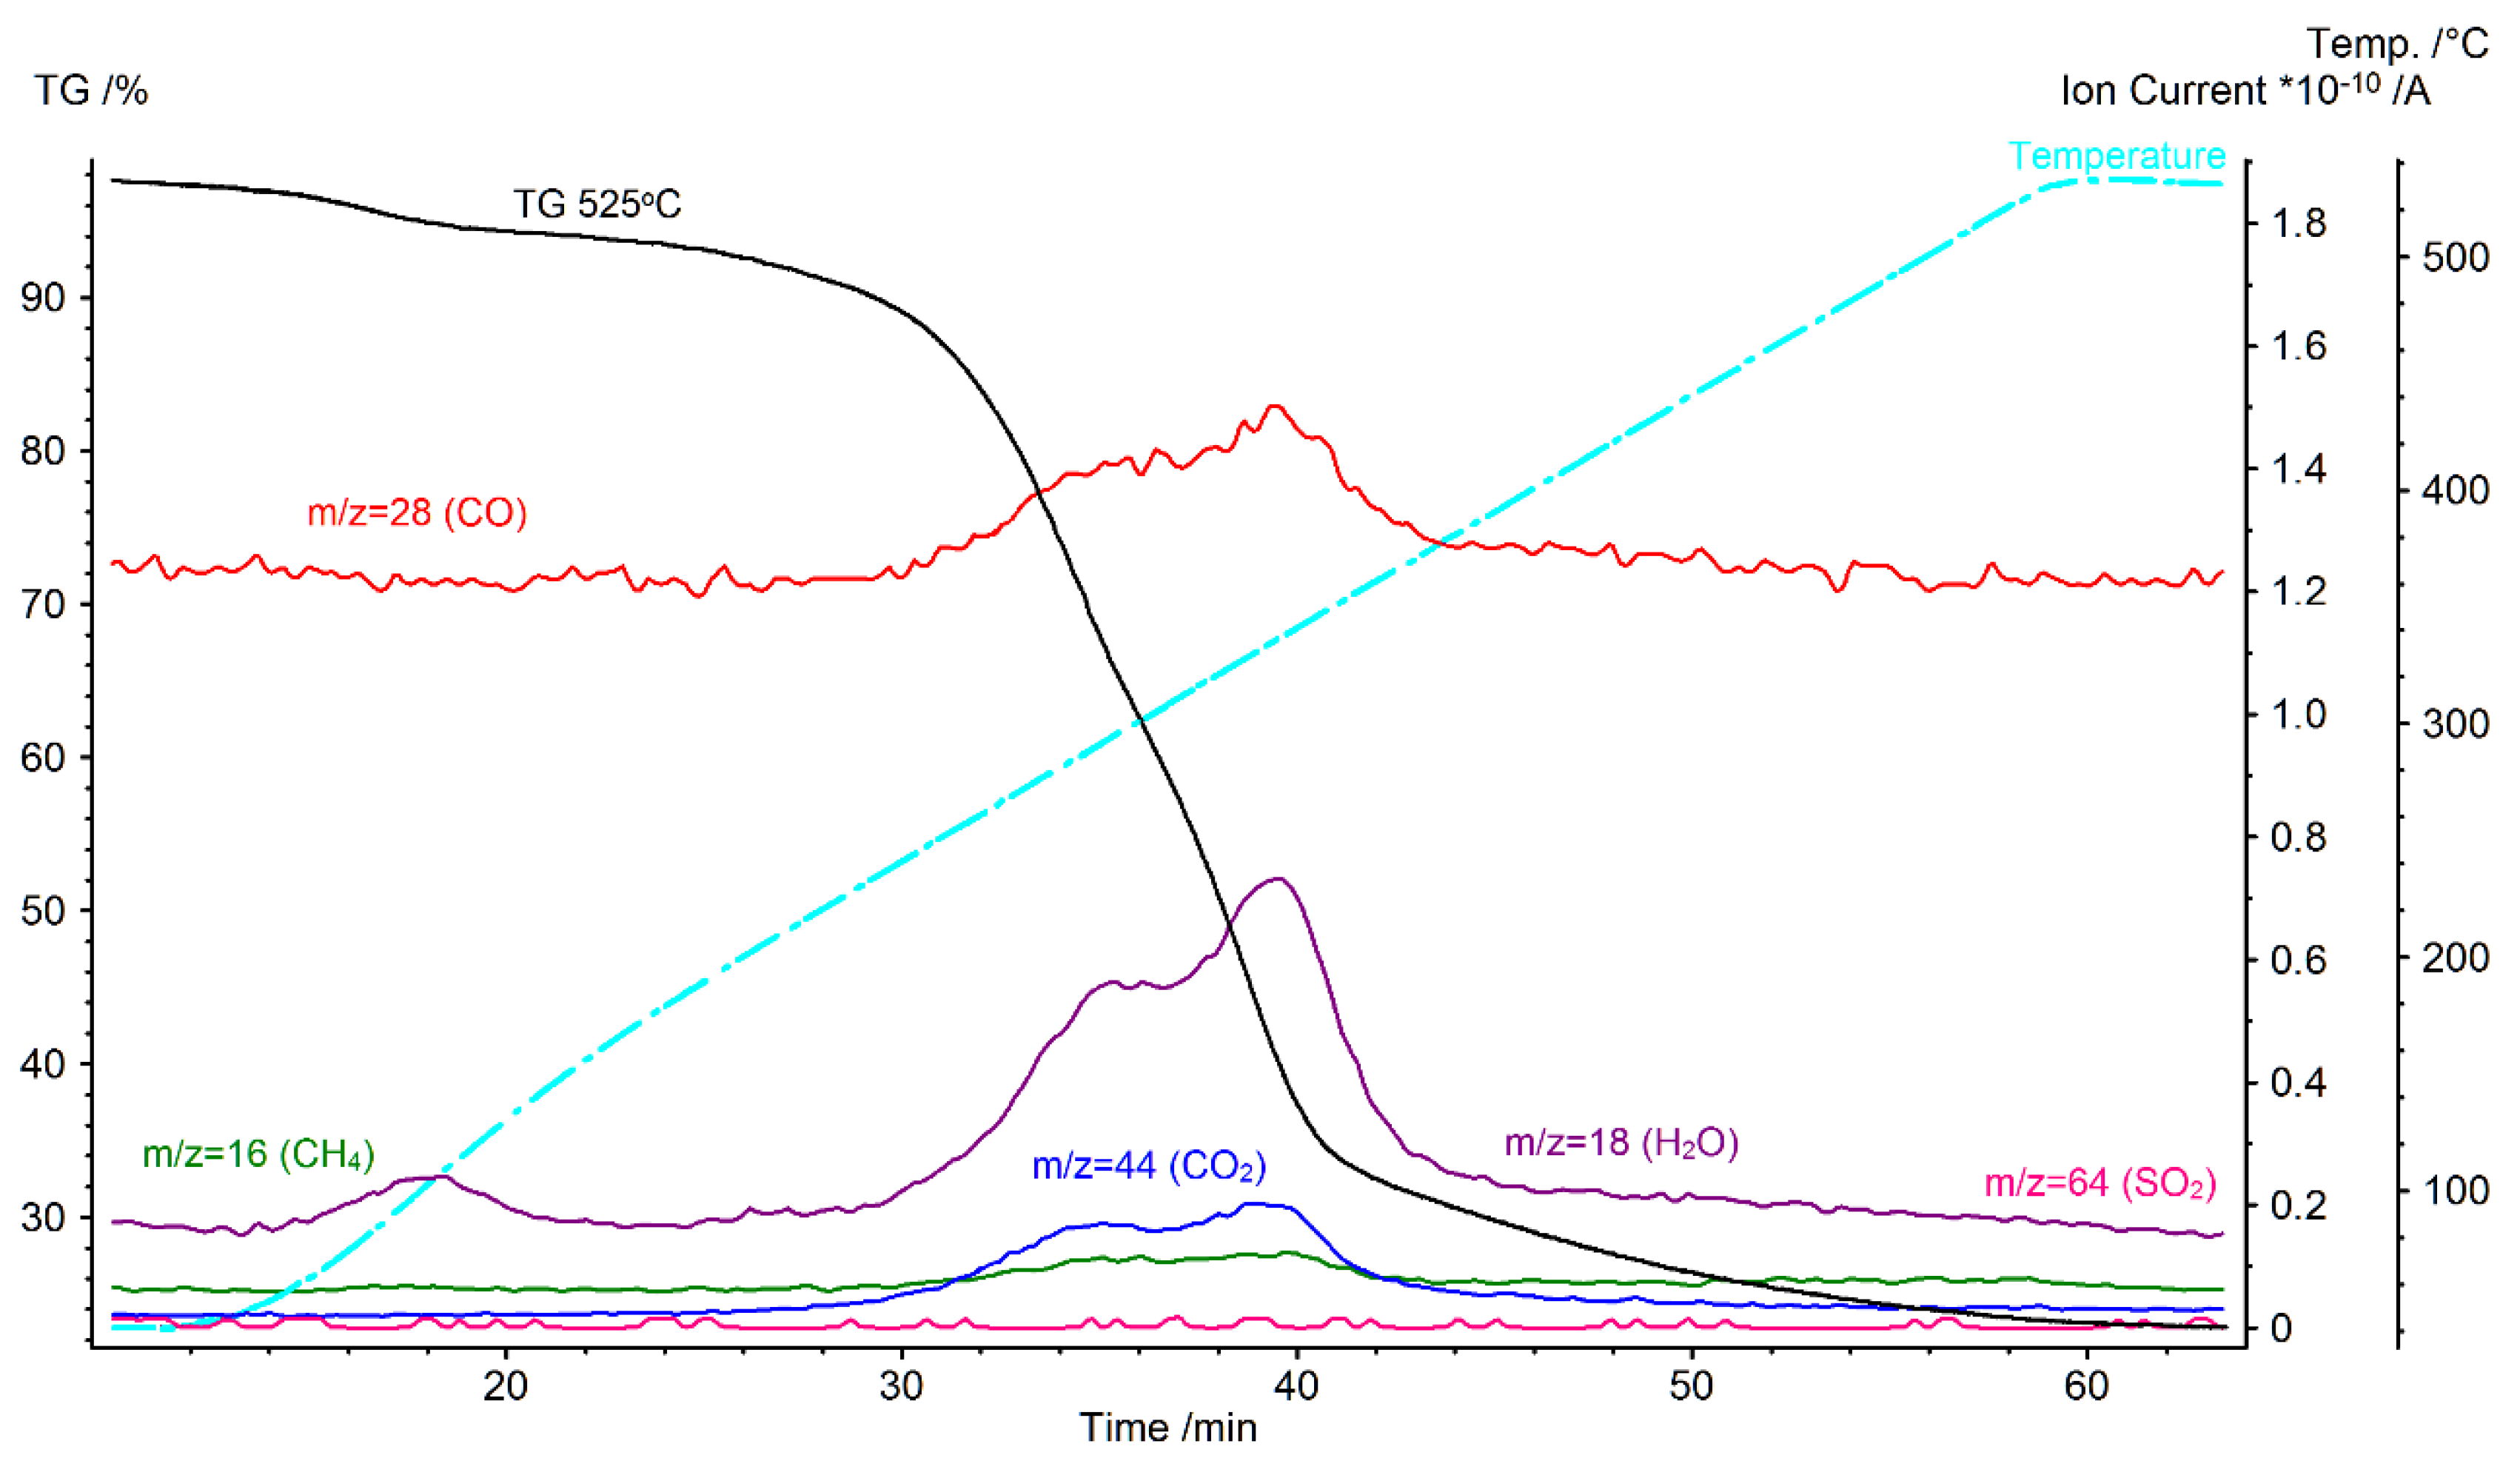
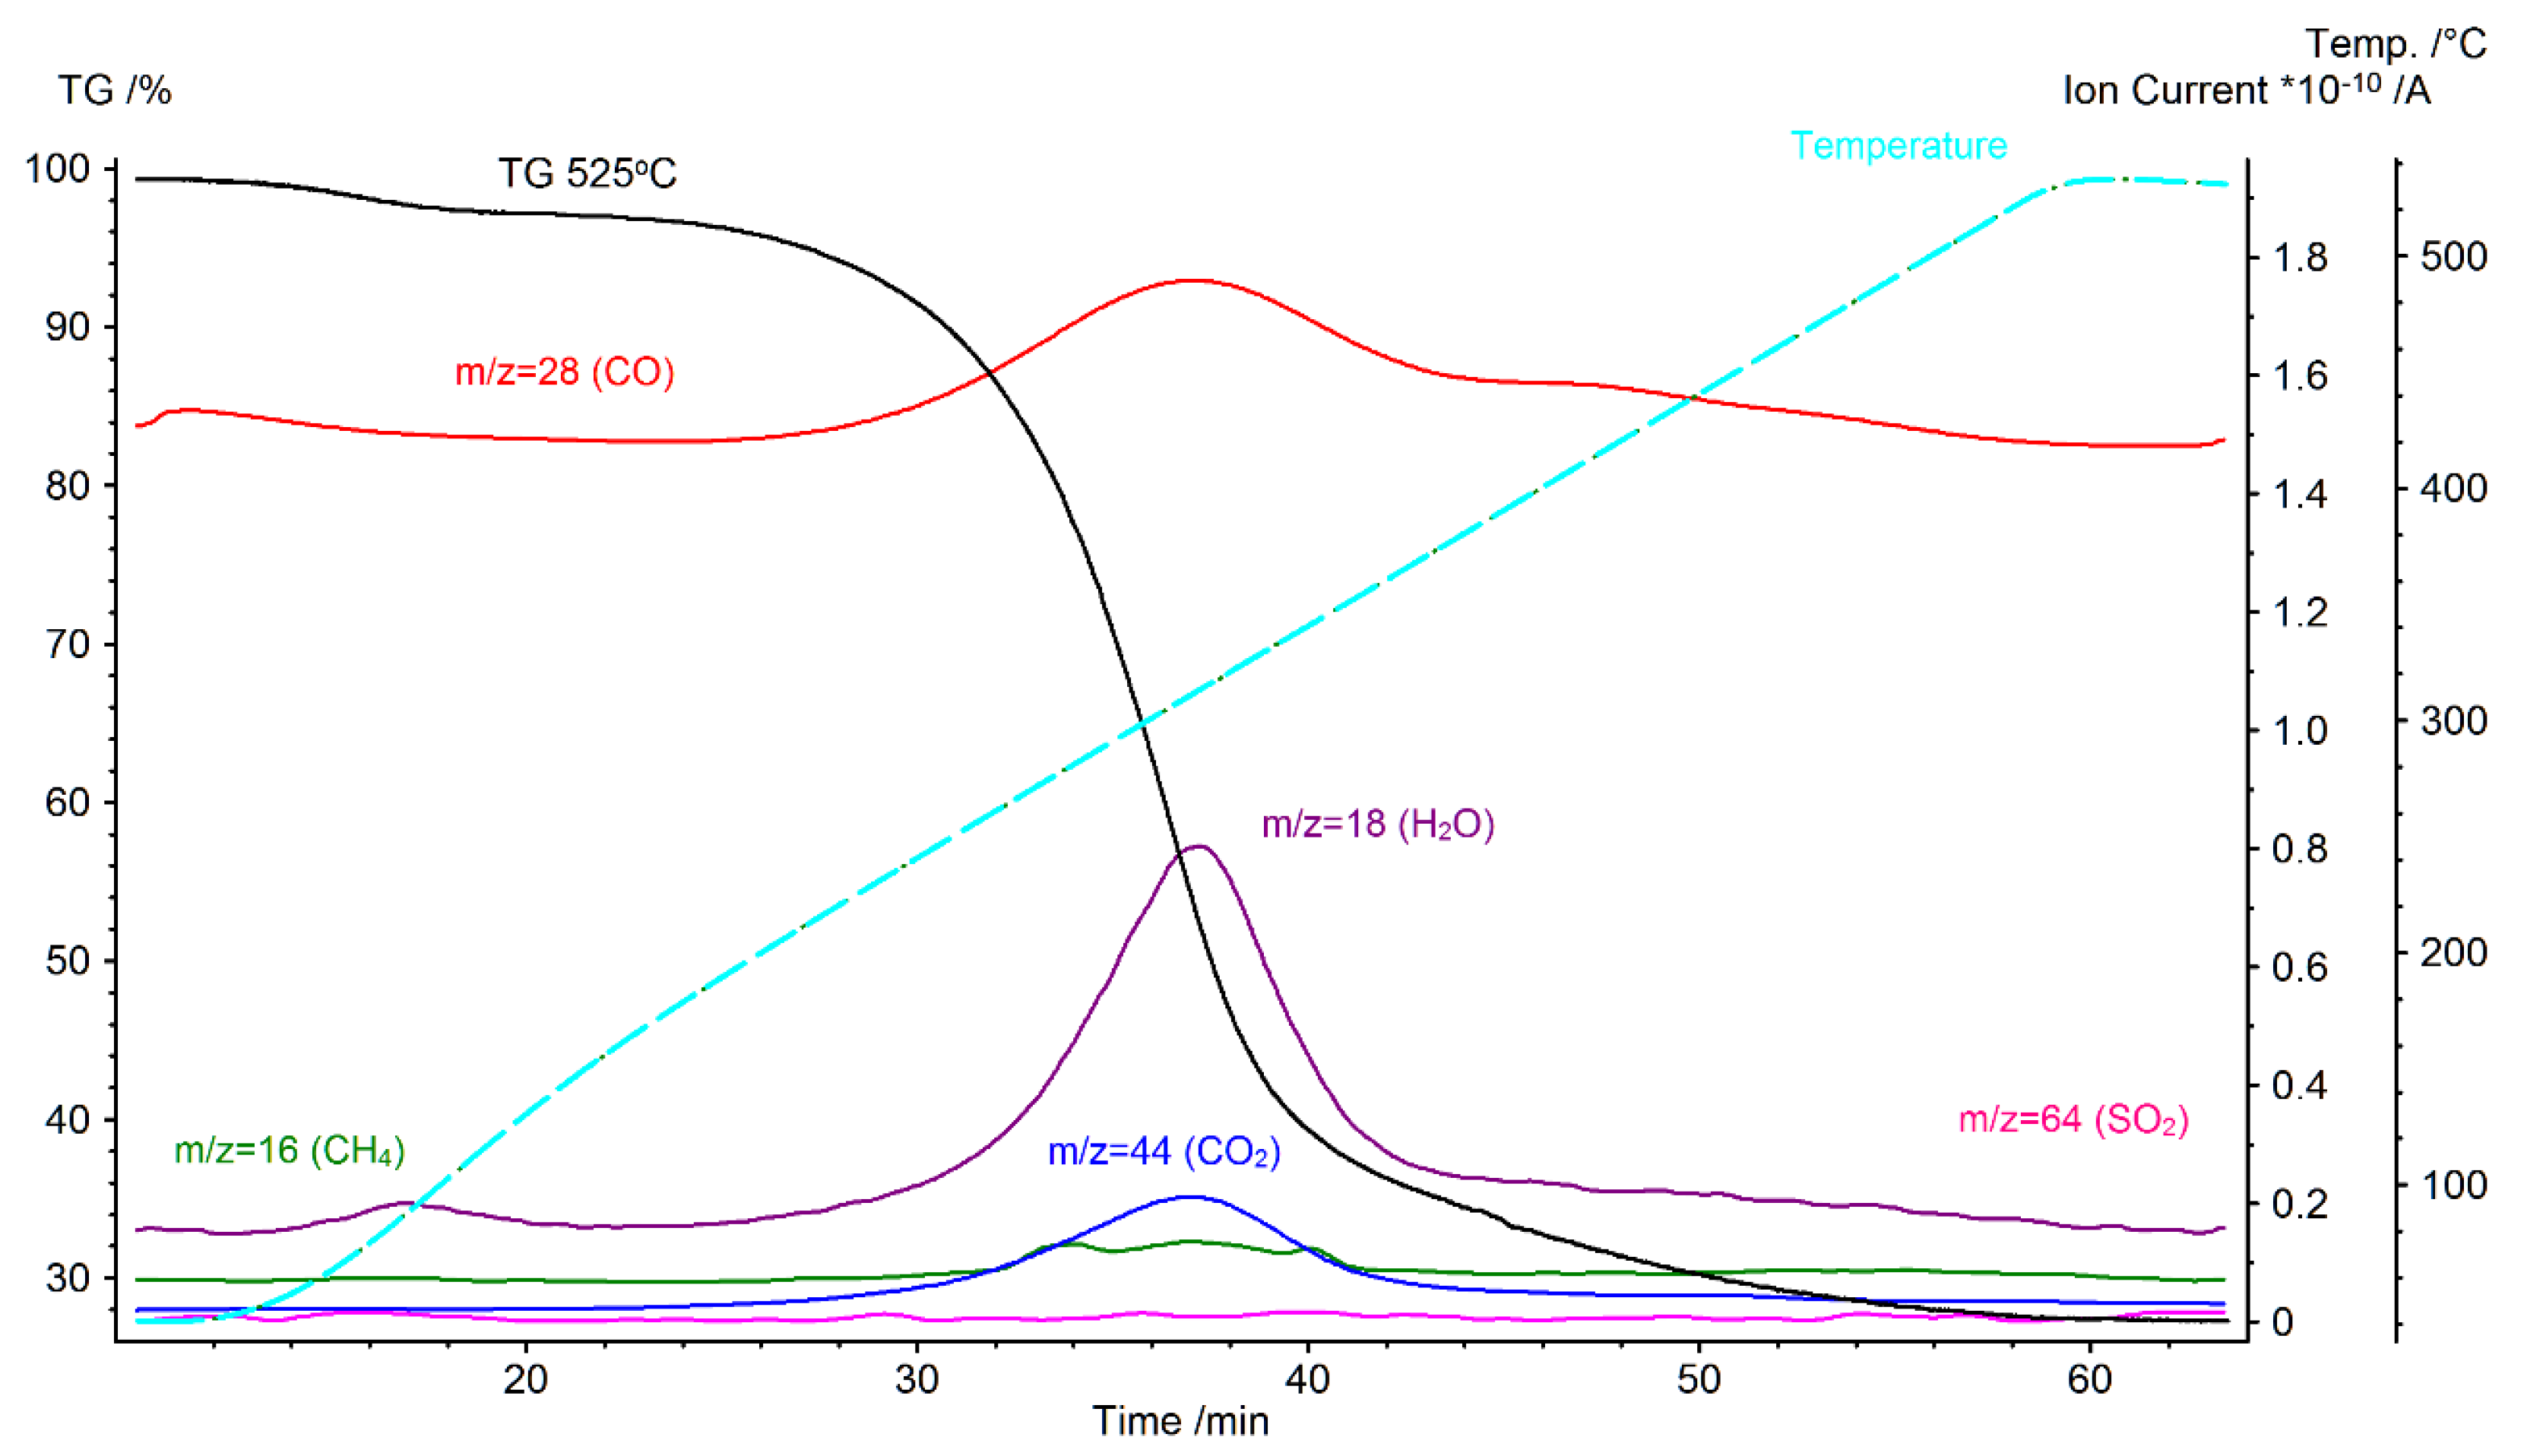
4.2. Thermogravimetric Analysis

Thermogravimetric Analysis of Oat Straw in N2 Atmosphere Using TGA Netzsch Tarsus 209 FC

Figure 11 represents the TG curves of an oat straw sample torrefied in a nitrogen atmosphere. The lower value in the weight fraction up to 110 °C was correlated with moisture loss. The beginning of the biomass torrefaction process could be observed at temperatures of approx. 257.5 °C upon the thermal degradation of the organic components contained within the oat straw. The thermal decomposition of the oat straw was finished at a temperature of approx. 420 °C [33]. On the next increase of temperature, it was observed that there was a specific tendency for a heating rate of 20 °C/min after 400 °C. This is due to the difference of ash content caused by the inhomogeneity of the samples. Overall, it is hard to determine the proper torrefaction temperature which represents the best technical and economic feasibility levels. A decrease in mass yield results in a lower energy yield [2]. Accordingly, in this work, a kinetic analysis of the torrefaction of oat and maize straw was conducted in a temperature range which led to a conversion level of 30% for use as a carbonized solid biofuel, 50% for use as a carrier for fertilizer, and 75% for use as a activated carbon, after the removal of the moisture. It is important to obtain the kinetic parameters to get information for the proper designing of the reactor [34]. In this publication the main goal of the performed research was not to describe the fundamental chemical mechanisms for torrefaction of oats and straw. This research focuses on the calculations of apparent kinetic parameters useful for the engineering design of chemical processes and further design stage of the continuous biomass regimental dryer and biomass torrefaction regimental reactor.

4.3. Elemental Analysis

The results of the elemental analysis of oat and maize straw before and after the thermo-chemical conversion process are shown in Table 3. It is obvious that the weight percentage of C in the biomass torrefaction process products rose with an enhancement in the straw torrefaction process temperature, as opposed to the weight percentages of CaH and O which showed a decreasing trend. This can be explained by the fact that dehydration occurs and de-carbonization during the agri-biomass torrefaction process. It is obvious that the emission of CO2, CO, or H2O will result in a decrease in the H and O contents of oats and maize straw. An increasing percentage of the carbon content is only due to a decrease in the oxygen content [35,36]. These observations prove that the torrefaction process increases the energy density of the oats and maize straw by removing oxygen. It was also found that the nitrogen content did not rise significantly while the chlorine and sulphur content did not change much with a growth in the torrefaction temperature. The rise of nitrogen can also be explained as the result of a relative increase due to a reduced level of oxygen.
On the Van Kravelen diagram (Figure 12) the modification in the O/C and H/C ratios with an increase in the oat and maize straw torrefaction process temperature can be seen. It was found that the O/C ratio goes down with rising torrefaction temperatures above 250 °C. A reduction in the O/C ratio during the torrefaction process is specific due to the formation of volatiles rich in oxygen, such as CO, CO2, and H2O. It can also be observed that the O/C ratios did not significantly change after 325 °C, as both C and O were lost in similar quantities through devolatilization of hydrocarbon ingredients. Another important issue is that from the torrefaction products in a solid fuel perspective the H/C ratio reduced with rising temperatures above 250 °C, while it only changed imperceptibly after 325 °C, as in the case of the O/C ratio. It can be explained that the carbon content increased relatively compared to other elements with the decrease of oxygen at temperatures of 250–325 °C, and hydrocarbon gases containing hydrogen formed above 325 °C [37,38]. The main reason for the reduction in the O/C ratio during the torrefaction process is the formation of volatiles enriched in oxygen such as H2O and CO2. However, more important to the higher initial value of the O/C ratio is the possibility that the highest O/C value of maize straw and oat straw after the carbonization process might be caused by the fact that there is devolatilization of cellulose and lignin, in addition to devolatilization of hemicellulose. In the end, the O/C ratio did not change significantly since both C and O amounts decrease in comparable quantities through the devolatilization process. The differences between the O/C ratios due to the torrefaction process in isothermal condition residence time were not significant, regardless of temperature [2,10].

4.4. Mass Yield, Energy Yield, Volatile Fraction, Higher Heating Value, and Ash Content

The trajectory of the oat straw torrefaction process curves shown in Figure 11 in the case of each of the torrefaction process curves in the drawing with green points shows the end of the heating process and the beginning of holding the torrefied material at a specified temperature. As can be seen in the case of the maize straw torrefaction process carried out up to 420 °C during 10 min of holding, the sample mass reduction was 83.93%. During storage at 525 °C the mass decreased by 0.3%, as can be seen from the analysis of the trajectory of the curves presented at 525 °C. The material has already been completely degassed to illustrate the course of the process under study, and a set of TG–DTG curves is provided together with the set maximum process speeds (minima on DTG curves). Energy yield per dry raw biomass indicates the total energy preserved in the torrefied biomass. This was calculated from mass yield and higher heating values using Equation (9) and expressed as a percentage of energy content of untreated dry biomass.
Mass   Yield   Ymass   ( % ) = m t o r r e f i e d m i n i t i a l   dry   basis   *   100 %
where: mtorrefied = mass of biomass feedstock measured after torrefaction expressed on dry basis, minitial = mass of untreated (raw) biomass feedstock measured before torrefaction expressed on dry basis.
Energy   Yield   Y energy   ( % ) = Y m a s s *   H H V t o r r e f i e d   s a m p l e H H V r a w   s a m p l e   dry   basis   *   100 %
where, Etorrefied = specific energy content of biomass feedstock after torrefaction expressed on dry basis, Einitial—dry basis = specific energy content of biomass feedstock before torrefaction expressed on dry basis.
As can be seen in Figure 13, the initial evaporation of moisture from the sample is the fastest around 80 °C. In the case of torrefaction to 257 °C, the maximum process speed is 3.42 %/min at a temperature of approx. 265 °C (maximum instantaneous temperature of this process during stabilization to 257.5 °C). For maize straw torrefaction up to 300 °C, the maximum process speed is 5.99 %/min at a temperature 284.5 °C, and in the case of torrefaction up to 525 °C, the maximum process speed is 7.39 %/min at a temperature of 329 °C, with an additional minimum of 287 °C visible on the DTG curve (6.25 %/min) which indicates a two-stage distribution of the tested biomass.
The trajectory of torrefaction curves shown in Figure 13, in the case of each of the torrefaction process curves in the drawing with blue points, shows the end of the heating process and the beginning of holding the torrefied material at a specified temperature. As can be seen in the case of the oat straw torrefaction process carried out up to 257 °C during 10 min of holding, the sample mass reduction was 10.62% when kept for 6 min at 300 °C, the weight reduction was 11.68%, while during storage at 525 °C the mass decreased by 0.13%, and as can be seen from the analysis of the trajectory of the curves presented at 525 °C the material has already been completely degassed to illustrate the course of the process under study. A set of TG-DTG curves is provided together with a set of maximum process speeds (minima on DTG curves). As can be seen in Figure 14, the initial evaporation of moisture from the oat straw sample is the fastest around 70 °C in the case of torrefaction to 257 °C, and the maximum process speed is 3.08 %/min at a temperature of approx. 262 °C (maximum instantaneous temperature of this process during stabilization to 257.5 °C). For oat straw torrefaction up to 300 °C, the maximum process speed is 8.01%/min at a temperature around 300 °C, and in the case of torrefaction up to 525 °C, the maximum process speed is 8.81 %/min at a temperature of 305 °C.
In this paper, the torrefaction process of oat and maize straw was performed to find the optimal torrefaction temperature for different industrial applications such as fuel and as an additive for natural fertilizers and activated carbon [39,40]. The experiments with respect to torrefaction temperature were conducted at temperatures of 250–525 °C. In most of the available publications the torrefaction process is commonly performed at temperatures of around 250–300 °C, and the thermal treatment above 300 °C is referred to as pyrolysis. The HHV both for oat and maize straw of all samples rises with the increasing torrefaction temperature. A visible rise in the HHV up to 400 °C is related to the removal of oxygen and hydrogen. A rise in the temperature above 500 °C shows a reduction in the HHV. This can be explained by the fact that the pyrolysis reaction occurred at a higher temperature above 450 °C. Calculations of the energy yields are useful measures during the torrefaction process of oat and maize straws. They can be derived from the mass yield, as was done by Bridgeman et al. [11]. In this paper, the energy yield decreased slowly from 92% to 35% with a rise in the temperature of the biomass torrefaction process. The energy yield delivered in this study is based on the HHV [2]. The same procedure like for biomass torrefaction process of oat straw was was done for maize straw Figure 15a–c. The lowest mass reduction for oat straw occurs at a temperature of 257.5 °C and holding time 5 min, and it represented 19.44% of the untreated oat straw (Figure 16a). At a 257.5 °C temperature regime it was found that a holding time of 10 min represents the closest to 30% mass loss, 24.21%, which is expected for torrefaction products used as a fuel. Mass reduction of oat straw during a torrefaction process at 300 °C shows the closest to a 50% mass reduction during the experiment when the sample was held for 6 min and mass loss corresponding to this resident time was 48.98%. These are the input data that were used to calculate the profitability of using torrefied oat straw and straw from maize as additives to organic fertilizers. It is essential for the economy [40,41,42,43,44,45] of the overall torrefaction process that there is a high carbonization rate correlated with a low energy input for the process. Therefore, it was assumed that oat and maize straw use after the torrefaction process as additives for natural fertilizers should not exceed 50% of the mass reduction and the holding time to achieve it should be the lowest as possible. For the production of activated carbon, it was assumed that the mass loss should not exceed 75%, and during an oat straw torrefaction process at 525 °C it was found that the shortest residence time so as not to exceed this mass reduction was 6 min.
In Figure 16a–c the mass residua of oat straw torrefaction products are shown proceeding in three temperatures, 257.5, 300 and 525 °C, in different holding times under isothermal conditions (from 5 to 10 min) using three different heating rates, 5, 10, and 20 K/min. Thanks to the use of three different heating ratios, data were confirmed on the elemental composition and thermal stability of the isotherm research material. Thanks to analysis performed at three temperatures of 525 °C (process conditions for activated carbon), 300 °C (biocarbon for carrier of natural bio-fertilizer) and 257.5 °C (carbonized solid biofuel), it can be concluded that the mass loss ratio rises with the length of the isotherm in each case. A change can be seen in the sample at 300 °C, which represents very large variance between the values before and after biomass torrefaction process—max. (before) 52.04% and min. (after) 21.28%. Nevertheless, at a temperature of 257.5 °C the residual masses are the largest of all three temperatures. This is a very good example showing the reduction in mass with increase of temperature, and the per cent of mass of the biomass at 525 °C is the lowest of all measurements. At 257.5 and 525 °C, as the isotherm time increases, a slight increase in weight loss is noted. During extension of the isotherm at 300 °C, the mass of oat straw decreases. This research presents the preservation of straw mass from oats and maize after thermogravimetric analysis. Samples with maize straw and oats were subjected to dynamic and isothermal measurements at a 10 K/min heating rate. Thanks to that, information on thermal stability and the elemental composition of the isotherm research material were obtained, divided into five samples, from 5 to 10 min, according to the measurements found at three temperatures of 525, 300, and 257.5 °C [1].
This work presents a thermogravimetric analysis of oat and maize straw. We subjected biomass to dynamic and isothermal measurements. Maize straw was subjected to thermal analysis, which includes measuring the change in sample mass depending on temperature or time. The change in sample mass depends on the temperature or time dm/dt and is recorded by means of a thermogravimetric curve. TGA maize straw results were compared with oat straw TGA analysis. We divided isotherms into 5 parts with lengths of 5, 6, 7, 8, 9, and 10 min at three different heating rates, 5, 10, and 20 K/min. Our sample consisted of five maize elements: crumb, bark, leaves, grains from the cob and stigmas of corn stalks. According to the measurements found at three temperatures of 525, 300, and 257.5 °C for both types of straw, it could be found that the mass loss ratio rises with the length of the isotherm in each case. For maize straw at 300 °C, the weight loss value for the 5-min isotherm is 43.22%, and for 10 min under isothermal conditions the mass loss was 51.89%. In the case of oat straw and 300 °C temperature, this loss is slightly larger, because for 5 min under isothermal conditions the weight loss was 47.96% and for 10 min it was 78.72% Other results were obtained in the analysis of oat straw, because at a temperature of 257.5 °C the weight loss is proportional to the isothermal time and is estimated to be a difference of about 5%. During the extension of the isotherm at 300 °C, the mass of straw from maize and oats dropped sharply (in the case of oats in higher values). Therefore, we dare say that not every temperature and type of biomass lengthening of the isotope results in a sudden change in mass. Oat straw is a biomass more susceptible to the effects of low temperatures than straw from maize. We presented the TGA result in the form of a curve in which the mass is plotted depending on the temperature. To supplement the chart with more accurate data, we used the first derivative graph, which illustrates the speed of change in sample mass during the measurement. This curve clearly shows the maxima and minima that correspond to the changes in mass. In addition, we made a bar chart containing the results of all 18 measurements. This presents the weight loss at each temperature and isotherms in percentage form.

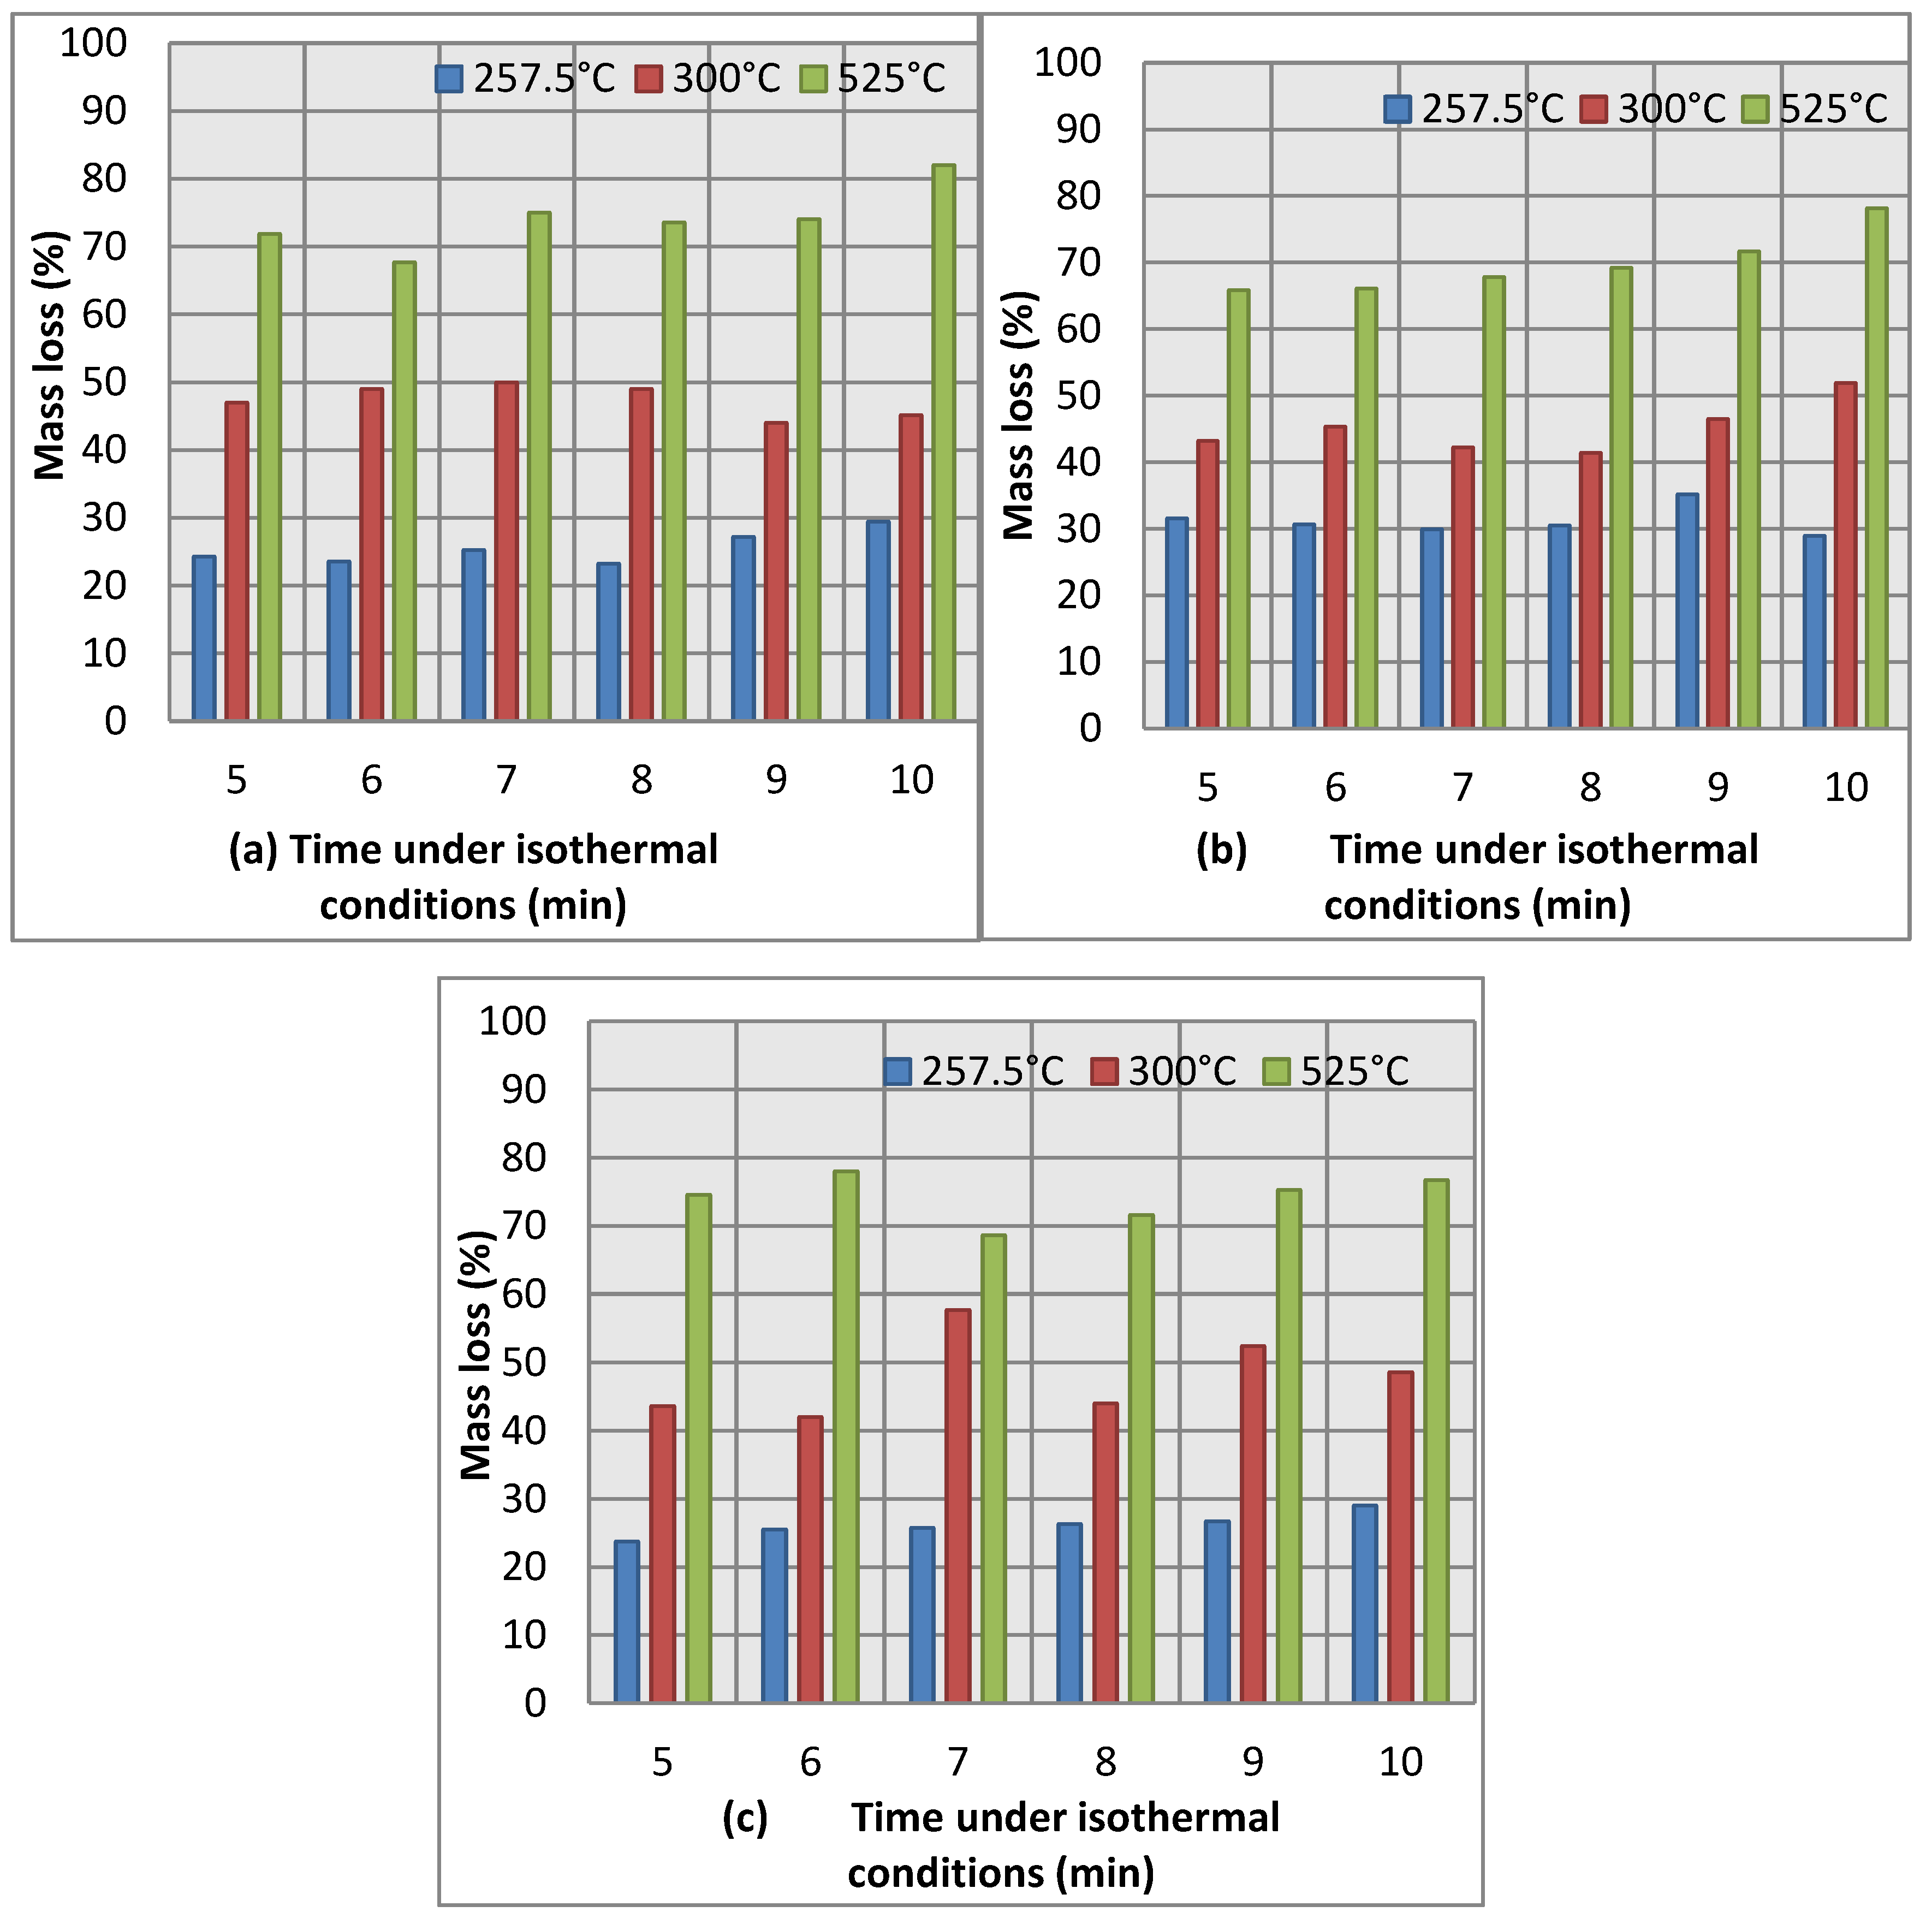
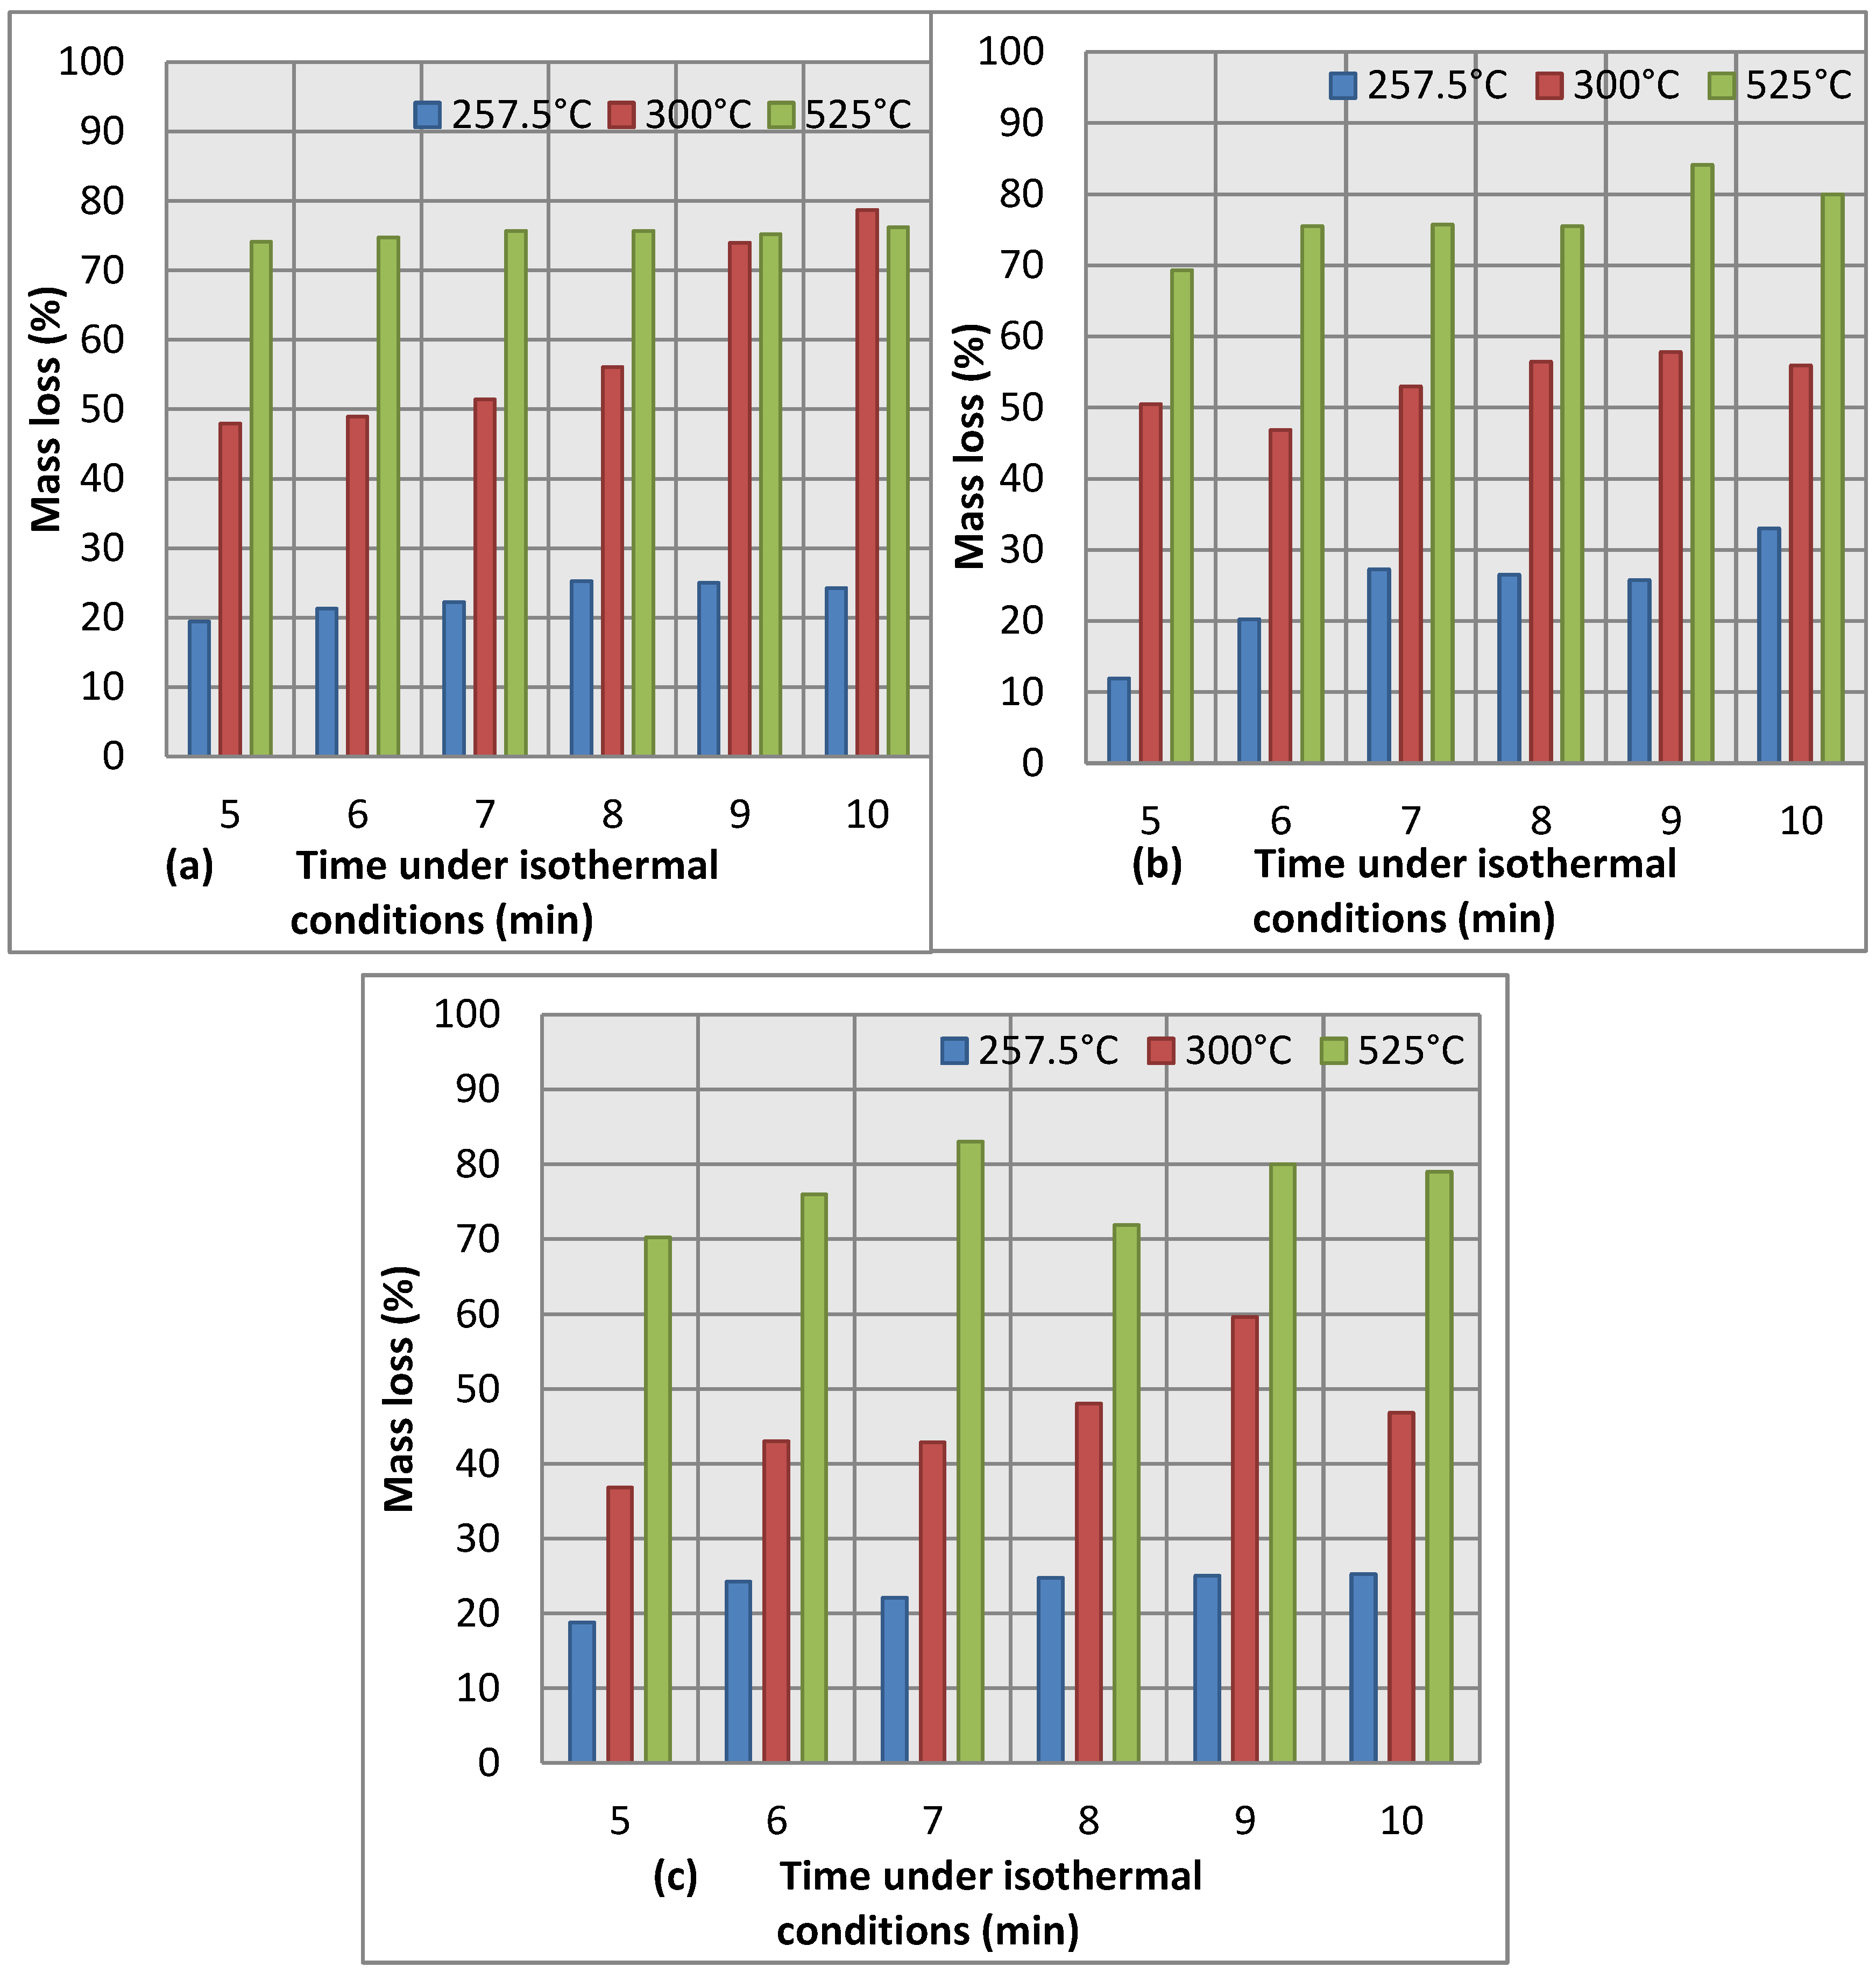
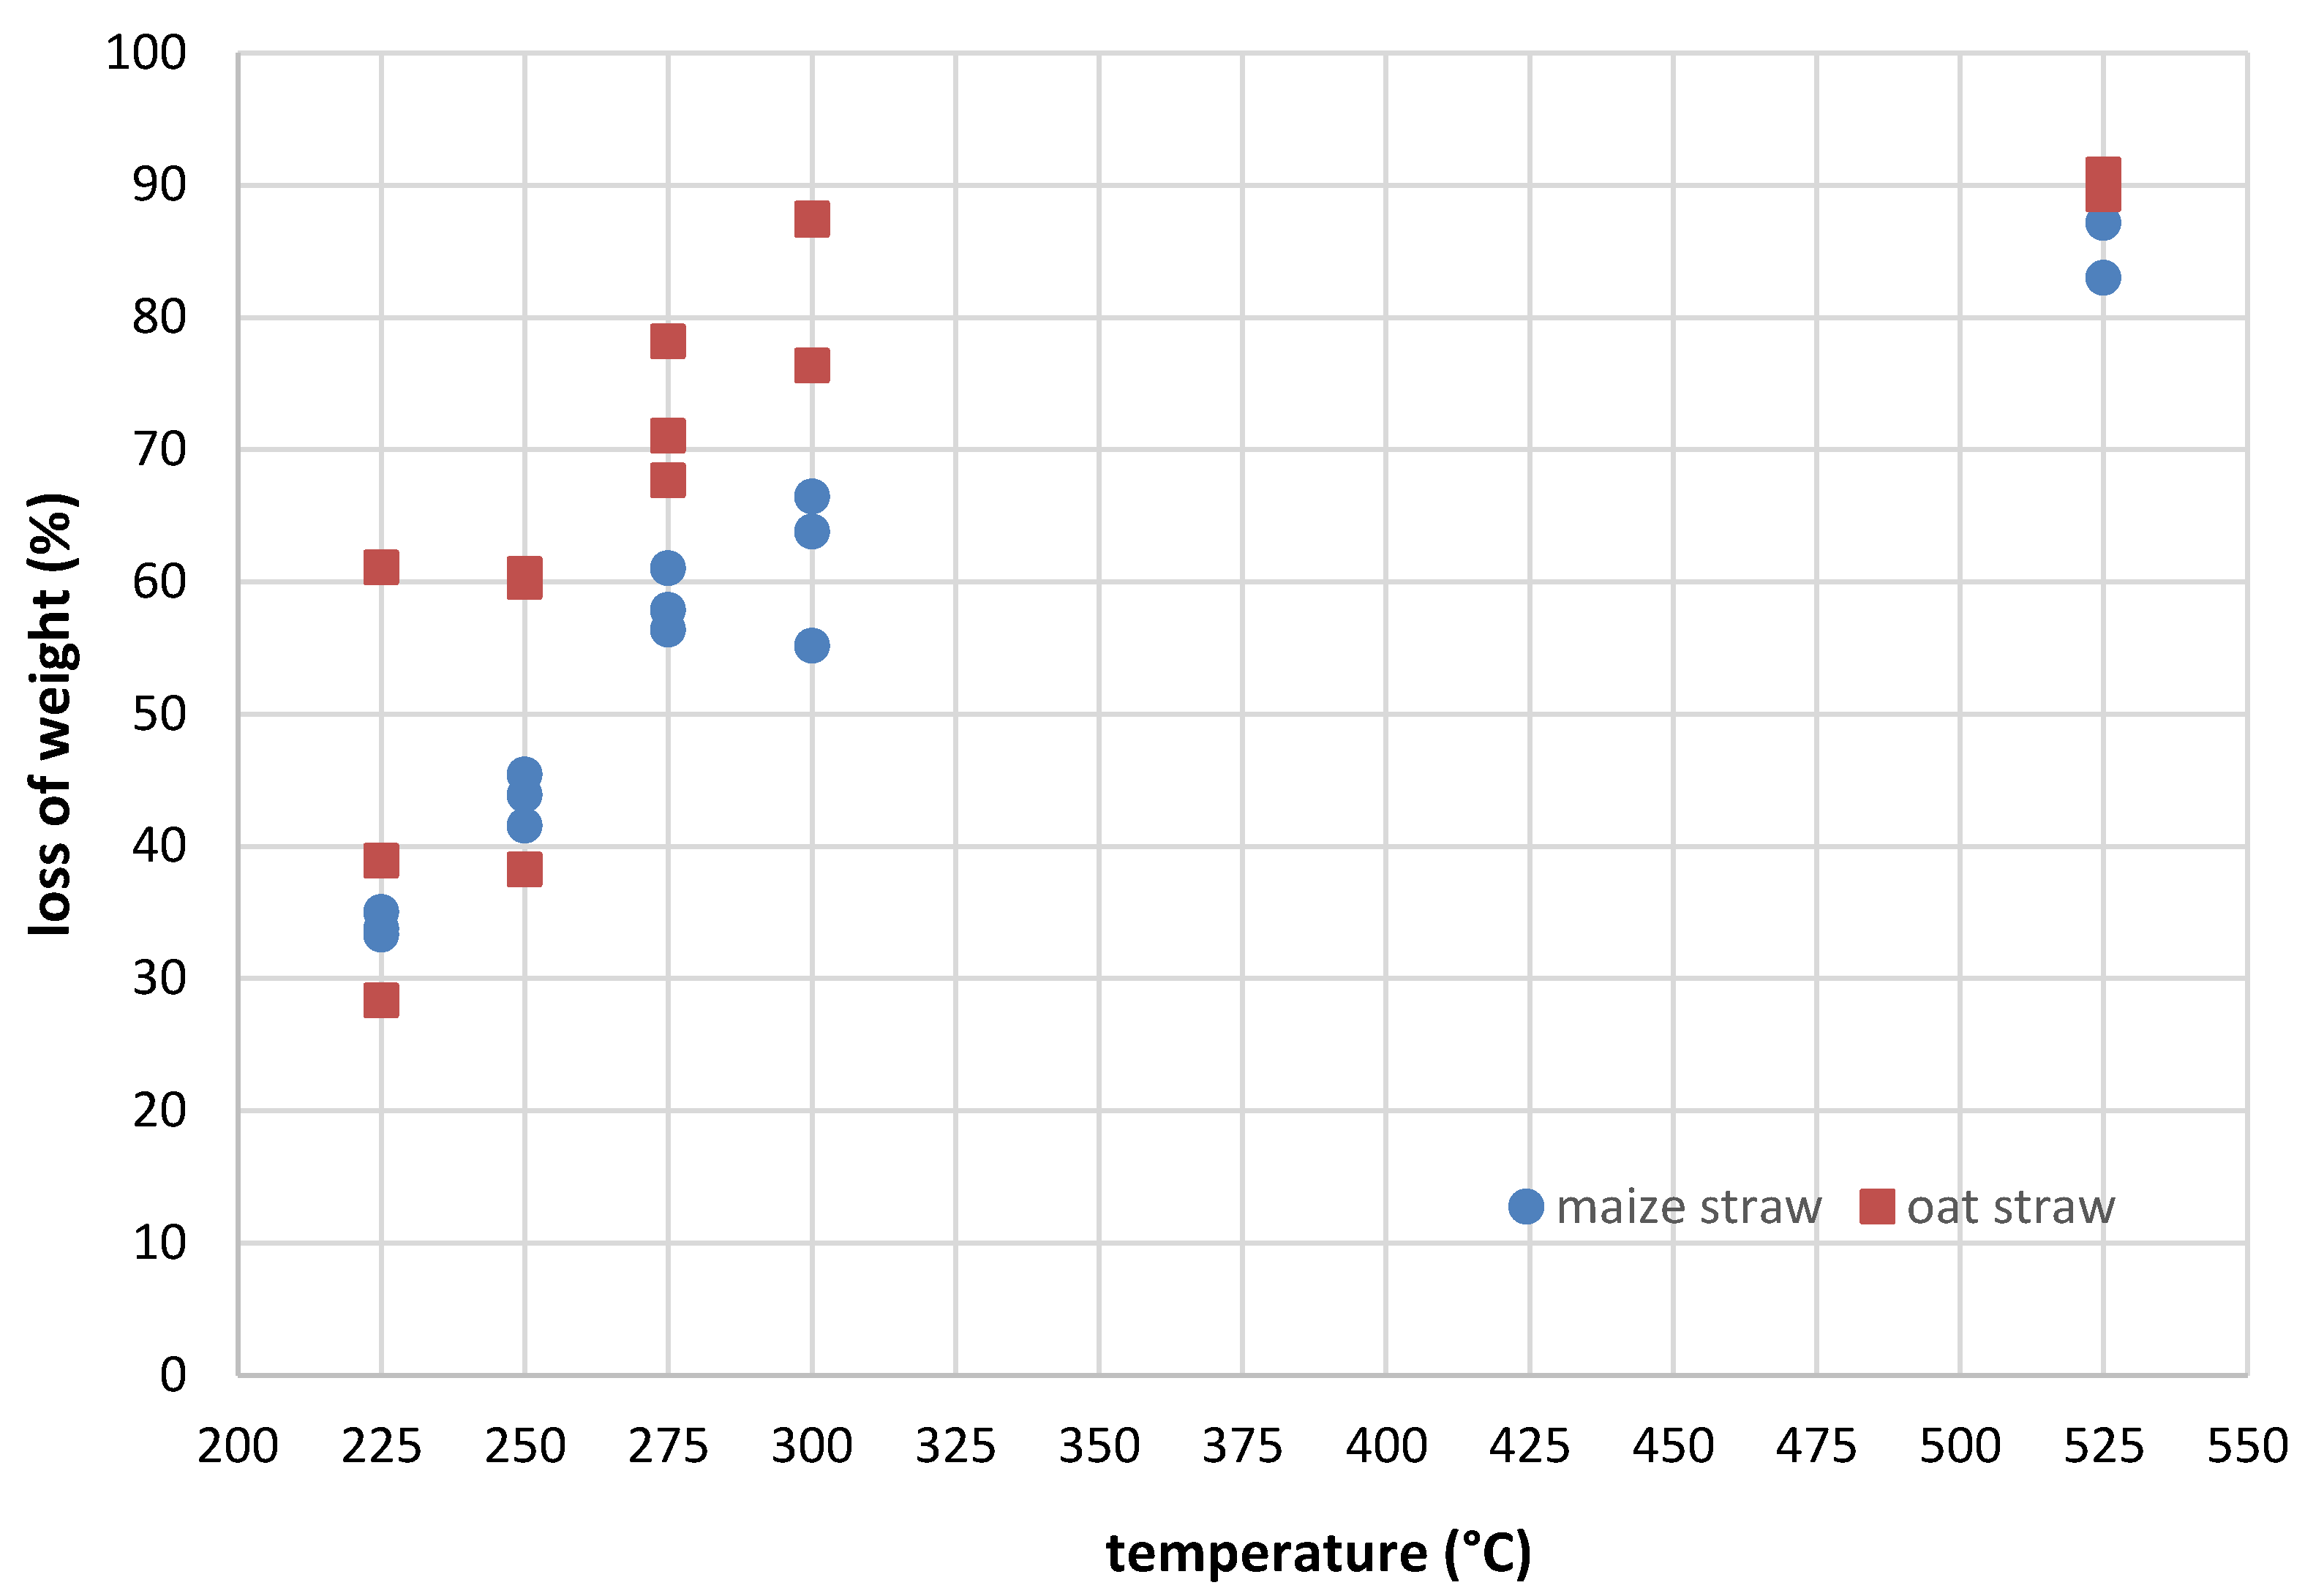
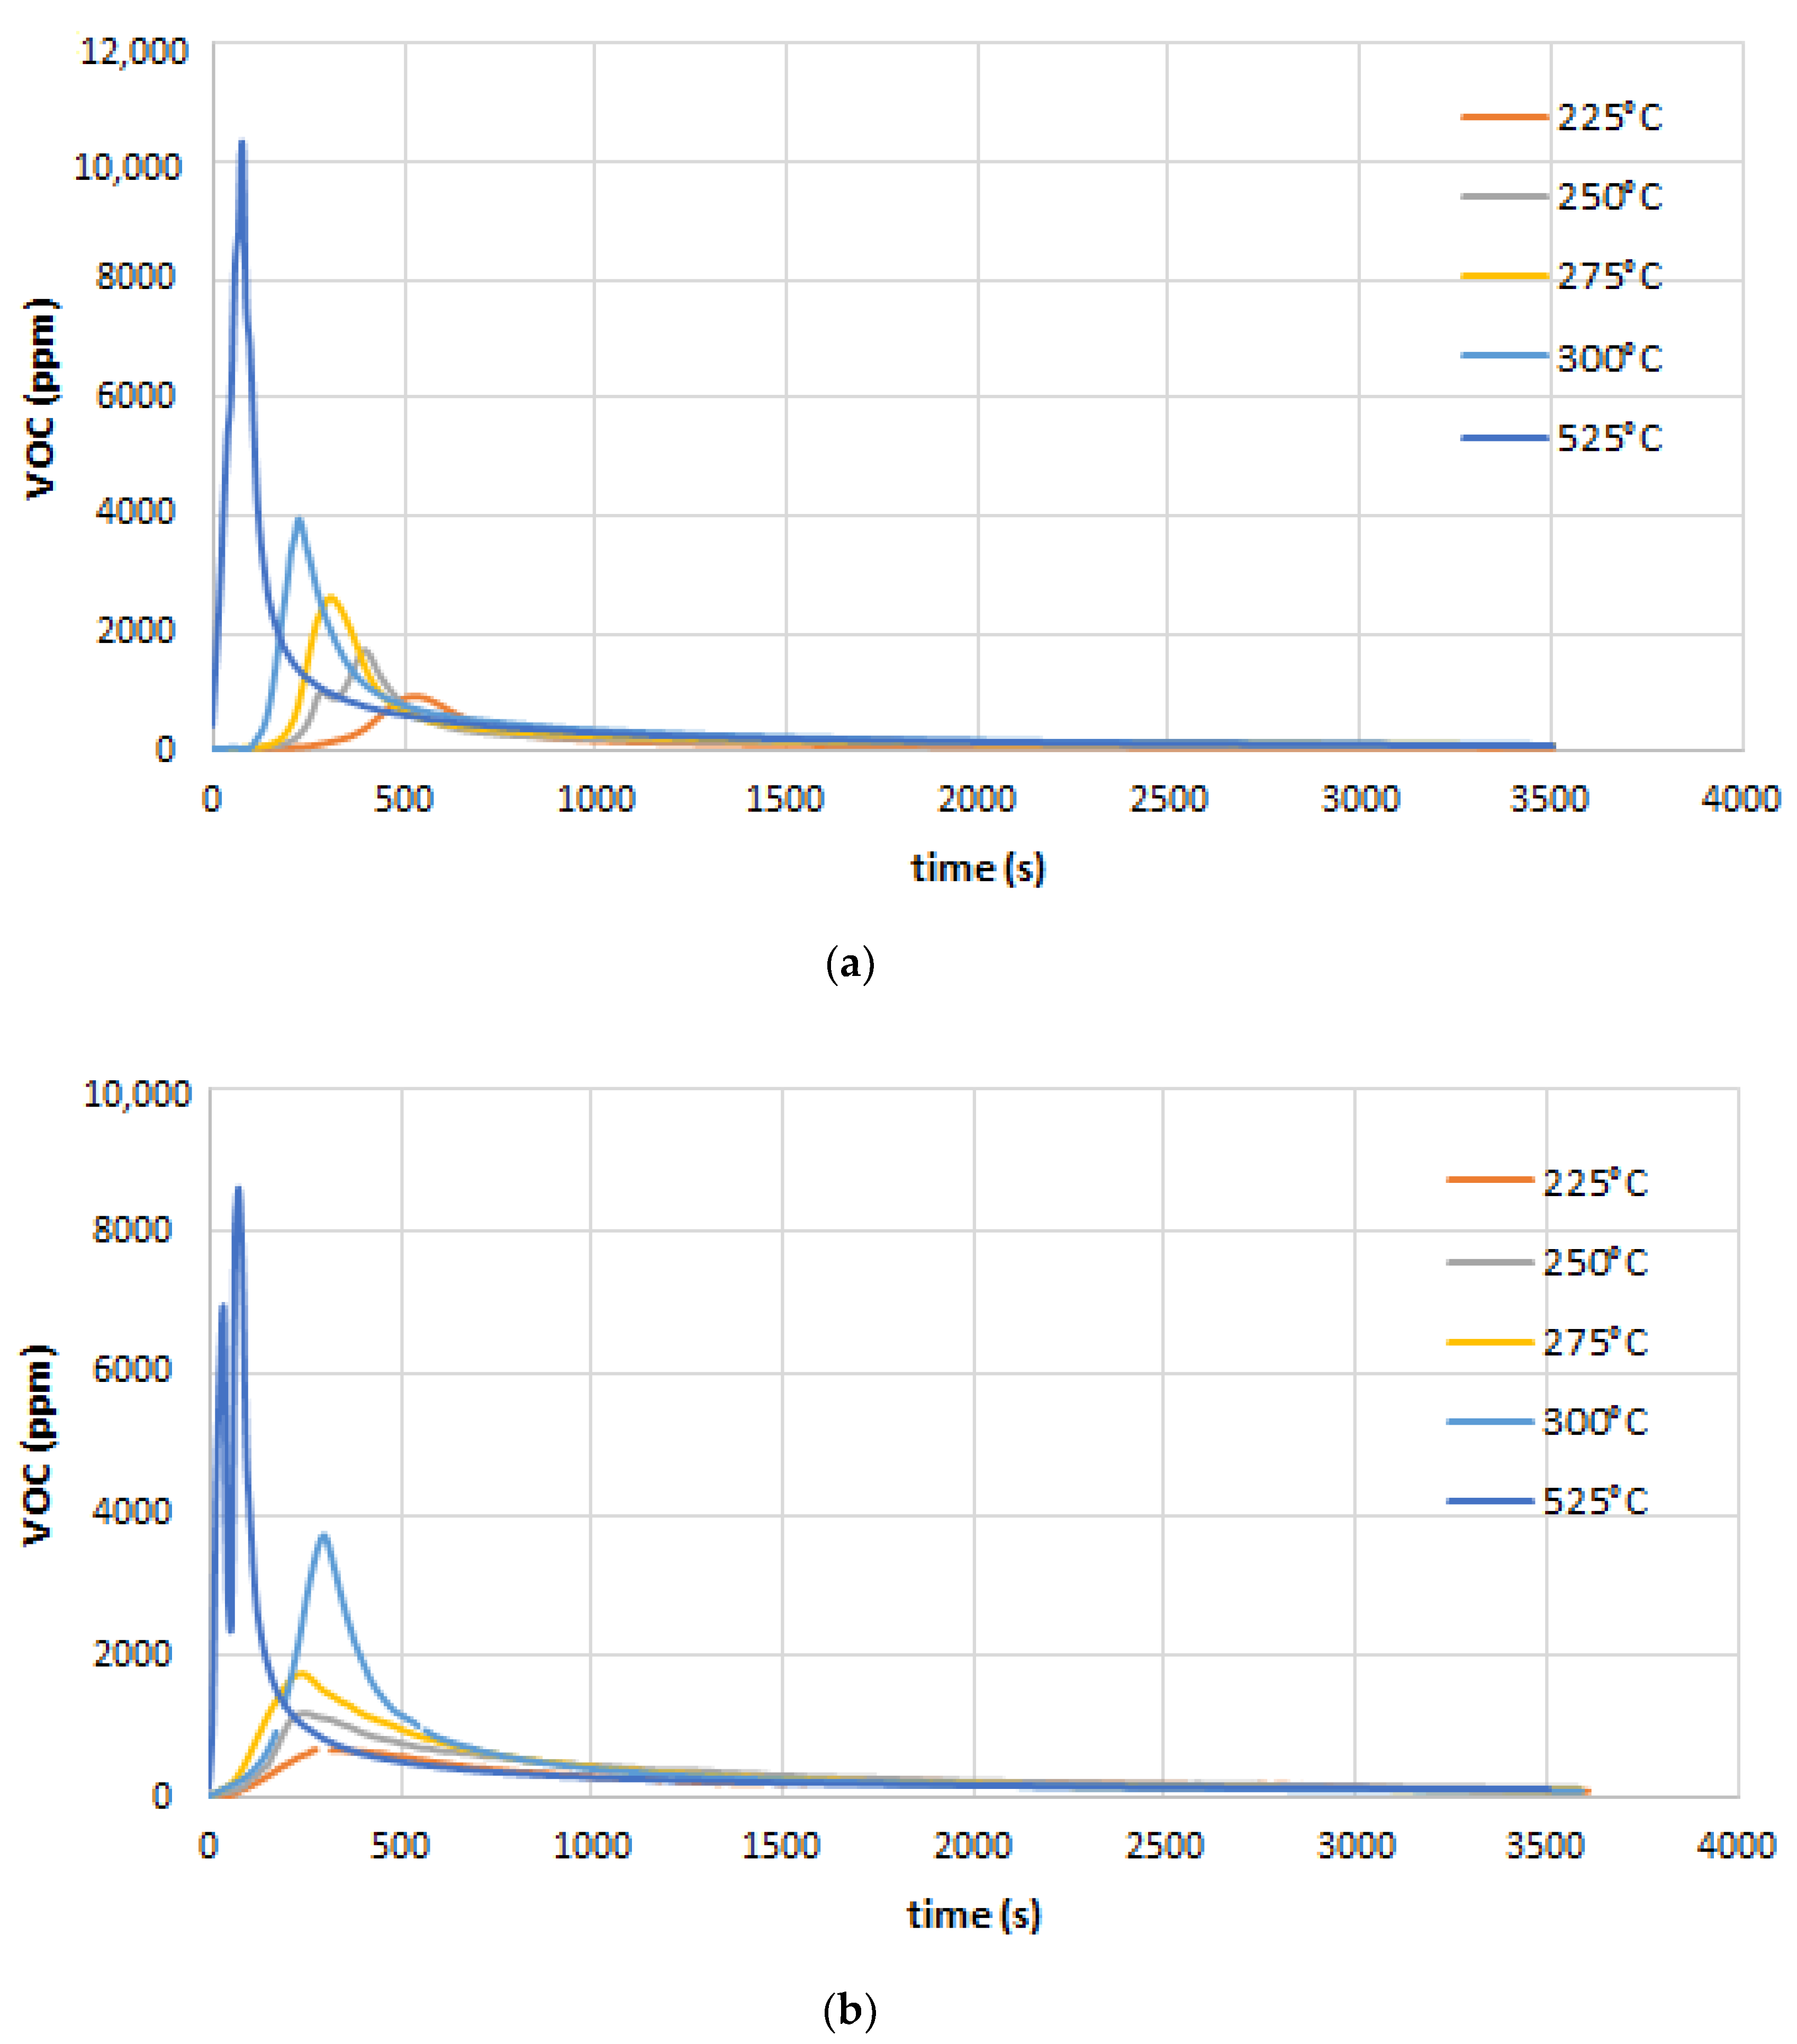
4.5. Effect of the Torrefaction Residence Time

A TGA analysis of oat and maize straws found that torrefaction process temperatures above 300 °C resulted in mass yields and decreased energy. Effects of the torrefaction process residual time were studied for temperatures below 400 °C. In Figure 15 and Figure 16a correlation between the effects of the agri-biomass torrefaction residence time on the characteristics of oats and maize straw torrefaction can be observed. It was concluded that the effect of torrefaction residence time on volatile matter and ash content was not as big as biomass torrefaction process temperature. In Figure 16 and Figure 17, the mass yield reduces with an increase in the torrefaction residence time. This could be explained by the reduction in the water content and volatile content of the straw. Nevertheless, there was a meaningful mass loss at the beginning of the biomass torrefaction process while the change of mass yield was not so important with a longer torrefaction residence time. This can be explained by the decomposition of more reactive components at the beginning of the torrefaction [20]. It was also concluded that the mass yield reduces with the torrefaction residence time. It can be inferred from Figure 10 that the HHV rises with a longer torrefaction time. However, the biomass torrefaction residence time has been shown to be less significant than the temperature in all experiments conducted thus far [20]. The shortest torrefaction residence time can differ depending on the torrefaction temperature, biomass type, the physical and chemical properties of the biomass, and its intended use for a specific sector [46]. Arias et al. [7] concluded that there was a small improvement in biomass grind ability at 240 °C if the torrefaction residence time was longer than 30 min. In another study, Bergman et al. [21] founded that torrefaction should be performed for 17 min at 280 °C for co-firing applications [2].

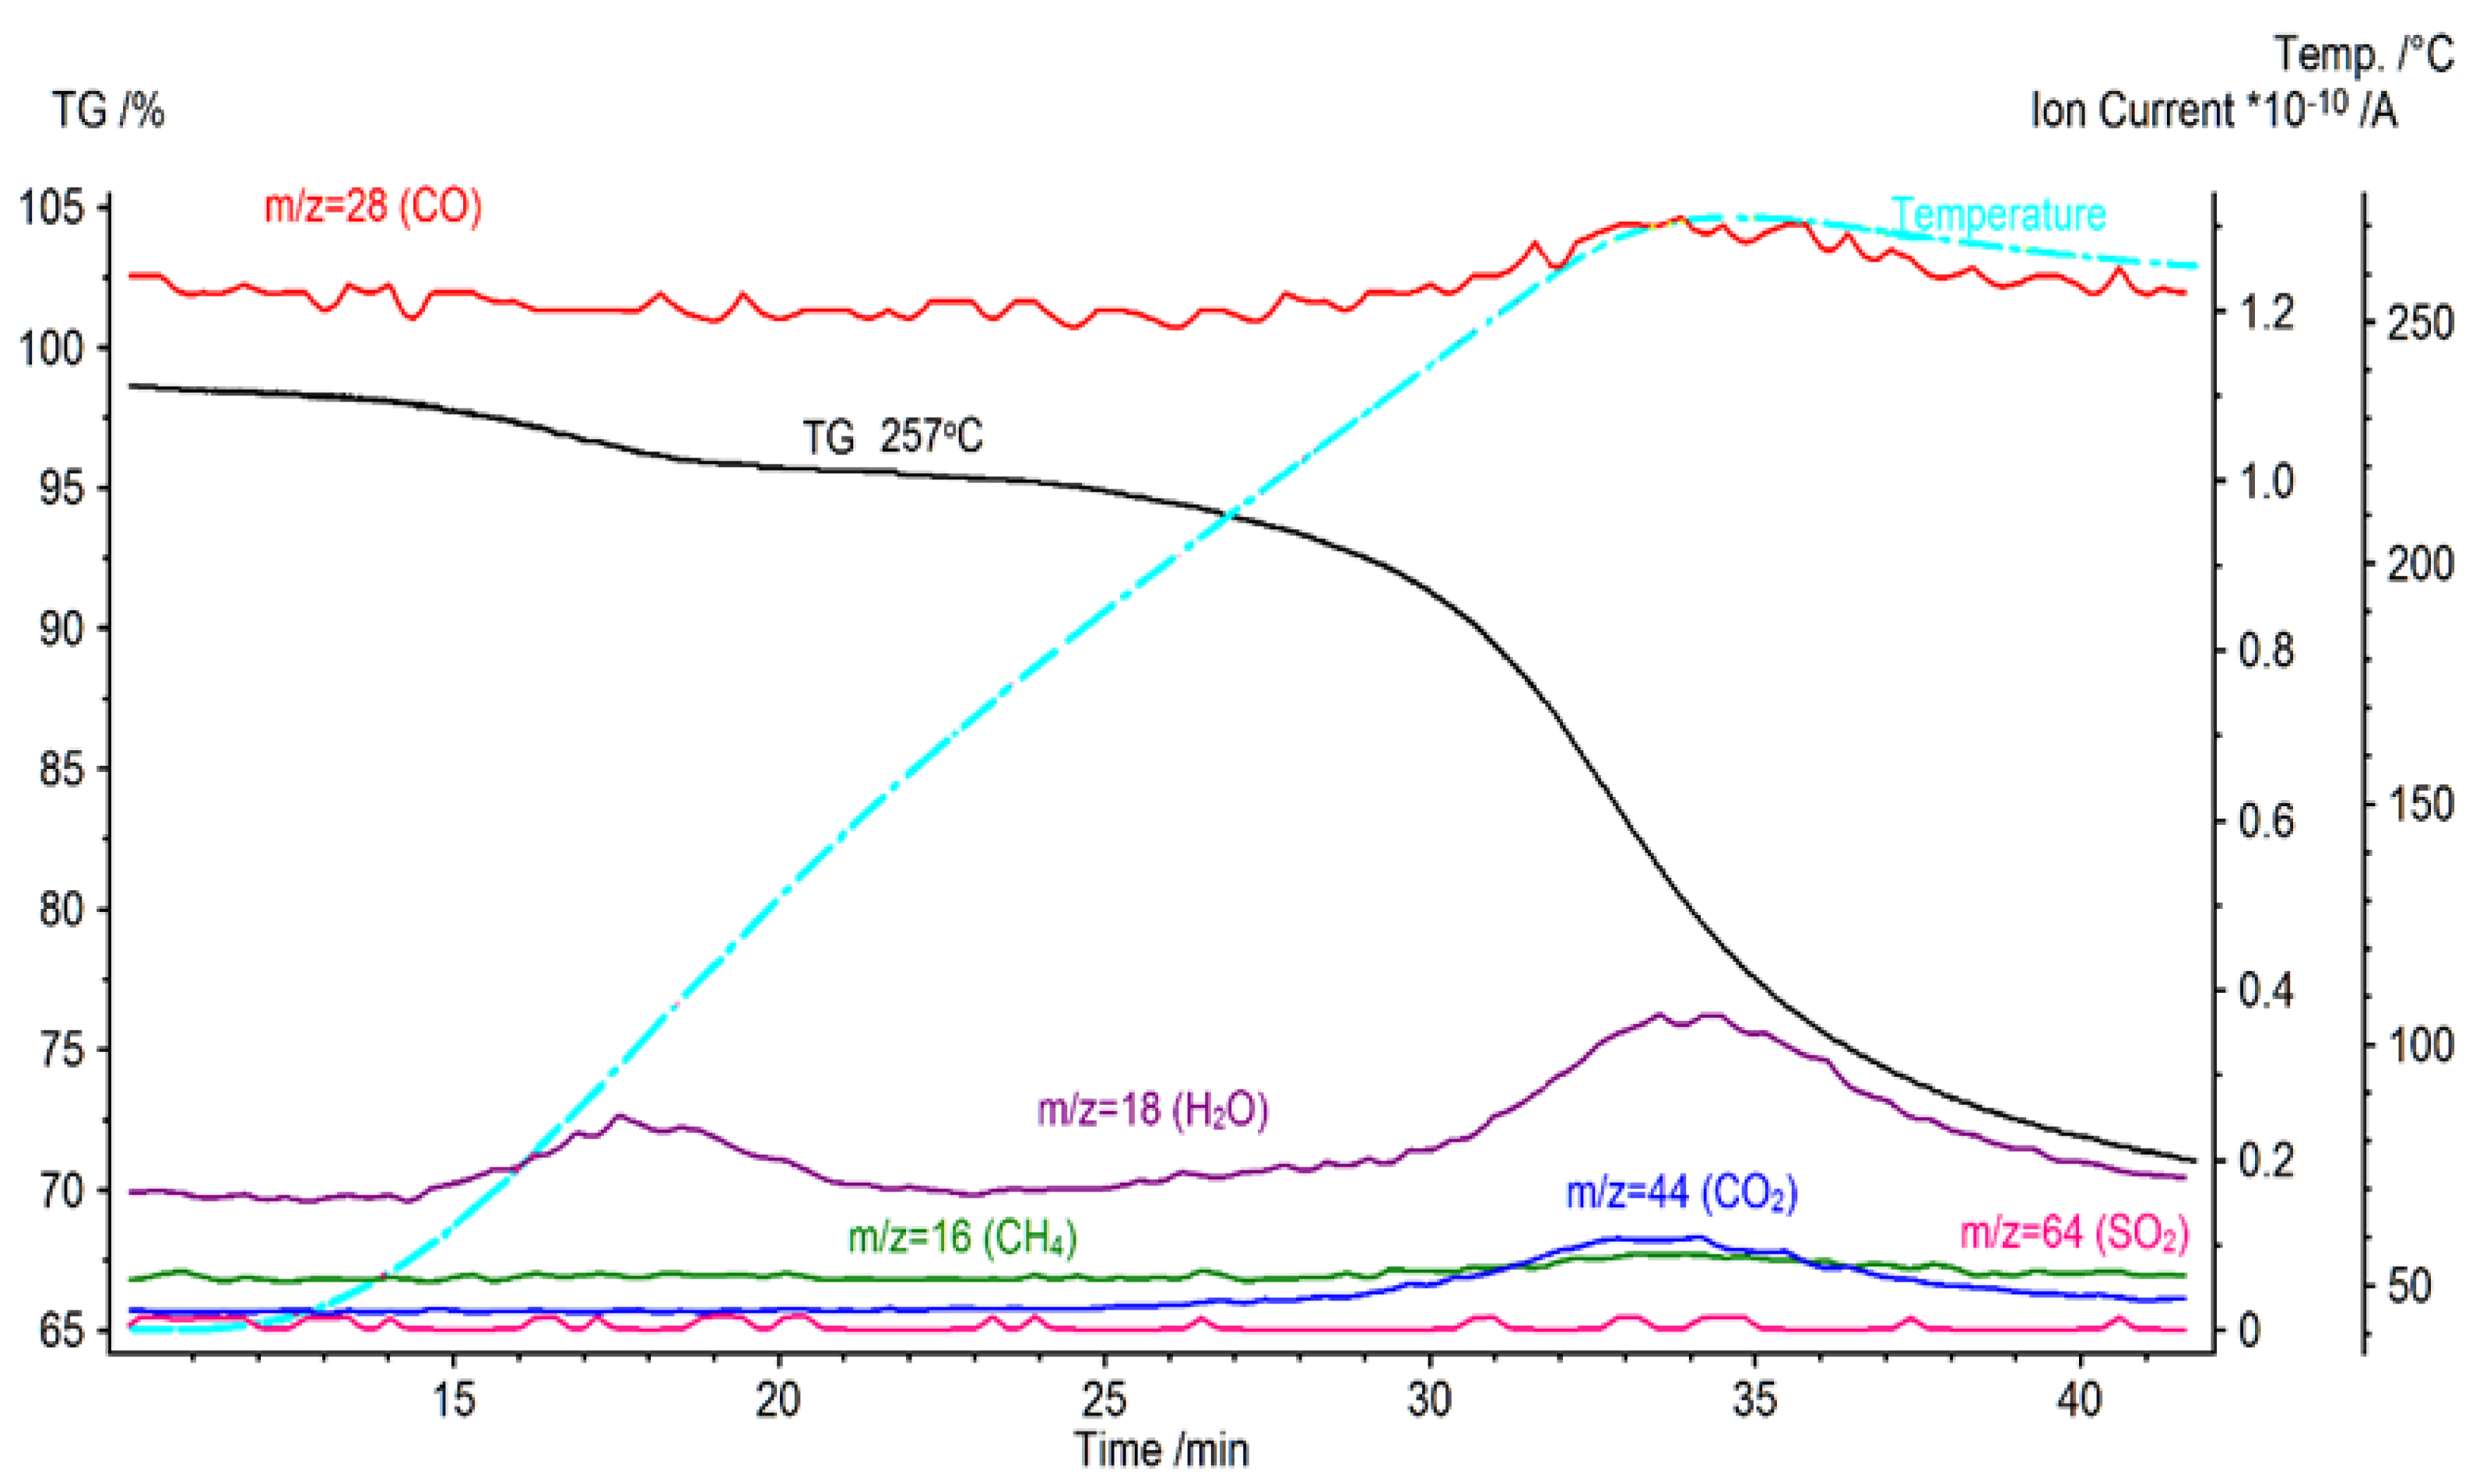
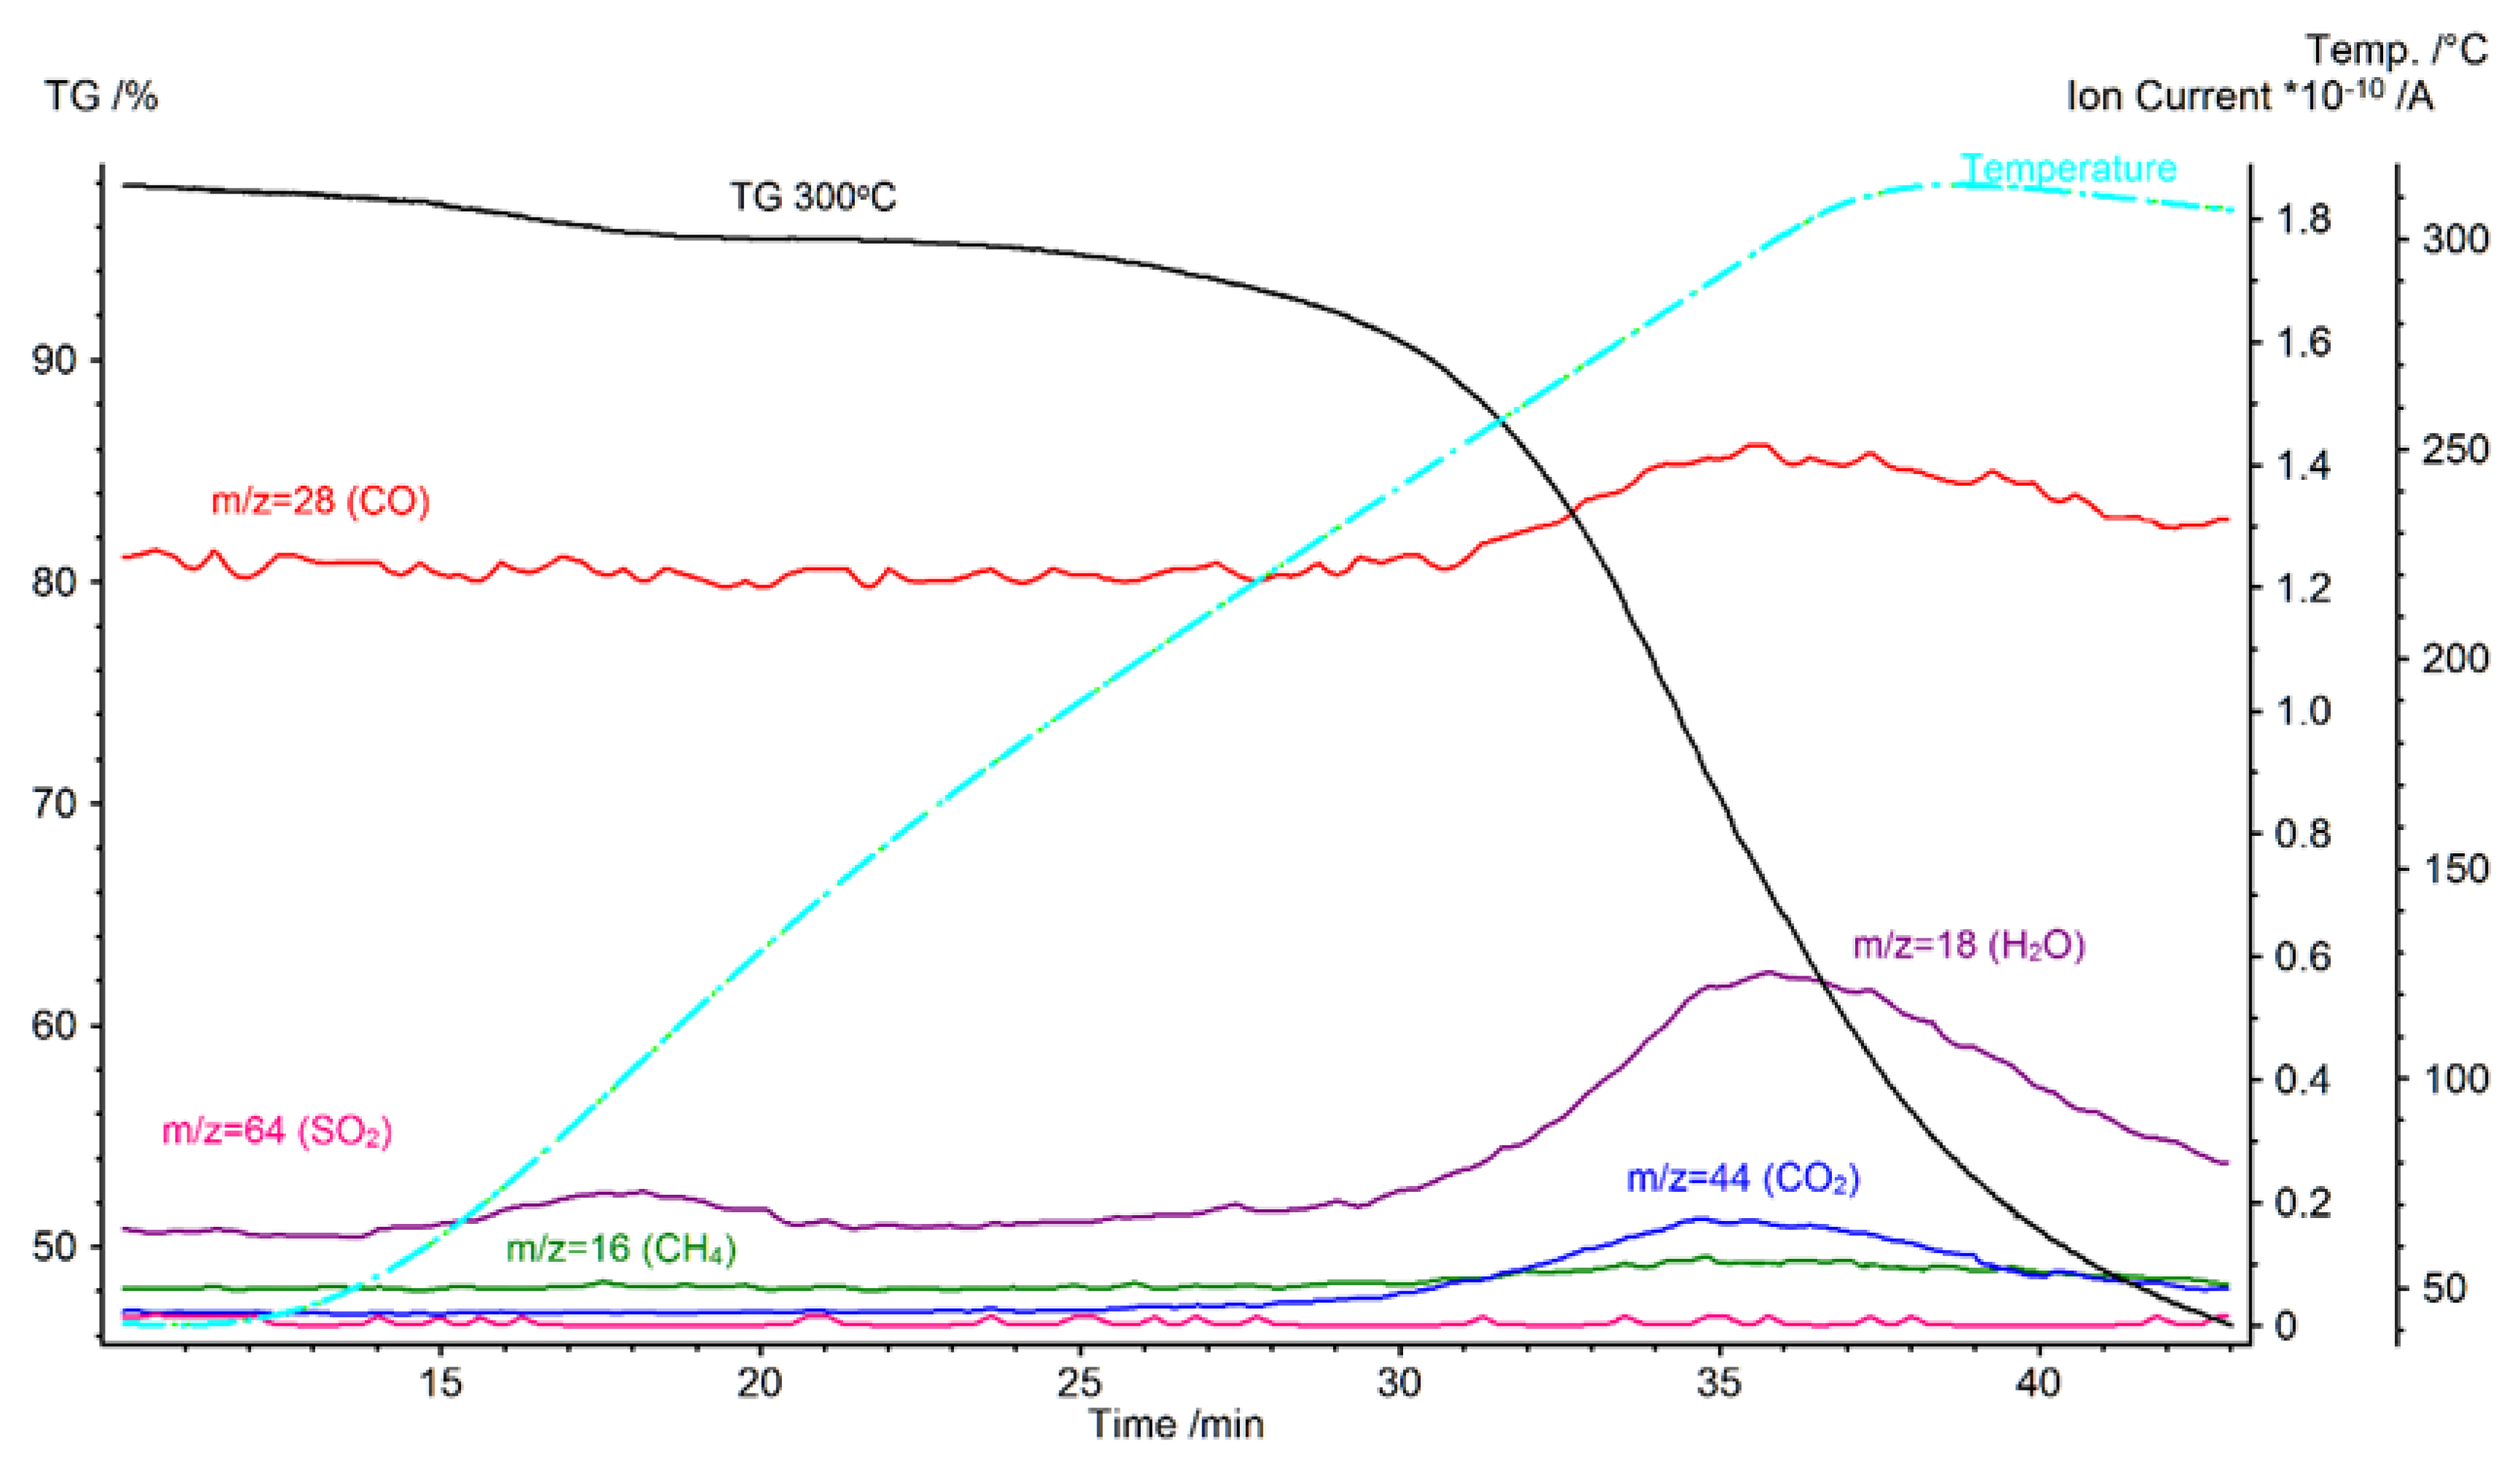
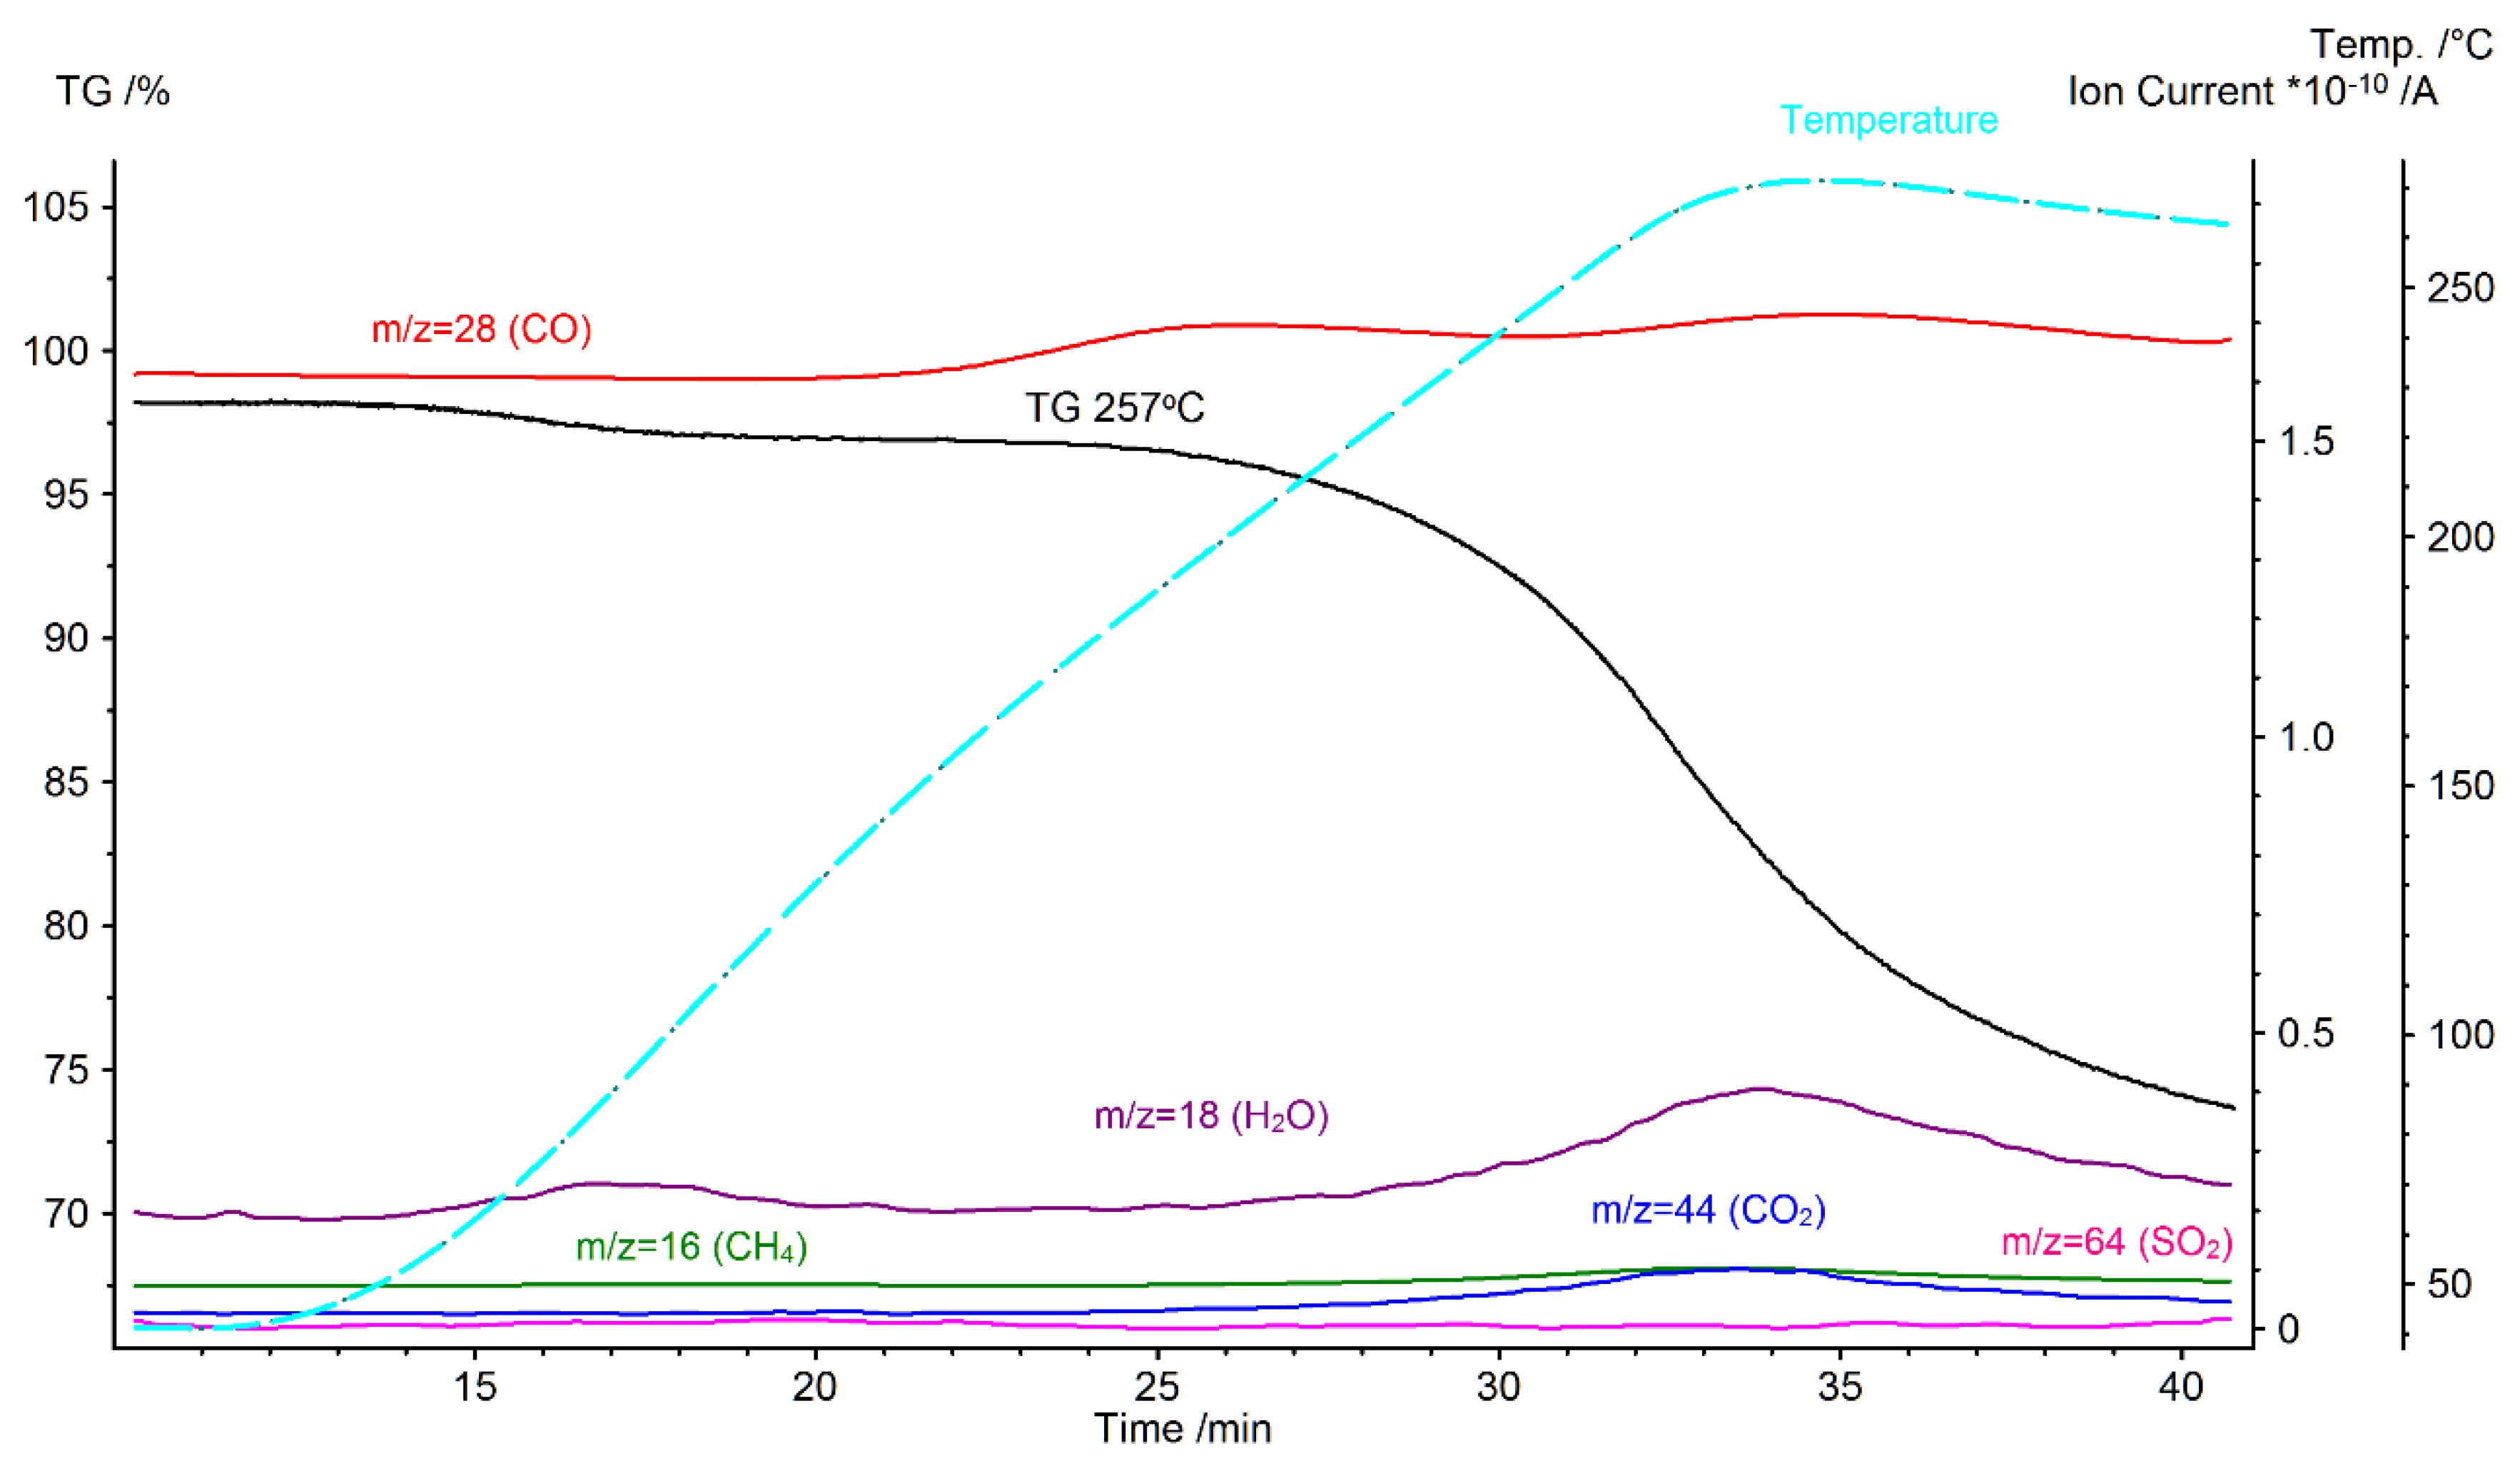
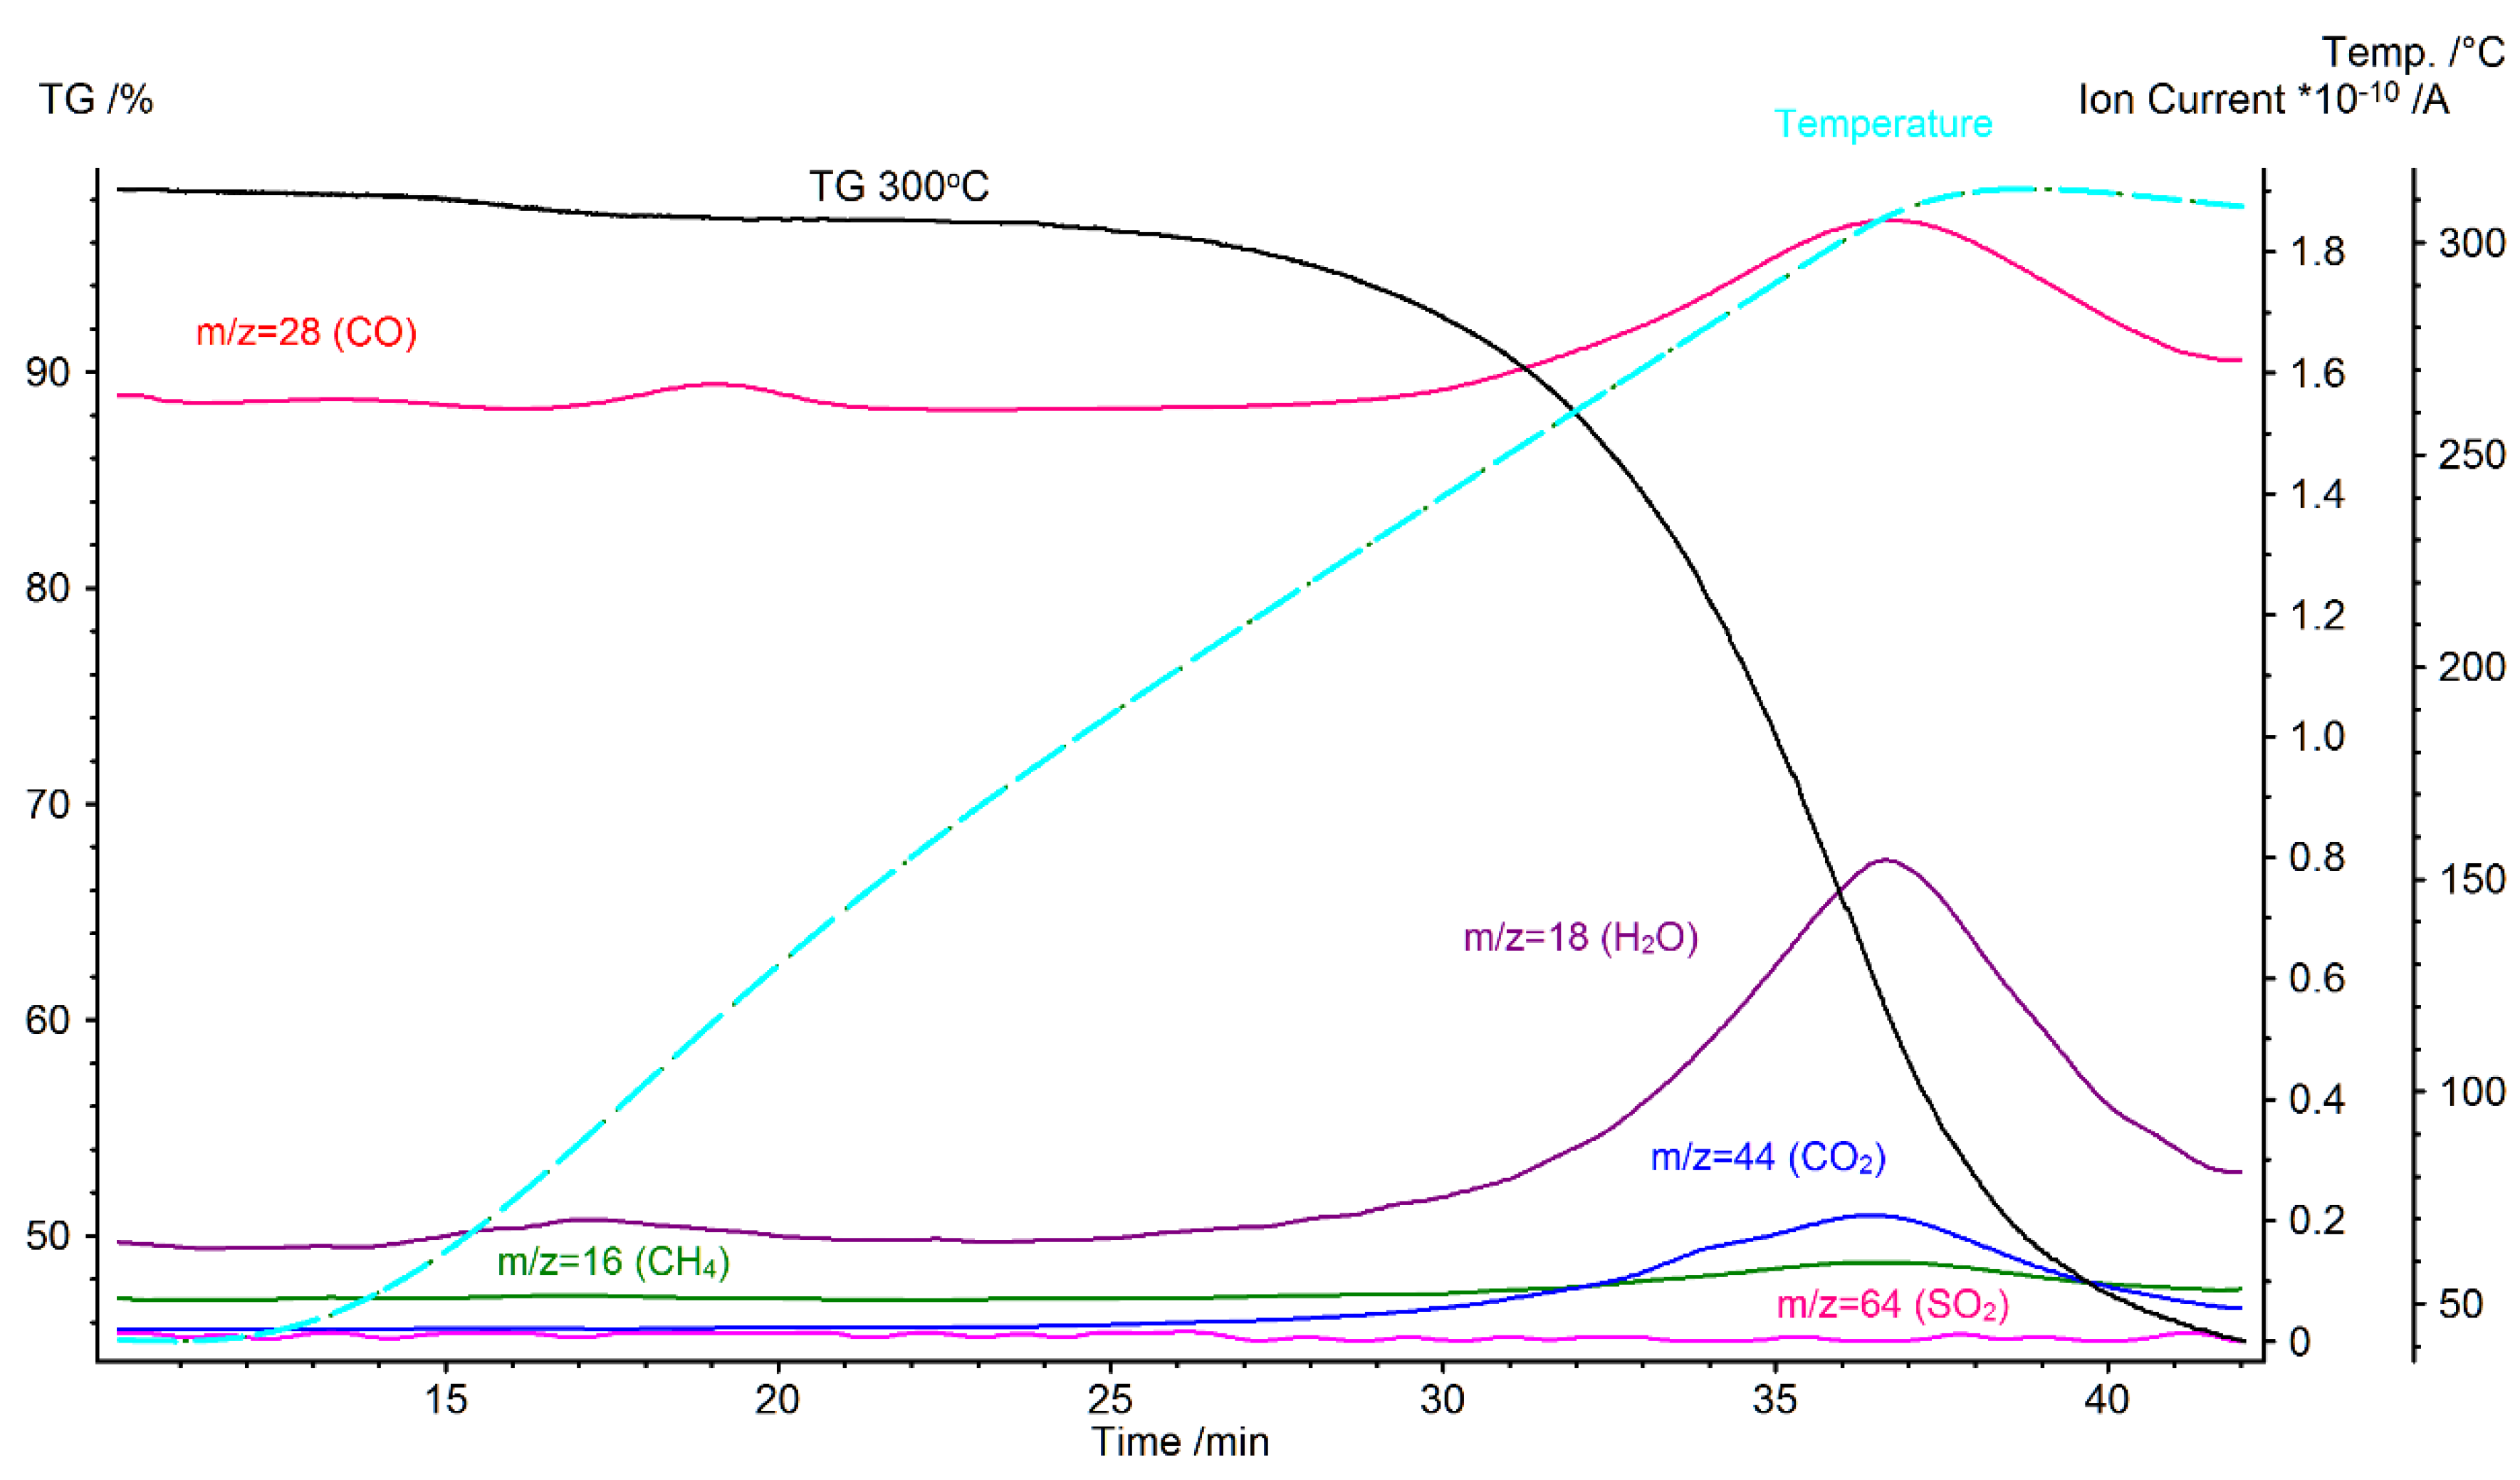
4.6. TG-MS analysis of the Gaseous Products

For each process, tests were carried out on the evolution of gases using a mass spectrometer coupled with a thermogravimetric analyzer. TG-MS analysis was done to find out the gaseous compounds of torgas during the torrefaction process of oat and maize straw. Signals from the gas spectrometer were recorded in bar graph mode, i.e., a range from 3 to 84 [amu] was scanned. The data obtained were subjected to detailed analysis and it was found that during the implemented processes only increases in ionic currents corresponding to such gases were visible: H2O, CH4, CO i CO2, and SO2. The trajectory of ionic currents for the main ions of the above gases are shown in Figure 17 and Figure 18 and in Appendix A: Figure A7, Figure A8, Figure A9 and Figure A10. Analysis shows that during higher torrefaction, temperature corresponds to the generation of CO, which takes place at a temperature of 300 °C for oat straw and 295 °C for maize straw.
As can be seen from the analysis of the curves in Figure 17 and Figure 18, no SO2 secretion was observed in any of the processes studied. In addition, for processes carried out up to temperatures of 257.5 and 300 °C, one maximum emission of such gases is visible, such as CO, CO2, CH4, and two excretion maxima for water. The temperatures of these maxima correspond to the temperatures read from the DTG curves. In the case of a process carried out at a temperature of 525 °C there are two maxima of evolution of gases such as CO, CO2, and CH4 and three secretion maxima for H2O. The temperatures of these maxima correspond to the temperatures read from DTG curves. In Figure 18, characteristic change can be found in samples at 525 °C, which shows differences between values over 12%; but in TGA straw from oats, this change took place at 300 °C and reached a difference of over 30%. Attention should be paid to a temperature of 257.5 °C, because the residual masses are the largest from all three temperatures. The percentage values of remaining mass at 525 °C are the smallest of all measurements for both biomass types [1]. At 257.5 °C for maize straw, the defect is non-standard and disproportionate (it varies within a few per cent). The reason for this may be a too low temperature test for the tested biomass.

4.7. Composition of Total Organic Carbon

The mass yield of oats and maize straw after a torrefaction process at temperatures up to 300 °C indicated a reduction in mass similar to that of the untreated straw before the torrefaction process. This showed that the extent of torrefaction for the oats and maize straw up to 300 °C was insignificant equated to these values above 300 °C. There were two main causes of the reduction in mass of the dried or torrefied products. First is moisture loss at the beginning of the process up to 110 °C, with the other being thermal decomposition forming volatile gaseous products such as H2O, CO, CO2, acetic acid, and other organics (Figure 18 and Figure 19 and Figure A7, Figure A8, Figure A9 and Figure A10). The reduction in the mass yield is correlated with well known thermal effects which is shown in the loss of moisture, followed by the depolymerization of the secondary cell-wall constituents hemicellulose, cellulose, and lignin Figure 16. The decrease in mass during a torrefaction process at a lower temperature is explained as mainly caused by the loss of water content. To be accurate, torrefaction did not appear in oat and maize straw samples at temperatures below 300 °C. In a biomass torrefaction process at temperatures above 300 °C, the decrease is related to the thermal decomposition of the biomass [2]. The volatile parts show a reduction while the ash content increases with biomass torrefaction temperatures up to 525 °C. It is more important that the volatile matter content rose while the ash content reduced at temperatures above 525 °C [47]. The high heating value constantly increases with the rise of volatile materials and the decrease of ash content.
Figure 20 and Figure 21 shows measurement results of VOC for maize and oat straws.
Research results show that torrefaction of maize straw at temperatures lower than 370 °C is more suitable for the production of solid biofuels. A process temperature above 370 °C is a temperature at which hydrocarbon gas emissions begin, which has a negative impact on the energy efficiency of overall process. From Figure 14, temperatures between 290 and 310 °C were considered as the optimum torrefaction temperatures for maize straw to obtain mass loss in a range of 45–55%. Above 310 °C the HHV remained at 21 MJ/kg in this area and the energy yield remained above 70%. The tradeoff of the energy yield against the HHV limits the torrefaction region. Nevertheless, the torrefaction area is different with the initial condition of the untreated material, the heating rate, and the chemical composition [2,48].

5. Conclusions

In this paper, two kinds of agri-biomass (oat straw and maize straw) torrefaction process conditions were measured to obtain three kinds of products as follows. The authors quantified different biomass torrefaction process parameters (kinetics, optimal torrefaction process temperature, and residence time for specific mass loss ratio). An analysis of the above data shows that above 400 °C, the sample torrefaction process is completed. These results can be explained by the fact that compounds with oxygen are emitted at temperatures lower than those for hydrocarbon gases. It was concluded that biomass the torrefaction process temperature had a bigger effect on the torrefaction of maize and oat straw compared with the torrefaction residence time. From an elemental analysis, the weight percentage of C in the maize and oat straw rose with an increase in the torrefaction temperature. On the other hand, the weight percentages of H and O tended to reduce. Accordingly, the O/C and H/C ratios decreased with a rise in the torrefaction temperature. From an analysis of the gaseous products formed during biomass torrefaction, it was concluded that the compounds with oxygen were emitted at a temperature lower than that for hydrocarbon gases. From this study, it was found that temperatures between 290 and 330 °C are the most optimum torrefaction temperatures for maize and oat straw, although the actual temperature can be different depending on the initial condition of the untreated material, the heating rate, and the chemical composition of the raw biomass [2]. It was also found that kinetic analysis methods using multiple heating rate experiments are more efficient compared to the use of a single heating rate. The biomass torrefaction process proceeds with the release of volatile organic compounds. This emission is very rapid in the initial period, although it decreases over time. VOC emission is the result of anaerobic decomposition of organic matter forming biomass and is higher when increasing the temperature of the torrefaction process. Maximum VOC concentrations in torgas rises up to 10,000 ppm, while the emission factor (related to mass unit) reaches a value of several mg/g of torrefied biomass. High VOC concentrations in the torgas provide a chance for use as a source of heat (fuel) supplied to the torrefaction process.

Author Contributions

S.S. and J.C.; methodology, G.W., M.D.; software, Ł.A.; validation, S.S., M.M. and P.K.; formal analysis, S.S. and G.W.; investigation, S.S., J.C. and L.W.; resources, S.S. P.P.; data curation, S.S. and L.W.; writing—original draft preparation, S.S.; writing—review and editing, S.S. and J.C.; visualization, W.L.; supervision, S.S. and G.W.; project administration, S.S.; funding acquisition, S.S. All authors have read and agreed to the published version of the manuscript.

Funding

The studies presented were financed by the National Center of Research and Development (NCBR) Poland under the research program LIDER. The research and development project is entitled by the acronym BIOCARBON, with the title “Modern technology biomass torrefaction process to produce fuel mixtures, biocoal as additives for fertilizers, activated carbon for energy sector, agriculture, civil engineering and chemical industry”, “LIDER IX” NCBR 2014-2020 (grant no. 0155/L-9/2017). The studies presented were financed by the National Center of Research and Development (NCBR) Poland under the sectorial research program. The research and development project is entitled by the acronym: DRPBIOCOAL: "Development of an innovative technology of biomass torrefaction to produce biochar, fuel and activated carbon for the needs of agriculture, energy and industry”, Grant from the National Center for Research and Development (NCBiR) in Warsaw - POIR (Operation Program for Inteligent Development 1.2 "Sectoral R&D programs" 2014-2020 (PBSE) in 2017, (grant no. POIR.01.02.00-00-0243/17). This study was conducted and financed in the framework of the research project “Economic aspects of low carbon development in the countries of the Visegrad Group”, (grant no. 2018/31/B/HS4/00485), granted by the National Science Centre, Poland, program OPUS.

Conflicts of Interest

The authors declare no conflict of interest.

Appendix A

Figure A1 and Figure A2 present data analysis for a sample of oats and maize straws by the Kissinger method (ASTM E698).
Figure A1. TG curves for three heating rates recorded for a oat straw sample.
Energies 13 02064 g0a1
Figure A2. TG curves for three heating rates recorded for a maize straw sample.
Energies 13 02064 g0a2
The activation energy values obtained are 119 and 125 kJ/mol for oats and maize, respectively. Note the very high relative error of this method (51 and 34 kJ/mol for oats and maize, respectively). The degree of conversion and reaction speed were determined from the formulas [31]
X = m o m m o m k
d X d t = d m d t * 1 m k m o
where:
m—mass at a given time t (mg),
m0—initial mass (mg),
mk—mass remaining after the reaction (mg)
The reaction rate is a function of temperature (31):
d X d t = f ( X ) * f ( T )
where:
t—time (s),
X—conversion level,
f(X)—reaction kinetic model,
f(T)—Arrhenius equation, given by
Because f(x) is constant for a given conversion, the log with dx/dt as a function of temperature inverse gives straight lines with a slope equal to Ea/R. Figure A3 and Figure A4 show logs of dx/dt logarithm as a function of temperature inverse determined by Friedman’s method for maize and oat straw samples.
Figure A3. Log dx/dt graph as a function of temperature inverse using the Friedman method for an oat straw sample.
Energies 13 02064 g0a3
Figure A4. Graph of dx/dt logarithm as a function of temperature inverse using the Friedman method for a maize straw sample.
Energies 13 02064 g0a4
Friedman’s method also makes it possible to present the value of activation energy and pre-exponential coefficient as a function of the degree of conversion. Figure A5 and Figure A6 present these graphs for a sample of oats and maize.
Figure A5. Activation energy and pre-exponential coefficient as a function of the degree of conversion by the Friedman method for an oat straw sample.
Energies 13 02064 g0a5
Analysis of Figure A5 and Figure A6 shows that the activation energies of oat and maize samples vary depending on the extent of conversion.
Figure A6. Activation energy and pre-exponential coefficient as a function of the degree of conversion by the Friedman method for a maize straw sample.
Energies 13 02064 g0a6
These results were also collected in tabular form (Table A1, Table A2 and Table A3).
Table A1. Activation energy and pre-exponential coefficient as a function of the degree of conversion by the Friedman method for a maize straw sample.
Fract. Mass LossActivation Energy (kJ/mol)lg (A/s−1)
0.0298.35 ± 0.157.31
0.0590.03 ± 6.696.16
0.10107.15 ± 5.507.62
0.20141.67 ± 23.3010.70
0.30163.62 ± 19.1212.52
0.40165.03 ± 12.5512.37
0.50157.00 ± 5.0911.44
0.60164.05 ± 7.4311.95
0.70189.61 ± 37.8813.97
0.80214.67 ± 99.5415.65
The variability of the activation energy value as a function of the degree of conversion most probably indicates the fact that the pyrolysis reactions of oat and maize samples are not homogeneous and consist of many overlapping and parallel thermal decomposition processes of individual components of these biomass types.
Table A2. Activation energy and pre-exponential coefficient as a function of the degree of conversion by the Friedman method for an oat straw sample.
Fract. Mass LossActivation Energy (kJ/mol)lg (A/s−1)
0.0221.63 ± 51.95-1.54
0.0583.53 ± 61.915.01
0.10141.68 ± 62.7510.66
0.20155.12 ± 49.0211.71
0.30159.65 ± 12.1011.92
0.40152.36 ± 34.4711.10
0.50138.92 ± 51.869.81
0.60133.57 ± 56.599.26
0.70152.72 ± 71.4810.75
0.80305.52 ± 234.6022.83
Table A3. Activation energy and pre-exponential coefficient as a function of the degree of conversion by the Ozawa–Flynn–Walla method for an oat straw sample.
ModelProcessFunction g(x)
D1One-dimensional diffusionx2
D2Two-dimensional, cylindrical diffusion(1 − x)ln(1 − x) + x
D3Three-dimensional, spherical diffusion[1 − (1 − x)1/3]2
D4Three-dimensional diffusion1 − (2 x/3)-(1 − x)2/3
A2Random nucleation, Avrami’s equation[−ln(1 − x)]1/2
A3Random nucleation, Avrami’s II equation[−ln(1 − x)]1/3
A4Random nucleation, Avrami’s II equation[−ln(1 − x)]1/4
R1Linear controlled reaction, linearx
R2Phase interface, surface controlled reaction1 − (1 − x)1/2
R3Phase boundary controlled reaction, volumetric1−(1 − x)1/3
F1Random nucleation, one embryo per molecule−ln(1 − x)
F2Random nucleation, two embryos per molecule[1/(1 − x)] − 1
F3Random nucleation, three embryos per molecule[1/(1 − x)2] − 1
Fn (n-order)Random nucleation, n embryos per molecule[1/(1 − x)n − 1] − 1
Figure A7. TG curve and ion current curves for the maize straw torrefaction process carried out up to 257.5 °C.
Energies 13 02064 g0a7
Figure A8. TG curve and ion current curves for the maize straw torrefaction process carried out up to 300 °C.
Energies 13 02064 g0a8
Figure A9. TG curve and ion current curves for the oat straw torrefaction process carried out up to 257.5 °C.
Energies 13 02064 g0a9
Figure A10. TG curve and ion current curves for the oat straw torrefaction process carried out up to 300 °C.
Energies 13 02064 g0a10

References

  1. Adamczyk, F.; Frąckowiak, P.; Mielec, K.; Kośmicki, Z. Problematyka badawcza w procesie zagęszczania słomy przeznaczonej na opał. J. Res. Appl. Agric. Eng. 2005, 50, 5–8. (In Polish) [Google Scholar]
  2. Poudel, J.; Oh, S.C. Effect of Torrefaction on the Properties of Corn Stalk to Enhance Solid Fuel Qualities. Energies 2014, 7, 5586–5600. [Google Scholar] [CrossRef] [Green Version]
  3. Xing, X.; Fan, F.; Jiang, W. Characteristics of biochar pellets from corn straw under different pyrolysis temperatures. R. Soc. Open Sci. 2018, 5, 172346. [Google Scholar] [CrossRef] [PubMed] [Green Version]
  4. Meia, Y.; Chea, Q.; Yangbc, Q.; Draperd, C.; Yanga, H.; Zhanga, S.; Chena, H. Torrefaction of different parts from a corn stalk and its effect on the characterization of products. Ind. Crops Prod. 2016, 92, 26–33. [Google Scholar] [CrossRef]
  5. Gent, S.; Twedt, M.; Gerometta, C.; Almberg, E. Theoretical and Applied Aspects of Biomass Torrefaction for Biofuels and Value-Added Products, 1st ed.; Butterworth-Heinemann: Oxford, UK, 2017; ISBN 9780128094839. [Google Scholar]
  6. Gładki, J. Biowęgiel szansą dla zrównoważonego rozwoju [BIOCHAR as a Chance for Sustainable Development], 2nd ed.; Oficyna Poligrafi czna Apla Sp.J.: Sędziszów, Poland, 2017; pp. 60–85. ISBN 978-83-65487-05-06. [Google Scholar]
  7. Gradziuk, P. Ekonomiczne i ekologiczne aspekty wykorzystania słomy na cele energetyczne. Acta Agrophysica 2006, 8, 18–44. (In Polish) [Google Scholar]
  8. Ren, X.; Rokni, E.; Sun, R.; Meng, X.; Levendis, Y.A. Evolution of Chlorine-Bearing Gases during Corn Straw Torrefaction at Different Temperatures. Energy Fuels 2017, 31, 13713–13723. [Google Scholar] [CrossRef]
  9. Gradziuk, P.; Kościk, K. Analiza możliwości i kosztów pozyskania biomasy na cele energetyczne na potrzeby energetycznego wykorzystania w gminie Clomas. Opracowanie na zlecenie Urzędu Gminy Clomas 2007, 35–105. Available online: https://scholar.google.com/scholar?cluster=11289157253013309311&hl=en&oi=scholarr (accessed on 15 April 2020). (In Polish).
  10. Tiffany, D.G.; Lee, W.F.; Morey, V.; Kaliyan, N. Economic Analysis of Biomass Torrefaction Plants Integrated with Corn Ethanol Plants and Coal-Fired Power Plants. Adv. Energy Res. 2013, 1, 127. [Google Scholar] [CrossRef] [Green Version]
  11. Cruz, D.C. Production of Bio-coal and Activated Carbon from Biomass. Master’s Thesis, The University of Western Ontario, London, Canada, 2012. [Google Scholar]
  12. Denisiuk, W. Słoma—Potencjał masy i energii. Inżynieria Rolnicza 2008, 2, 23–30. (In Polish) [Google Scholar]
  13. Grzybek, A.; Gradziuk, P.; Kowalczyk, K. Słoma-Energetyczne Paliwo; Wydaw: Warsaw, Poland, 2001. (In Polish) [Google Scholar]
  14. Chen, D.; Cen, K.; Cao, X.; Li, Y.; Zhang, Y.; Ma, H. Restudy on torrefaction of corn stalk from the point of view of deoxygenation and decarbonization. J. Anal. Appl. Pyrolysis 2018, 135, 85–93. [Google Scholar] [CrossRef]
  15. Meng, X.; Sun, R.; Zhou, W.; Liu, X.; Yan, Y.; Ren, X. Effects of corn ratio with pine on biomass co-combustion characteristics in a fixed bed. Appl. Therm. Eng. 2018, 142, 30–42. [Google Scholar] [CrossRef]
  16. Ren, X.; Rokni, E.; Liu, Y.; Levendis, Y.A. Reduction of HCl Emissions from Combustion of Biomass by Alkali Carbonate Sorbents or by Thermal Pretreatment. J. Energy Eng. 2018, 144, 04018045. [Google Scholar] [CrossRef]
  17. Shankar, J.; Timothy, T.; Christopher, K.; Wright, T.; Richard, D. Boardman, Proximate and Ultimate Compositional Changes in Corn Stover during Torrefaction Using Thermogravimetric Analyzer and Microwaves. In Proceedings of the ASABE Annual International Meeting, Dallas, TX, USA, 29 July–1 August 2012. [Google Scholar]
  18. Almberg, E.R.; Twedt, M.P.; Gerometta, C.; Gent, S.P. Economic Feasibility of Corn Stover Torrefaction for Distributed Processing Systems. In Proceedings of the ASME 2016 10th International Conference on Energy Sustainability collocated with the ASME 2016 Power Conference and the ASME 2016 14th International Conference on Fuel Cell Science, Engineering and Technology, Charlotte, NC, USA, 26–30 June 2016. [Google Scholar]
  19. Andini, A.; Bonnet, S.; Rousset, P.; Patumsawad, S.; Pattiya, A. Torrefaction study of Indonesian crop residues subject to open burning. In Proceedings of the Technology & Innovation for Global Energy Revolution, Bangkok, Thailand, 28–30 November 2018. [Google Scholar]
  20. Lin, Y.-L. Effects of Microwave—Induced Torrefaction on Waste Straw Upgrading. Int. J. Chem. Eng. Appl. 2015, 6, 6. [Google Scholar] [CrossRef] [Green Version]
  21. Ren, X.; Rokni, E.; Zhang, L.; Wang, Z.; Liu, Y.; Levendis, Y.A. Use of Alkali Carbonate Sorbents for Capturing Chlorine-Bearing Gases from Corn Straw Torrefaction. Energy Fuels 2018, 32, 11843–11851. [Google Scholar] [CrossRef]
  22. Strzelczyk, M.; Steinhoff-Wrześniewska, A.; Helis, M. Biowęgiel dla rolnictwa alternatywne rozwiązanie w gospodarce odpadami. In Proceedings of the Konferencja naukowa Współczesne wyzwania gospodarki wodnej na obszarach wiejskich, Zdrój, Poland, 17–19 September 2018. (In Polish). [Google Scholar]
  23. Saleh, S.B. Torrefaction of Biomass for Power Production; Technical University of Denmark: Lyngby, Denmark, 2013. [Google Scholar]
  24. ISO 16994. Solid Biofuels—Determination of Total Content of Sulfur and Chlorine; International Organization for Standardization: Geneva, Switzerland, 2016. [Google Scholar]
  25. ISO 16948. Solid Biofuels—Determination of Total Content of Carbon, Hydrogen and Nitrogen; International Organization for Standardization: Geneva, Switzerland, 2015. [Google Scholar]
  26. ISO 18122. Solid Biofuels—Determination of Ash Content; International Organization for Standardization: Geneva, Switzerland, 2015. [Google Scholar]
  27. ISO 18123. Solid Biofuels—Determination of the Content of Volatile Matter; International Organization for Standardization: Geneva, Switzerland, 2015. [Google Scholar]
  28. ISO 18125. Solid Biofuels—Determination of Calorific Value; International Organization for Standardization: Geneva, Switzerland, 2017. [Google Scholar]
  29. Bates, R.B.; Ghoniem, A.F. Biomass torrefaction: Modeling of volatile and solid product evolution kinetics. Bioresour. Technol. 2012, 124, 460–469. [Google Scholar] [CrossRef] [PubMed]
  30. Kruczek, H.; Wnukowski, M.; Niedzwiecki, Ł.; Guziałowska-Tic, J. Torrefaction as a Valorization Method Used Prior to the Gasification of Sewage Sludge. Energies 2019, 12, 175. [Google Scholar] [CrossRef] [Green Version]
  31. Standard Test Method for Kinetic Parameters for Thermally Unstable Materials Using Differential Scanning Calorimetry and the Flynn/Wall/Ozawa Method Active Standard ASTM E698 | Developed by Subcommittee: E37.01, Book of Standards Volume: 14.05. Available online: https://td.chem.msu.ru/uploads/files/courses/special/specprac-ta/lit/ASTM%20E%20698%20-%2016.pdf (accessed on 15 April 2020).
  32. Syguła, E.; Koziel, J.A.; Białowiec, A. Proof-of-Concept of Spent Mushrooms Compost Torrefaction—Studying the Process Kinetics and the Influence of Temperature and Duration on the Calorific Value of the Produced Biocoal. Energies 2019, 12, 3060. [Google Scholar] [CrossRef] [Green Version]
  33. Szufa, S.; Dzikuć, M.; Adrian, Ł.; Piersa, P.; Romanowska-Duda, Z.; Marczak, M.; Błaszczuk, A.; Piwowar, A.; Lewandowska, W. Torrefaction of oat straw to use as solid biofuel, an additive to organic fertilizers for agriculture purposes and activated carbon—TGA analysis, kinetics. E3S Web Conf. 2020, 154, 02004. [Google Scholar] [CrossRef] [Green Version]
  34. Romanowska-Duda, Z.; Piotrowski, K.; Wolska, B.; Dębowski, M.; Zieliński, M.; Dziugan, P.; Szufa, S. Stimulating effect of ash from Sorghum on the growth of Lemnaceae—A new source of energy biomass. In Renewable Energy Sources: Engineering, Technology, Innovation, Springer Proceedings in Energy; Wróbel, M., Jewiarz, M., Szlęk, A., Eds.; Springer Nature: Cham, Switzerland, 2019; pp. 341–349. ISBN 978-3-030-13887-5. [Google Scholar] [CrossRef]
  35. Szufa, S.; Adrian, Ł.; Piersa, P.; Romanowska-Duda, Z.; Ratajczyk-Szufa, J. Torrefaction process of millet and cane using batch reactor. In Renewable Energy Sources: Engineering, Technology, Innovation, Springer Proceedings in Energy; Wróbel, M., Jewiarz, M., Szlęk, A., Eds.; Springer Nature: Cham, Switzerland, 2019; pp. 371–379. ISBN 978-3-030-13887-5. [Google Scholar] [CrossRef]
  36. Adrian, Ł.; Szufa, S.; Piersa, P.; Kurowski, K. Experimental research and simulation of computer processes of heat exchange in a heat exchanger working on the basis of the principle of heat pipes for the purpose of heat transfer from the ground. In Proceedings of the 4th Renewable Energy Sources—Research and Business RESRB 2019 Conference, Wrocław, Poland, 8–9 July 2019. [Google Scholar]
  37. Adrian, Ł.; Szufa, S.; Piersa, P.; Romanowska-Duda, Z.; Grzesik, M.; Cebula, A.; Kowalczyk, S.; Ratajczyk-Szufa, J. Thermographic analysis and experimental work using laboratory installation of heat transfer processes in a heat pipe heat exchanger utilizing as a working fluid R404A and R407A. In Renewable Energy Sources: Engineering, Technology, Innovation, Springer Proceedings in Energy; Wróbel, M., Jewiarz, M., Szlęk, A., Eds.; Springer Nature: Cham, Switzerland, 2019; pp. 799–807. ISBN 978-3-030-13887-5. [Google Scholar] [CrossRef]
  38. Szufa, S.; Adrian, Ł.; Piersa, P.; Romanowska-Duda, Z.; Grzesik, M.; Cebula, A.; Kowalczyk, S. Experimental studies on energy crops torrefaction process using batch reactor to estimate torrefaction temperature and residence time. In Renewable Energy Sources: Engineering, Technology, Innovation; Springer: Cham, Switzerland, 2018; pp. 365–373. ISBN 978-3-319-72370-9. [Google Scholar] [CrossRef]
  39. Adrian, Ł.; Szufa, S.; Piersa, P.; Romanowska-Duda, Z.; Grzesik, M.; Cebula, A.; Kowalczyk, S. Experimental research and thermographic analysis of heat transfer processes in a heat pipe heat exchanger utilizing as a working fluid R134A. In Renewable Energy Sources: Engineering, Technology, Innovation; Springer: Cham, Switzerland, 2018; pp. 413–421. ISBN 978-3-319-72370-9. [Google Scholar] [CrossRef]
  40. Szufa, S.; Romanowska-Duda, B.Z.; Grzesik, M. Torrefaction proces of the Phragmites Communis growing in soil contaminated with cadmium. In Proceedings of the 20th European Biomass Conference and Exibition, Milan, Italy, 18–22 June 2014; pp. 628–634, ISBN 978-88-89407-54-7. [Google Scholar]
  41. Dzikuć, M.; Kułyk, P.; Dzikuć, M.; Urban, S.; Piwowar, A. Outline of Ecological and Economic Problems Associated with the Low Emission Reductions in the Lubuskie Voivodeship (Poland). Polish J. Environ. Stud. 2019, 28, 65–72. [Google Scholar] [CrossRef]
  42. Adamczyk, J.; Piwowar, A.; Dzikuć, M. Air protection programmes in Poland in the context of the low emission. Environ. Sci. Pollut. Res. 2017, 24, 16316–16327. [Google Scholar] [CrossRef]
  43. Dzikuć, M.; Adamczyk, J.; Piwowar, A. Problems associated with the emissions limitations from road transport in the Lubuskie Province (Poland). Atmos. Environ. 2017, 160, 1–8. [Google Scholar] [CrossRef]
  44. Dzikuć, M. Problems associated with the low emission limitation in Zielona Góra (Poland): Prospects and challenges. J. Clean. Prod. 2017, 166, 81–87. [Google Scholar] [CrossRef]
  45. Dzikuć, M.; Tomaszewski, M. The effects of ecological investments in the power industry and their financial structure: A case study for Poland. J. Clean. Prod. 2016, 118, 48–53. [Google Scholar] [CrossRef]
  46. Piwowar, A.; Dzikuć, M. LCA w produkcji agrochemikaliów. Procedura, kategorie wpływu, możliwości wykorzystania. Przemysł Chemiczny 2017, 96, 271–274. (In Polish) [Google Scholar] [CrossRef]
  47. Marczak, M.; Karczewski, M.; Makowska, D.; Burmistrz, P. Impact of the temperature of waste biomass pyrolysis on the quality of the obtained biochar. Agric. Eng. 2016, 20, 115–124. [Google Scholar]
  48. Junga, R.; Pospolita, J.; Niemiec, P. Combustion and grindability characteristics of palm kernel shells torrefied in a pilot-scale installation. Renew. Energy 2020, 147, 1239–1250. [Google Scholar] [CrossRef]
Figure 1. Principle of oats and maize straw torrefaction process with process conditions temperature and optimal mass loss using superheated steam for production of biofuel, activated carbon, and additive for natural fertilizers.
Energies 13 02064 g001
Figure 2. Installation for VOC analysis in ‘torgas’ during torrefaction process using electrical furnace.
Energies 13 02064 g002
Figure 3. TG curves for three heating rates recorded for a maize straw sample.
Energies 13 02064 g003
Figure 4. TG curves for three heating rates recorded for a oat straw sample.
Energies 13 02064 g004
Figure 5. Graph of dx/dt logarithm as a function of temperature inverse of Ozawa–Flynn–Wall method for an oat straw sample.
Energies 13 02064 g005
Figure 6. Graph of dx/dt logarithm as a function of temperature inverse of Ozawa–Flynn–Wall method for a maize straw sample.
Energies 13 02064 g006
Figure 7. Activation energy and pre-exponential coefficient as a function of Ozawa–Flynn–Walla conversion for an oat straw sample.
Energies 13 02064 g007
Figure 8. Activation energy and pre-exponential coefficient as a function of Ozawa–Flynn–Walla conversion for a maize straw sample.
Energies 13 02064 g008
Figure 9. Fitting the calculated kinetic model to the experimental data for the oat straw sample.
Energies 13 02064 g009
Figure 10. Fitting the calculated kinetic model to the experimental data for the maize straw sample.
Energies 13 02064 g010
Figure 11. Thermogravimetric analysis of oat straw for the production of carbonized solid biofuel at temperature 420 °C in N2 atmosphere.
Energies 13 02064 g011
Figure 12. The Van Kravelen diagram shows location of torrefaction products: torrefied straws in diagram in relation to coal and other conventional fuels.
Energies 13 02064 g012
Figure 13. Summary of maize straw torrefaction curves with DTG curves.
Energies 13 02064 g013
Figure 14. Summary of oat straw torrefaction curves with DTG curves.
Energies 13 02064 g014
Figure 15. Maize straw torrefaction process TGA analysis results and process conditions as in temperature and optimal mass loss for production of biofuel, additive for natural fertilizers, activated carbon (Figure 15a heating rate 5 K/min, Figure 15b 10 K/min, Figure 15c 20 K/min).
Energies 13 02064 g015
Figure 16. Oat straw torrefaction process TGA analysis results and process conditions as in temperature and optimal mass loss for production of biofuel, additive for natural fertilizers, activated carbon (Figure 16a heating rate 5 K/min, Figure 16b 10 K/min, Figure 16c 20 K/min).
Energies 13 02064 g016
Figure 17. TG curve and ion current curves for the maize straw torrefaction process carried out up to 525 °C.
Energies 13 02064 g017
Figure 18. TG curve and ion current curves for the oat straw torrefaction process carried out up to 525 °C.
Energies 13 02064 g018
Figure 19. Mass loss of maize and oat straw after torrefaction process in CO2 atmosphere using electrical furnace.
Energies 13 02064 g019
Figure 20. (a) VOC emission in ppm of maize straw during torrefaction process in electrical furnace in CO2 atmosphere. (b) VOC emission in ppm of oat straw during torrefaction process in electrical furnace in CO2 atmosphere.
Energies 13 02064 g020
Figure 21. Emission index for maize and oat straw torrefaction process using electrical furnace.
Energies 13 02064 g021
Table 1. Activation energy and pre-exponential coefficient as a function of the degree of conversion by the Ozawa–Flynn–Walla method for a maize straw sample.
Fract. Mass LossActivation Energy (kJ/mol)lg (A/s−1)
0.02130.22 ± 44.53−11.16
0.05100.17 ± 1.635.01
0.1098.25 ± 1.5510.66
0.20124.47 ± 15.819.34
0.30143.37 ± 19.3310.98
0.40157.89 ± 18.6712.14
0.50159.71 ± 9.2812.09
0.60160.44 ± 3.2111.98
0.70167.82 ± 14.1012.49
0.80189.33 ± 7.2014.11
Table 2. Activation energy and pre-exponential coefficient as a function of the degree of conversion by the Ozawa–Flynn–Walla method for an oat straw sample.
Fract. Mass LossActivation Energy (kJ/mol)lg (A/s−1)
0.028.09 ± 41.76−3.68
0.0548.59 ± 73.951.34
0.10130.83 ± 79.659.86
0.20150.43 ± 62.4911.53
0.30159.74 ± 45.5012.24
0.40164.08 ± 11.5312.47
0.50156.15 ± 14.2211.61
0.60146.78 ± 28.3510.66
0.70141.47 ± 40.2310.08
0.80180.60 ± 111.7913.19
Table 3. Elemental analysis and technical analysis of maize and oat straws before and after torrefaction process.
Biomass TypeMoisture, (%)C ad,
(%)
N ad,
(%)
H ad,
(%)
S ad,
(%)
Cl,
(%)
Volatile ad (%)Ash (%)High Heating Value, (MJ/kg)
Maize straw7.742.30.635.610.070.11582.44.216.86
Torrefied maize straw:
(2575 °C, 10 min)3.151.900.364.970.050.01463.784.8421.35
(300 °C, 7 min)1.854.040.254.630.050.01351.116.9722.21
(525 °C, 5 min)1.358.290.153.470.040.01237.2310.1226.98
Oat straw7.844.100.655.870.090.23077.85.017.74
Torrefied oat straw:
(2575 °C, 9 min)3.853.790.235.640.010.01264.805.5421.54
(300 °C, 6 min)2.555.450.225.420.010.01249.987.2622.74
(525 °C, 5 min)2.158.950.144.120.010.01036.6110.427.09
ad Add dry basis.

