Article

Evaluation of the Reception Capacity of a Certain Area Regarding Tourist Housing, Addressing Sustainable-Tourism Criteria

by
Jose Antonio Fernández Gallardo
1,*,
Jose María Caridad y Ocerín
2 and
María Genoveva Millán Vázquez de la Torre
3
1
Department Agricultural Economics, Sociology, and Policy, Faculty of Economics and Business Sciences, University of Cordoba, 14002 Cordoba, Spain
2
Department of Statistics and Econometrics, Faculty of Economics and Business Sciences, University of Cordoba, 14002 Cordoba, Spain
3
Department of Quantitative Methods, Faculty of Economics and Business Sciences, Universidad Loyola Andalucia, 14004 Cordoba, Spain
*
Author to whom correspondence should be addressed.
Sustainability 2019, 11(22), 6422; https://doi.org/10.3390/su11226422
Submission received: 18 September 2019 / Revised: 8 November 2019 / Accepted: 11 November 2019 / Published: 15 November 2019
(This article belongs to the Special Issue Optimal Tourism Development)

Abstract

:
The emergence of new 2.0 net collaborative economies has brought an increase in the number of tourists, changing the paradigm of the tourist-housing sector in the main cities around the world. This has directly impacted inhabitants and land-use planning, and there is no general agreement yet between different public and private agents on how to deal with the problem. In this document, a model supported by scientific approaches is presented to assist in planning for sustainable land use through assessing its reception capacity to host tourist housing. The area of study is a medium-sized city in Spain with four UNESCO World Heritage Sites. The methodology is based on the application of the multicriteria decision paradigm in the geographical information systems’ field to deal with complex problems with several alternatives and various criteria to be evaluated. As a result, we obtained a classification of every part of the study area, depending on the reception capacity of the considered uses. The main conclusion is that tourist housing must be regulated, although its effects cannot be generalized, since specific analysis for every neighborhood in a territory is needed.

1. Introduction

Tourist activity is one of the main sources of wealth in many areas. However, it also affects the environment, cultural resources, and the hosting population. Due to this, the World Tourism Organization (UNWTO) is urging different governments to consider sustainability as a global goal.
The emergence of new 2.0 net collaborative economies has brought about an increase in the number of travelers and the intensification of mass tourism, induced by a change in paradigm on the tourist-housing sector in major cities around the world, due to the proliferation of tourist housing.
There does not seem to be consensus on the definition of the collaborative-economy concept [1]; neither the European legal system nor that of each of the member states seems to be able to solve the problems that could arise from these new forms of business [2]. Hence, the European Commission decided to publish the “European Agenda for the collaborative economy” in which recommendations were directed to national legislators to adapt the regulations of the member states to the new needs of the emerging market for a collaborative economy. The European Commission [3] defines a collaborative economy as “Business models in which activities are facilitated through collaborative platforms that create an open market for the temporary use of goods or services often offered by individuals. In general, collaborative-economy transactions do not imply a change in ownership and can be done with or without profit”. Within a collaborative economy, the services that have experienced the fastest growth have been those related to transport and accommodation, both being closely related to tourism. Regarding the accommodation sector, one can find modalities in which there is no compensation, such as “couch-surfing” or “warm showers” [4]; in others, such as “home-swapping” or “night-swapping”, there is reciprocity between participants [5]. On the other hand, we find modalities in which monetary consideration is paid, which is the case with our study. This sector has already accounted for more than 50% of the total number of operations carried out in Europe in 2015 within the scope of the collaborative economy [6].
According to information provided by DataHippo [7], over 238,000 adverts on Airbnb, one of the most globally important collaborative-economy sites, colonizes cities and tourist areas around Spain. Madrid and Barcelona are at the top of the list, followed by accommodation adverted on the Mediterranean coastline and the Canary and Balearic archipelagos. This is a specialized market, where only 5% of property owners are professionals, and individuals with more than one property represent one-third of tourist-housing offers.
However, not all tourist increase has been positive in its entirety; there are critical movements of the recent tourist development and growth, which shows that this is a globally shared phenomenon. Some of these negative effects can be seen in issues such as Touristification and gentrification processes in Berlin [8,9], tensions due to socio-spatial transformations and touristification processes in the slums in Rio de Janeiro [10]; social unrest because of housing dispossession and the urban revalorization and touristification processes in Palma de Mallorca historical center [11]; the rising unrest and annoyance regarding the overcrowding and socio-spatial transformations in the center of Amsterdam [12,13]; the emergent mobilization related to the impact of tourism on Paris, especially regarding the proliferation of tourism housing [14]; the so-called Airbnb syndrome in Reykjavik [15]; the riots against cruises because of the increase in cruise passengers [16] and the consultative referendum held in Venice; the protests carried out by Hong Kong citizens against Chinese tourists [17]; and the emergence of people resisting the use of the land and local resources in Goa, India [18].
In many tourist destinations, the debate has focused on wider analysis of urban and political processes, and existing forces favor a growing “politicization from the grassroots” [19]. It should be noted that, in the tourist landscape, it is not only a matter of draining resources but also the rupture of necessary conditions for tourist activity to be satisfactory for all involved agents. Thus, every destination, depending on its particularities, products, and services, has to be assessed considering their capacity to bear tourist pressure [20].
One of the most significant cases is how tourist housing is affecting the prices of the real-estate market. In Spain, the average housing-rent price has increased by 18.6% in the last five years, between 2013 and 2018, Barcelona being the city with the highest increase (47.5%), followed by Madrid (38%), according to real-estate agency Fotocasa [21]. Moreover, five provinces, Baleares, Las Palmas, Salamanca, Barcelona, and Madrid, have already reached their historical maximum in 2018, exceeding the figures in 2007. Henceforth, although there are barely surveys to confirm it, many sectors relate this increase in rent prices to the proliferation of tourist housing, which is also said to be accelerating urban-gentrification processes.
As can be observed, the tourist-housing phenomenon is not free from controversy. There is confrontation between social and economic agents in the cities, since there is no global legal regulation regarding this phenomenon; in the case of Spain, autonomous communities and city councils are the responsible institutions for launching various regulatory initiatives.
The lack of a model regulating the tourist-housing phenomenon might involve serious risks. Before such a situation, deciding agents need to be provided with a tool that enables them to diagnose the situation, so that they can suggest initiatives to move towards a sustainable tourist model. It is necessary for them to analyze the concept of reception capacity that theoretically refers to the optimal use of land pursuant to its sustainability. Gómez and Gómez [22] defines it as “an area’s degree of adequacy or capacity for a certain activity, bearing in mind both how the environment meets its locational requirements and the effects of that activity on the environment,” outlining the contribution by Canter [23,24,25], Clark and Bisset [26], Rau and Wooten [27], Hollick [28], and Lee [29,30], among others. To study reception capacity, different authors have offered a scientific basis to techniques and procedures: Voogd [31], Janssens [32], Eastman et al. [33], Jankowski [34], Triantaphyllou [35], Roy [36], and Munda [37], and, in Spain, Romero [38], Barredo [39], Barba and Pomerol [40], Santos [41], Moreno [42,43], and Galacho and Arrebola [44]. In this sense, the bibliography highlighting multicriteria assessment techniques, combined with geographical information systems to evaluate an area’s reception capacity on various topics, is extensive: Barredo and Bosque [45], Ocaña and Galacho [46], Bosque and Moreno [47], Gómez y Barredo [48], Molero et al. [49], Moreno and Buzai [50], and Galacho and Arrebola [44].
To face the issue of the development of tourist housing, the present work’s objective is to offer a methodology supported by multicriteria decision methods in the field of geographical information systems, that enables us to assess tourist-housing reception capacity in Cordoba (Spain) based on tourist-sustainability criteria. Cordoba is a city with four UNESCO World Heritage Sites, with a great tourist claim, and with important threats and weaknesses regarding tourist housing according to a study carried out by the Council of Cordoba [51].
According to Galacho and Ocaña [46], “the advantage of the combined use of multicriteria decision methods and geographical information systems is the possibility of rigorously solving the interrelation between the different variables of the area”. As a result, we obtained an information layer about the city’s central district that classifies every neighborhood based on an assigned rating according to value judgments. These judgments were defined following the guidelines set by the World Tourism Organization regarding issues that must be considered when planning a destination under sustainability goals.

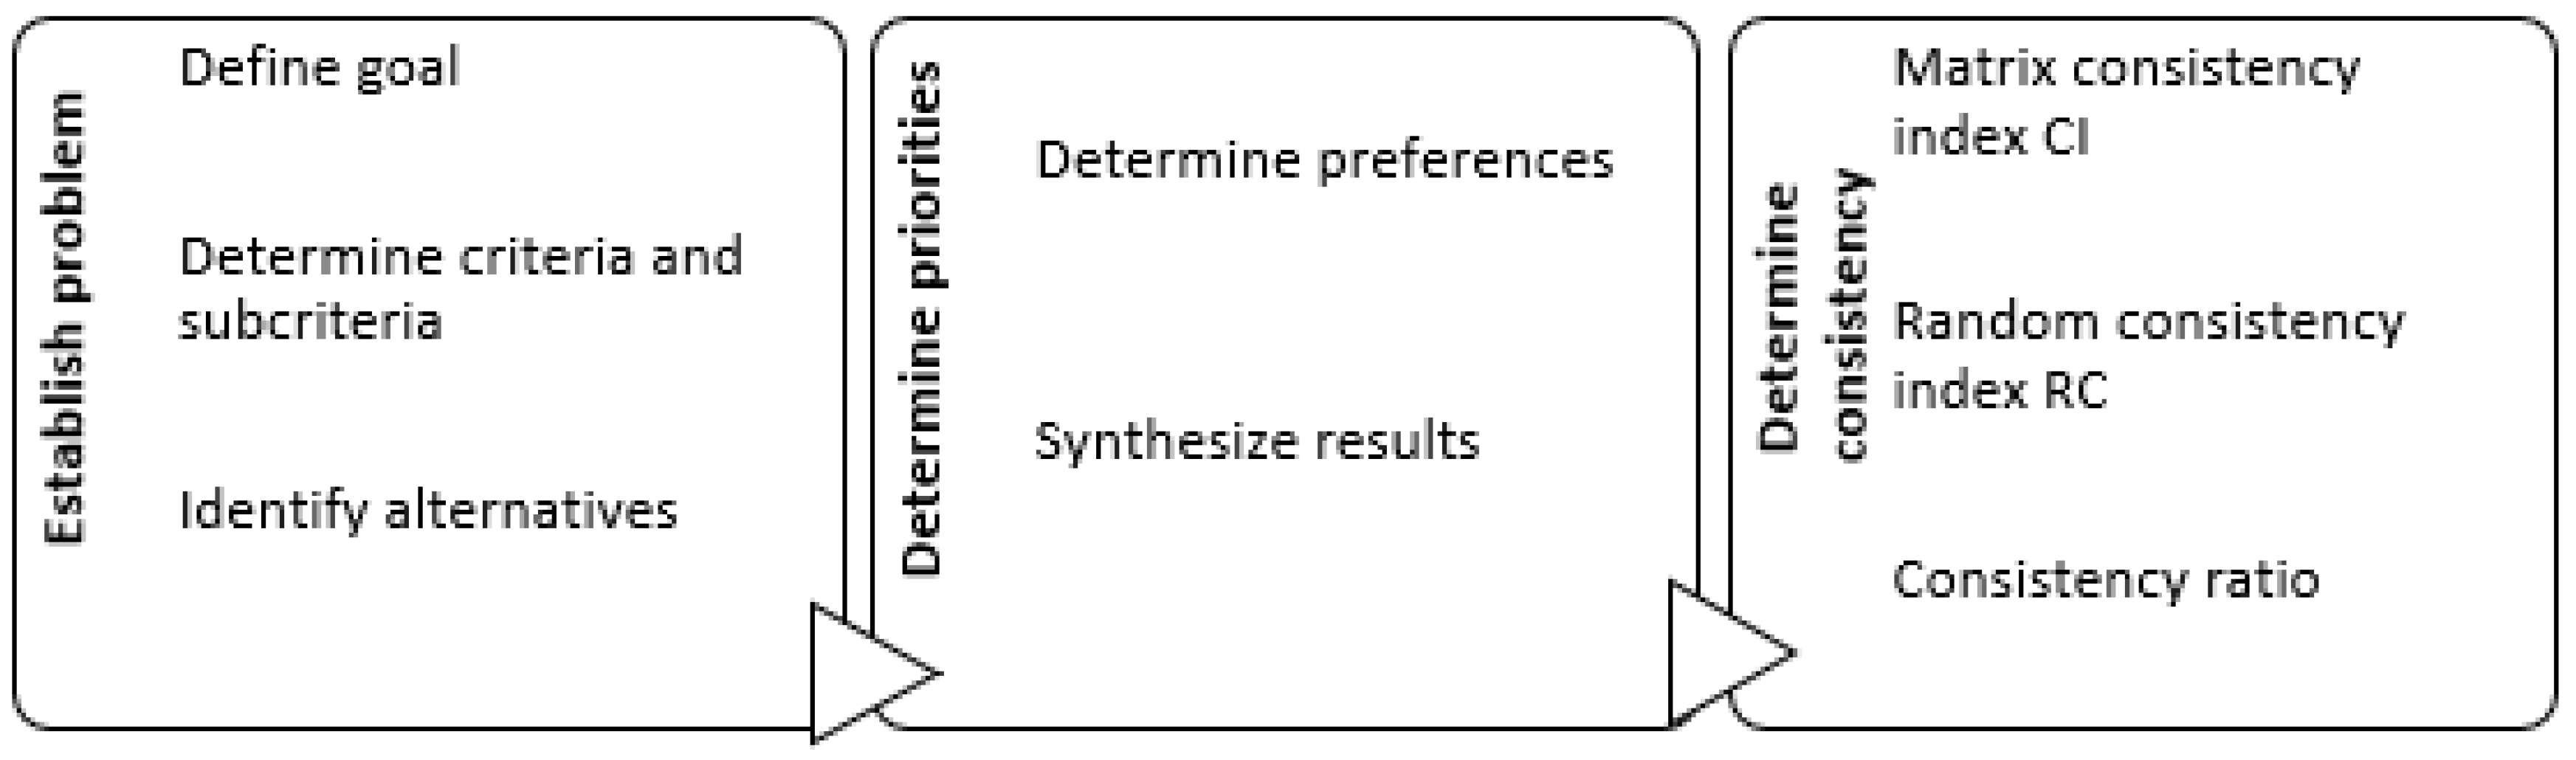
2. Materials and Methodology

To analyze the tourist-housing reception capacity of Cordoba, we used the analytic hierarchical process (AHP), developed by Tomas L. Saaty [52]. This is a tool to address the discrete multicriteria decision problems, consisting of different criteria and a certain number of alternatives, considering the opinions of all the agents that intervene in the decision. The problem is displayed on a hierarchical structure that indicates the objective, criteria, subcriteria, and corresponding alternatives to then calculate the influence of every factor that is part of the problem. The resulting choice is then justified since it is based on the obtained numerical results, favoring the transparency and objectivity of the process.
The chart below represents the phases of the analytic hierarchical process (see Figure 1).

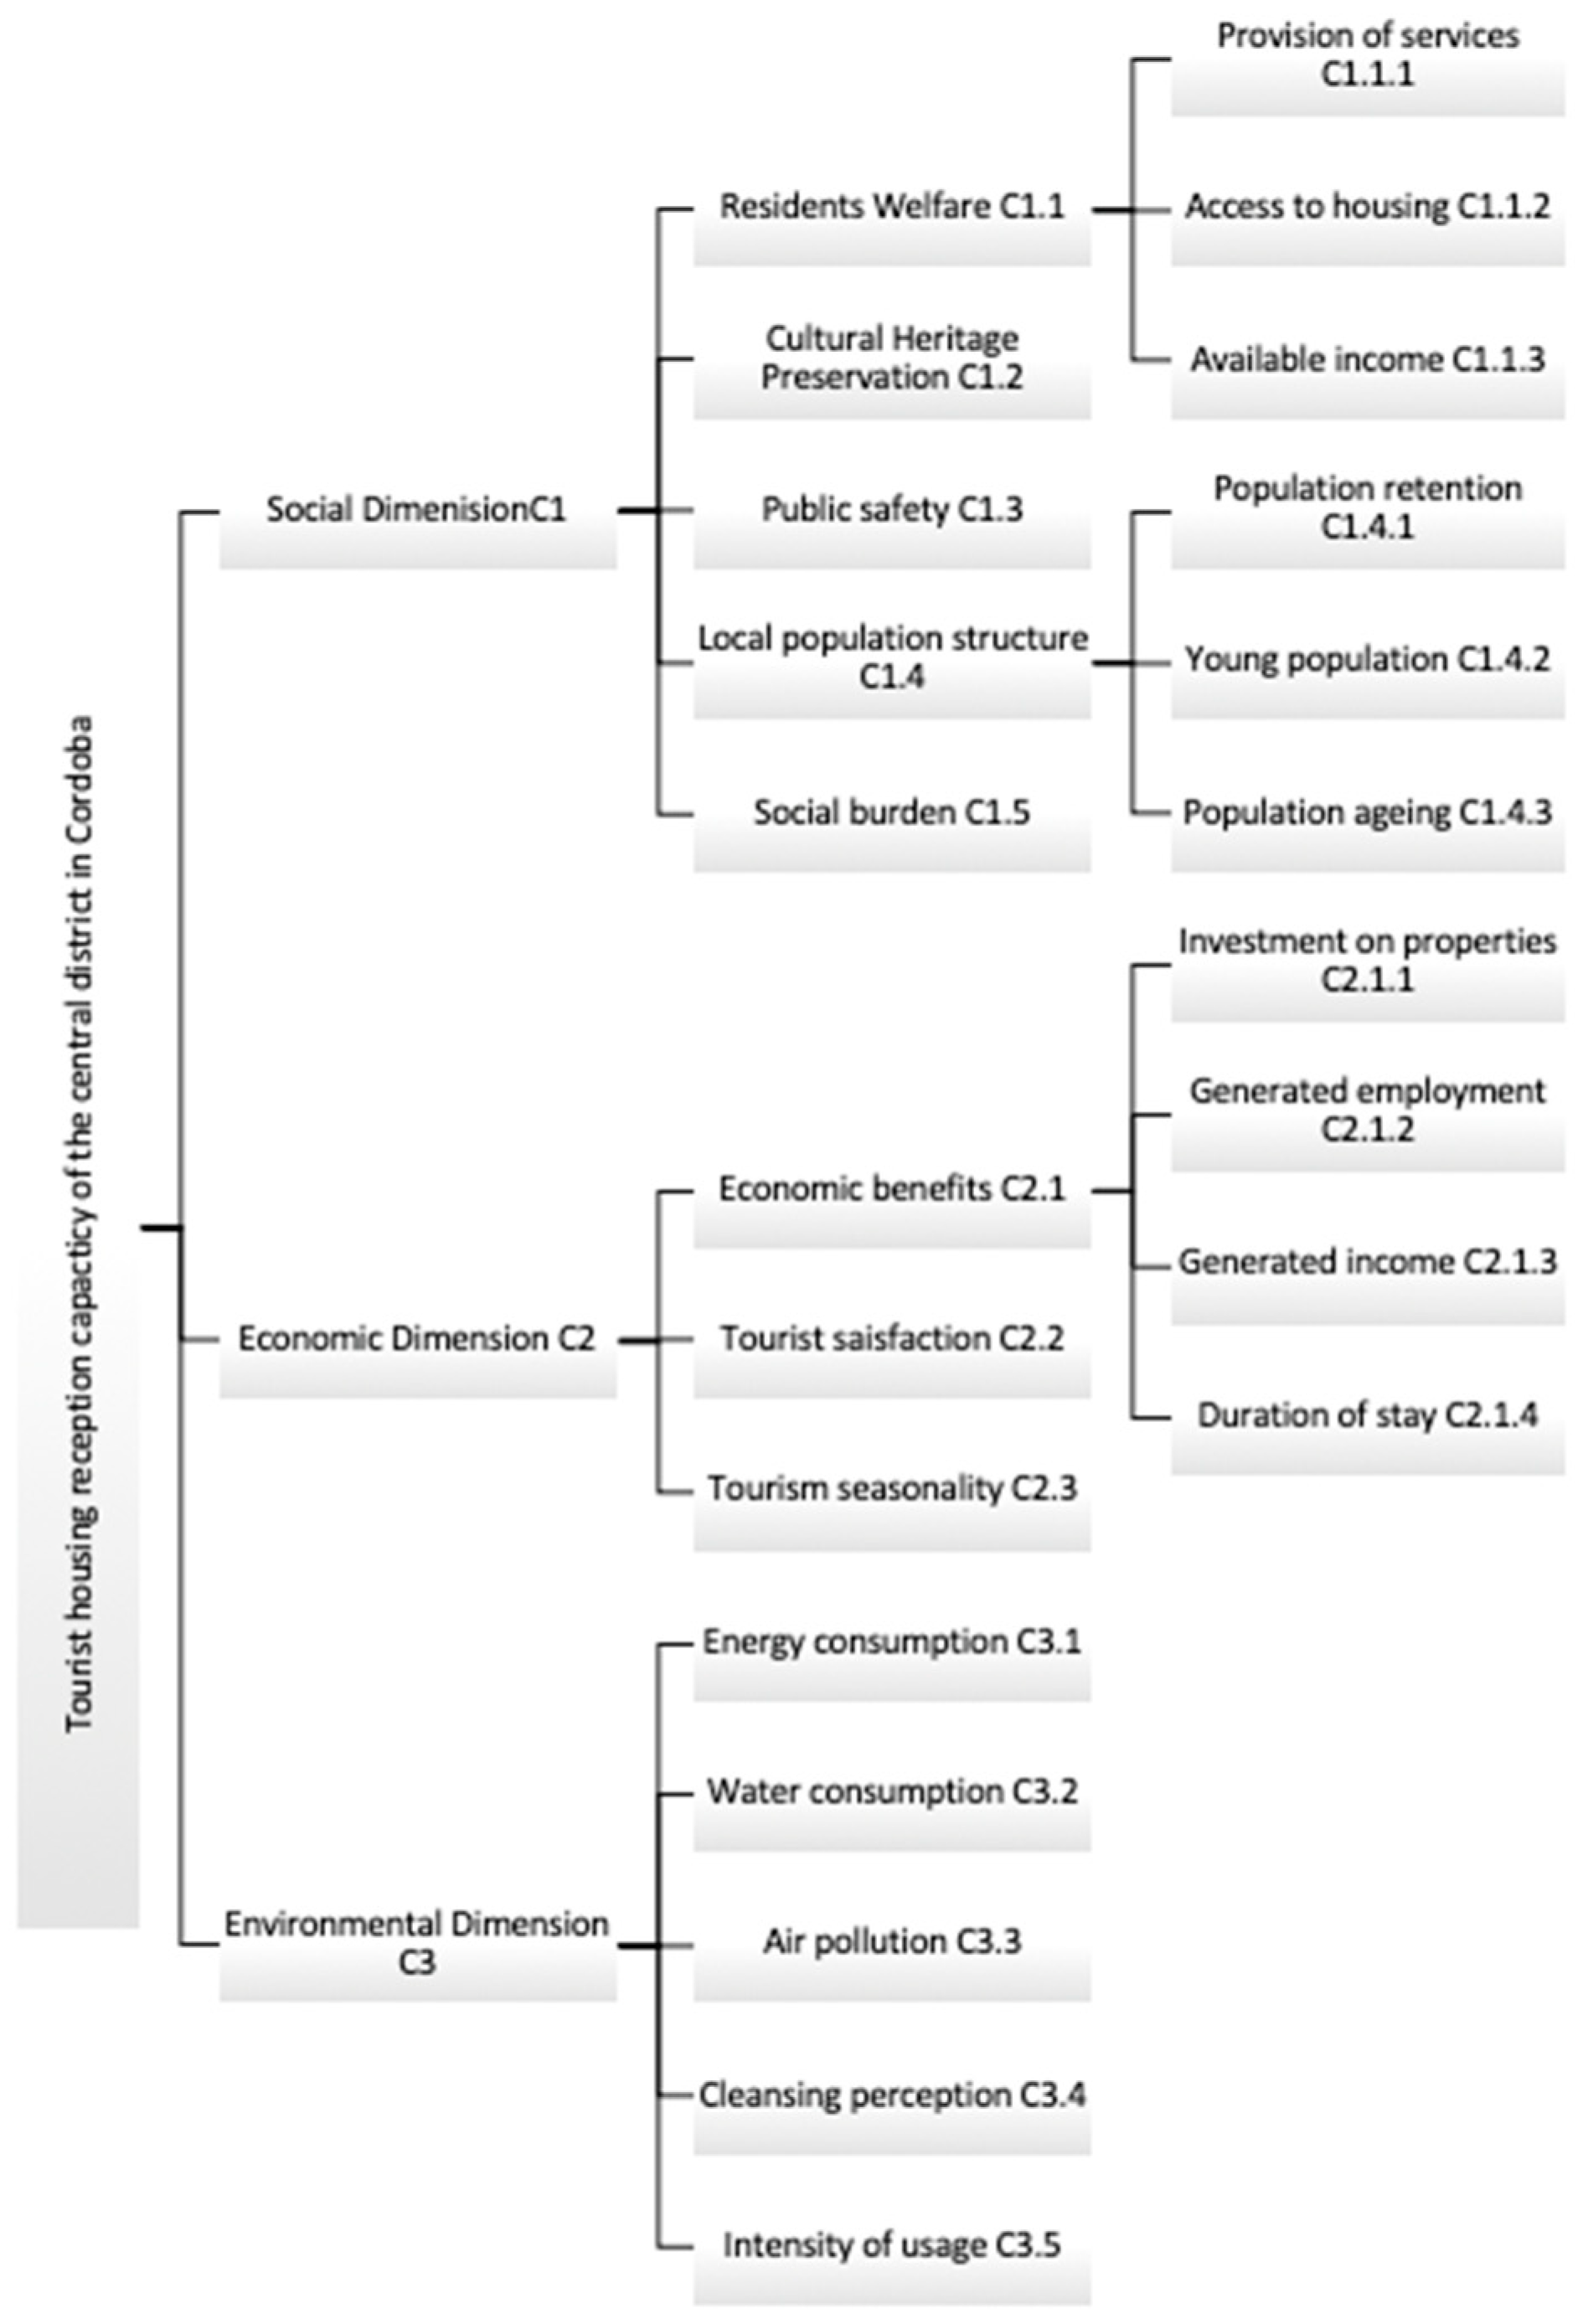
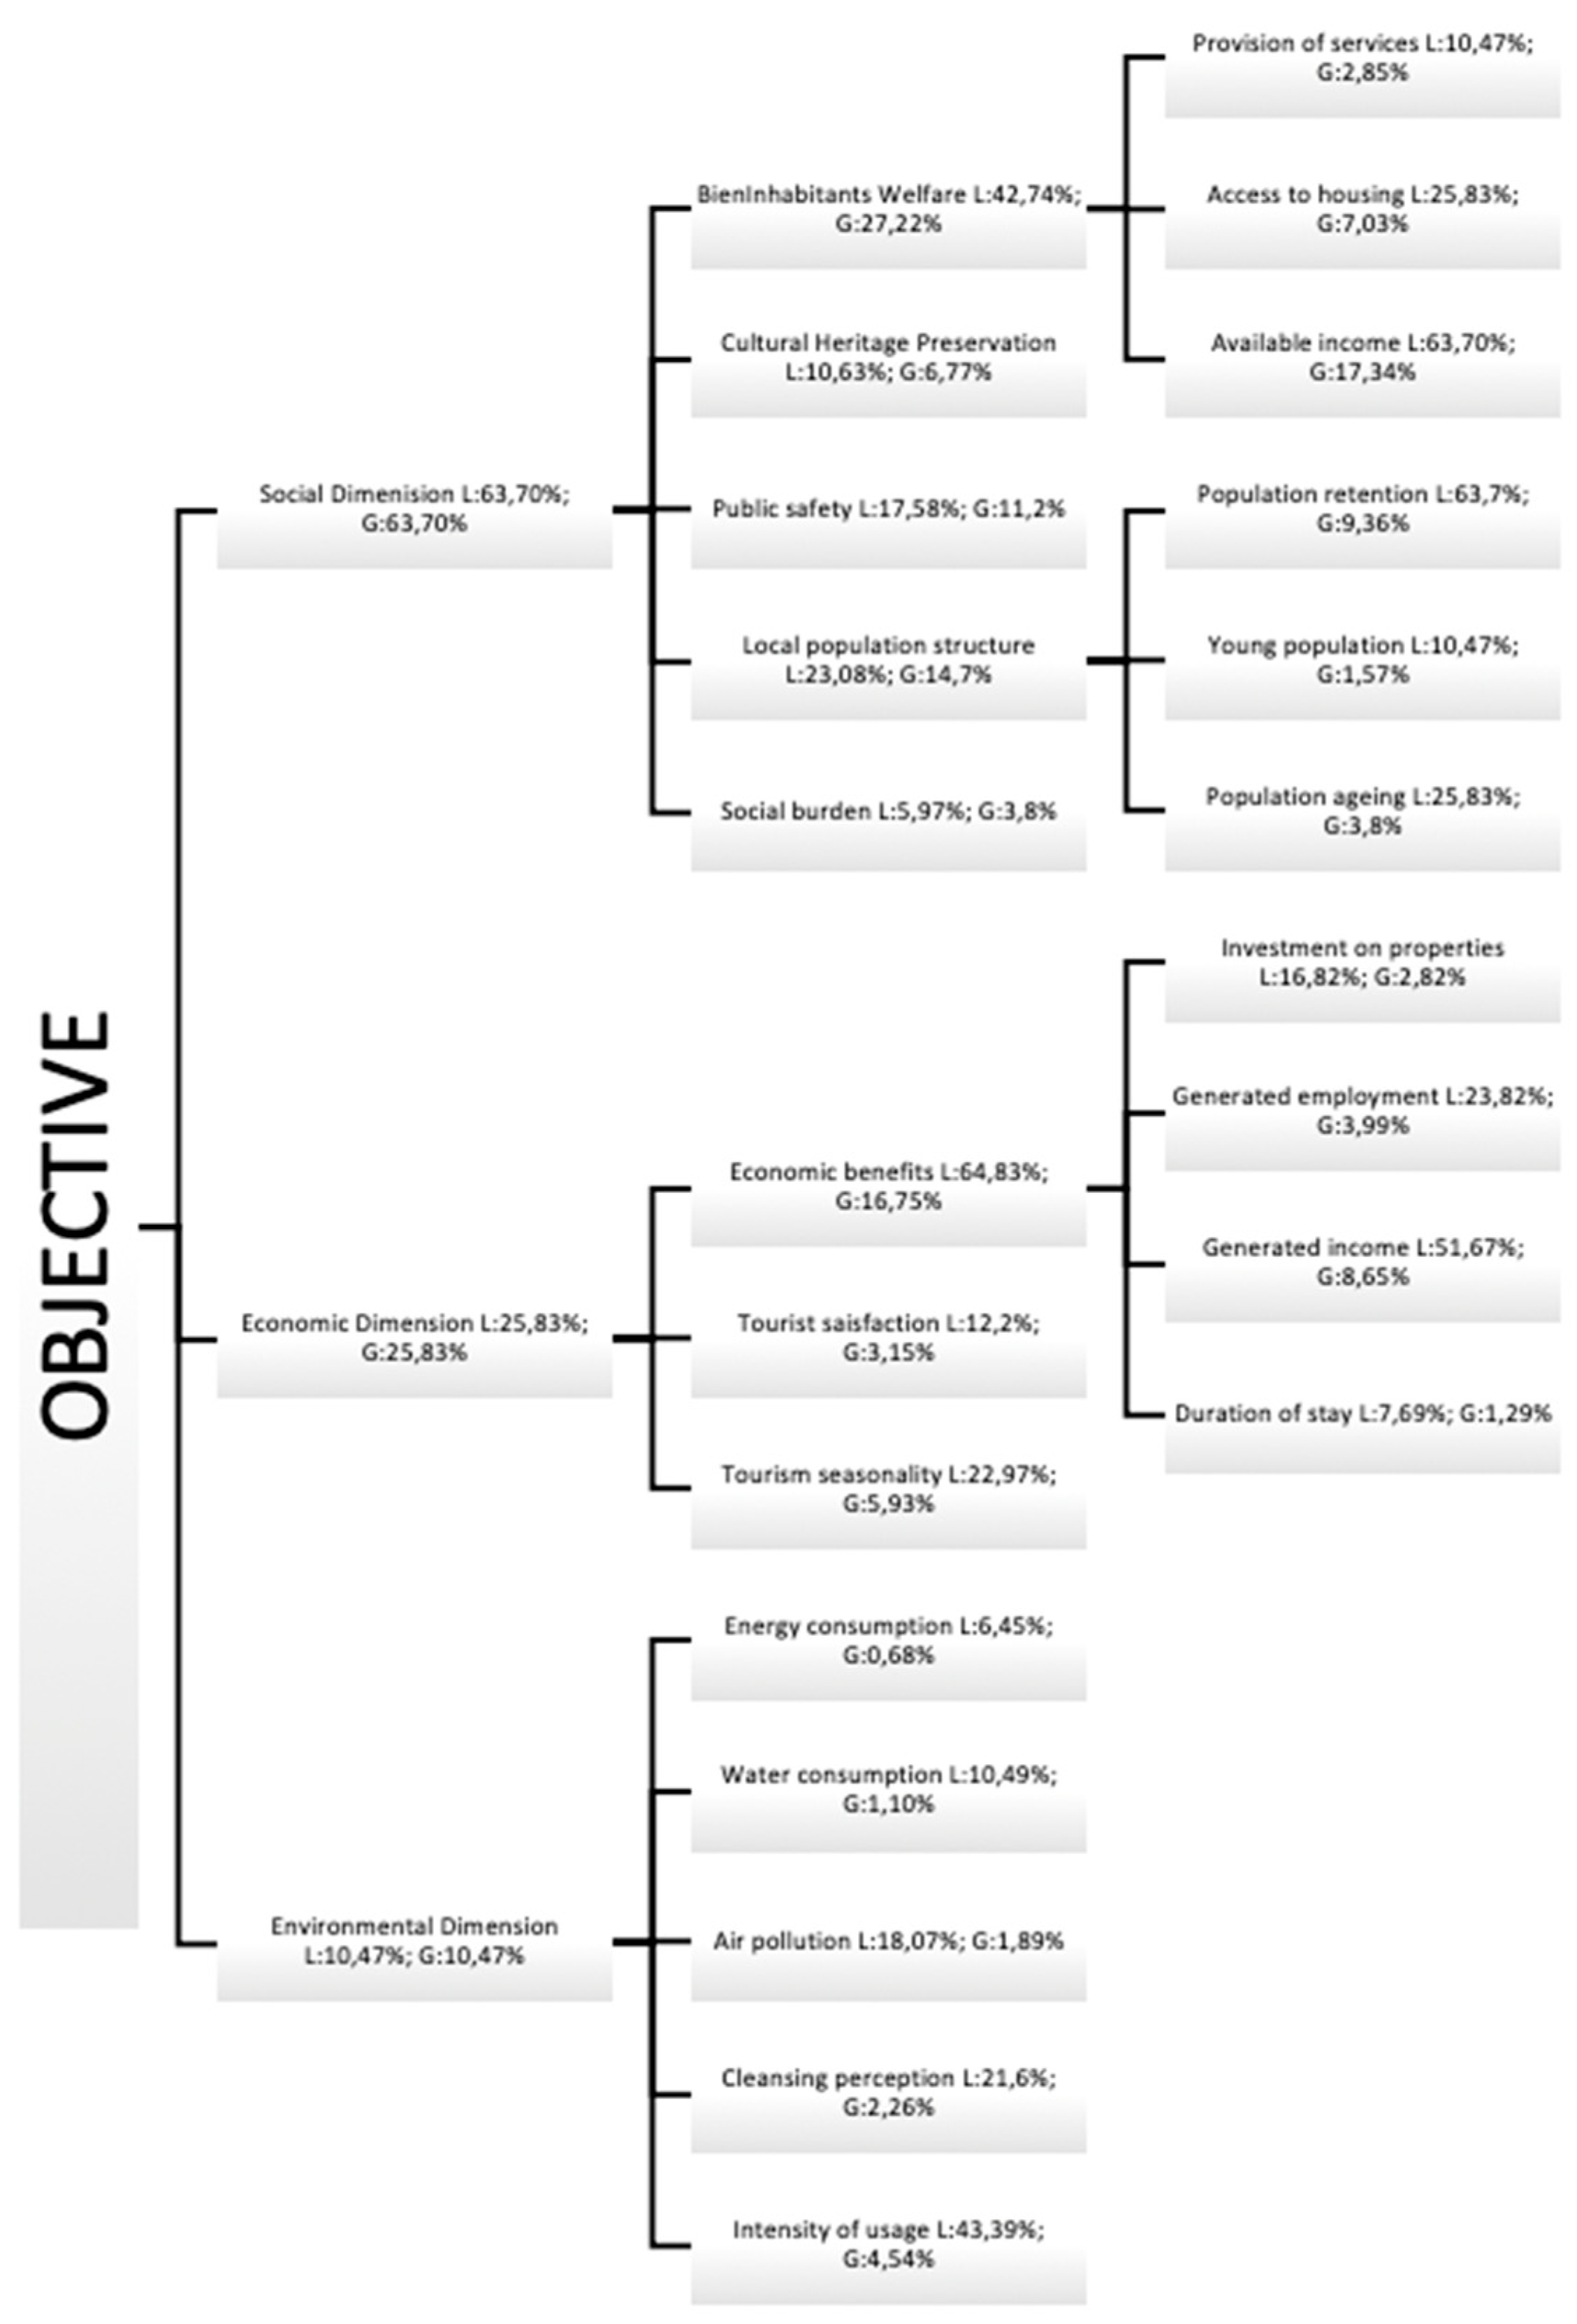
2.1. Determining Criteria, Subcriteria, and Alternatives

According to the World Tourism Organization (UNTWO) [54], sustainable tourism is defined as the one that “meets the needs of present tourists and host regions while protecting and enhancing opportunities for the future. It is envisaged as leading to the management of all resources in such a way that economic, social, and aesthetic needs can be fulfilled while maintaining cultural integrity, essential ecological processes, biological diversity, and life-support systems”. To measure the degree of sustainability, the OECD [55] distinguishes two approaches, the accounting and the analytical; in our study, we opted for the analytical since it provides adequate multidimensional evaluation as a local planning tool according to the objective of our research. This instrument, according to this approach, is given by “a set of indicators of sustainable tourism, understanding as such the measures that provide the necessary information to better understand the links and impact of tourism with respect to the cultural and natural environment in which it develops activity and on which it is widely dependent” [56]. Therefore, to obtain an analytical measure of sustainability, it is necessary to disaggregate the sustainable-tourism objective by identifying the aspects that constitute each dimension, and identifying the indicators that allow measuring each of the above aspects. To ensure that their values show progress towards a more sustainable state, indicators must meet the criteria of scientific validity, representativeness, relevance, reliability, sensitivity, predictive nature, understandability, comparability, quantification, cost efficiency, transparency, and geographical coverage [57]. Once the system was defined, we assigned the variables taking as reference specialized works that define sustainability indicators at the local level. Attending to the objective of our research and our area under study being the city of Cordoba (Spain), we took works as reference that defined a set of synthetic indicators of sustainable tourism for the tourist destinations of Andalusia (Spain): Blancas et al. [58]; Ávila et al. [59]; Dachary and Arnáiz [60]; Fullana and Ayuso [61]. For this, we developed a hierarchical structure with three levels (Figure 2). On the first level, the three main criteria (social, economic, and environmental dimension) are shown, each one defined based on new subcriteria corresponding to the second (13 subcriteria) and a third level (10 subcriteria), respectively. In the social dimension, issues related to the socio-cultural impact that tourist housing has on the environment, the resident population, and cultural heritage were collected; in the economic dimension, aspects related to tourism activity as economic activity and its viability are represented in the long term; finally, in the environmental-dimension criterion, aspects related to the protection and preservation of the environment, as well as the future viability of tourism, were considered.
The criteria and subcriteria obtained from the three previously mentioned dimensions were used to value the alternatives in the different neighborhoods in the central district of Cordoba (Figure 2). These are the possible approaches to the problem, although the choice does not imply that the chosen alternative is optimal to solve it, but the best among all available possibilities to reach the goal [53].

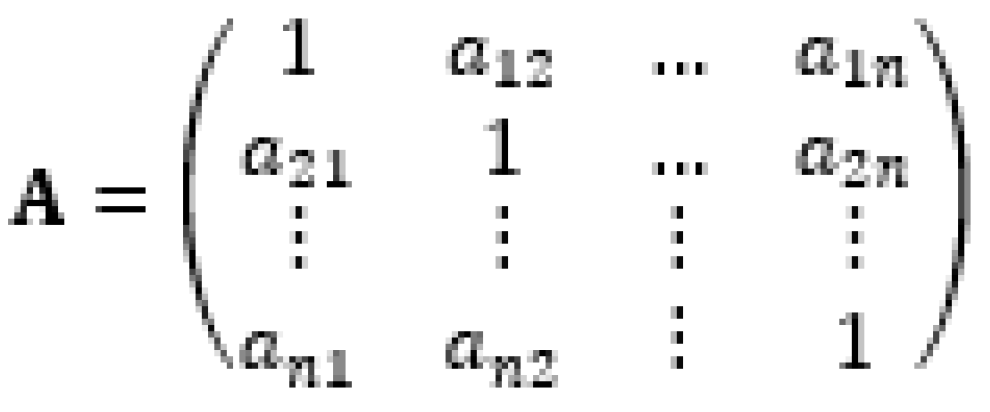
2.2. Determining Preferences

To establish priorities, we needed to compare criteria, subcriteria, and alternatives in pairs. To do so, we made value judgments expressed numerically using Saaty’s AHP fundamental scale [52]. This scale gives punctuations from 1 to 9, 1 being the same importance between two elements and 9 extreme importance of an element over the other. These value judgments were issued by a representation of different groups that are affected by the tourist-housing phenomenon, such as the public sector (public managers) and private sector (restaurant managers, taverns, souvenir shops, traditional commerce, resident residents, tourists, and neighborhood associations); through a total of 148 conducted interviews, nonprobabilistic sampling was carried out for convenience in the case of public officials, the private sector, and neighborhood associations, while for residents and tourists residents, simple random probabilistic sampling was followed. Subsequently, comparisons are represented through the paired-comparison matrix (Figure 3) that shows the dominant and dominated values. It is a square matrix n x n, in which aij, numerically expresses the preference of an element in the i row when compared with an element of the j column, for i= 1, 2, 3, …n and j= 1, 2, 3, …n; therefore, when i = j, the value of aij = 1, since the element is being compared to itself.
This matrix is based on four axioms [65]: reciprocity: a i j = 1 / a j i ; homogeneity, since all compared elements must belong to the same hierarchical level; dependence, which means that there must be hierarchical dependence between elements from two consecutive levels; and consistency, meaning that, when the paired-comparison matrix is perfectly consistent, the following is fulfilled: a i j =   a i k / a j k for i, j and k = 1, 2, 3…n.
Hereafter, we used an approximation method to obtain priorities from judgments given in the comparison matrix n × n. The first step was to procure the normalized matrix: we summed the values on every column and divided every box of the column by its summation:
C j =   i = 1 n a i j   j =   1 , 2 , 3 n .
The normalized paired-comparison matrix is
N = | | n i j = a i j C j | |   i j   =   1 , 2 , 3 n .
Once we had the normalized matrix, we calculated the relative priority of each of the compared elements. We obtained an average value for every row in the normalized matrix, these values being
p i = 1 n j   =   1 n n i j .
Since the hierarchy (Figure 2) is made of criteria and subcriteria, the three criteria’s priorities were calculated according to the objective. Then, comparison matrices were made for each subcriterion, resulting in the relative priorities for each subcriterion on the second level. Those were multiplied by the corresponding criterion’s priority to determine how it affects the objective. The process for the third-level subcriteria was the same. Afterward, to determine each alternative’s priority, 20 relative comparisons matrices were made (corresponding to the 20 not-itemized subcriteria). Subsequently, aspects taken into account and data sources used for the pertinent survey are indicated (Table 1), and all of them properly georeferenced:
  • Provision of services: sociocultural effects of the activity on the environment and the inhabitants of each neighborhood. This aspect was assessed, taking account of the provision of educational, sports, and health centers, financial and service-sector activity establishments, transport services, and pharmacies [58].
  • Access to housing: evaluated according to the average price per square meter of the houses in each alternative [58].
  • Available income: valued depending on the average net annual income per inhabitant in each area.
  • Cultural-heritage preservation: assessed according to the number of protected sites appointed [58].
  • Public safety: evaluated depending on crimes committed in each region.
  • Population retention: valued according to the resident population in each area.
  • Young population: assessed depending on population percentage aged less than or equal to 15 years old in the total of each region.
  • Population aging: evaluation of population percentage aged more than or equal to 65 years old in the total of each area.
  • Social burden: evaluates the imposition of a foreign culture on the inhabitants’ culture, and it is valued according to the percentage of a foreign population over the total population in each region.
  • Investment on properties: valued according to the average price per square meter of houses in each area.
  • Generated employment: assessed depending on the percentage of the registered population in social security over the total population at working age (16–65 years old).
  • Generated income: evaluated according to generated income by activity in the last year.
  • Duration of stay: measurement of the effects that the activity has on the average duration of tourists stay in each region.
  • Tourist satisfaction: measured according to the level of satisfaction declared by tourists in each area.
  • Tourism seasonality: measured depending on the percentage of days that tourist housing is occupied in the last year.
  • Energy consumption: measured according to the consumption of energy in each region.
  • Water consumption: measured depending on the consumption of water in each area.
  • Air pollution: evaluates acoustic contamination during the day, evening, and night, as well as polluting emissions sent to the atmosphere in each region.
  • Cleansing perception: measured according to tourists’ level of satisfaction regarding cleansing.
  • Intensity of usage: measures the proportion of tourist housing over the total of built houses.
QGIS software was used for treating georeferenced information. It was necessary to apply a spatial-disaggregation technique for the following layers of information: population retention, young population, aging population, social burden, and generated employment. Those layers have a 250 × 250 m square polygon vector format, so when assigning data to the territory subject of study, some polygons were divided. To do so, the areal-interpolation technique was used: information about the distribution values of a variable from an origin layer for a certain territory (in this analysis, demographic spatial data in statistical enmeshes) was transferred to another layer of destiny information (territory subject of study) through their intersection. Then, the superficial proportion that each polygon on the origin layer had on the destiny layer was calculated to obtain the distribution of each variable in the new spatial units.
Afterward, we obtained each alternative’s relative priority regarding the corresponding criterion or subcriterion; then, each alternative’s general priority regarding the corresponding criterion or subcriterion was calculated by multiplying the relative priority by the compared criterion or subcriterion’s general priority. Then, all priorities for each alternative were summed to obtain its priority regarding the objective [73]. Finally, the AHP allowed measuring the inconsistence of judgments through the consistency ratio, and they had to be revised and corrected. For 3 by 3 matrices, the value of the consistency ratio had to not be higher than 5%; in the case of 4 by 4 matrices, it would not exceed 9%; for all the other matrixes, it would be 10% or less [73]. The software used to carry out the analytic hierarchical process was Total Decision.
The result of the process is summarized in a layer of information that shows zoning of the studied area with a valuation assigned to every part of the territory depending on its capacity to accept the evaluated uses.

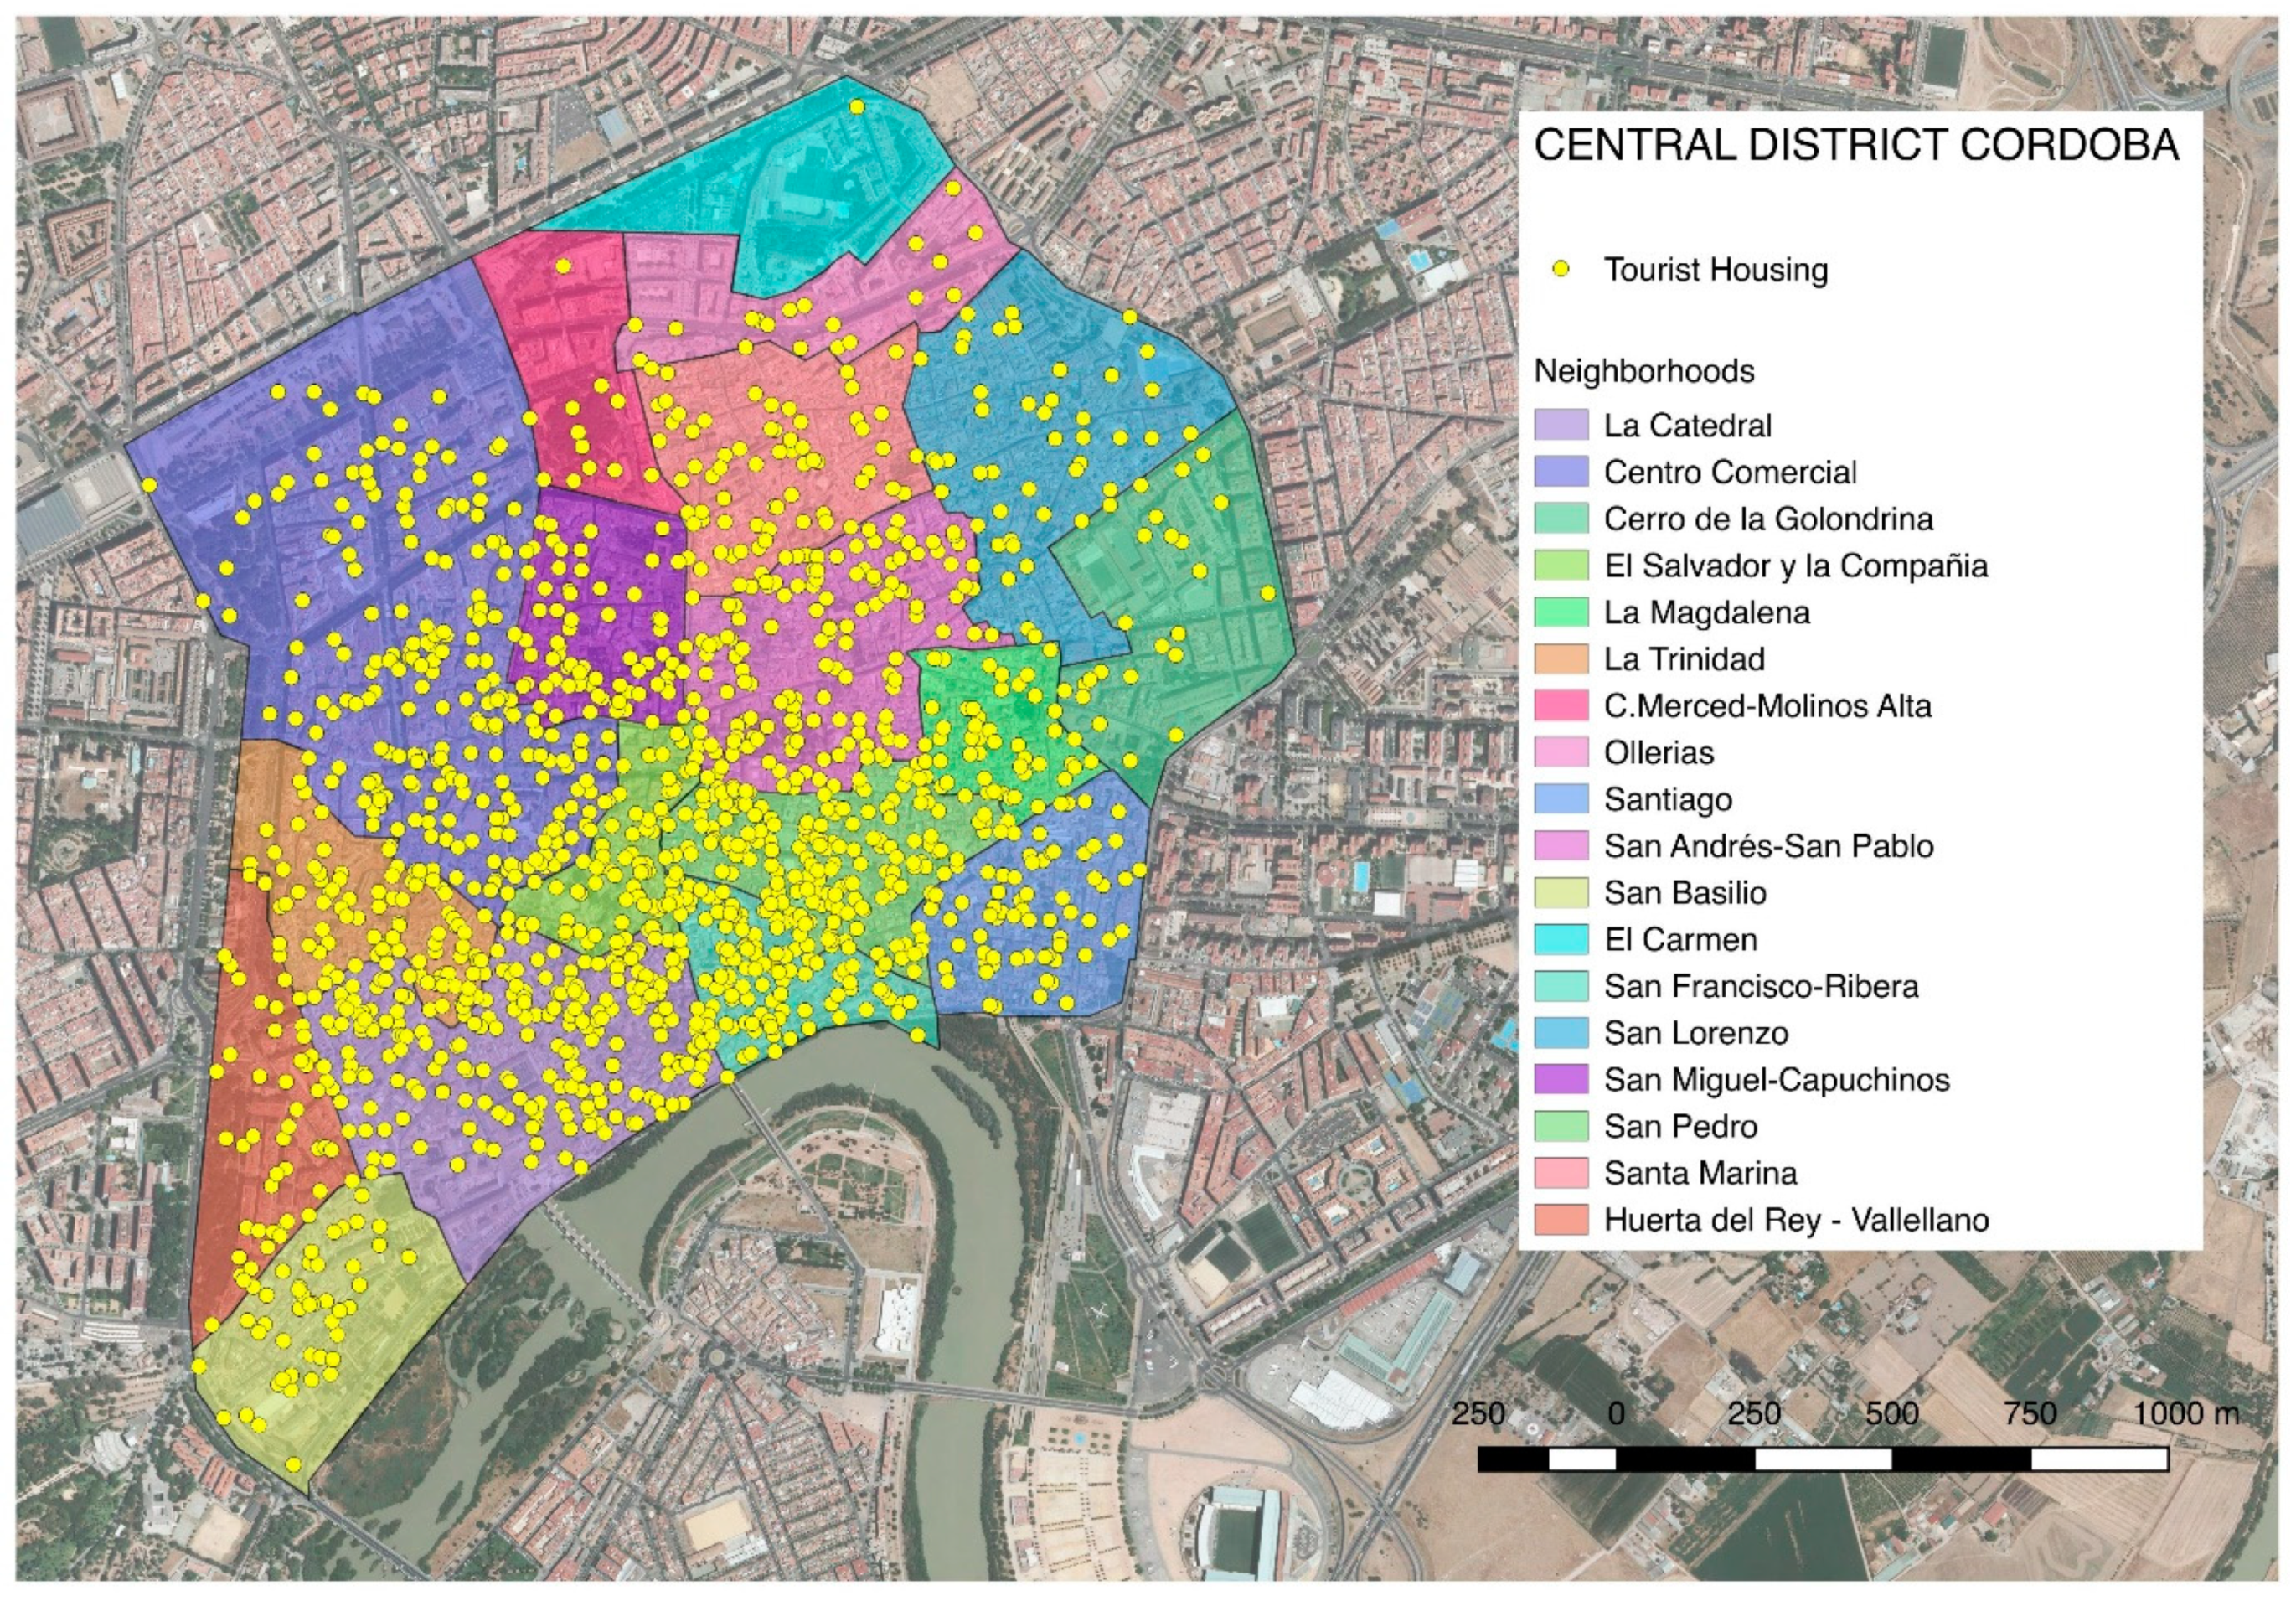
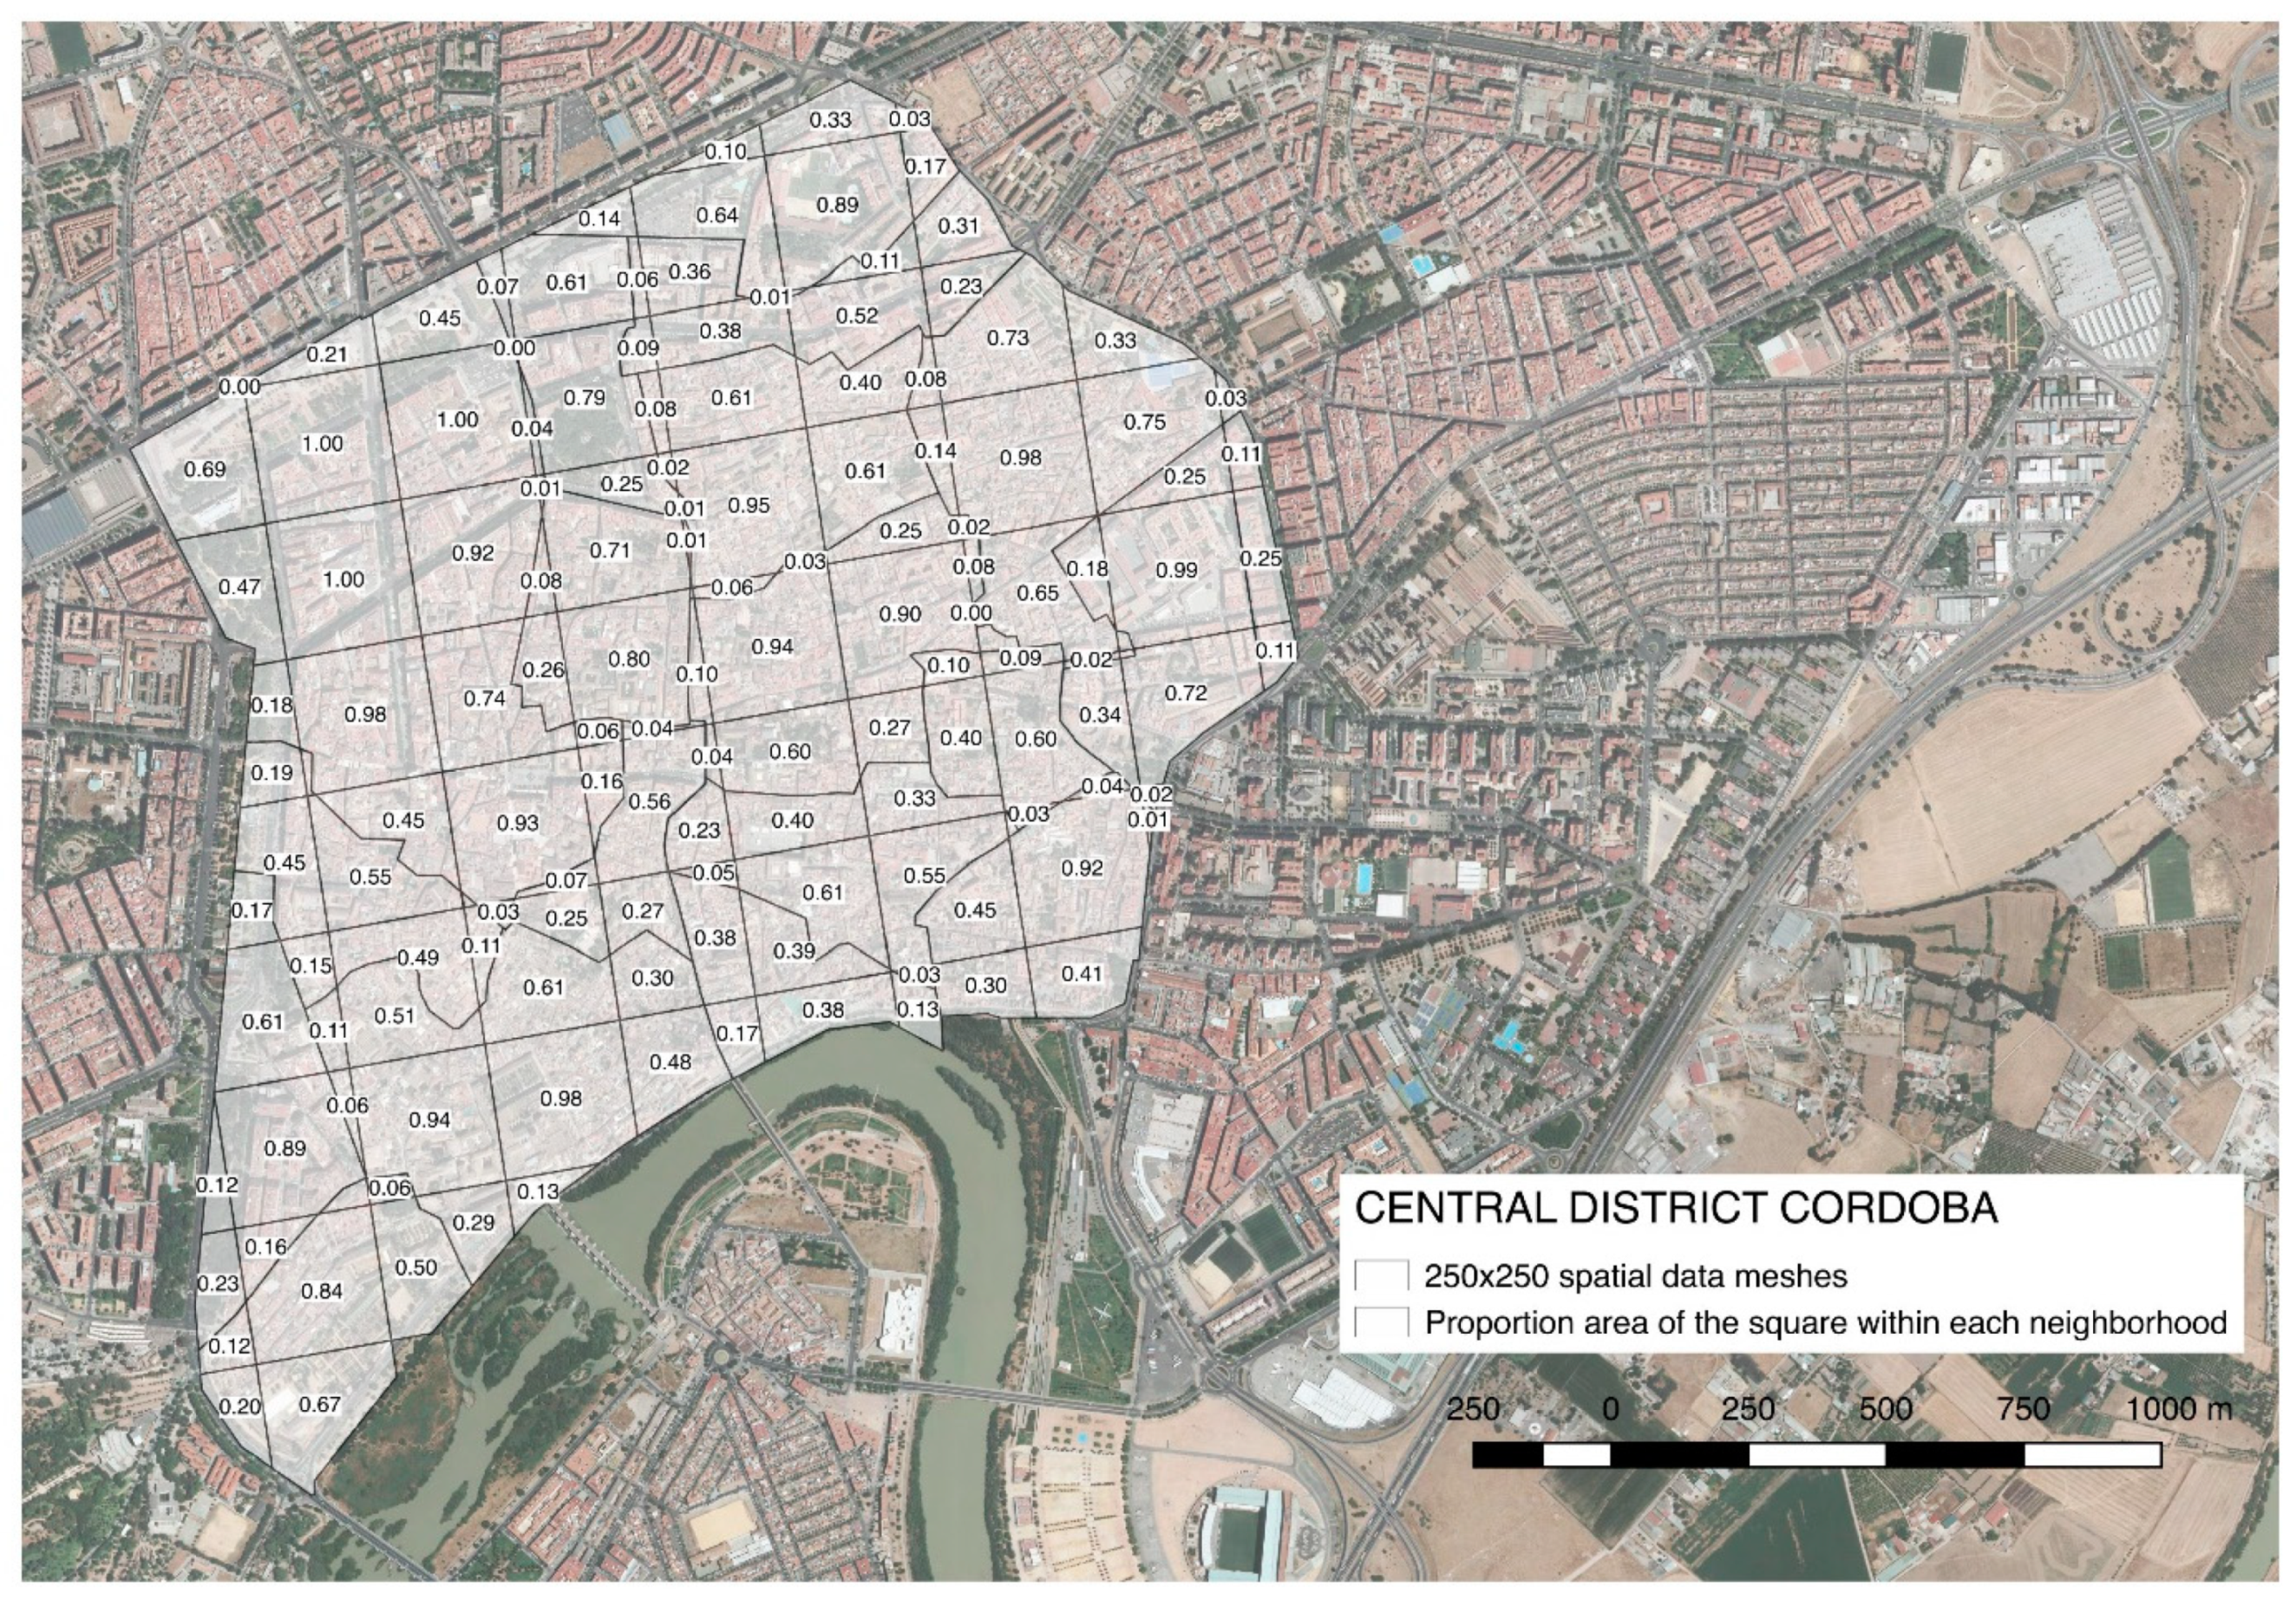
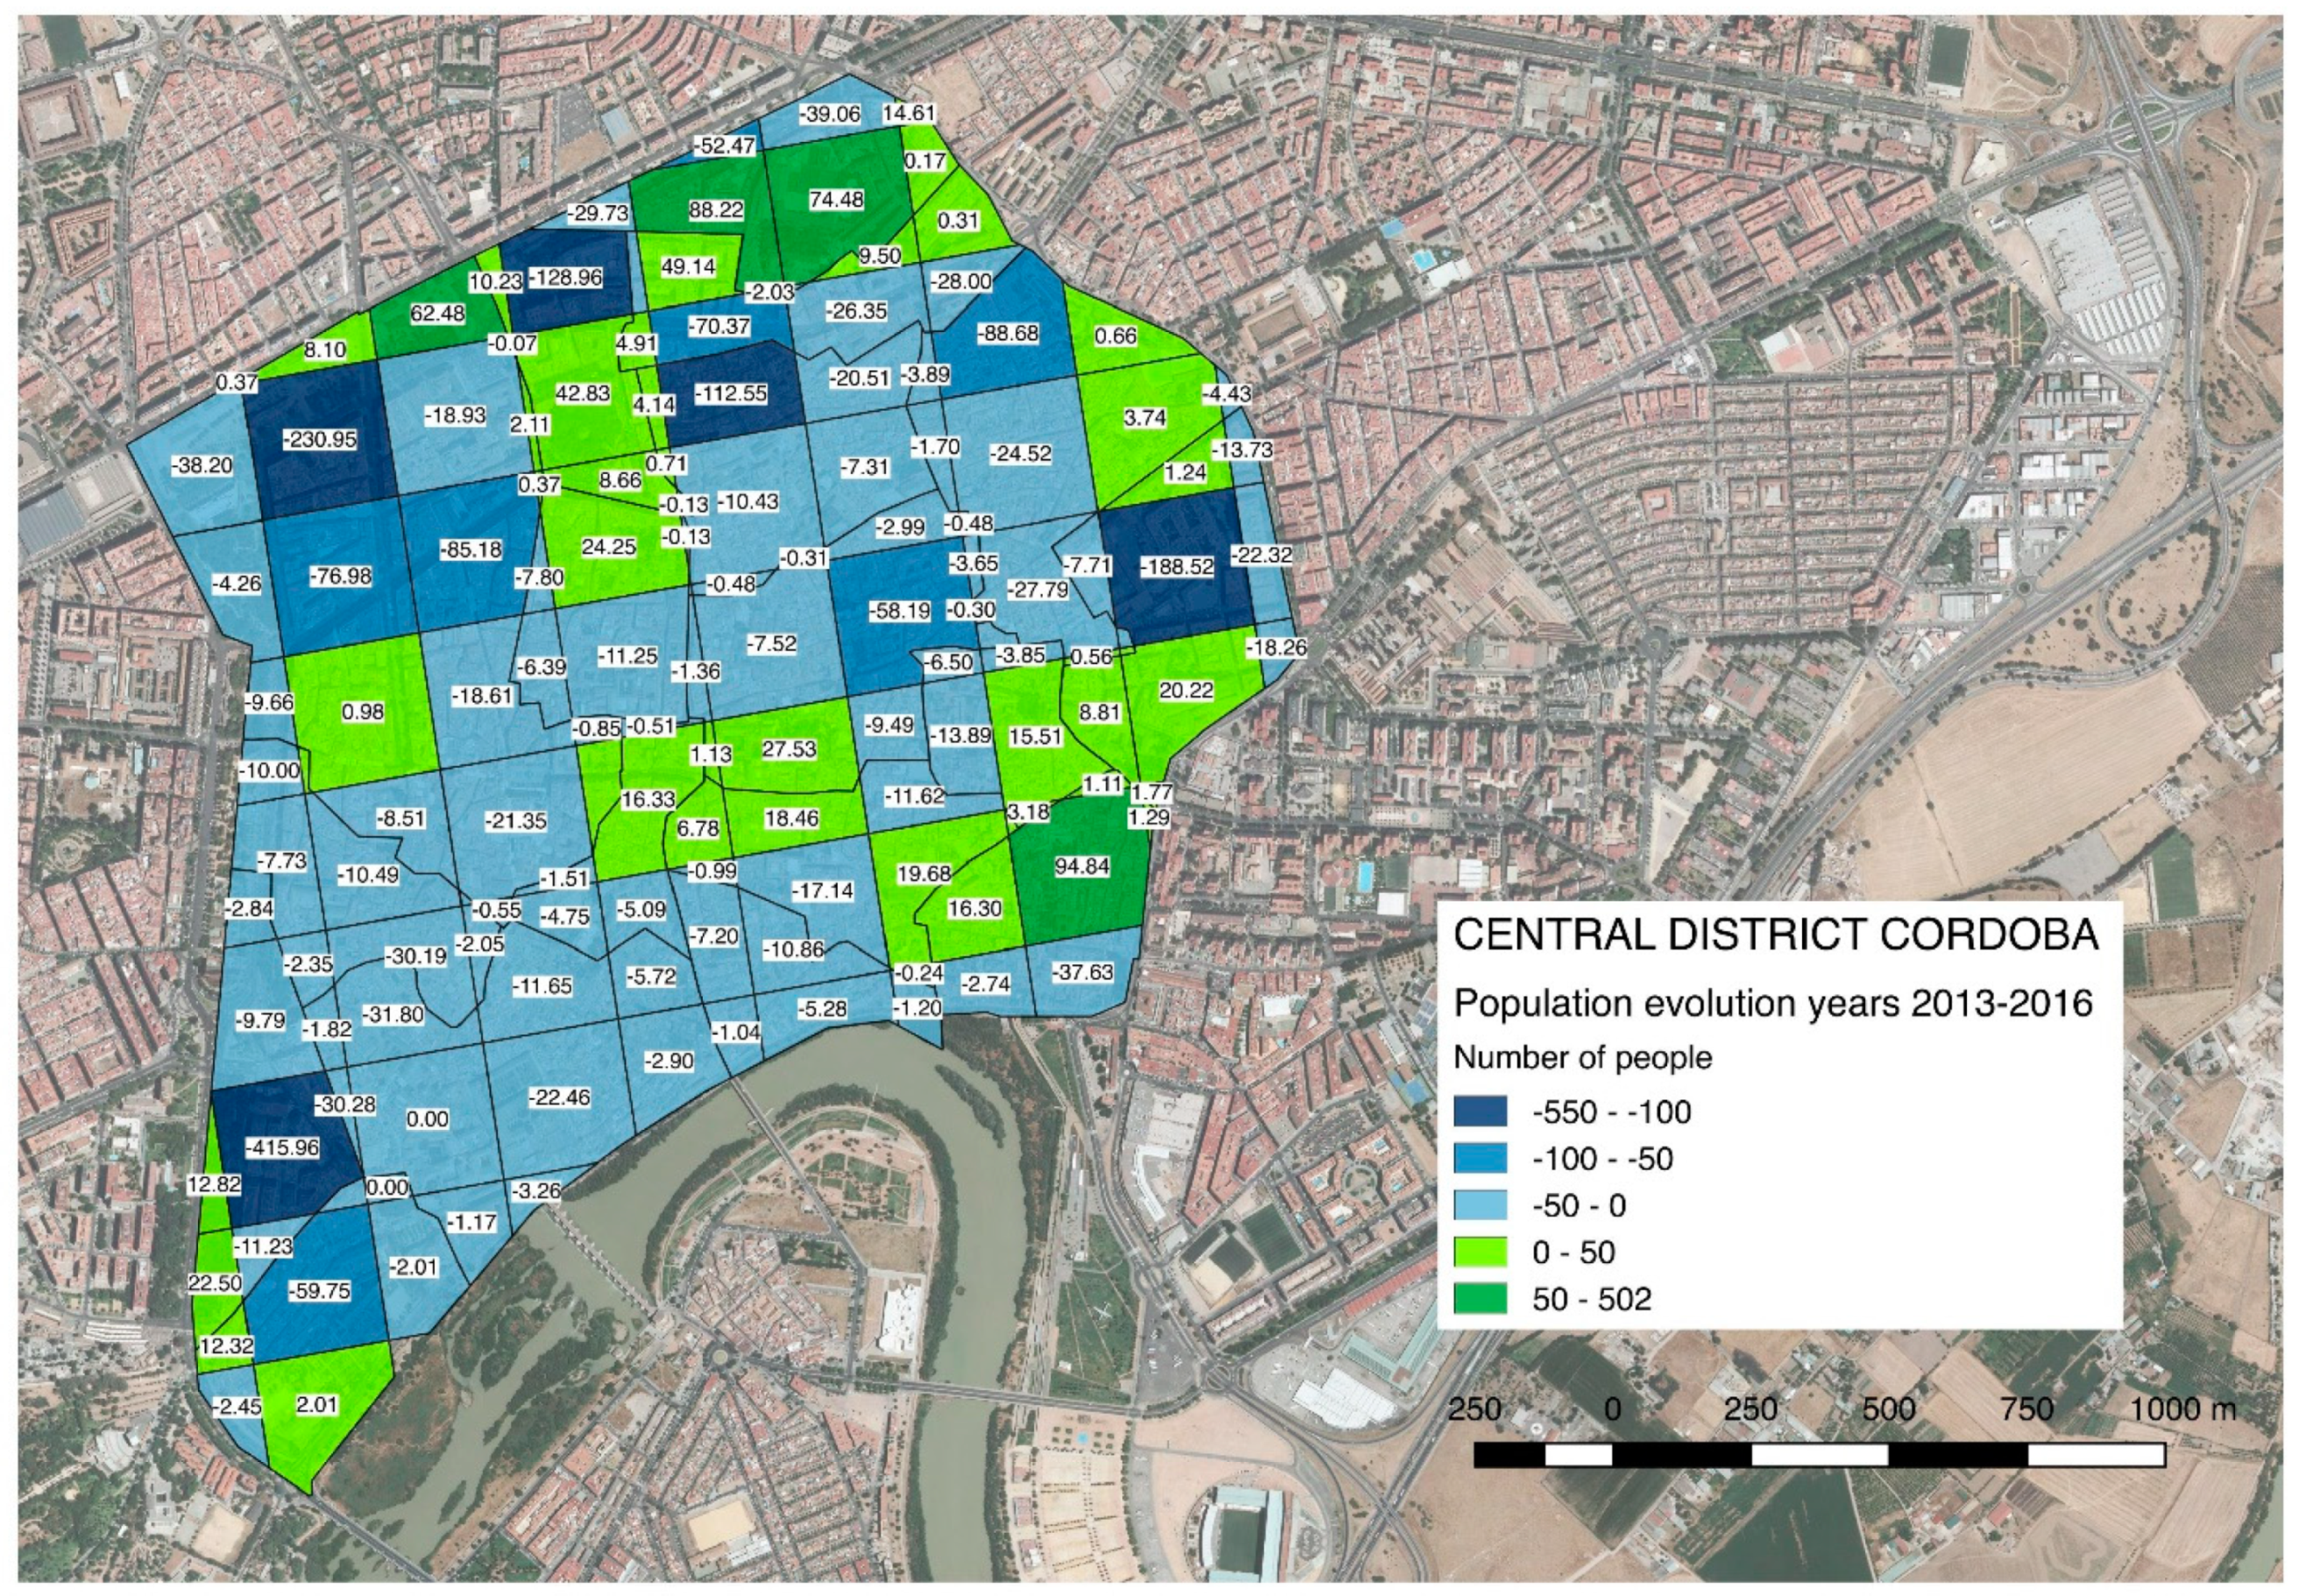
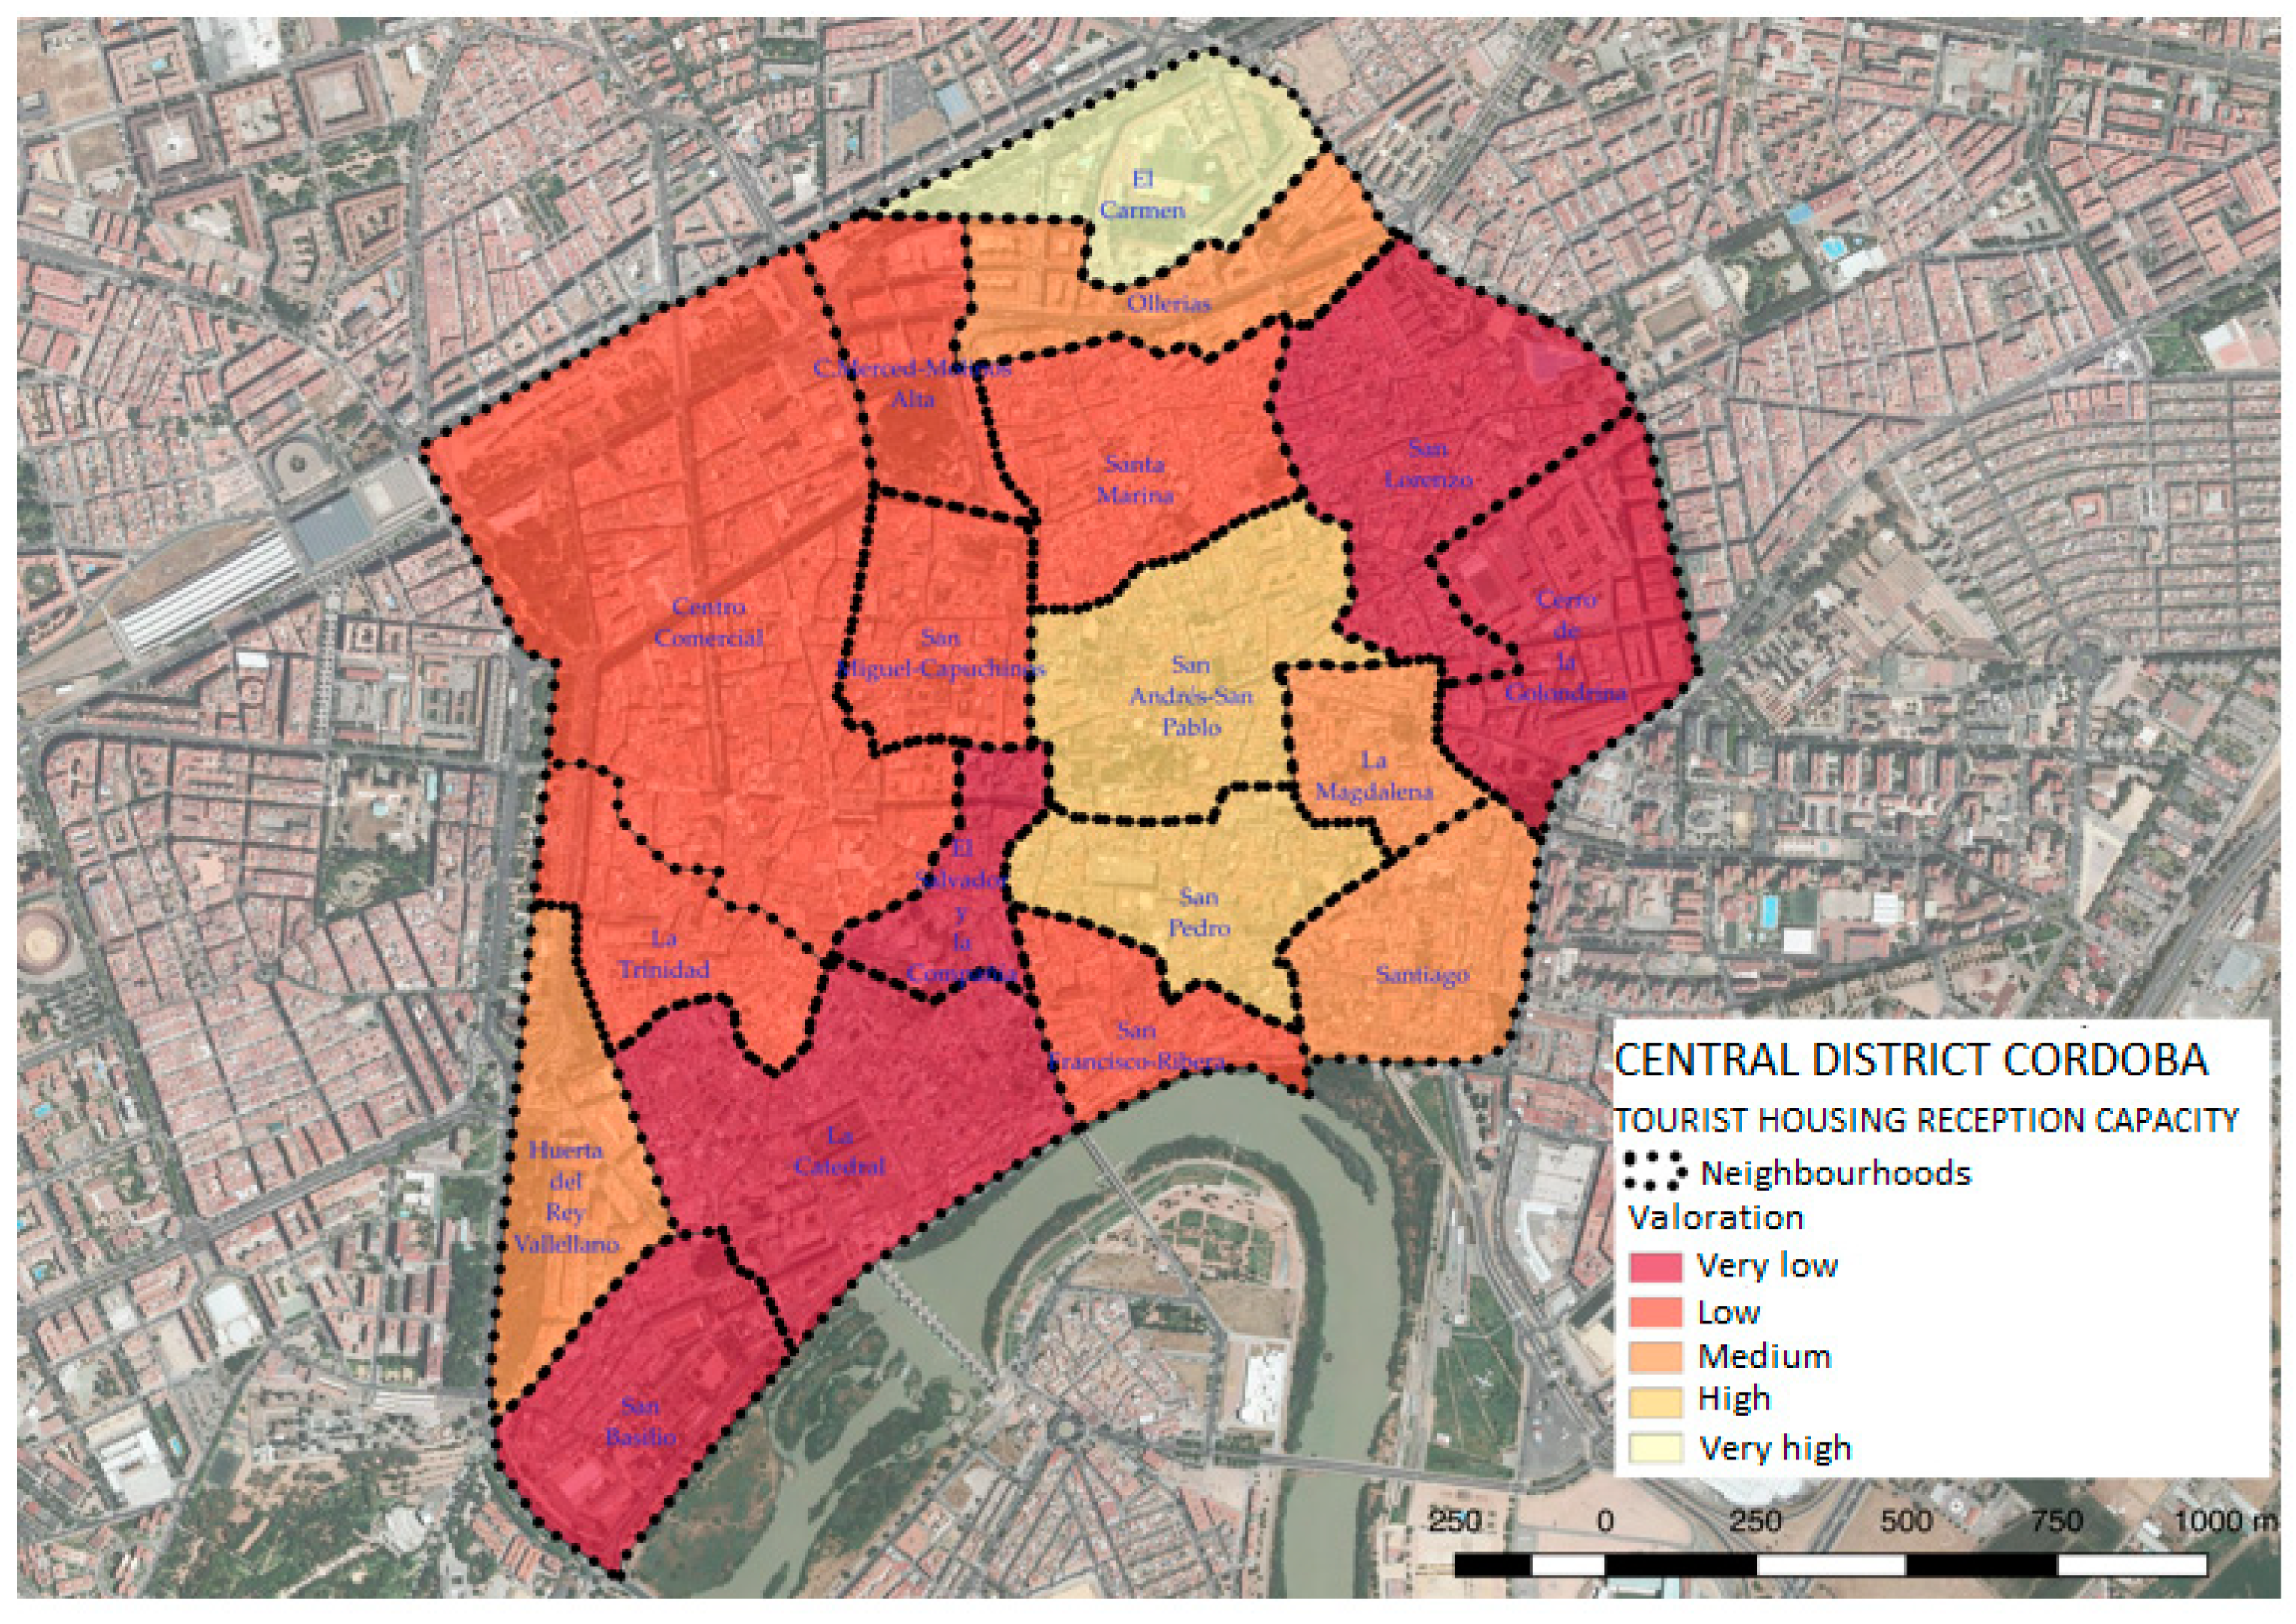
3.3. Implementation on Urban Area
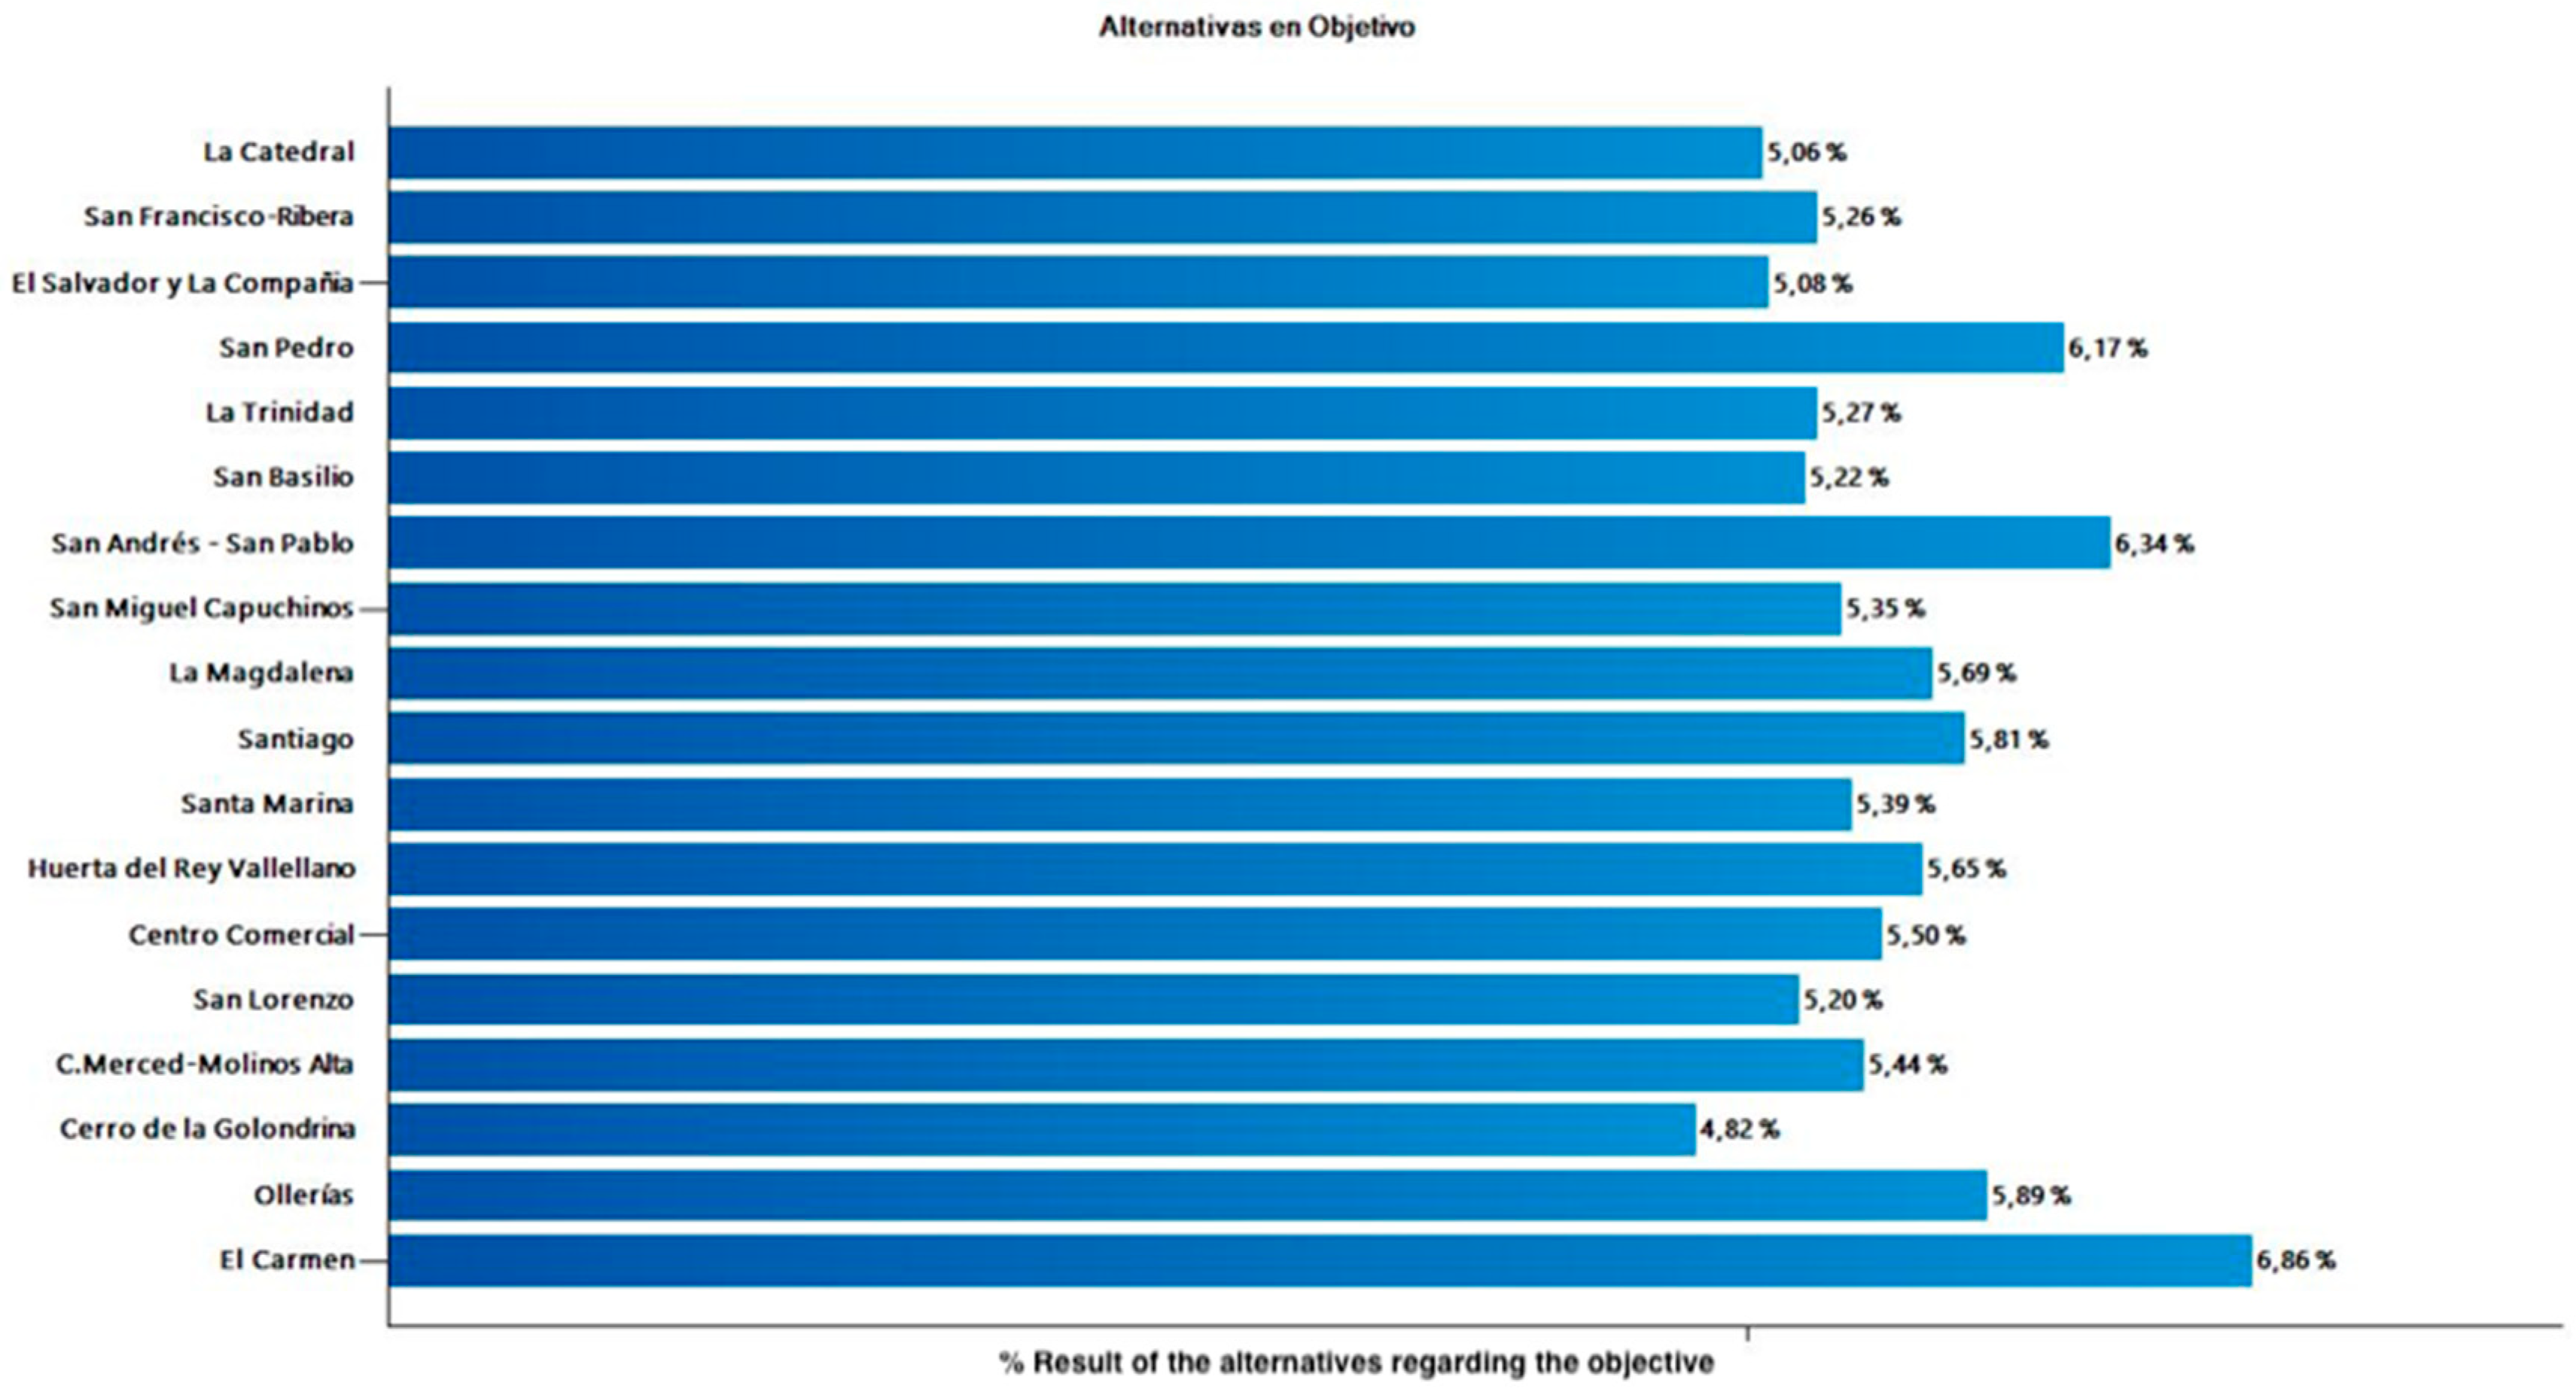
The territory subject of study was Cordoba (Spain), a city whose four UNESCO World Heritage Sites have had increased mass tourism in the last few years, besides an unregulated increase in tourist accommodation. Out of the 10 total territorial districts that conform to the city of Cordoba, we chose the central district since it hosts the highest concentration of tourist housing, with 1456 tourist housing over a total of 24,457 built houses, that is, 5.95% [51]. Here (Figure 4), the distribution of tourist housing for each neighborhood in the central district is shown:
There are eight neighborhoods over the tourist-housing average (6.02%), such as the neighborhoods of La Catedral, San Francisco-Ribera, El Salvador y la Compañia, and San Pedro, which exceed 10% of tourist housing. There are also ten neighborhoods under the average, such as Cerro de la Golondrina, Ollerías, and El Carmen, which do not reach 1%.
According to a recent study carried out by the Council of Cordoba [51] on the effects that tourist housing has on the city of Córdoba, the city has the following threats and weaknesses: Regarding threats, there is a gradual loss of population and the substitution of residential use for other uses, weakening of traditional commerce, saturation of public spaces, and coexistence deterioration, detraction of housing from the rental market, and price increase, and deterioration of cultural tourism. With respect to weaknesses, there is a lack of knowledge about existing tourist homes and clandestinity in the activity of some caused due to the autonomous regulatory framework, the absence of municipal regulation of housing for tourism purposes, the existence of empty buildings, and dizzying growth in the supply of housing for tourism purposes.

3. Results

The obtained results regarding the criteria and subcriteria preferences are shown in Figure 5.
Regarding the first-level criteria, the social dimension (with 63.7%) was the one with the highest weight in the model, followed by the economic dimension (25.83%) and the environmental dimension (10.47%). In the second level of subcriteria, the most important ones were residents’ welfare (27.22%) and structure of the local population (14.7%), hierarchically dependent on the economic-dimension criterion. Regarding the third-level subcriteria, the most relevant were available income (17.03%), population retention (9.36%), and generated income (8.65%).
Regarding the areal-interpolation process (necessary for evaluating subcriteria through 250 × 250 m spatial-data enmeshes (Table 1)), the following results were obtained:
As can be seen in the image (Figure 6), many of the 250 × 250 m cells that contain information on several criteria were divided into one, two, and up to three neighborhoods. Then, it was necessary to calculate the portion corresponding to each one for its calculation. An example would be the evaluation of the population-maintenance subcriterion (Figure 7):
In the central district, there has been a population decrease of 1679 people, with the highest decrease at the Centro Comercial (435 people) and the highest increase in the neighborhood of Santiago (73 people). In the figure, it can be seen that there was a decrease in population (in blue) of less than 50 people, with five areas exceeding 100 people in most enmeshes. Green colors correspond to areas where there has been a population increase (with values lower than 100 people).
The obtained results regarding the weight of the alternatives for each criterion and subcriterion are as follows (see Table 2):
In the social-dimension criterion (Table 2), certain values exceeded 9%, the population-retention subcriterion having the highest value (11.90%), which corresponds to Santiago and El Carmen, respectively. On the other hand, the heritage-conservation subcriterion had the lowest score to the alternative La Catedral. Within the social dimension, the Santiago and El Carmen neighborhoods corresponded, respectively, to the highest scores, while La Catedral, San Miguel Capuchinos, Huerta del Rey Vallellano, and C. Merced-Molinos Alta had the lowest scores.
Regarding the economic-dimension criterion, alternatives La Catedral and Centro Comercial stood out as high values, while C. Merced-Molino Alta stood out as the alternative with the lowest scores (Table 3).
The environmental-dimension criterion (Table 4) includes the air-pollution subcriterion, which was over 9% in five values in alternatives El Salvador y La Compañía, San Pedro, San Andrés-San Pablo, La Magdalena, and Santa Marina.
The final results for each alternative are shown in Figure 8.
The global inconsistency of the model is 4.69%, with no paired-comparison matrices showing ratios higher than 10%. The highest value corresponds to the social-dimension matrix, with a ratio of 6.72%.
Here, the information layer of the global model for each alternative is shown (Figure 9). The neighborhoods are categorized by colors depending on their tourist-housing reception capacity.
The El Carmen neighborhood was the only one with reception capacity classified as “very high”, followed by San Andrés-San Pablo and San Pedro, which showed “high” reception capacity. On the other hand, San Lorenzo, Cerro de la Golondrina, El Salvador y La Compañía, San Basilio, and La Catedral had the worst reception capacity.
To reinforce the survey, a sensitivity analysis was carried out to determine the variation in the selection of alternatives when the relative importance of criteria and subcriteria changes. Here, obtained results from sensitivity analysis, applied to the three main criteria of alternatives Barrio del Carmen and La Catedral, are displayed:
As can be seen in the image (Figure 10), the vertical red line represents the starting point, and it can be moved towards the right or left depending on what we mean to simulate (right for an increase, left for a decrease) regarding the preference of the social dimension with respect to the objective. That can check the evaluation of alternatives for each case: If the red line moves towards the black (10%), alternative La Catedral (7.09%) would receive better evaluation than El Carmen (5.17%).
In the case of the economic dimension (Figure 11), the evaluation of the alternatives changes when moving from the red line’s value (25.83%) to the black one’s (80%), La Catedral being the best valued (7.93%), while El Carmen would obtain 5%.
Regarding the environmental-dimension criterion (Figure 12), when moving from the initial 10.56% to 80%, the best-valued alternative would be El Carmen (6.35%), while La Catedral would have 4.03%.

4. Discussion

The emergence of new 2.0 net collaborative economies has brought along a change in paradigm in the tourist-accommodation sector in the major cities of the world due to the proliferation of tourist housing. According to surveys by Guillen and Iñiguez [74], there is certain opacity in the market besides a phenomenon that is causing gentrification processes in the main cities of the world. It also has a strong impact on real-estate market prices, with subsequent implications on cities’ territorial sustainability. Thus, tourist housing is a complex problem for administrations, since there are conflicting interests among the different economic and social agents in these cities. Multicriteria assessment techniques, applied with geographical information systems, are a good tool that helps in the decision-making process regarding problems where there are different agents and criteria to take into account intervening. Surveys, such as the one carried out by Dredge et al. [75], support this investigation.
The concept of “reception capacity”, which theoretically refers to the optimal usage of territory for its sustainability, is adequate for evaluating the loading capacity that every territory has. This is done based on guidelines provided by the World Tourism Organization regarding issues to consider when planning a destination under sustainability objectives.
The city of Cordoba has an unequal tourist-housing occupation in each geographical area, similarly to the obtained results for Madrid [76]. The central district, having 5.85% tourist housing over the total of built houses, is the one with the highest percentage, and it is composed of neighborhoods with unequal data, ranging from 17.14% (La Catedral) to 0.11% (El Carmen). This is the reason why it is not possible to generalize when talking about positive or negative effects since analysis for every neighborhood is necessary.
The results of our model conclude that the alternative neighborhood of El Carmen was the one that had the highest score, mainly due to the greater relative weight that decision-makers gave to the social-dimension criterion over the two other main criteria, economic dimension and environmental dimension, respectively. There are up to a total of five neighborhoods (La Catedral, San Basilio, El Salvador and La Compañía, San Lorenzo, and Cerro de la Golondrina) that have a very low reception capacity caused by different reasons. The Barrio de la Catedral is greatly influenced by the very low score of the subcriteria that form the social dimension, mainly due to population loss. Instead, it has a very good valuation in the economic-dimension subcriteria since having a greater number of tourist homes increases the income of owners as well as that of adjoining businesses.
Sensitivity analysis (Figure 10, Figure 11 and Figure 12) allowed the simulation of what the score of each neighborhood would be if the relative importance of the different criteria and subcriteria changes; it is a very valuable tool for political leaders when it comes to taking decisions since it allows the continuous monitoring of neighborhood classification according to their more or less relative importance to each criterion. An example is the case of the La Catedral neighborhood, whose valuation increased as the relative importance of the economic-dimension criterion with respect to the social-dimension criterion increased.
The results obtained about the variation of population indicate that there are neighborhoods where, even though there are high percentages of tourist housing, there is no population exodus, such as the San Pedro neighborhood (Table 2). Likewise, the neighborhoods with the greatest population decline, such as the Centro Comercial and Huerta del Rey Vallellano, do not have the highest percentages of tourist housing, but instead, they do have a higher percentage of the population over 65 years of age with 26.28% and 30%, respectively. Therefore, it can be concluded that the neighborhoods that tend to lose population are those with the highest percentages of population over 65 years. These results contradict the studies that state that tourist housing causes depopulation in a generalized manner, and, according to them, a diagnosis of the demographic situation of each territory under study should be established. These conclusions are very important for public administrations responsible for deciding on tourism management, due to the impact it can have on the territorial development of any city.
Tourist housing is a tourism modality in expansion that must be regulated and cohabit with traditional offers. To do so, specific legislation is necessary to analyze each district’s burden capacity based on surveys, such as the one planned for the central district of Cordoba. Analyses such as these provide a better answer to tourist-accommodation offers and demand cohabitation, which would make tourist housing sustainable and integrate it into the local economy. Therefore, the present work provides a valuable tool to public councilors of different cities with a tourist tradition to help them make decisions regarding the regulation of tourist housing. It is very useful for the political leaders and social agents of Córdoba since it allows decisions about permissiveness in areas where tourist housing can be beneficial for society as a whole or nonpermissiveness in areas where saturation exists and causes negative effects.
The tool presents some weaknesses, such as the need for large up-to-date information flows of a large number of georeferenced qualitative and quantitative variables.

Author Contributions

The authors are contributed each part of a paper by conceptualization. J.A.F.G.: introduction, theoretical framework, methodology, results, discussion, writing original draft preparation, writing review and editing; J.M.C.y.O.: methodology and supervision; M.G.M.V.d.l.T.: methodology, results, discussion and supervision.

Funding

This research received no external funding.

Conflicts of Interest

The authors declare no conflict of interest.

References

  1. García, M.F.; del Moral-Espín, L. The hacker ethic vs netarchical capitalism free software and peer production within collaborative economic practices in Andalusia. Teknokultura 2016, 13, 141–168. [Google Scholar]
  2. Montoro, L.G. European Agenda for the Collaborative Economy; Castilla la Mancha University: Ciudad Real, Spain, 2016. [Google Scholar]
  3. European Comissión. Communication from the commission to the european parliament. To the council, the european economic and social committee and the committee of the regions. In A European Agenda for the Collaborative Economy; European Comissión: Brussels, Belgium, 2016. [Google Scholar]
  4. Jarne, P. Collaborative consumption in Spain: Relevant experiences and future challenges. Rev. CESCO Derecho Consum. 2016, 17, 62–75. [Google Scholar]
  5. Andriotis, K.; Agiomirgianakis, G. Market escape through exchange: Home swap as a form of non-commercial hospitality. Curr. Issues Tour. 2014, 17, 576–591. [Google Scholar] [CrossRef]
  6. Vaughan, R.; Daverio, R. Assessing the Size and Presence of the Collaborative Economy in Europe; Publications Office of the European Union: Brussels, Belgium, 2016. [Google Scholar]
  7. DataHippo. 2018. Available online: http://datahippo.org/es/ (accessed on 27 May 2019).
  8. Füller, H.; Michel, B. Stop being a tourist! New dynamics of urban tourism in Berlin-Kreuzberg. Int. J. Urban Reg. Res. 2014, 38, 1304–1318. [Google Scholar] [CrossRef]
  9. Novy, J. The selling (out) of Berlin and the de-and re-politicization of urban tourism in Europe´s ‘Capital of Cool’. In Protest and Resistance in the Tourist City; Colomb, C., Novy, J., Eds.; Routledge: Abingdon, UK, 2016; pp. 52–72. [Google Scholar]
  10. Broudehoux, A.M. Favela tourism: Negotiating visitors, socio-economic benefits, image and representation in pre-Olympics Rio de Janeiro. In Protest and Resistance in the Tourist City; Colomb, C., Novy, J., Eds.; Routledge: Abingdon, UK, 2016; pp. 191–209. [Google Scholar]
  11. Vives-Miró, S.; Rullan, O. Housing dispossession due to tourism? Revaluation and travel in the historic center of Palma (Mallorca). Rev. Geogr. Norte Gd. 2017, 71, 53–71. [Google Scholar] [CrossRef]
  12. Gerritsma, R.; Vork, J. Amsterdam residents and their attitude towards tourists and tourism. Coactivity Philos. Commun. 2017, 25, 85–98. [Google Scholar] [CrossRef]
  13. Pinkster, F.M.; Boterman, W.R. When the spell is broken: Gentrification, urban tourism and privileged discontent in the Amsterdam canal district. Cult. Geogr. 2017, 24, 457–472. [Google Scholar] [CrossRef]
  14. Gravari-Barbas, M.; Jacquot, S. No conflict? Discourses and management of tourism related tensions in Paris. In Protest and Resistance in the Tourist City; Colomb, C., Novy, J., Eds.; Routledge: Abingdon, UK, 2016; pp. 31–51. [Google Scholar]
  15. Mermet, A.-C. Airbnb and tourism gentrification. In Tourism and Gentrification in Contemporary Metropolises; Routledge: Abingdon, UK, 2017; pp. 52–74. [Google Scholar]
  16. Vianello, M. The No Grandi Navi campaign: Protests against cruise tourism in Venice. In Protest and Resistance in the Tourist City; Colomb, C., Novy, J., Eds.; Routledge: Abingdon, UK, 2016; pp. 171–190. [Google Scholar]
  17. Garrett, D. Contesting China’s tourism wave: Identity politics, protest and the rise of the Hongkonger city state movement. In Protest and Resistance in the Tourist City; Colomb, C., Novy, J., Eds.; Routledge: Abingdon, UK, 2016; pp. 107–128. [Google Scholar]
  18. Sampat, P. The ‘Goan Impasse’: Land rights and resistance to SEZs in Goa, India. J. Peasant Stud. 2015, 42, 765–790. [Google Scholar] [CrossRef]
  19. Novy, J.; Colomb, C. Urban tourism and its discontents: An introduction. In Protest and Resistance in the Tourist City; Colomb, C., Novy, J., Eds.; Routledge: Abingdon, UK, 2016; pp. 1–30. [Google Scholar]
  20. Nogués-Pedregal, A.M.; Travé-Molero, R.; Carmona-Zubiri, D. Thinking against “empty shells” in tourism development projects. Etnoloska Trib. 2017, 47, 88–108. [Google Scholar] [CrossRef]
  21. Lopez, S. Spain Speculates Again with Housing. Available online: https://elpais.com/economia/2018/08/30/actualidad/1535643025_269129.html (accessed on 2 September 2018).
  22. Gomez Orea, D.; Gomez Villarino, M.T. Environmental Impact Assessment; Eds. Mundi-Prensa: Madrid, Spain, 2013. [Google Scholar]
  23. Canter, L.W. Environmental Impact Assessment; McGraw-Hill: New York, NY, USA, 1977. [Google Scholar]
  24. Canter, L.W.; Hill, L.G. Handbook of Variables for Environmental Impact Assessment; Ann Arbor Science Publishers, Inc.: Ann Arbor, MI, USA, 1979. [Google Scholar]
  25. Canter, L.W. Environmental Impact Assessment; McGraw-Hill: New York, NY, USA, 1996. [Google Scholar]
  26. Clark, B.D.; Chapman, K.; Bisset, R.; Wathern, P. Methods of environmental impact analysis. Built Environ. 1978, 4, 111–121. [Google Scholar]
  27. Rau, J.G.; Wooten, D.C. Environmental Impact Analysis Handbook; MacGraw Hill: New York, NY, USA, 1980. [Google Scholar]
  28. Hollick, M. The role of quantitative decision-making methods in environmental impact assessment. J. Environ. Manag. 1981, 12, 65–78. [Google Scholar]
  29. Lee, N. The future development of environmental impact assessment. J. Environ. Manag. 1982, 14, 71–90. [Google Scholar]
  30. Lee, N. Environmental impact assessment: A review. Appl. Geogr. 1983, 3, 5–27. [Google Scholar] [CrossRef]
  31. Voogd, J.H. Multicriteria Evaluation for Urban and Regional Planning; Pion London: London, UK, 1982. [Google Scholar]
  32. Janssen, R. A Multiobjective Decision Support System for Environmental Problems; Springer: Berlin, Germany, 1992; pp. 107–125. [Google Scholar]
  33. Eastman, R.J. Explorations in Geographic Information Systems Technology: GIS and Decision Making; United Nations Institute for Training and Research: Geneva, Switzerland, 1993. [Google Scholar]
  34. Jankowski, P. Integrating geographical information systems and multiple criteria decision-making methods. Int. J. Geogr. Inf. Syst. 1995, 9, 251–273. [Google Scholar] [CrossRef]
  35. Triantaphyllou, E. Multi-Criteria Decision Making Methods; Springer: Berlin, Germany, 2000; pp. 5–21. [Google Scholar]
  36. Roy, B.; Garcia, B.A. Multicriteria Decision Support Methodology; Torculo Editions: Santiago de Compostela, Spain, 2007. [Google Scholar]
  37. Munda, G. Social Multi-Criteria Evaluation for a Sustainable Economy; Springer: Berlin, Germany, 2008. [Google Scholar]
  38. Romero, C. Multicriteria Decision Theory: Concepts, Techniques and Applications; Editorial Alliance: Madrid, Spain, 1993. [Google Scholar]
  39. Barredo Cano, J.I. Geographic Information Systems and Multicriteria Evaluation in the Territory Order; Ra-Ma: Madrid, Spain, 1996. [Google Scholar]
  40. Romero, S.B.; Pomerol, J.-C. Multicriteria Decisions: Theoretical Foundations and Practical Use; Alcala de Henares University: Madrid, Spain, 1997. [Google Scholar]
  41. Santos, J.M. The multiobjective/multicriteria theoretical approach and its application to the resolution of environmental and territorial problems, by means of GIS. Sp. Time Form. Ser. VI Geogr. 1997, 10, 129–155. [Google Scholar]
  42. Moreno Jimenez, J.M.; Escobar Urmeneta, M.T. Regret in the hierarchical analytical process. Appl. Econ. Stud. 2000, 14, 95–115. [Google Scholar]
  43. Moreno, J.M. The analytic hierarchy process (AHP). Fundamentals, methodology and applications. ASEPUMA Electron. Commun. Work. Mag. 2002, 1, 21–53. [Google Scholar]
  44. Jimenez, F.B.G.; Castaño, J.A.A. Model for assessing the capacity to receive the territory with GIS and multicriteria decision techniques regarding the implementation of buildings in rural areas. Geogr. Investig. 2013, 60, 69–85. [Google Scholar]
  45. Barrero, J.; Sendra, J.B. Integration of multicriteria evaluation and geographic information systems for the evaluation of the reception capacity of the territory and allocation of land uses. In IV Spanish Congress of Geographic Information Systems; AESIG: Madrid, Spain, 1995; pp. 191–200. [Google Scholar]
  46. Galacho, F.B.; Ocaña, C. Treatment with GIS and Multicriteria Evaluation Techniques of the territory’s reception capacity for urban uses. Access Spat. Inf. New Geogr. Technol. 2006, 1, 1509–1526. [Google Scholar]
  47. Sendra, J.B.; Jimenez, A.M. Geographic Information Systems and Optimal Location of Facilities and Equipment; Ra-Ma: Madrid, Spain, 2004. [Google Scholar]
  48. Gomez, M.; Barredo, J.I. Geographic Information Systems and Multicriteria Evaluation in Land Management; Ra-Ma Editorial: Madrid, Spain, 2005. [Google Scholar]
  49. Molero, E.; Grindlay, A.; Asensio, J.A. Scenarios of aptitude and cartographic modeling of urban growth through multicriteria evaluation techniques. Geofocus Int. J. Geogr. Inf. Sci. Technol. 2007, 7, 120–147. [Google Scholar]
  50. Moreno, A.; Buzai, G. Analysis and Planning of Collective Services with Geographic Information Systems; Autonomous University of Madrid: Madrid, Spain, 2008. [Google Scholar]
  51. Council of Cordoba. Study on the Dimensioning of the Offer of Housing with Existing Tourist Purposes in the City of Cordoba, Proposal for Management Measures and Situation Communication Strategy; Council of Cordoba: Cordoba, Spain, 2019. [Google Scholar]
  52. Saaty, T. The Analytic Hierarchy Process; Mc Gran Hill: New York, NY, USA, 1980. [Google Scholar]
  53. Casañ, A. The Multi-Criteria Decision, Application in the Selection of Competitive Offers in Building; Valencia University: Valencia, Spain, 2013. [Google Scholar]
  54. UNTWO. Tourism the Year 2000 and Beyond Qualitative Aspects; UNTWO: Madrid, Spain, 1993. [Google Scholar]
  55. Organisation for Economic Co-operation and Development. Frameworks to Measure Sustainable Development: An OECD Expert Workshop; OECD Publishing: Paris, France, 2000. [Google Scholar]
  56. Manning, E.; Clifford, G.; Dougherty, D.; Ernst, M. What Every Tourist Manager Should Know. Practical Guide for the Development and Use of Sustainable Tourism Indicators; OMT: Madrid, Spain, 1997. [Google Scholar]
  57. Romero, E. The Assessment of Sustainable Development. A Methodological Proposal; Edn. Andalucía Ecológica Medio Ambiente: Sevilla, Spain, 2003; ISBN 84-607-8913-6. [Google Scholar]
  58. Peral, F.J.B.; Lozano, M.G.; Casas, F.M.G.; Lozano-Oyola, M. Synthetic indicators of sustainable tourism: An application for tourist destinations in Andalusia. Rect ASEPUMA Electron. Commun. Work. Mag. 2010, 11, 85–118. [Google Scholar]
  59. Avila, R.; Iniesta, A.; Herrero, D.; Aguierre, G.; Guereña, A.; Giraldo, A. Sustainable Tourism. In International Problems Collection; EIPALA: Madrid, Spain, 2002. [Google Scholar]
  60. Dachary, A.; Arnáiz, S. Globalization, Tourism and Sustainability; University of Guadalajara: Puerto Vallarta, Mexico, 2002. [Google Scholar]
  61. Fullana, P.; Ayuso, S. Sustainable Tourism; Rubes: Barcelona, Spain, 2002. [Google Scholar]
  62. Gallego, I.; Moniche, A. System of territorial indicators for a tourist destination. Enzo Paci. Pap. Meas. Econ. Significance Tour. 2005, 5, 259–279. [Google Scholar]
  63. Sancho, A.; Garcia, G. What does an indicator indicate? Comparative analysis in tourist destinations. Tour. Anal. Mag. 2006, 2, 69–85. [Google Scholar]
  64. Bowen, S.; Valenzuela, A. Geographical indications, terroir, and socioeconomic and ecological sustainability: The case of tequila. J. Rural Stud. 2009, 25, 108–119. [Google Scholar] [CrossRef]
  65. Toskano, G. The Hierarchical Analytical Process (AHP) as a Tool in Decision Making in the Selection of Suppliers: Application in the Selection of the Supplier for the Graphic Company MYE S.R.L; UNMSM: Lima, Peru, 2005. [Google Scholar]
  66. Andalusia Statistics and Cartography Institute. Services. Spatial Reference Data. 2019. Available online: http://www.juntadeandalucia.es/institutodeestadisticaycartografia/DERA/g12.htm (accessed on 10 May 2019).
  67. Statistics National Institute. Urban Audit Indicators for Submunicipal Áreas. 2019. Available online: https://www.ine.es/jaxiT3/Tabla.htm?t=30140 (accessed on 11 May 2019).
  68. Andalusia Statistics and Cartography Institute. Heritage. Spatial Reference Data. 2019. Available online: http://www.juntadeandalucia.es/institutodeestadisticaycartografia/DERA/g11.htm (accessed on 10 May 2019).
  69. Andalusia Statistics and Cartography Institute. Population. Spatial Reference Data. 2019. Available online: http://www.juntadeandalucia.es/institutodeestadisticaycartografia/distribucionpob/index.htm (accessed on 10 May 2019).
  70. Tourism and Sports Department from Andalusia Statistics. Tourist satisfaction. 2019. Available online: http://www.juntadeandalucia.es/turismoydeporte/opencms/estadisticas-consejeria/estadisticas-de-turismo/index.html (accessed on 10 May 2019).
  71. Council of Cordoba. Local Improvement Plan of Air Quality of the Aglomeration Urban of Cordoba; Council of Cordoba: Cordoba, Spain, 2017. [Google Scholar]
  72. Council of Cordoba. Strategic Map of Noise of Cordoba; Council of Cordoba: Cordoba, Spain, 2016. [Google Scholar]
  73. Saaty, T. Toma de Decisiones Para Líderes: El Proceso Analítico Jerárquico: La Toma de Decisiones en un Mundo Complejo; RWS Publications: Pittsburgh, Pennsylvania, 1997. [Google Scholar]
  74. Navarro, N.A.G.; Berrozpe, T.I. Public action and collaborative consumption. Regulation of tourist dwellings in the p2p context. Pasos 2016, 14, 751–768. [Google Scholar]
  75. Dredge, D.; Gyimóthy, S.; Birkbak, A.; Jensen, T.E.; Madsen, A. The Impact of Regulatory Approaches Targeting Collaborative Economy in the Tourism Accommodation Sector: Barcelona, Berlin, Amsterdam and Paris; Aalborg University: Copenhagen, Denmark, 2016. [Google Scholar]
  76. Red2Red Consultores. Analysis of the Impact of Tourist Dwellings in the Downtown District; Red2Red Consultores: Madrid, Spain, 2017. [Google Scholar]
Figure 1. Phases of analytic hierarchical process. Source: Casañ [53].
Sustainability 11 06422 g001
Figure 2. Chart of criteria, subcriteria, and alternative hierarchies. Source: Information compiled from Blancas et al. [58]; Gallego and Moniche [62]; Sancho and García [63]; Bowen and Valenzuela [64].
Sustainability 11 06422 g002
Figure 3. Paired-comparison matrix.
Sustainability 11 06422 g003
Figure 4. Tourist housing per neighborhood in the central-district map. Source: Own elaboration.
Sustainability 11 06422 g004
Figure 5. Criteria and subcriteria preferences. Source: Own elaboration.
Sustainability 11 06422 g005
Figure 6. Spatial-data grid proportions. Source: Own elaboration.
Sustainability 11 06422 g006
Figure 7. Variation of population in the central district of Cordoba. Source: Own elaboration.
Sustainability 11 06422 g007
Figure 8. Results of alternative evaluation. Source: Own elaboration.
Sustainability 11 06422 g008
Figure 9. Information layer about the evaluation of tourist-housing reception capacity. Source: Own elaboration.
Sustainability 11 06422 g009
Figure 10. Sensitivity analysis of social dimension. Source: Own elaboration.
Sustainability 11 06422 g010
Figure 11. Sensitivity analysis of economic dimension. Source: Own elaboration.
Sustainability 11 06422 g011
Figure 12. Sensitivity analysis of environmental dimension. Source: Own elaboration.
Sustainability 11 06422 g012
Table 1. Database used to evaluate each subcriterion.
SubcriterionData sources
Provision of servicesSpatial reference data. Andalusia Statistics and Cartography Institute [66]
Access to housingDatabase provided by the Idealista real-estate portal
Available incomeUrban Audit indicators for submunicipal areas. Statistics National Institute [67]
Preservation of heritageSpatial reference data. Andalusia Statistics and Cartography Institute [68]
Public safetyPersonal interview with security officers from the Ministry of Internal Affairs
Population retention250 × 250 m spatial data net from the Andalusian Statistics and Cartography Institute [69]
Young population250 × 250 m spatial data net from the Andalusian Statistics and Cartography Institute [69]
Aging population 250 × 250 m spatial data net from the Andalusian Statistics and Cartography Institute [69]
Social burden250 × 250 m spatial data net from the Andalusian Statistics and Cartography Institute [69]
Investment on propertiesDatabase provided by the Idealista real estate portal
Generated employment250 × 250 m spatial data net from the Andalusian Statistics and Cartography Institute [69]
Generated incomeDatabase provided by www.airdna.co
Duration of stayDatabase provided by www.airdna.co
Tourist satisfactionTourism and Sports Department from Andalusia Statistics [70]
Tourism seasonalityDatabase provided by www.airdna.co
Energy consumptionPersonal interview with officers from ENDESA (National Electricity Company)
Water consumptionPersonal interview with officers from EMACSA (Municipal Water Company)
Air pollutionQuality of air plan (Council of Cordoba) [71]
Noisy pollutionNoise strategic map (Council of Cordoba) [72]
Cleansing perceptionPersonal interview with officers from the SADECO company
Intensity of usageCouncil of Cordoba [51]
Source: Own elaboration.
Table 2. Relevant weights of alternatives for social-dimension subcriteria.
Social DimensionResidents’ WelfareHeritage PreservationPublic SafetyPopulation StructurePopulation RetentionSocial Burden
La Catedral3.69%4.25%1.67%5.26%2.86%2.38%1.85%
San Francisco-Ribera5.84%5.68%5.00%5.26%7.50%7.14%3.70%
El Salvador y La Compañía5.05%4.34%5.00%5.26%6.56%7.14%3.70%
San Pedro5.80%5.40%5.00%3.51%9.22%9.52%3.70%
La Trinidad4.87%5.11%5.00%5.26%3.91%4.76%5.56%
San Basilio5.14%5.49%3.33%5.26%4.64%4.76%7.41%
San Andrés-San Pablo6.03%6.07%6.67%7.02%5.05%4.76%5.56%
San Miguel Capuchinos5.21%4.05%6.67%7.02%5.22%7.14%5.56%
La Magdalena5.87%5.29%5.00%5.26%7.90%7.14%5.56%
Santiago6.46%5.96%3.33%5.26%10.94%11.90%1.85%
Santa Marina4.74%5.01%5.00%5.26%3.53%2.38%5.56%
Huerta del Rey Vallellano5.58%5.88%8.33%7.02%2.19%2.38%7.41%
Centro Comercial4.74%4.63%5.00%7.02%2.86%2.38%5.56%
San Lorenzo5.38%5.87%5.00%5.26%4.20%2.38%7.41%
C. Merced-Molinos Alta6.00%6.76%8.33%5.26%3.70%4.76%7.41%
Cerro de la Golondrina5.12%5.01%6.67%5.26%3.93%2.38%7.41%
Ollerías6.47%7.13%8.33%5.26%5.05%4.76%7.41%
El Carmen8.01%8.09%6.67%5.26%10.74%11.90%7.41%
Source: Own elaboration.
Table 3. Relevant weights of alternatives for economic-dimension subcriteria.
Economic DimensionEconomic BenefitsGenerated IncomeTourist SatisfactionTourism Seasonality
La Catedral8.99%9.25%10.64%7.14%9.26%
San Francisco-Ribera4.61%4.79%6.38%5.36%3.70%
El Salvador y La Compañía5.21%5.71%6.38%5.36%3.70%
San Pedro7.56%8.03%10.64%5.36%7.41%
La Trinidad6.49%7.03%6.38%5.36%5.56%
San Basilio5.26%5.45%4.26%7.14%3.70%
San Andrés-San Pablo6.98%6.47%8.51%5.36%9.26%
San Miguel Capuchinos5.45%6.09%4.26%5.36%3.70%
La Magdalena4.99%4.71%4.26%5.36%5.56%
Santiago4.41%3.82%4.26%5.36%5.56%
Santa Marina6.23%5.98%6.38%5.36%7.41%
Huerta del Rey Vallellano5.71%5.18%4.26%5.36%7.41%
Centro Comercial7.50%9.25%10.64%5.36%3.70%
San Lorenzo4.47%4.57%4.26%5.36%3.70%
C. Merced-Molinos Alta3.75%4.12%2.13%5.36%1.85%
Cerro de la Golondrina3.76%3.47%2.13%5.36%3.70%
Ollerías4.34%3.06%2.13%5.36%7.41%
El Carmen4.30%3.01%2.13%5.36%7.41%
Source: Own elaboration.
Table 4. Relevant weights of alternatives for environmental-dimension subcriteria.
Environmental DimensionEnergy ConsumptionWater ConsumptionAir PollutionCleansing PerceptionUsage Intensity
La Catedral3.73%3.77%3.77%7.55%5.08%1.45%
San Francisco-Ribera3.37%5.66%5.66%3.77%5.08%1.45%
El Salvador y La Compañía5.02%5.66%5.66%9.43%5.08%2.90%
San Pedro5.02%5.66%5.66%9.43%5.08%2.90%
La Trinidad4.63%5.66%5.66%3.77%5.08%4.35%
San Basilio5.62%5.66%5.66%3.77%6.78%5.80%
San Andrés - San Pablo6.64%5.66%5.66%9.43%6.78%5.80%
San Miguel Capuchinos5.96%5.66%5.66%5.66%6.78%5.80%
La Magdalena6.28%5.66%5.66%9.43%5.08%5.80%
Santiago5.25%5.66%5.66%3.77%5.08%5.80%
Santa Marina7.27%5.66%5.66%9.43%6.78%7.25%
Huerta del Rey Vallellano5.93%3.77%3.77%3.77%6.78%7.25%
Centro Comercial5.22%3.77%3.77%1.89%5.08%7.25%
San Lorenzo5.88%5.66%5.66%3.77%5.08%7.25%
C. Merced-Molinos Alta6.20%7.55%7.55%3.77%5.08%7.25%
Cerro de la Golondrina5.56%3.77%3.77%3.77%5.08%7.25%
Ollerías6.20%7.55%7.55%3.77%5.08%7.25%
El Carmen6.20%7.55%7.55%3.77%5.08%7.25%
Source: Own elaboration.

