


Abstract
We describe an image-based method that uses two radio criteria, compactness, and spectral index, to identify promising pulsar candidates among Fermi Large Area Telescope (LAT) unassociated sources. These criteria are applied to those radio sources from the Giant Metrewave Radio Telescope all-sky survey at 150 MHz (TGSS ADR1) found within the error ellipses of unassociated sources from the 3FGL catalogue and a preliminary source list based on 7 yr of LAT data. After follow-up interferometric observations to identify extended or variable sources, a list of 16 compact, steep-spectrum candidates is generated. An ongoing search for pulsations in these candidates, in gamma rays and radio, has found 6 ms pulsars and one normal pulsar. A comparison of this method with existing selection criteria based on gamma-ray spectral and variability properties suggests that the pulsar discovery space using Fermi may be larger than previously thought. Radio imaging is a hitherto underutilized source selection method that can be used, as with other multiwavelength techniques, in the search for Fermi pulsars.
1 INTRODUCTION
One of the more significant contributions from the Fermi Gamma-ray Space Telescope has been the discovery of large numbers of rotation-powered pulsars (Abdo et al. 2013). Prior to launch, gamma-ray emission was expected to be detected among the normal, non-recycled radio pulsars but equal numbers of radio-quiet gamma-ray pulsars (‘Geminga-like’) have been discovered (Caraveo 2014). More surprisingly, nearly half of the current sample of ∼200 gamma-ray pulsars are radio-loud millisecond pulsars (MSPs). Comparative studies of these populations have led to new understanding on the geometry and emission processes in neutron star magnetospheres (Harding 2013). Fermi MSPs are being used in the quest to detect the stochastic gravitational wave background (Demorest et al. 2013; Bochenek, Ransom & Demorest 2015). Among the MSP sample are significant numbers of exotic binaries known as ‘redbacks’ and ‘black widows’, representing an evolutionary phase when the system emerges from an earlier accretion-powered low-mass X-ray binary (LMXB) state to a rotation-powered radio MSP that is ablating its companion star. Rarer still are those ‘transition’ systems that are seen to flip between the LMXB and MSP states (Stappers et al. 2014; Bogdanov & Halpern 2015; Johnson et al. 2015). Young, energetic pulsars have also been seen to undergo a type of mode-changing with accompanying changes in the pulse profile, the high-energy flux, and spin-down power (Allafort et al. 2013).
Since the release of the 4-yr LAT catalogue (hereafter 3FGL; Acero et al. 2015), the Large Area Telescope (LAT) continues to survey the gamma-ray sky finding an increasing number of sources (Massaro, Thompson & Ferrara 2015). By searching among the Fermi LAT unassociated sources, the population of pulsars has continued to grow. Most gamma-ray pulsars discovered to date have been found through direct pulsation searches at radio or gamma-ray wavelengths. Radio searches have been particularly effective; target selection based on gamma-ray properties is more efficient than blind sky surveys (e.g. Camilo et al. 2015; Cromartie et al. 2016). The ephemerides obtained by timing these radio pulsars have in turn enabled additional detections of gamma-ray pulsations.
Increasingly, multiwavelength imaging approaches are being used to complement these traditional pulsation search methods. X-ray counterparts are generally expected for both young, rotation-powered and millisecond pulsars (Acero et al. 2013; Marelli et al. 2015; Prinz & Becker 2015). Follow-up optical spectroscopy and photometry has revealed pulsars (or pulsar candidates) in binaries whose radio emission is suppressed in whole or in part by eclipses (Romani et al. 2012; Bhattacharyya et al. 2013; Kong et al. 2014; Strader et al. 2015).
The use of radio imaging to identify pulsar candidates has not been as widespread in the Fermi era (see Roy et al. 2015). Historically, this method was used to identify the first isolated millisecond pulsar and the first globular cluster pulsar (Erickson 1980; Hamilton, Helfand & Becker 1985). In two recent papers, we have applied this technique to search for pulsars towards the Fermi 3FGL unassociated sources and towards the Fermi GeV excess (Frail et al. 2016a; Bhakta et al. 2017). We continue this work here using a larger sample of LAT sources from an all-sky analysis of 7 yr of Fermi survey data, to identify further pulsar candidates. We have also undertaken higher angular resolution interferometry of the new candidates and the earlier 3FGL sample in an attempt to further strengthen our pulsar classifications by eliminating false positives within the sample, and we have carried out some preliminary searches for pulsations. In Section 2, we describe our search method and apply it to the new source list while in Section 3 we describe the interferometric observations. The results of the search and the interferometric follow-up are given in Sections 4.1 and 4.2, while in Section 5 we summarize the search for pulsations. In Section 6, we discuss the advantages and limitations of imaging approaches.
2 METHOD
Our method for identifying promising candidates within the error ellipses of Fermi LAT unassociated sources relies on the fact that pulsars are compact, steep-spectrum radio sources. Pulsars stand out at low radio frequencies since they have steep power-law spectra typically from 100 MHz to several GHz, with negative slopes α = −1.8 ± 0.2 (where Sν ∝ να; Maron et al. 2000). After correcting for observational biases the true distribution of spectral indices has a mean α = −1.4 ± 1 (Bates, Lorimer & Verbiest 2013).
Initial radio sources come from the GMRT 150 MHz All-Sky Radio Survey (TGSS ADR1; Intema et al. 2017). This survey imaged the whole sky north of δ = −53°, covering 36 930 deg2. The angular resolution is 25 arcsec × 25 arcsec for δ >19° and 25 arcsec × 25 arsec/cos (δ − 19°) for more southern declinations. The median rms noise of the TGSS ADR1 images is 3.5 mJy beam−1 and the final 7σ catalogue contains 0.62 million radio sources. The source catalogue and the processed images are publicly available on-line.1
The TGSS ADR1 is notable for its low noise and high angular resolution relative to other low-frequency surveys (Heald et al. 2015; Hurley-Walker et al. 2017). An all-sky centimetre survey such as the 1.4 GHz NRAO VLA Sky Survey (NVSS; Condon et al. 1998) has lower rms noise (0.5 mJy beam−1), but TGSS ADR1 sensitivity is superior for steep-spectrum sources, i.e. α ≤ − 0.87. These properties are what make the TGSS ADR1 particularly well-suited for finding pulsars, both known and unknown. To illustrate this capability, we note that phase-averaged emission was detected towards nearly 300 known pulsars in the TGSS ADR1 (Frail et al. 2016b), more than all previous imaging surveys combined.
To identify pulsar candidates, it is necessary to define suitable spectral and angular criteria to distinguish compact, steep-spectrum sources from the large sample of radio sources. We begin by deriving a two-point spectral index (or limit) by comparing the TGSS flux density with the NVSS above δ ≥ −40° and the 843 MHz Sydney University Molonglo Sky Survey (SUMSS; Bock, Large & Sadler 1999) for δ < −40°. In Fig. 1, we have plotted the (two-point) spectral index of a global source match of the TGSS and NVSS catalogues, versus a measure of source compactness, defined here as the ratio of the flux density (St) versus the peak intensity (Sp) at 150 MHz. The peak intensity is read directly from the images, while the flux density is derived from a Gaussian fit of the source. On the same plot, we show all of the known pulsars for which we detected phase-averaged emission from the TGSS ADR1 at 150 MHz (Frail et al. 2016b). The distribution of spectral indices for background radio sources is markedly different than that for pulsars. A typical radio source has a mean |$\bar{\alpha }=-0.73$| (Intema et al. 2017), while the observed median distribution of pulsar spectral indices is closer to −1.8. Only 0.3 per cent of all radio sources have α < −1.5 (Intema et al. 2017), while two-third of all known pulsars have such steep spectral indices.
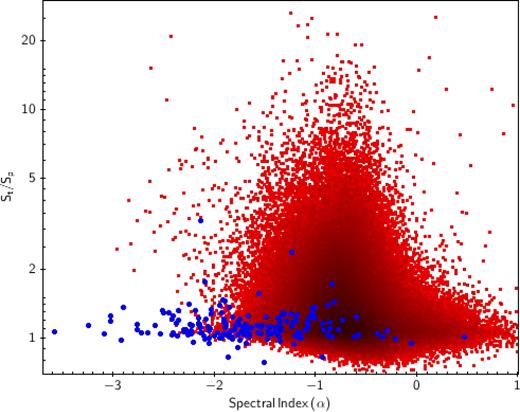
The distribution of spectral indices versus compactness for background radio sources (red squares) and known pulsars (blue circles). Spectral indices are two-point values computed from the TGSS ADR1 and NVSS catalogues at 150 MHz and 1.4 GHz, respectively (Intema et al. 2017). Compactness is defined as the ratio of the flux density (St) versus the peak brightness (Sp) at 150 MHz.
As noted above, we use the ratio of the flux density of a source versus its peak intensity as our compactness criterion. Frail et al. (2016b) argued that St/Sp ≲ 1.5 was sufficient to capture most viable pulsar candidates. Note that a more sophisticated measure of radio source compactness is defined in Intema et al. (2017) takes into account the increasing spread of this ratio with declining signal to noise. Such a measure is not particularly well suited for pulsars since their intensity can vary (due to scintillation) during an observation, violating the stationarity assumption that underpins radio interferometric imaging. Outliers with large St/Sp ratios in Fig. 1 include the bright and strongly scintillating PSR B1937+21 and pulsars whose flux densities are influenced by an underlying pulsar wind nebula.
An initial list of pulsar candidates selected on the basis of the two criteria of compactness (St/Sp ≲ 1.5) and spectral index (α ≲ − 1.5) will still have too many false positives to be useful for conducting an efficient follow-up pulsation search. A list of possible false positives includes high redshift radio galaxies, variable or transient radio sources, cross survey calibration errors, and image or catalogue artefacts. We discuss each of these in turn below.
Not all steep-spectrum sources are pulsars. There is a population of steep-spectrum, luminous high redshift galaxies (HzRGs; Miley & De Breuck 2008) that can be mistaken for pulsars. HzRGs are interesting in their own right. They are useful signposts for identifying proto-clusters, and a suitably bright, highly redshifted 150 MHz radio source could be used to measure neutral hydrogen absorption of the intergalactic medium prior to the epoch of reionization (Carilli, Gnedin & Owen 2002). The areal density of HzRGs is not well known but they can be separated from pulsars since the former have kpc-size extended structure while the later are point-like. The angular resolution of the TGSS ADR1 (∼25 arcsec) is not sufficient to identify most HzRGs so follow-up observations are required at arcsecond resolution (see Section 3). As an added benefit, the arcsecond localization helps with identifying any optical and X-ray counterparts and reduces the pulsation search space. A detailed search of counterparts is beyond the scope of this paper.
Another class of false positives can be created as a result of measuring an initial spectral index from two all-sky catalogues taken at very different epochs. The NVSS was observed in circa 1995 while GMRT 150 MHz survey was carried out 16 yr later (mean epoch =18 January 2011). In such a case, short-lived transients or extreme variables could result in anomalously steep-spectrum sources. We suspect that transients are unlikely to be a serious contaminant as the radio sky is remarkably quiet at metre and centimetre wavelengths. The transient surface density at 150 MHz at the flux density threshold of the TGSS ADR1 is estimated to be 6.2 × 10⁻⁵ deg−2 by Murphy et al. (2017). Transient rates at 1.4 GHz at the sensitivity level of the NVSS are similarly low (see Mooley et al. 2016, and references therein).
Variable radio sources can be a more significant source of false positives. Pulsars can be variable sources but in imaging mode interferometric surveys tend to average out variability time-scales of minutes to hours (Frail et al. 2016b). Although the study of low-frequency variability at the sub-Jansky level has just begun, initial results suggest that approximately 1.5 per cent of radio sources at 150 MHz are ‘strong variables’, defined roughly as sources whose max-to-min flux density difference varies by 1.4 times the average flux density on time-scales of a year or more (Mooley et al. 2017). Similar numbers are found for variability at 1.4 GHz (Hancock et al. 2016). Variability of this magnitude can produce changes in the mean spectral index of order ±0.15. This amounts to a simple error term when studying the bulk of the radio source population, but the tails of the spectral index distribution are more susceptible. Even though only a fraction of radio sources show this level of variability, the smaller number of sources with very negative (α < −1.5) or positive power-law spectral slopes will be contaminated by the more numerous flatter spectral index sources scattering into the tail. We estimated the magnitude of the effect by taking a pessimistic case where all the variables lie in a narrow range of −1.50 < α < −1.25 and 1.5 per cent of these sources vary by enough to scatter into α ≤ − 1.50. In this case, as much as 5 per cent of the steep-spectrum candidates could be due to variables. Variability does not have to be intrinsic to the source either. Direction-dependent flux density calibration errors between surveys mimic the effects of variability, again having a bigger effect at the tails of the spectral index distribution.
There are also false positives that originate as image or catalogue artefacts. These are the result of using sky surveys taken by different telescopes with different rms noise sensitivity, varying sensitivity to spatial structure, and different angular resolution. Additionally, source-finding algorithms used to generate the catalogues have very different levels of reliability and completeness. There has also been a gradual improvement in these algorithms with time (Hancock et al. 2012; Mooley et al. 2013). For example, we have found that the SUMSS catalogue is missing substantial numbers of radio sources that are clearly visible in the SUMSS images. Visual inspection of the NVSS images can also reveal weak radio sources not in the original catalogue. Image artefacts also appear in all three of the surveys that we used. While the TGSS ADR1 catalogue has remarkably good source reliability (see fig. 18 of Intema et al. 2017), there are still false source identifications of sidelobe structures, caused by residual calibration errors near bright radio sources. The short snapshots and compact configuration used to carry out the NVSS make it less reliable for point-source identification in the Galactic plane. All of these false positives can be easily picked out by visually inspecting the candidates in the original images.
Summarizing the above discussion, we have shown that a promising list of pulsar candidates can be generated by identifying compact (St/Sp ≲ 1.5) and steep-spectrum (α ≲ − 1.5) radio sources from a low-frequency catalogue (Fig. 1). However, prior to undertaking a resource-intensive pulsation search, the reliability of each pulsar candidate must be verified by identifying and removing false positives from the sample. In some cases (e.g. missing sources, artefacts), all that is required is visual inspection of the original images. When possible, we use other existing survey data as a check on variability and to improve on the two-point spectral index values. This includes the Faint Images of the Radio Sky at Twenty centimeters survey (FIRST; Becker, White & Helfand 1995) at 1.4 GHz, the Westerbork Northern Sky Survey (WENSS; Rengelink et al. 1997) at 325 MHz, the Very Large Array Low-frequency Sky Survey Redux (VLSSr; Lane et al. 2014) at 74 MHz, and the recently released GLEAM survey from 72 to 231 MHz (Hurley-Walker et al. 2017). Follow-up interferometric observations remain an important final step to identify extended sources such as HzRGs, to provide further constraints on variability, and to improve on the accuracy of the spectral index and sky position.
2.1 The 3FGL sources
In a recent paper, we used this radio image-based method to identify promising pulsar candidates among the unassociated sources in the 4-yr 3FGL catalogue (hereafter Paper I; Frail et al. 2016a). We searched the error ellipses of the 839 Fermi sources above the southern declination limit of the TGSS ADR1 of δ = −53° finding 1485 radio sources at 150 MHz. From an initial candidate list of 25 steep-spectrum sources, we used existing radio images and catalogues to generate 11 point-like, steep-spectrum pulsar candidates. This work was carried out before Frail et al. (2016b), and so a less stringent compactness criterion was used than that adopted here (i.e. St/Sp ≲ 1.5). This approach left open the possibility that our candidate list from Paper I had significant contamination from HzRG. Thus, we have undertaken interferometric observations of most of the 3FGL candidates (see Section 3).
2.2 The 7-yr Fermi LAT Sources
For this work, we used an all-sky source list based on 7 yr of LAT survey data, using the updated Pass 8 data set and the same likelihood-based procedure to detect point sources used for the 3FGL catalogue (Acero et al. 2015), going down to lower significance than the regular LAT catalogues. This analysis was a preliminary version of the procedure that will be used to produce the next public release LAT source catalogue. It is expected that the next public release of the LAT source catalogue will use an 8 yr data set. Because our source list does not correspond to a particular Fermi LAT catalogue, we give them generic source names like Fermi JHHMM.m+DDMM, in accordance with IAU naming conventions. Our source list contains 7091 discrete gamma-ray sources, of which 2652 are unassociated sources. The term ‘unassociated’ in the Fermi context means a gamma-ray source that is lacking a reliable association with sources detected at other wavelength bands. While the number of unassociated sources is more than twice that in the 3FGL catalogue, the fraction relative to the total number of discrete sources is still about one-third. Above the declination cut-off of our radio source search (δ ≥ −53°), there are 2313 unassociated sources. The mean semimajor and semiminor axes (95 per cent confidence) for these unassociated sources are 0.16° and 0.12°, respectively, and the total search area is 182.2 deg2.
Our initial radio source matching with Fermi unassociated error ellipses was done with the GMRT 150 MHz All-Sky Radio Survey (Intema et al. 2017). We used the latest version of the TGSS 5σ catalogue which contains 707 255 sources. This catalogue is expected to be made public along with a new data release (TGSS ADR2) in 2018. Since the total TGSS area is about 36 930 deg2 (11.25 sr) the areal density of radio sources on the sky is 19.2 radio sources per deg2.
We used TOPCAT (Taylor 2005) to search the 5σ catalogue for all 150 MHz radio sources within the 95 per cent confidence error ellipses of all the unassociated LAT sources in our new source list. A total of 3866 radio sources were found towards the 2313 unassociated sources. Of these 2313 unassociated gamma-ray sources, 1367 have one or more radio sources within their 95 per cent error ellipses, while another 946 have no radio sources to the limits of the TGSS ADR1 catalogue. The radio source counts towards Fermi unassociated error ellipses show an excess of approximately 10 per cent over the background. We estimate the background radio source counts in two ways. The simplest method is to multiply the total area searched (182.2 deg2) times the areal density of the TGSS 5σ catalogue (19.2 per deg2) giving 3498 sources, for an excess of 368 radio sources. For more accurate values, we must take into account the decrease of radio source counts in the Galactic plane. For this, we simulated populations of gamma-ray sources whose number and total area were the same as the 2313 unassociated sources but with random positions according to the prescription in Section 3.2 of Ackermann et al. (2011). We generated 500 random gamma-ray source lists and carried out matched searches of radio sources for each. The average number of background radio sources is 3523.5 sources, distributed with a Gaussian of width ±67.9. These two estimates agree within the errors. Thus, the excess in TGSS ADR1 radio sources towards unassociated Fermi sources at 150 MHz is 342.5 sources, or 5σ.
A radio excess towards Fermi unassociated sources is unsurprising since the known population of Fermi sources are mostly active galactic nuclei (AGNs) and nearly all of these have a radio counterpart (Ackermann et al. 2015; Massaro et al. 2015). Here, we are concerned with identifying pulsar candidates and so we start by calculating two-point spectral indices for the 3866 TGSS sources at 150 MHz and using either NVSS at 1.4 GHz or SUMSS at 0.84 GHz. For the TGSS ADR1 sources with neither a NVSS nor a SUMSS counterpart, we calculated an upper limit on the spectral index based on the completeness limit of these surveys (NVSS = 2.5 mJy, SUMSS = 10 mJy). We next apply the compactness and spectral criteria. As noted above, we used α ≤ −1.5 as our definition of a steep-spectrum radio source and we used St/Sp ≲ 1.5 to define compactness. For the TGSS-NVSS comparison, we found 6 compact steep-spectrum matches and another 20 with only upper limits on α (i.e. TGSS detections without NVSS counterparts). For the SUMSS, there were no steep-spectrum matches but there were 29 upper limits. From this initial candidate list of 55 steep-spectrum sources, we used existing radio images and catalogues to identify false positives. Only two of 29 SUMSS candidates were genuine steep-spectrum candidates. The remaining sources appear to be imaging artefacts or are simply typical non-thermal radio sources that just failed to make it into the SUMSS catalogue. There are similar issues with the NVSS and TGSS images but not of the same magnitude. After visual inspection of the TGSS-NVSS images, we found 10 candidates; 4 with spectral indices derived from both NVSS and TGSS and 6 upper limits with only TGSS catalogue flux densities. Our final list prior to follow-up interferometry (Section 3) consisted of 12 pulsar candidates.
3 INTERFEROMETER OBSERVATIONS
As noted in Section 2, interferometric follow-up observations have two main goals. The first is to identify false positives, i.e. high redshift galaxies that are resolved at arcsecond angular resolution. The second goal is to verify the flux density at centimetre wavelengths and, where possible, improve on the position to help counterpart and pulsation searches. Detailed results are discussed in Sections 4.1 and 4.2.
3.1 VLA observations
We obtained data with the Karl G. Jansky Very Large Array (VLA) as part of project 16A-460 using Director's Discretionary Time. Observations were carried out between 2016 May and July in CnB and B array configurations. Under the assumption that the spectra of the sources will be falling steeply with frequency, we chose S band (2–4 GHz) as a compromise between maintaining adequate continuum sensitivity for these steep-spectrum sources and requiring arcsecond angular resolution to resolve extended emission. On-source integration times were typically 20–30 min. We used the standard Wideband Interferometric Digital Architecture (WIDAR) correlator setup for continuum observing with 16 spectral windows, 64 2-MHz wide channels each to get 2 GHz of total bandwidth centred on 3.0 GHz, and 5-s integrations. RFI flagging and calibration of the data were done using the automated VLA CASA calibration pipeline2 implemented for CASA 4.6. The target data were then split off and each target pointing was imaged up to the half-power point of the primary beam. Suitable pixel size was chosen in order to sample the synthesized beam with four pixels.
3.2 ATCA observations
We obtained data with the Australia Telescope Compact Array (ATCA) as part of project CX355 using Director's Discretionary Time. Observations were conducted on 2016 April 28–29 in the 6A (6 km) configuration and on 2016 June 16–17 in the EW352 (compact) configuration. A full 2 GHz of bandwidth was correlated with the Compact Array Broad-band Backend (CABB; Wilson et al. 2011) centred on 2.1 GHz and using a channel width of 1 MHz. On-source integration times were typically 1 h. PKS 1934−638 was the primary flux density calibrator, while 0823−500 was used for delay and bandpass calibration. Phase calibrators were selected close to each target source. The visibility data were calibrated and imaged using the MIRIAD package following standard practices (Sault, Teuben & Wright 1995).
4 RESULTS
4.1 The 3FGL candidate sample
Interferometric observations were made with the VLA (Section 3.1) and ATCA (Section 3.2) for all but three of the original 11 steep-spectrum candidates from Paper I. Table 1 lists all 11 3FGL sources from Paper I with their S-band flux densities (or upper limits) along with short notes. The three sources that were not observed have no S-band values in Table 1. Two of these three unobserved sources (3FGL J1827.6−0846 and J1901.5−0126) had been detected as gamma-ray MSPs in a blind search using the TGSS positions prior to the start of the VLA and ATCA observing (see Section 5 and Clark et al. 2017), while the third source (3FGL J0258.9+0552) already had a good interferometric image from FIRST. For point sources or upper limits that remain viable pulsar candidates, we list the interferometer that observed each field in column 3. If a source was subsequently determined to be an AGN or a known pulsar (PSR), we do not include the S-band flux density and we make a short-hand notation about the object to this effect in column 3.
Measured interferometer flux densities or peak brightness limits.
| Fermi name | S band | Notes |
|---|---|---|
| 3FGL sources | ||
| 3FGL J0258.9+0552 | FIRST | |
| 3FGL J1533.8−5231 | <0.1 | ATCA |
| 3FGL J1639.4−5146 | <0.2 | ATCA |
| 3FGL J1747.0−3506 | <0.08 | ATCA |
| 3FGL J1827.6−0846 | MSP | |
| 3FGL J1830.8−3136 | 1.86 ± 0.05 | α > −1.5 |
| 3FGL J1901.5−0126 | MSP | |
| 3FGL J1925.4+1727 | AGN | |
| 3FGL J1949.3+2433 | AGN | |
| 3FGL J2028.5+4040c | AGN | |
| 3FGL J2210.1+5925 | <0.018 | Var. |
| 7-yr sources | ||
| Fermi J0628.6+0511 | 1.47 ± 0.05 | VLA |
| Fermi J1236.5+1133 | 3.08 ± 0.03 | VLA |
| Fermi J1555.6−2906 | <0.017 | VLA |
| Fermi J1646.5−4406 | 1.4 ± 0.2 | ATCA |
| Fermi J1722.0−3204 | PSR | |
| Fermi J1728.1−1608 | <0.012 | VLA |
| Fermi J1739.3−2530 | <0.023 | VLA |
| Fermi J1803.1+1400 | <0.024 | VLA |
| Fermi J1833.0−3839 | <0.3 | ATCA |
| Fermi J1843.8−3834 | 4.14 ± 0.13 | ATCA |
| Fermi J2000.8−0300 | 0.75 ± 0.03 | VLA |
| Fermi J2259.1+6233 | AGN | |
Note. S-band detections in mJy, upper limits in mJy beam−1.
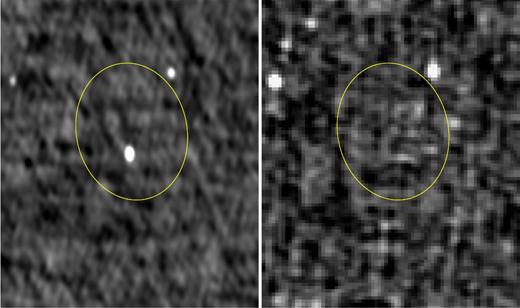
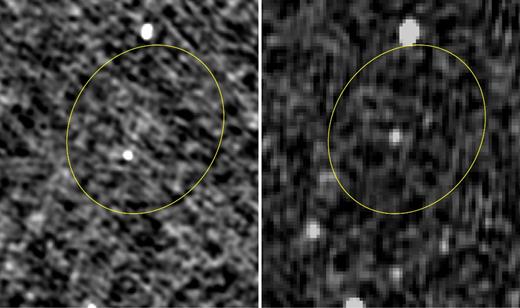
While the candidate pulsars towards 3FGL J1925.4+1727, J1949.3+2433, and J2028.5+4040c were point-like to the 25 arcsec beam of the TGSS images, they appear fully resolved in the follow-up interferometric images with a resolution of 4 arcsec. VLA images of each source are shown in Fig. 2. The first two sources show diffuse emission on a scale of 6–12 arcsec, while the third source is resolved into a double with a separation of 10 arcsec. These three resolved sources are no longer considered compelling pulsar candidates. Lyne et al. (2017) argue that PSR J1925+1720, a young, energetic pulsar that lies just outside of the nominal Fermi error ellipse is the high energy counterpart.
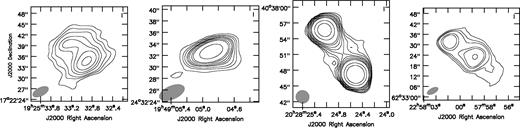
Contour plots for steep-spectrum radio candidates observed by the VLA at 3.1 GHz (left to right: 3FGL J1925.4+1727, 3FGL J1949.3+2433, 3FGL J2028.5+4040c, Fermi J2259.1+6233) in Fermi error ellipses that are resolved by the VLA. Due to their extended nature, these are no longer considered pulsar candidates. The synthesized beam for each cutout is shown as a grey ellipse. The contour levels are at 3, 5, 7, 10, 12, 15, 20, 50, and 100 times the rms noise for the 3FGL sources, and 15, 20, 25, 40, 50, and 100 times the rms noise for Fermi J2259.1+6233. The RMS noise in the respective images (left to right) is 48, 42, 44, and 23 μJy beam−1.
The pulsar candidate within the 3FGL J1830.8−3136 is unresolved by the ATCA at 2.1 GHz with a resolution of 13 arcsec × 4 arcsec. The peak brightness is 1.86 ± 0.05 mJy beam−1 with an improved J2000 position of R.A. = 18h30m38.73 and δ=−31°35΄7|${^{\prime\prime}_{.}}$|1, and an uncertainty of ±0|${^{\prime\prime}_{.}}$|2. With this third detection, we can refit the power-law slope and derive α = −1.46 ± 0.10. This spectral slope is flatter than its original value from Paper I. While this compact radio source within 3FGL J1830.8−3136 could still be a pulsar, it nominally lies outside of our cut-off criterion of α ≤ − 1.5.
The VLA and ATCA did not detect significant emission towards four candidates. The ATCA 3σ upper limits at 2.1 GHz for the TGSS radio sources towards 3FGL J1533.8−5231, J1639.4−5146, and J1747.0−3506 are 300, 600, and 240 μJy beam−1, respectively. These upper limits are all consistent with an extrapolation of the original two-point spectral indices derived in Paper I and thus these remain pulsar candidates. The same cannot be said for the VLA non-detection of 3FGL J2210.1+5925. The 3σ upper limit of 55 μJy beam−1 is well below the extrapolation of the original power-law spectrum that predicts 850 μJy, based on four flux density measurements from 75 to 1400 MHz. The sharp drop appears to be real and may be a result of variability or a resolution effect. To explore the latter, we convolved the image with a 25 arcsec beam to search for extended emission but none was found above the noise. While 3FGL J2210.1+5925 could still be a (variable) pulsar candidate, a more conservative interpretation of the large St/Sp ratio is that it is an extended radio source (see discussion in Section 2).
To summarize, of the original list of 11 pulsar candidates from Paper I and Table 1, 6 remain as promising candidates defined by our criteria of compactness and spectral slope. These sources are listed in Table 2. In column one, we list the source name. Columns two, three, and four contain information about the pulsation searches in Section 5. They are discussed in more detail in that part of the paper but in order they are the type of search, a ‘pulsarness’ ranking based on gamma-ray properties (see Section 6), and a summary of the properties of the new pulsars.
Compact, steep-spectrum pulsar candidates with interferometric imaging and pulsation searches.
| Source name | Pulse search | γ Grade | PSR notesa |
|---|---|---|---|
| 3FGL sources | |||
| 3FGL J0258.9+0552 | γ, GBT | unlikely | |
| 3FGL J1533.8−5231 | unlikely | ||
| 3FGL J1639.4−5146 | γ | psr-A | |
| 3FGL J1747.0−3506 | γ, VLA | psr-D | |
| 3FGL J1827.6−0846 | γ, GBT | unlikely | gm (2.2 ms) |
| 3FGL J1901.5−0126 | γ, GBT | psr-C | grm (2.8 ms) |
| 7-yr sources | |||
| J0628.6+0511 | Arecibo, VLA | psr-D | |
| J1236.5+1133 | Arecibo | unlikely | |
| J1555.6−2906 | GBT, VLA | unlikely | rmb (1.7 ms) |
| J1646.5−4406 | VLA | unlikely | |
| J1728.1−1608 | GBT, VLA | psr-C | rm (2.5 ms) |
| J1739.3−2530 | γ, GBT, VLA | psr-A | r (1.8 s) |
| J1803.1+1400 | Arecibo, VLA | psr-C | rmb (1.5 ms) |
| J1833.0−3839 | GBT, VLA | psr-C | rmb (1.9 ms) |
| J1843.8−3834 | VLA | psr-C | |
| J2000.8−0300 | VLA | unlikely | |
Note.aPSR notes: g=gamma-ray pulse, r=radio pulse, m=MSP, b=binary.
4.2 The 7-yr Fermi candidate sample
In Section 2, we described the method for identifying the original 12 pulsar candidates from the 7-yr LAT source list (Table 1). 2 of the 12 sources were eliminated from further consideration. Our steep-spectrum candidate towards Fermi J1722.0−3204 is a known pulsar PSR B1718−32 from PSRCAT (Manchester et al. 2005). This is an old, slow pulsar with a period of 477 ms with a spin-down energy of 2.3 × 1032 erg s−1. Given the low spin-down energy, this pulsar is likely not associated but rather is a line-of-sight coincidence with the gamma-ray source. A second steep-spectrum candidate towards Fermi J2259.1+6233 was resolved by the VLA and is therefore not a pulsar (see Fig. 2). We discuss the remaining 10 sources individually in the subsections below. For each of these candidates, we searched for additional radio data to improve upon the two-point spectral indices, and we looked for multiwavelength counterparts. Their properties are summarized in Table 3. Table 3 lists the radio properties of these candidates taken directly from the TGSS ADR1 catalogue, i.e. the J2000 right ascension (RA) and declination (DEC), Galactic longitude (l) and latitude (b), the flux density in mJy (St), and the peak brightness (Sp) in mJy beam−1. For the VLA and data from Sections 3.1 and 3.2, the peak intensity is read directly from the image, while the flux density is derived from a Gaussian fit of the source. The power-law spectral index for each source in Table 3 is derived for each source in the sub-sections below. If more accurate positions were measured they are also given in the discussion subsection for individual sources below.
Steep-spectrum radio sources towards Fermi unassociated sources from the preliminary 7-yr LAT source list.
| RA | DEC | l, b | St | Sp | α | Fermi source |
|---|---|---|---|---|---|---|
| 06:28:44.48 (±0.13) | +05:19:17.4 (±2.0) | 205.6, −2.6 | 133.8 ± 15.6 | 136.3 ± 14.4 | −1.62 | J0628.6+0511 |
| 12:36:46.98 (±0.16) | +11:29:03.4 (±2.2) | 289.8, 74.0 | 161.2 ± 22.0 | 119.6 ± 15.3 | −1.62 | J1236.5+1133 |
| 15:55:40.69 (±0.13) | −29:08:29.0 (±2.1) | 344.5, 18.5 | 133.9 ± 14.4 | 113.0 ± 11.7 | −2.5 | J1555.6−2906 |
| 16:46:22.64 (±0.14) | −44:05:33.4 (±3.7) | 340.8, 0.8 | 198.7 ± 26.2 | 138.3 ± 17.3 | −1.86 | J1646.5−4406 |
| 17:27:59.08 (±0.13) | −16:09:09.1 (±2.1) | 8.7, 10.2 | 116.6 ± 13.3 | 103.0 ± 11.0 | −2.6 | J1728.1−1608 |
| 17:39:30.70 (±0.14) | −25:30:17.5 (±2.2) | 2.2, 3.0 | 142.7 ± 18.5 | 131.5 ± 14.8 | −2.5 | J1739.3−2530 |
| 18:03:14.85 (±0.14) | +13:58:21.6 (±2.1) | 40.3,16.9 | 98.3 ± 13.1 | 80.5 ± 9.6 | −2.2 | J1803.1+1400 |
| 18:33:04.45 (±0.13) | −38:40:46.1 (±2.1) | 356.0, −13.3 | 303.7 ± 31.8 | 286.0 ± 29.1 | −2.15 | J1833.0−3839 |
| 18:44:35.78 (±0.13) | −38:40:49.6 (±2.0) | 356.9, −15.3 | 470.4 ± 47.8 | 439.0 ± 44.2 | −1.68 | J1843.8−3834 |
| 20:00:52.90 (±0.14) | −02:58:02.7 (±2.2) | 38.3,−16.8 | 99.2 ± 13.4 | 81.6 ± 9.8 | −1.68 | J2000.8−0300 |
Notes. (a) Positions, flux density, and peak brightness values come from the TGSS ADR1 150 MHz source catalogue (Intema et al. 2017). (b) RA and DEC include a 2 arcsec systematic error added in quadrature to the Gaussian fit errors. (c) The peak brightness (Sp) and flux density (St) values have a 10 per cent systematic term added in quadrature to the measurement errors. Fermi sources in boldface indicate initial pulsar detections from Table 2.
In Table 4, we list the properties of the 7-yr unassociated gamma-ray sources based on our analysis. We list the semimajor (Maj) and semiminor (Min) axes of the 95 per cent confidence positional ellipses, the spectral type (Spec Type), the gamma-ray flux (Fγ), a γ-ray spectral index (Spec. Index), energy flux at 100 MeV (E100), the test statistic (TS) of the source derived from the likelihood analysis, and the angular offset of the centroid of the Fermi source and the radio source (Δθ). The current list includes two sources with TS <25. Such sources are not released in standard catalogues since it is more likely that they are spurious. Table 1 of Paper I has a similar list of properties for the 3FGL sample.
Gamma-ray properties of steep-spectrum radio sources from the preliminary 7-yr LAT source list.
| Fermi | Maj×Min (θ) | Spec | γ | Spec. | E100 | TS | Δθ |
|---|---|---|---|---|---|---|---|
| source | [deg × deg (○)] | type | index | (erg cm−2 s−1) | (deg) | ||
| J0628.6+0511 | 0.34×0.20 (22.0) | PL | 2.42E-13 | 2.59 | 6.95E-12 | 27.9 | 0.13 |
| J1236.5+1133 | 0.63×0.25 (−85.1) | PL | 7.15E-13 | 2.64 | 2.44E-12 | 29.7 | 0.09 |
| J1555.6−2906 | 0.09×0.07 (11.7) | PL | 5.94E-13 | 2.51 | 5.67E-12 | 87.7 | 0.03 |
| J1646.5−4406 | 0.05×0.05 (74.2) | PL | 1.04E-13 | 2.49 | 1.41E-11 | 31.6 | 0.04 |
| J1728.1−1608 | 0.08×0.07 (88.9) | LP | 5.65E-13 | 1.87 | 3.27E-12 | 66.7 | 0.05 |
| J1739.3−2530 | 0.06×0.05 (55.0) | LP | 1.02E-12 | 2.38 | 1.01E-11 | 105.4 | 0.04 |
| J1803.1+1400 | 0.11×0.09 (−32.3) | PL | 5.74E-14 | 2.18 | 2.77E-12 | 30.9 | 0.04 |
| J1833.0−3839 | 0.11×0.08 (63.3) | PL | 1.33E-13 | 2.36 | 2.90E-12 | 31.0 | 0.02 |
| J1843.8−3834 | 0.3 ×0.26 (10.0) | PL | 2.59E-13 | 2.55 | 2.20E-12 | 13.1 | 0.19 |
| J2000.8−0300 | 0.41×0.22 (12.6) | PL | 4.75E-13 | 2.74 | 3.45E-12 | 18.5 | 0.04 |
Notes. (a) The gamma-ray flux density (100 MeV to 300 GeV) Fγ is in units of ph. cm−2 MeV−1 s−1. (b) Spectral Type is either power law (PL) or a log parabola (LP).
4.2.1 Fermi J0628.6+0511
This candidate has a peak brightness of 136.3 ± 14.4 mJy beam−1 at 150 MHz. There is a moderately bright point source at 1.4 GHz in the NVSS catalogue with a flux density of 3.1 ± 0.4 mJy (Fig. 3). Our follow-up VLA observations (Section 3.1) show an unresolved source (beam = 7.9 arcsec × 4.9 arcsec) with a peak brightness at 3.1 GHz of 1.09 ± 0.03 mJy beam−1 and a flux density of 1.47 ± 0.05 mJy. A power-law fit to these data gives α = −1.62 ± 0.05. This VLA detection allows us to improve the position over the TGSS ADR1 value to R.A.=06h28m44|${^{\rm s}_{.}}$|45 and δ=05°19΄16.8 with an uncertainty of ±0.2 arcsec.
Fermi J0628.6+0511. (Left) A steep-spectrum pulsar candidate in the centre of a TGSS ADR1 image at 150 MHz. (Right) The same field from the NVSS at 1.4 GHz. The curve is the Fermi 95 per cent error ellipse for an unassociated gamma-ray source in this same direction, whose angular size is given in Table 4. The field of view is 19.5΄ by 11.1΄.
4.2.2 Fermi J1236.5+1133
The TGSS ADR1 source lies towards the largest of the Fermi error ellipses in our candidate sample. The spectral index of α = −1.62 is derived from the TGSS ADR1 flux density at 150 MHz and a moderately bright NVSS point source at 1.4 GHz with a flux density of 4.3 ± 0.4 mJy (Fig. 4). However, the radio source appears to be variable at 1.4 GHz since it appears in the FIRST catalogue with a flux density of 8.63 ± 0.15 mJy, double that of the NVSS value. The FIRST source appears unresolved in the catalogue (<1.7 arcsec) and we can use the more accurate position of RA=12h36m47.056, DEC=11°29΄1.31, with uncertainties of approximately 0.15 arcsec in both coordinates. Our follow-up VLA observations (Section 3.1) show an unresolved source (beam = 9.3 arcsec × 3.3 arcsec) with a peak brightness and flux density at 3.1 GHz of 2.99 ± 0.02 mJy beam−1 and 3.08 ± 0.03 mJy, respectively. We split these S-band observations into two frequency bands at 2.69 and 3.37 GHz and we measured a spectral index of α = −1.2 ± 0.3, comparable to the value derived above. The TGSS position is coincident with a likely M star (R = 19.15 mag) that is visible in WISE, NOMAD, SDSS, and UKIDSS images. The improved VLA and FIRST positions are consistent with each other and they place the star 3.5 arcsec to the north-west and hence the star is not associated with the radio source. There is no VLSSr detection. Taken together, these data suggest that the steep spectrum may be an artefact of the variability of the radio source.
Fermi J1236.5+1133. (Left) A steep-spectrum pulsar candidate in the centre of a TGSS ADR1 image at 150 MHz. (Right) The same field from the NVSS at 1.4 GHz. The curve is the Fermi 95 per cent error ellipse for an unassociated gamma-ray source in this same direction, whose angular size is given in Table 4. The field of view is 23 arcmin by 19.8 arcmin.
4.2.3 Fermi J1555.6−2906
There is a single TGSS ADR1 source at 150 MHz within this Fermi error ellipse but no corresponding NVSS radio source at 1.4 GHz (Fig. 5). The spectral index derived from the survey data and NVSS upper limit alone is <−2.2. The source is included in the GLEAM source catalogue (Hurley-Walker et al. 2017). A slightly steeper value of α = −2.5 ± 0.2 is derived if we include the GLEAM data and the 3.1 GHz 3σ upper limit of 51 μJy beam−1 from the VLA follow-up observations (Section 3.1).
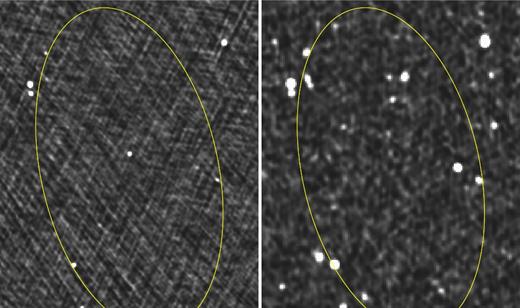
Fermi J1555.6−2906. (Left) A steep-spectrum pulsar candidate near the centre of a TGSS ADR1 image at 150 MHz. (Right) The same field from the NVSS at 1.4 GHz. The curve indicates the Fermi 95 per cent error ellipse for an unassociated gamma-ray source in this same direction, whose angular size is given in Table 4. The field of view is 12.2 arcmin by 10.3 arcmin.
4.2.4 Fermi J1646.5−4406
This candidate lies 16 arcmin to the south-east from the centre of the shell-like Galactic supernova remnant G 341.2+0.9 that is claimed to be associated with PSR B1643−43 and its pulsar wind nebula (Frail, Goss & Whiteoak 1994; Giacani et al. 2001). The TGSS ADR1 candidate is embedded within a ‘spur’ of emission that begins at the south-eastern edge of SNR G 341.2+0.9 and runs north–south (Fig. 6). At this position in the SUMSS image at 843 MHz, there is a point source with a peak brightness of 10 mJy beam−1. The source is visible at 330 MHz but the resolution of the synthesized beam in Frail et al. (1994) is too poor to measure the flux density of the point source separate from the extended emission. Our follow-up ATCA observations at 2.1 GHz (Section 3.2) required two epochs taken at different elevation angles because the side lobes of bright, nearby sources made flux density measurements difficult. In the combined image, we detect a source with a flux density of 1.4 ± 0.2 mJy. A power-law fit to the three detections gives α = −1.86 ± 0.12. The ATCA detection allows for an improved position of R.A.=16h46m22.77 and δ=−44°05΄40.8 with an uncertainty of ±0.5 arcsec. The TGSS and ATCA declination values differ by about 2σ, or about one ATCA synthesized beam.
Fermi J1646.5−4406. (Left) A steep-spectrum pulsar candidate near the centre of a TGSS ADR1 image at 150 MHz. (Right) The same field from the SUMSS at 843 MHz. The shell-like Galactic supernova remnant G 341.2+0.9 is in the upper left corner of this image. The curve indicates the Fermi 95 per cent error ellipse for an unassociated gamma-ray source in this same direction, whose angular size is given in Table 4. The field of view is 24.6 arcmin by 20.7 arcmin.
We note that the ratio of the flux density to peak brightness at 150 MHz in Table 3 is 1.4. Such high ratios would normally suggest that the radio source is marginally resolved (see section 4.6 of Intema et al. 2017) and thus is not a viable pulsar candidate. However, as noted in Section 2, some caution is warranted when searching for pulsars as strong scintillation could modulate the flux density during the observations, making such ratios unreliable and in some cases creating radial image artefacts (Frail et al. 2016b) similar to those visible north of the point source in the 150 MHz image of Fig. 6.
4.2.5 Fermi J1728.1−1608
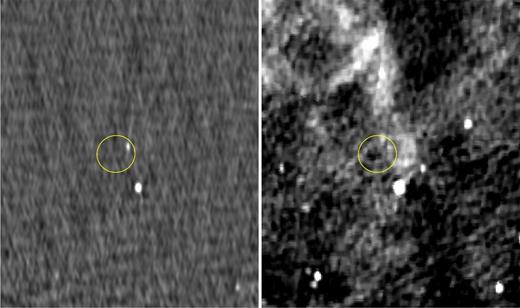
There is an unresolved TGSS ADR1 radio source at 150 MHz within this small Fermi unassociated error ellipse, but only an upper limit on any emission in the NVSS images at 1.4 GHz (Fig. 7). There is no corresponding point source in the VLSSr image at 74 MHz at this location but there is some extended emission 1.5 arcmin to the northeast that has no counterpart in the NVSS or TGSS ADR1 images. Our follow-up VLA observations (Section 3.1) provide a 3σ upper limit at 3.1 GHz of 37 μJy beam−1. The upper limit on the spectral index implied by these limits is α < −2.6.
Fermi J1728.1−1608. (Left) A steep-spectrum pulsar candidate near the centre of a TGSS ADR1 image at 150 MHz. (Right) The same field from the NVSS at 1.4 GHz. The curve indicates the Fermi 95 per cent error ellipse for an unassociated gamma-ray source in this same direction, whose angular size is given in Table 4. The field of view is 11.4 arcmin by 9.6 arcmin.
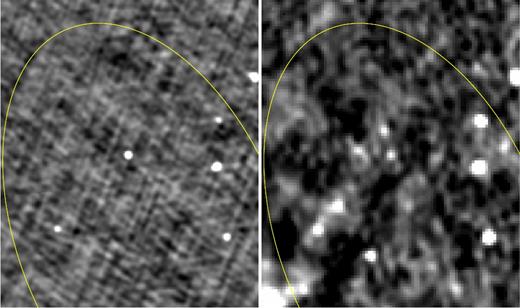
4.2.6 Fermi J1739.3−2530
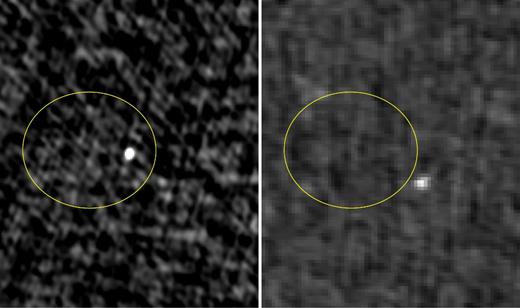
There is an unresolved TGSS ADR1 radio source with a peak brightness at 150 MHz of 131.5 ± 14.8 mJy beam−1 within this small Fermi unassociated error ellipse, but only an upper limit on any emission in NVSS images at 1.4 GHz of <0.3 mJy beam−1 (Fig. 8). Our follow-up VLA observations (Section 3.1) provide only a 3σ upper limit at 3.1 GHz of 70 μJy beam−1. The upper limit on the spectral index implied by these limits is α < −2.5.
Fermi J1739.3−2530. (Left) A steep-spectrum pulsar candidate left of centre in a TGSS ADR1 image at 150 MHz. (Right) The same field from the NVSS at 1.4 GHz. The curve indicates the Fermi 95 per cent error ellipse for an unassociated gamma-ray source in this same direction, whose angular size is given in Table 4. The field of view is 5.8 arcmin by 4.9 arcmin.
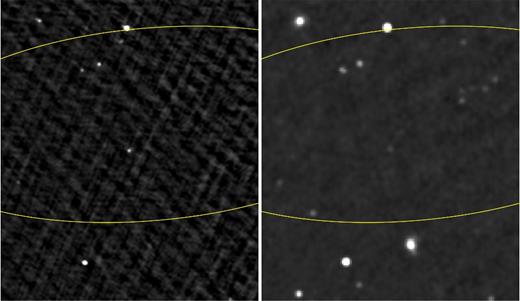
4.2.7 Fermi J1803.1+1400
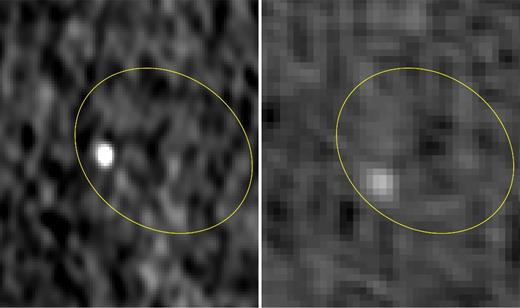
There is an unresolved TGSS ADR1 radio source at 150 MHz within this small Fermi unassociated error ellipse, but only an upper limit on any emission in NVSS images at 1.4 GHz of <0.3 mJy beam−1 (Fig. 9). At this same position on the VLSSr image at 74 MHz, there is a marginal detection with a peak brightness of 275 ± 150 mJy beam−1. Our follow-up VLA observations (Section 3.1) provide only a 3σ upper limit at 3.1 GHz of 72 μJy beam−1. The upper limit on the spectral index implied by these limits is α < −2.2.
Fermi J1803.1+1400. (Left) A steep-spectrum pulsar candidate at the centre of a TGSS ADR1 image at 150 MHz. (Right) The same field from the NVSS at 1.4 GHz. The curve indicates the Fermi 95 per cent error ellipse for an unassociated gamma-ray source in this same direction, whose angular size is given in Table 4. The field of view is 11.4 arcmin by 9.7 arcmin.
4.2.8 Fermi J1833.0−3839
There is a bright TGSS ADR1 source at 150 MHz (St = 303.7 ± 31.8 mJy) near the centre of the Fermi error ellipse but there is no corresponding radio source at this location in the SUMSS image at 843 MHz or the NVSS image at 1.4 GHz (Fig. 10). A conservative two-point α is calculated in Table 3 adopting a 5σ limit of 2.5 mJy at 1.4 GHz. Our follow-up ATCA observations at 2.1 GHz (Section 3.2), giving an upper limit of 0.75 mJy beam−1, suggests a slightly steeper spectral index. A mosaic joint is visible along a diagonal in the TGSS ADR1 image in Fig. 10, a few arcminutes north of the candidate radio source, but it is at the level of the rms noise and appears to have no effect on the flux density measurement.
Fermi J1833.0−3839. (Left) A steep-spectrum pulsar candidate near the centre of a TGSS ADR1 image at 150 MHz. (Right) The same field from the NVSS at 1.4 GHz. The curve indicates the Fermi 95 per cent error ellipse for an unassociated gamma-ray source in this same direction, whose angular size is given in Table 4. The field of view is 11.2 arcmin by 9.5 arcmin.
4.2.9 Fermi J1843.8−3834
This candidate in Fig. 11 is detected strongly in the TGSS ADR1 (St = 470.4 ± 47.8 mJy) and also in SUMSS at 843 MHz (S = 21.1 ± 1.2 mJy) and NVSS at 1.4 GHz (S = 8.6 ± 0.5 mJy). Our follow-up ATCA observations (Section 3.2) show an unresolved source (beam = 13.7 arcsec × 3.7 arcsec) with a peak brightness at 2.1 GHz of 4.14±0.13 mJy beam−1. Based on these four flux densities we recompute the spectral index to be α = −1.79 ± 0.05. The ATCA detection leads to an improved position of R.A. = 18h44m35.77 and δ= −38°40΄50.20 with an uncertainty of ±1.2 arcsec in declination and about a factor of two better in right ascension. The source is included in the GLEAM source catalogue. The spectral index derived from the survey data alone is −1.4 ± 0.4 (Hurley-Walker et al. 2017). If we fit to all the data, including GLEAM (Fig. 12), the spectral index α = −1.68 ± 0.10.
Fermi J1843.8−3834. (Left) A steep-spectrum pulsar candidate near the centre of a TGSS ADR1 image at 150 MHz. (Right) The same field from the NVSS at 1.4 GHz. The curve indicates the Fermi 95 per cent error ellipse for an unassociated gamma-ray source in this same direction, whose angular size is given in Table 4. The field of view is 21.9 arcmin by 18.5 arcmin.
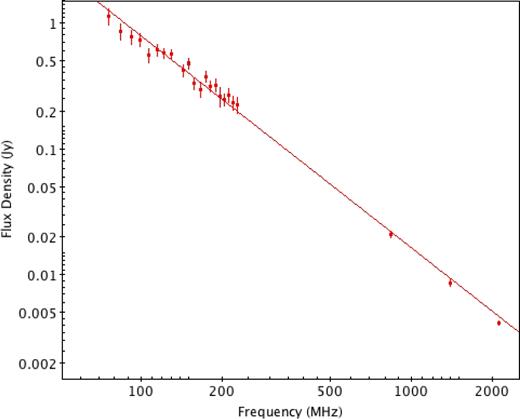
A radio spectrum for pulsar candidate Fermi J1843.8−3834. In addition to TGSS ADR1 flux densities, we include GLEAM, SUMSS, NVSS and ATCA (follow-up) observations. The source is unresolved at arcsecond resolution and has a power-law spectral slope of α = −1.68 ± 0.10.
4.2.10 Fermi J2000.8−0300
This candidate lies near the centre of a moderately large Fermi error circle (Fig. 13). At 150 MHz its flux density is 99.2 ± 13.4 mJy. There is a faint NVSS source at 1.4 GHz with a flux density of 2.3 ± 0.5 mJy. The source is not visible in the VLSSr at 74 MHz with a peak brightness of <315 mJy beam−1. Our follow-up VLA observations (Section 3.1) show an unresolved source (beam = 6.6 arcsec × 3.9 arcsec) with a peak brightness at 3.1 GHz of 660 ±17 μJy beam−1 and a flux density of 0.75±0.03 mJy. A power-law fit to these data gives α = −1.62 ± 0.05. This VLA detection allows us to improve the position over the TGSS ADR1 value to R.A. = 20h00m52.75 and δ = −02°58΄3.5 with an uncertainty of ±0.2 arcsec. There is a weak source in the GLEAM source catalogue at this position. The spectral index derived from the survey data alone is −1.5 ± 1.7 (Hurley-Walker et al. 2017). If we fit to all the available data, including GLEAM, the spectral index α = −1.68 ± 0.10.
Fermi J2000.8−0300. (Left) A steep-spectrum pulsar candidate near the centre of a TGSS ADR1 image at 150 MHz. (Right) The same field from the NVSS at 1.4 GHz. The curve indicates the Fermi 95 per cent error ellipse for an unassociated gamma-ray source in this same direction, whose angular size is given in Table 4. The field of view is 23.6 arcmin by 19.9 arcmin.
5 PULSATION SEARCHES
After the creation of our list of unresolved steep-spectrum candidates (Tables 2 and 3), we encouraged pulsar search teams, including members of the Fermi Pulsar Search Consortium (PSC) to search them for radio and gamma-ray pulsations. The PSC has been doing this with great success using target lists consisting of Fermi LAT unassociated sources with spectra that are similar to the spectra of typical gamma-ray pulsars (Hessels et al. 2011; Kerr et al. 2012; Ray et al. 2013; Camilo et al. 2015; Cromartie et al. 2016). With our new technique, these searches could be expanded to LAT sources with poor localizations or poorly determined spectra that would not otherwise be highly ranked targets (see Section 6). For the gamma-ray pulsation searches (Clark et al. 2017), the precise interferometric positions greatly reduce the parameter space that needs to be covered, significantly improving the sensitivity of the searches. In some cases, new observations were made and in others PSC members had already targeted the Fermi sources associated with our candidates, though we did not know the pulsar nature of any of our sources in advance.
These searches have, so far, resulted in the discovery of 6 ms pulsars and one slow pulsar, as noted in Table 2. The details of those discoveries will be published elsewhere (Clark et al., Ransom et al., Deneva et al., Camilo et al. in preparation),3 as follow up is required to characterize their spin and orbital parameters, and confirm (or not) their identification with the target LAT sources. We include them here as a demonstration of the efficiency of this method for finding pulsars. We note that the data taking and analysis of these searches are not yet complete and more discoveries among our candidate list are likely.
We also observed with a new VLA pulsar observing system, an emerging capability on the VLA that has not been widely used for pulsar searches (Project code 16B-434). The array was in a Move configuration between A and D on the 2017 February 4 and 6. The VLA was operated as a phased array by observing a nearby point source calibrator and tying the wavefront phase corrections to a common antenna near the centre of the array. Phased array data were collected using the real-time pulsar processing backend (YUPPI). We observed in the frequency range of 1-2 GHz (L band) where YUPPI produces spectra with 1 GHz total bandwidth (32 × 32-MHz subbands) with 8-bit samplers in VLBI data interchange format (VDIF). The integration time on each pulsar was typically about 30 min. Pulsar signals were searched using standard pulsar software.
These pulsation searches are summarized in Table 2. In column two, we list whether a gamma-ray pulsation search was carried out (γ) and the names of the telescopes involved in the radio searches. When more than one radio telescope is listed, the telescope that made the discovery is first. A blank entry means no pulsation search has been carried out to date. Column three is a short-hand rating of each Fermi source based on how likely it is to be a pulsar, based on its gamma-ray spectral properties (Camilo et al. 2015). In this scheme, likely pulsars are listed in order of decreasing quality, i.e. psr-A (high), psr-B (good), psr-C (ambiguous), psr-D (poor, but cannot be ruled out), and ‘Unlikely’ to be a pulsar. Detections are given in column four. Initial properties (i.e. gamma-ray pulsations = g, radio pulsations = r, millisecond pulsar = m, and binarity = b) are given along with the pulsar rotation period in parenthesis.
In brief, of the six MSPs, one (PSR J1833−3840) had been discovered in 2015 but is yet unpublished (F. Camilo, priv. comm.). All of the radio pulsars that were discovered were made by the Arecibo Telescope and the Green Bank Telescope (GBT). The VLA confirmed pulsations towards J1555.6−2906 but made no new discoveries on its own. Two MSPs have gamma-ray pulsations, making them firm Fermi identifications (Clark et al. 2017). There are at least three binaries among the MSPs. The initial properties of the remaining MSPs suggest that they too are associated with the Fermi emission but long-term pulse timing is needed to confirm. There is one newly discovered slow, normal pulsar (PSR J1739−2530) that appears to be a nulling pulsar whose slow period suggests that it is likely a line-of-sight coincidence and not a gamma-ray source.
6 DISCUSSION AND CONCLUSIONS
We have described an image-based method for identifying pulsar candidates in radio sky surveys using only two selection criteria: compactness and spectral slope. With follow-up arcsecond imaging we were able to eliminate false positives and define a sample of 16 promising candidates from the 3FGL catalogue and a 7-yr Fermi LAT source list. While these compact, steep-spectrum radio sources within the error ellipses of the Fermi LAT unassociated sources are strong candidates for pulsars, it does not follow that they are gamma-ray-emitting pulsars. An identical search of the same total area but in random directions on the sky, would result in a similar number of candidates. Establishing a firm gamma-ray association requires pulsation searches.
Preliminary pulsation searches of these candidates have found six MSPs and one normal rotation-powered pulsar. Two of the MSPs have confirmed gamma-ray pulsations. The remaining MSPs require further timing before any associations can be definitively claimed. Adding in the recent MSP found towards the Fermi GeV excess near the Galactic centre (Bhakta et al. 2017), the pulsar detection efficiency using this technique is 40 per cent. Based on just the initial finding of four MSPs from the 7-yr Fermi LAT source list, this gives a lower limit of 22 MSPs per 1000 deg2. The success rate exceeds blind surveys with their yield of approximately 1 MSP per 1000 deg2 (Stovall et al. 2014; Bhattacharyya et al. 2016), and it compares favorably with recent pulsation-only searches, which have efficiencies of 15–25 per cent (e.g. Camilo et al. 2015; Cromartie et al. 2016).
This approach is meant to be complementary to standard search methods. Current radio pulsation searches preselect Fermi LAT unassociated sources based on a posteriori knowledge of pulsar properties (Kerr et al. 2012; Camilo et al. 2015; Hui et al. 2015). Criteria require that the gamma-ray sources are non-variable and that they have pulsar-like spectra (i.e. power laws with high-energy exponential cutoffs). Practical considerations also require that the position uncertainty of the Fermi source is small enough to fit within a single beam of radio dishes. Typically, this implies semimajor axes 0.1° or less, depending on the search frequency (Cromartie et al. 2016; Deneva et al. 2016). A final selection criterion, common in the most recent radio pulsation searches, is to select only high latitude Fermi unassociated sources (|b| > 5°). As the high yield of discoveries demonstrates, this is an optimal strategy for finding MSPs but it largely misses young pulsars with their smaller scale height confining them to the Galactic plane. While Fermi has detected many young gamma-ray pulsars in the plane, the majority have not been strong radio emitters (Abdo et al. 2013; Clark et al. 2017). It has been argued by Camilo et al. (2012) and others that the lack of radio pulsations among these unassociated sources may be due to more narrowly beamed radio emission pointed away from our line of sight (see Rookyard et al. 2017). They further argue that the majority of young pulsars have already been found in past large area radio surveys.
The pulsar candidates here have been selected without regard to their high-energy properties, the sizes of the error ellipses or the sky distribution of the unassociated sources. Ignoring the high-energy properties, at least initially, maximizes our opportunity for identifying outliers, e.g. the pulsar whose power-law spectrum breaks outside the Fermi energy band, the glitching or transitional pulsar with a time-variable light curve (e.g. Stappers et al. 2014). This means that the candidate list can provide a useful check on the efficacy of existing selection processes for pulsation searches.
This method makes no pre-selection based on Galactic latitude. Of the 16 candidates in Table 2, 8 have |b| < 5°. None of these candidates would be considered radio quiet (Camilo et al. 2012). We can extrapolate their spectra to 1.4 GHz and predict phase-averaged flux densities at least a factor of 10 or more above the formal definition of a radio quiet pulsar S1.4 < 30 μJy. These may be MSPs that have been biased against in radio pulsation search samples. We note that that the two new MSPs discovered from Paper I and the discovery of an MSP towards the Galactic centre are all at low latitudes (Bhakta et al. 2017; Clark et al. 2017). Some of the remaining low-latitude candidates may also be young pulsars that have been missed in past Galactic plane searches. In these instances since we know their positions and their phase-averaged flux densities, they may be targeted for more extensive searches at higher frequencies where the effects of absorption, dispersion, and scattering are much reduced.
As noted above, we are not restricted to small error ellipses. Half of the candidates in Table 4 have semimajor axes larger than 0.1°. They would be prohibitively time intensive to search for pulsations. Identifying a compact, steep-spectrum candidate with a localization of a few arcseconds within these large error ellipses increases the pulsation search efficiency and it enables deep searches for other multiwavelength counterparts.
The gamma-ray properties of this sample are also illustrative. In column four of Table 2, we give a ranking that each Fermi source is likely to be a pulsar, based on its gamma-ray spectral properties (see section 5 and Camilo et al. 2015). These classifications are based on visual inspection of the Fermi spectra looking for pulsar-like characteristics that include little excess low-energy emission, peak significance in the 1 to 5 GeV range, and a sharp high energy cut-off with minimal emission above 10 GeV. Among those candidates selected using the radio image-based method, there is a preponderance of sources whose gamma-ray spectra are rated as ambiguous, poor, or unlikely pulsar candidates. There appear to be three main reasons for these low rankings; low signal-to-noise spectra (i.e. low TS), significant emission above 10 GeV, and spectra that deviate very little from a strict power-law. For the two 3FGL MSPs, machine-learning algorithms have independently confirmed that these would be low-ranked pulsar candidates based on their gamma-ray properties alone sxy+16. We have taken the list of 3FGL unassociated sources from Saz Parkinson et al. (2016) for which two independent classifiers mark them as pulsar candidates, removed all recent newly discovered gamma-ray pulsars, and rank-ordered them by classifier scores. 3FGL J1827.6−0846 does slightly better, falling in the bottom half (random forest) or the bottom third logistic regression) of candidates, while 3FGL J1901.5−0126 lies in the last decile. In both cases the algorithms classify these MSPs as young pulsars.
The discovery of new pulsars in sources with non-pulsar-like gamma-ray properties implies that the pulsar discovery space using Fermi is larger than previously thought. It may also indicate that the gamma-ray only selection process has biased the known population of gamma-ray pulsars, and that expanded search methods may broaden the range of physical parameters that currently describe the gamma-ray pulsar population. Finally, these results make clear that, while gamma-ray spectral and variability properties are certainly instrumental in determining quality pulsar candidates, multiwavelength techniques provide an alternative, and hitherto underutilized source selection method.
Although encouraging, this image-based method is not without its shortcomings. A number of problems were discussed in Section 2 with using radio surveys for identifying pulsar candidates. Additional data, such as follow-up high resolution imaging can be used but false positives have not been entirely eliminated from this sample. We have used the ATCA and VLA imaging to eliminate extended HzRGs but with a typical resolution of 5 arcsec, we are only sensitive to structures at high redshift larger than 25 kpc. Approximately 30 per cent of well-studied HzRGs have more concentrated morphologies (Pentericci et al. 2000), i.e. their total angular extent is less than 5 arcsec.
Fortunately, existing and future metre and centimetre wavelength radio interferometers can improve on the deficiencies of this sky-surveys approach. The wide instantaneous bandwidths of today's interferometers can measure a spectral index at many different frequencies simultaneously without variability issues or systematic calibration errors between surveys (Rau, Bhatnagar & Owen 2016). This capability is nicely illustrated by the GLEAM spectra for Fermi J1843.8−3834 (Fig. 12). The long baselines of GMRT, LOFAR, and VLA can make wide-field images at arcsecond resolution, measuring compactness directly. Polarization can serve as an additional discriminant, and it may be possible to identify candidates based on their diffractive scintillations as measured in variance images (Dai et al. 2016). Even with these improvements, image-plane searches will never supplant direct pulsation searches nor are they meant to. This complementary approach should be used in special directions where enhanced scattering may be expected, such as the GeV excess or the Galactic plane in general. Alternatively, it may be worthwhile to image those Fermi sources ranked as highly significant pulsar candidates (Mirabal et al. 2016; Saz Parkinson et al. 2016) but with previous (unsuccessful) pulsation searches, in case a tight binary or similarly exotic pulsar is hiding among the sample.
Acknowledgements
We thank the staff at ATCA and the VLA for their generous allocation of Director's Discretionary Time. The National Radio Astronomy Observatory is a facility of the National Science Foundation operated under cooperative agreement by Associated Universities, Inc. The Australia Telescope Compact Array is part of the Australia Telescope National Facility which is funded by the Australian Government for operation as a National Facility managed by CSIRO. Fermi work at NRL is supported by NASA. The Fermi LAT Collaboration acknowledges generous ongoing support from a number of agencies and institutes that have supported both the development and the operation of the LAT as well as scientific data analysis. This work was performed in part under DOE Contract DE-AC02-76SF00515. Additionally, the LAT includes support from the National Aeronautics and Space Administration and the Department of Energy in the United States, the Commissariat à l'Energie Atomique and the Centre National de la Recherche Scientifique/Institut National de Physique Nucléaire et de Physique des Particules in France, the Agenzia Spaziale Italiana and the Istituto Nazionale di Fisica Nucleare in Italy, the Ministry of Education, Culture, Sports, Science and Technology (MEXT), High Energy Accelerator Research Organization (KEK) and Japan Aerospace Exploration Agency (JAXA) in Japan, and the K. A. Wallenberg Foundation, the Swedish Research Council and the Swedish National Space Board in Sweden. Additional support for science analysis during the operations phase is gratefully acknowledged from the Istituto Nazionale di Astrofisica in Italy and the Centre National d’Études Spatiales in France. This research has made use of NASA's Astrophysics Data System Bibliographic Services. This work has also made extensive use of the SIMBAD and Vizier data bases maintained by the Centre de Données astronomiques de Strasbourg.
Facilities: ATCA, Fermi (LAT), VLA.
Footnotes
See also the WVU Galactic Millisecond Pulsar List (http://astro.phys.wvu.edu/GalacticMSPs/) and the Public List of LAT Detected Pulsars ( https://confluence.slac.stanford.edu/display/GLAMCOG/Public+List+of+LAT-Detected+Gamma-Ray+Pulsars).
REFERENCES
