Article

Asymmetric Firing Rate from Crayfish Left and Right Caudal Photoreceptors Due to Blue and Green Monochromatic Light Pulses

by
Juan C. Sánchez-Hernández
1,
José Agustín Pacheco-Ortiz
1,
Leonardo Rodríguez-Sosa
2,*,
Gabina Calderón-Rosete
2 and
Edgar Villagran-Vargas
3
1
Facultad de Ciencias, Universidad Autónoma del Estado de México, Toluca 50200, México
2
Departamento de Fisiología, Facultad de Medicina, Universidad Nacional Autónoma de México, Ciudad de México 04510, México
3
Universidad De La Salle Bajío, León 37238, México
*
Author to whom correspondence should be addressed.
Symmetry 2018, 10(9), 389; https://doi.org/10.3390/sym10090389
Submission received: 24 July 2018 / Revised: 28 August 2018 / Accepted: 31 August 2018 / Published: 8 September 2018

Abstract

:
Recent studies have postulated that the left and right caudal photoreceptors (CPR-L and CPR-R, respectively) of the crayfish show asymmetry of spontaneous activity in darkness and responses induced by white light. Two photopigments have been identified; the first one sensitive to blue light and the second one sensitive to green light. This study explores blue and green monochromatic light responsiveness with respect to both CPR-L and -R, as well as the effects of temperature on these photoreceptors. We performed simultaneous extracellular recordings of the firing rate of action potentials from CPRs of the crayfish Cherax quadricarinatus (n = 12). At room temperature (24 ± 1 °C), CPR-L and -R showed a significant difference in the spikes from most of the comparations. CPRs in the dark exhibited spontaneous asymmetric activity and displayed sensitivity to both monochromatic light sources. CPR responses were light intensity dependent within a range of 1.4 logarithmic intensity units, showing approximately 0.5 logarithmic intensity units more sensitivity to blue than to green light. The CPRs displayed an asymmetrical response to both colors by using a constant light intensity. At 14 (±1) °C, activity in darkness diminished while asymmetry persisted, and the CPRs improved responses for both monochromatic light sources, displaying a significant asymmetry. Here, we provide additional evidence of the asymmetric activity in darkness and light response from the CPRs. The new data allow further investigations regarding the physiological role of caudal photoreceptors in the crayfish.

1. Introduction

This study addresses the physiology of caudal photoreceptor in crayfish, as model preparation for the analysis of neuronal control mechanisms of circadian rhythmicity and photoreception by light-sensitive non-visual neurons [1,2]. Natural fluctuations of light and darkness modulate the physiology and behavior of crustacean decapods. Illumination during the day varies ~9 logarithmic intensity units [3]. Aquatic organisms, for instance, receive a proportion of blue and green light which depends on the distance from the surface water [4]. Freshwater crayfish are a suitable model to study the functional role of three photo-sensitivity systems: (1) in the retina, (2) non-visual photoreceptors in the supraesophageal ganglion (brain), and (3) caudal photoreceptors in the sixth abdominal ganglion (AG) [1,5,6,7].
This study focuses on caudal photoreceptor light responsiveness from both left and right (CPR-L and CPR-R, respectively) anatomic sides. The CPR is a primary photosensitive neuron, one for each side of the sixth AG [8,9]. The axon of the CPR projects from this ganglion to the brain [10]. This photosensitive neuron discharges spontaneous action potentials in darkness and a phasic-tonic activity in direct response to higher illumination levels. It also acts as an interneuron that receives synaptically mechanosensory input from the crayfish tail [8,9]. In some crustaceans from marine and freshwater sites, these photosensitive neurons also show similarities in their light responsiveness [11]. Furthermore, the firing rate of spikes from the CPR can be related to properties of a pacemaker [8,12]. In crayfish, prior studies have suggested that the CPR also has a functional role in the circadian system [1,2,7].
The underlying phototransduction occurs in CPR dendrites [9,13]; other results have shown only partial knowledge regarding this phototransduction mechanism [14,15]. Additional studies have suggested the specificity for color light sensitivity of the CPR from diverse species of freshwater crayfish, performed at different temperatures. For example, the CPR did not respond to red light at 17 to 19 °C [16]. Stimulation with green (546 nm) monochromatic light caused a higher discharge of action potentials from the CPR at 20 to 25 °C [17]. Simultaneous recordings from both caudal photoreceptors, by stimulating with green light (502 nm), led to a slightly faster response for CPR-L than -R, at 15 to 18 °C [18]. Other results have illustrated light-induced activity from the CPR by using a cold white light lamp (light emitting diode), which emitted light with two peaks: blue (446 nm) and green (557 nm) [19]. Kingston and Cronin [20] identified two visual opsin proteins in the crayfish P. clarkii. The short-wavelength-sensitive (SWS) opsin from blue light (440 nm), and the long-wavelength-sensitive (LWS) opsin from green light (530 nm). Both opsins are located in the sixth abdominal ganglion, and hence it has been postulated that these opsins participate in photoreception from the CPR [20,21]. The absorption properties of the light wavelength of the photopigments depend on their opsins [22,23].
Left–right asymmetry is a characteristic of the brain from vertebrate species and some invertebrate species [24], which arises from embryogenesis in the organism [25,26,27]. Crustacean decapods showed the left and right asymmetry in some anatomical regions [28,29,30]. Besides, some functional properties are asymmetric, as examples, lateral movement towards escape direction in shrimp [29], and the performance of limbs during aggressive behavior of crayfish [30]. The sixth AG develops from two embryonic neuromeres in the crayfish Procambarus clarkii [31,32]. The CPR-axons are in the ventral of cord, one fiber into Wiersma area 82 of the left hemicord, and another fiber in region 79 on the right hemicord, of the cord map of the crayfish [33]. Moreover, the CPR response is asymmetric from lateralized water movements, the ipsilateral CPR is excited, and the contralateral CPR is inhibited [9]. The CPRs seem to code this directionality, and it is likely that they contribute to a turning response in crayfish [10]. A recent study suggests that the left and right caudal photoreceptors show asymmetry in spontaneous action potential discharge in the darkness, as well as with respect to their white light-induced response. In the dark, most (70%) of the CPR-L showed an activity higher that CPR-R. Furthermore, a pulse of white light (700 Lux, 4 s) causes in most (70%) of the CPR- R showed a higher response than the CPR-L. In both conditions, the difference was significant. Moreover, a differential effect of temperature on CPRs activity from the crayfish Cherax quadricarinatus was also noted [34].
This study focusses on the crayfish caudal photoreceptor as a model to obtain further understanding of the photoreceptor functions. Responsiveness to blue and green monochromatic light pulses from both CPR-L and CPR-R are determined because these extra-retinal photoreceptors possess both photopigments. The effects of temperature on these processes are also analyzed.

2. Materials and Methods

2.1. Animals

Adult freshwater crayfish Cherax quadricarinatus (n = 12) of weights 30–40 g, and carapace of lengths 11–13 cm from the rostrum to telson were used for analyses. Animals were acquired from a local provider and maintained in the laboratory in aerated water containers for two weeks prior to experiments, with 12:12-h light–dark cycles, using white light of 560 Lux intensity. Animals had free access to vegetables and dried fish as food.

2.2. Extracellular Recordings

Electrophysiological experiments were performed following a previously described procedure [34]. Briefly, we isolated the abdominal ganglia chain from the crayfish under ice-cold conditions, with a modified physiological saline Van Harreveld (VH) solution [35], (205 mM NaCl, 5.4 mM KCl, 2.6 mM MgCl2, 13.5 mM CaCl2, and 10 mM HEPES), and pH to 7.4. We dissected in the isolated sixth AG some nerve bundles between the fifth and sixth AG using a stereoscopic microscope. Then, the biological preparations were transferred to the recording chamber mounted on a microscope (SMZ800, Nikon, Tokyo, Japan) with VH saline solution perfusion (~1 mL/min) in the dark. The sixth AG was typically maintained at room temperature 24 (±1) °C. For some experiments, these ganglia were stabilized at 14 (±1) °C by supplying water from a temperature-regulated bath. As shown in 
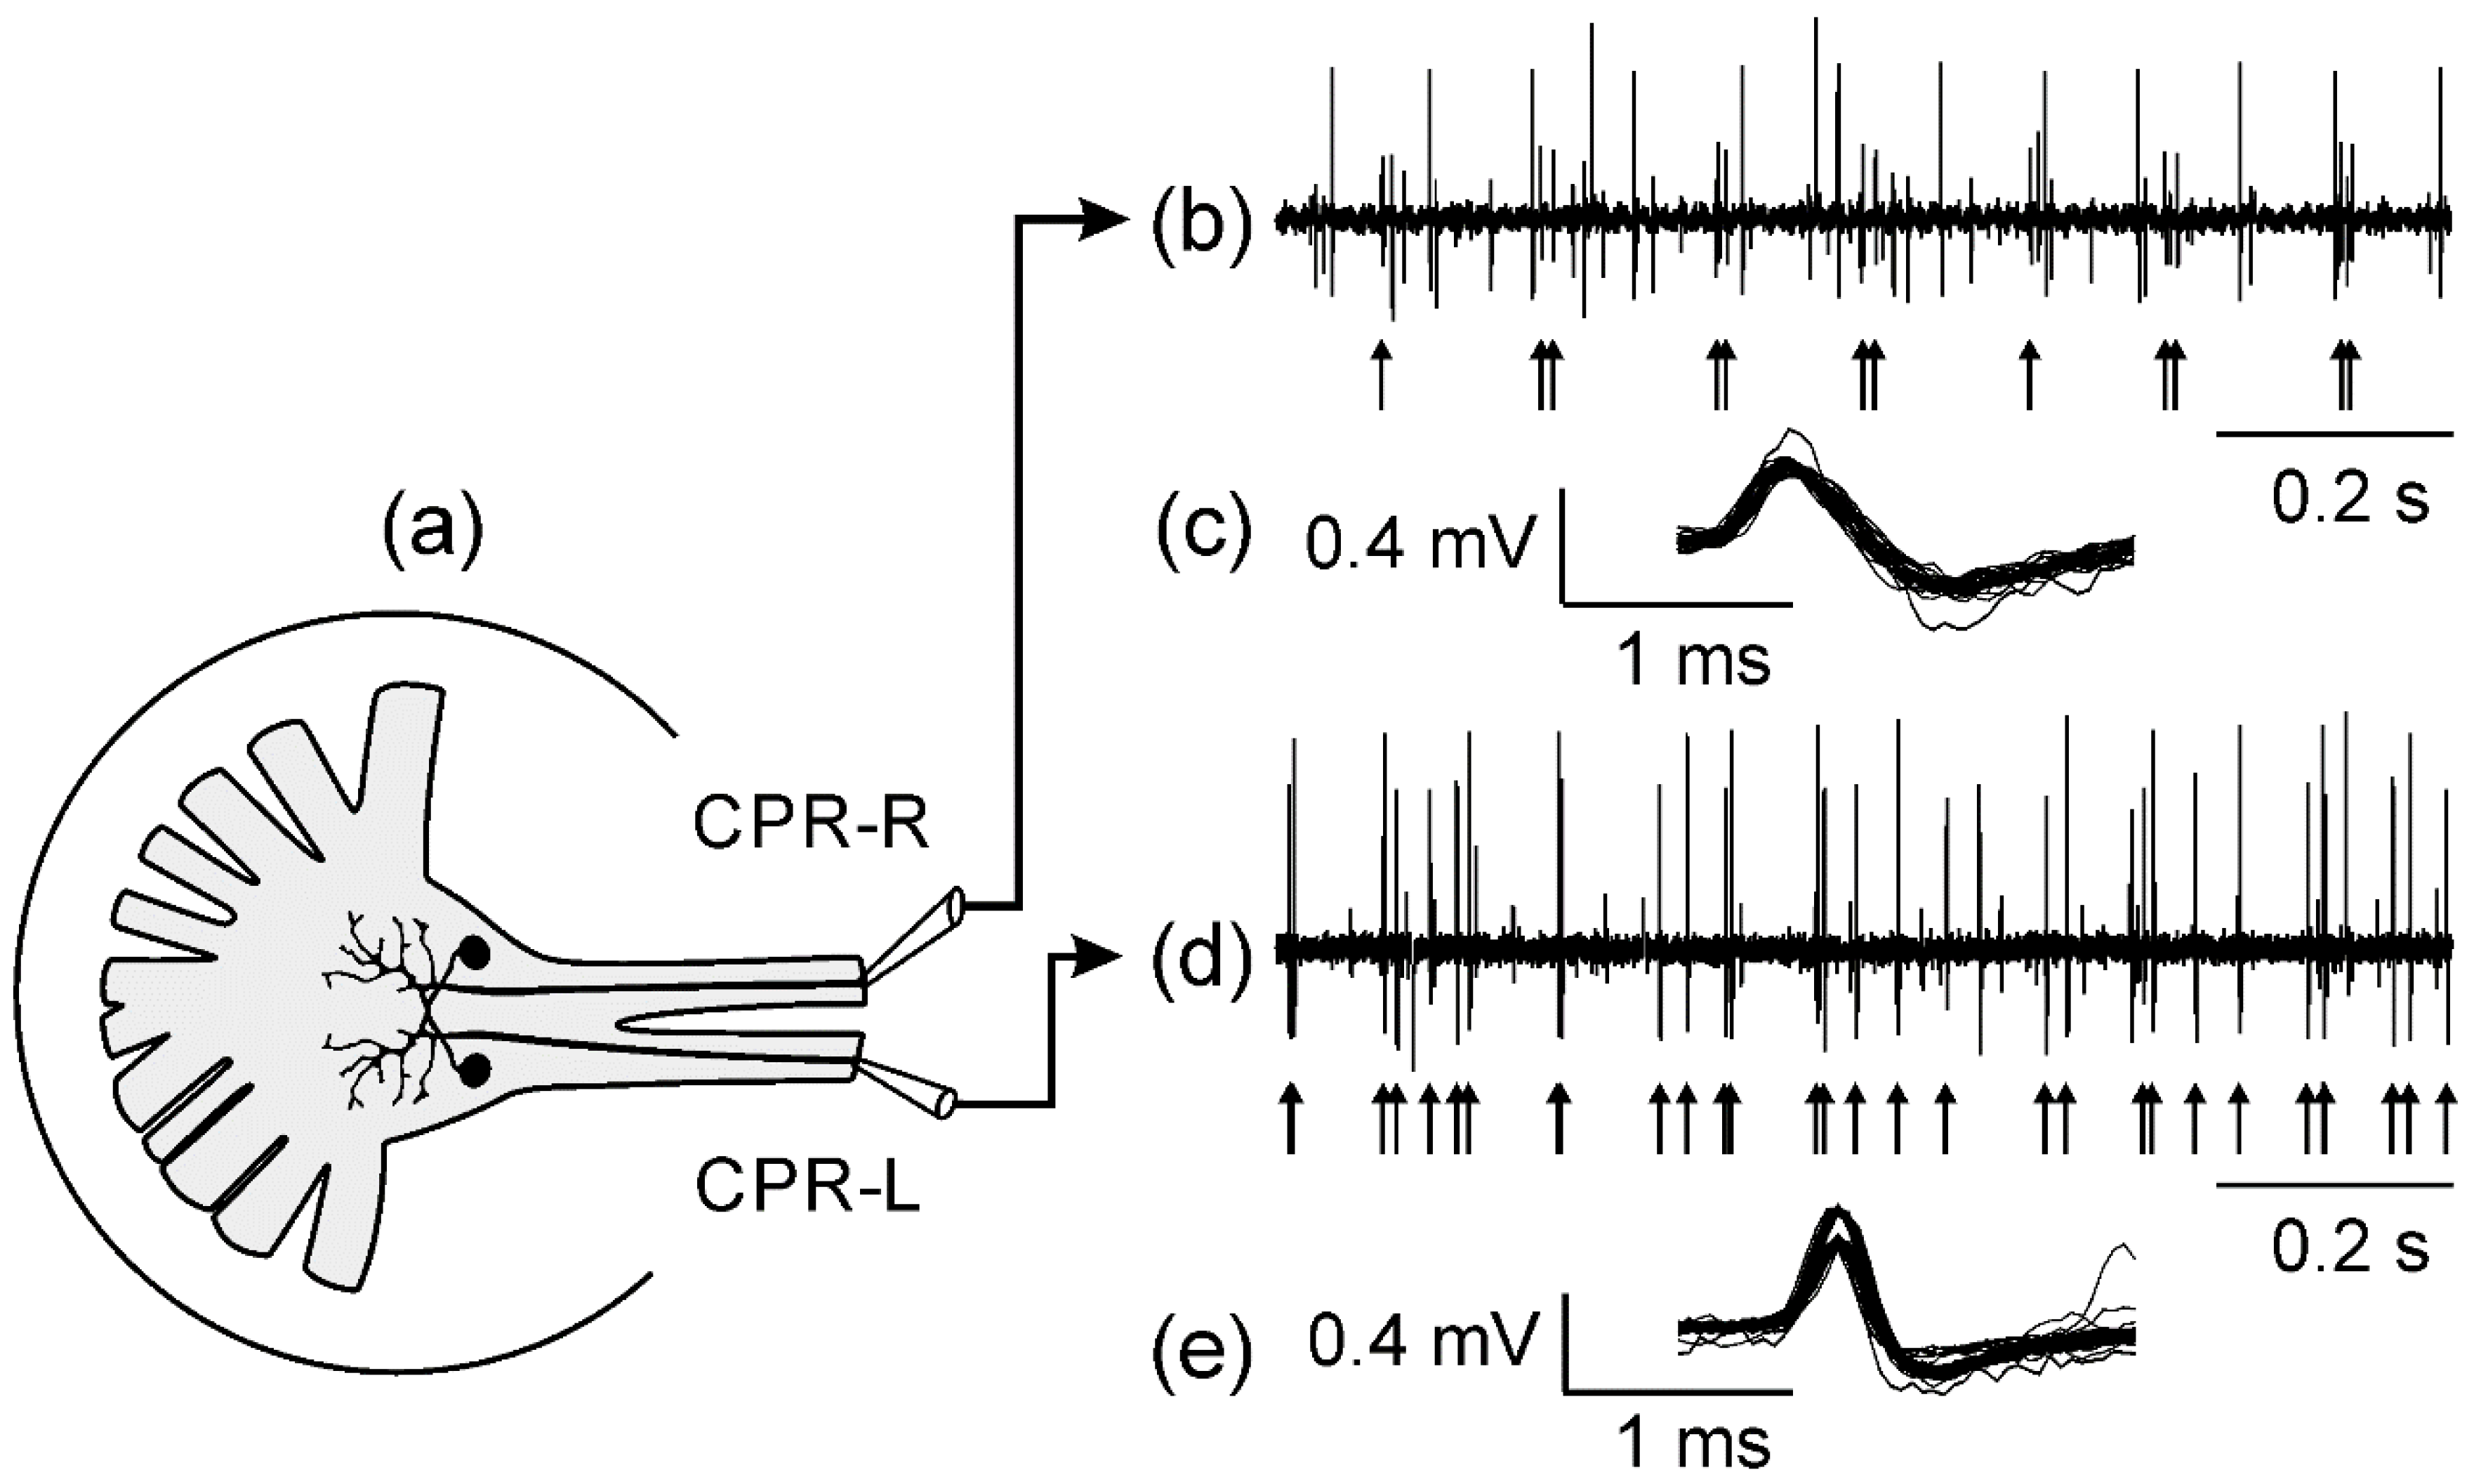
Figure 1a, extracellular recordings were performed with suction electrodes filled with the saline solution of VH, with these electrodes being positioned on the right and left hemicord, respectively, and the reference electrode (Ag-AgCl) placed in the bath solution. We acquired signal recordings by using AC amplifiers (EX1, Dagan MN, USA) filtered at 30 Hz to 10 kHz with a band-pass filter system, and displayed on an oscilloscope (TDS460, Tektronix, OR, USA).
As described earlier, the CPR photoresponse is dependent on light intensity and the time of day [1]. We performed the experiments from 11:00 a.m. to 2:00 p.m. We triggered light pulses using a photostimulator (PS33, Grass, RI, USA), which produced white incandescent light; by using color filters (Grass) for blue (λmax = 485 nm) and green light (λmax = 530 nm). The blue light intensity ranged from 13.96 to 14.71 (log photons/cm2/s), and for green light 14.37 to 15.35 (log photons/cm2/s). We calibrated the wavelength and light intensity output using a spectroradiometer (Acton Research Corporation, CA, USA) and a light meter (Coherent, model FieldMax II, CA, USA), respectively. Electrophysiological recordings were sent to a computer using Spike2 software and a Micro-1401 AD board (CED, Cambridge, UK). The sorting spikes were made off-line by the Spike2 software, which studied differences in waveform, amplitude, and duration for separating spikes from different putative neurons, and their temporal firing rate in response to the light stimulus.

2.3. Statistical Analysis

The CPRs showed spontaneous activity, determined as the firing rate of action potentials per second (FRSAD) and here described with mean, median values, and interquartile range (IQR). CPR response to monochromatic light pulses was expressed as the variation in the frequency of action potentials per second (ΔF (impulses/s)), subtracting the mean value of its spontaneous activity in the dark (see Equation (1)).
ΔF (impulses/s) = FRP (impulses/s) − FRSAD (impulses/s)
The CPR photoresponse was determined for the following 10 s with respect to light pulses, with means and standard deviations being calculated, as well as median values and their IQR. We analyzed CPR firing rate spikes and the parameters: amplitude, time to peak, and duration of the recorded action potentials. We analyzed data normality using Shapiro–Wilk test (S–W-test) or Kolmogorov–Smirnov test (K–S-test). To compare the differences from data of the CPR-L and the CPR-R, we employed the independent two-sample t-test, with equal variance not assumed (Welch correction). For those parameters that did not follow a normal distribution, we used nonparametric statistical test. Thus, we compared the firing rate of the spontaneous activity (impulses/s), and the photoresponse ΔF (impulses/s), between left and right CPR activities for two samples, according to the Mann–Whitney U-test. Statistical significance was determined as p < 0.05, using Origin software (OriginLab, Northampton, MA, USA).

3. Results

3.1. Spontaneous CPR Activity in Darkness

We describe the spontaneous firing rate from CPRs in a group of isolated ganglions (n = 9) adapted for approximately 20 min in darkness, at 24 (±1) °C. Figure 1 shows typical multiunit activity from continuous electrophysiological recordings from the right and left hemicord (see Figure 1a,b,d). CPRs spikes had biphasic extracellular potentials, positive-negative shapes and different amplitude, (see Figure 1c,e). In addition, both CPR-L and -R showed tonic firing rates which were asymmetric (see Figure 1b,d).
From recordings observed in the averaged potentials (Figure 1c,e), Table 1 and Table 2 shown data analysis for these electrophysiological parameters. Comparing the CPR-L and CPR-R showed significant differences in the amplitude peak to peak (mV), the time to peak (ms), and duration (ms).
We also organized data for analysis in bins of one second, and computed in one minute, showing two subgroups of CPRs. In one subset of six ganglia, we performed 24 recordings in which CPR-L had a spontaneous firing rate K–S-test for normality test was 0.02, p < 0.0001. The CPR-R showed spontaneous activity with K–S-test for normality test was 0.02, p < 0.0001. The nonparametric test showed for the CPR-L a median of 14 (IRQ = 7) impulses/s and CPR-R had a median of 12 (IRQ = 5) impulses/s. The pairwise comparison of the Mann–Whitney U-test was significant; Z = 17.59, p < 0.001. In another subgroup of five ganglia, we carried out 20 determinations in which CPR-R had a spontaneous firing rate K–S-test for normality test was 0.10, p < 0.0001. The CPR-L showed spontaneous activity with K–S-test for normality test was 0.14, p < 0.0001. The nonparametric test showed for the CPR-Ra median of 13 (IRQ = 8) impulses/s, and CPR-L had a median of 7 (IRQ = 10) impulses/s. The pairwise comparison of the Mann–Whitney U-test was significant; Z = −25.92, p < 0.001 (see Figure 2).

3.2. Spontaneous Activity of CPRs at Lower Temperature

To analyze the effect of temperature, we first assayed the spontaneous discharge of action potentials in the darkness in a saline bath at room temperature, and then lowered to a temperature of 14 (±1) °C. Figure 3 shows how CPRs decreased spontaneous activity at lower temperatures; they also maintained their asymmetrical firing rate. In one subset of seven ganglia (Figure 3a), we performed 28 determinations, with CPR-L having a spontaneous firing rate K–S-test for normality test was 0.23, p < 0.0001. The CPR-R showed spontaneous activity with K–S-test for normality test was 0.10, p < 0.0001. The nonparametric test showed for the CPR-L a median of 10 (IRQ = 4.75) impulses/s, and CPR-R a median of 8 (IRQ = 7) impulses/s. This difference in medians corresponds to 20%. The pairwise comparison of the Mann–Whitney U-test was significant; Z = 12.13, p < 0.001.
For another subgroup of eight ganglia (Figure 3b), we performed 32 determinations, with CPR-R showing spontaneous activity K–S-test for normality test was 0.10, p < 0.0001. The CPR-L showed spontaneous activity with K–S-test for normality test was 0.10, p < 0.0001. The nonparametric test statically showed for the CPR-R a median of 11 (IRQ = 6) impulses/s, and CPR-L having a median of 9 (IRQ = 5) impulses/s. This difference in medians corresponds to 18%. The pairwise comparison of the Mann–Whitney U-test was significant; Z = −21.64, p < 0.001.

3.3. Response from CPRs to Monochromatic Blue Light at Room Temperature

CPR responses showed a sustained train of spikes (see the Figure 4a,b). The latencies are dependent on light intensities, and we also observed other differences between left and the right caudal photoreceptors. For light intensities ≤14.35 (log photons/cm2/s), CPR-L showed latencies of 0.90 (±0.16) s, and CPR-R was 2.44 (±0.47) s. Pairwise comparison of the Mann–Whitney U-test was significant; Z = −2.16, p < 0.05. For light intensity of 14.71 (log photons/cm2/s), the latencies had a mean of 0.70 (±0.20) s for CPR-L, and of 0.98 (±0.43) s for CPR-R. CPR-R showed latencies from 2.44 to 0.98 s, depending on the intensities. The pairwise comparison of the Mann–Whitney U-test was significant; Z = 2.16, p < 0.05.
CPRs also took a specific amount of time to reach a peak of photoresponse which was dependent on light intensity. With intensities ≤14.35 (log photons/cm2/s), the time to reach the peak had a mean for CPR-L of 5.16 (±0.47) s, and the CPR-R was 5.34 (±0.29) s. For intensity 14.71 (log photons/cm2/s) the time for reaching a peak had a mean of 3.31 (±0.49) s for the CPR-L, and this time was approximately 4.81 (±0.61) s for CPR-R. The pairwise comparison of the Mann–Whitney U-test was significant; Z = −2.16, p < 0.05. These activities continued throughout the illumination pulse, when the light was turned off, and gradually decreased until reaching the basal firing rate in about two minutes.
Variation in frequency of action potentials per second (ΔF) during 10 seconds from the CPRs depends on the light intensities in the range of approximately one unit logarithmic employed in our experiments. Figure 4c shows an initial peak with a ΔF = 6 to 11 impulses/s from the CPRs, for a light intensity of 13.96 (log photons/cm2/s). The photoresponse from CPR-L is about 0.2 logarithmic units more responsive than that of CPR-R, with higher intensities tested (n = 3 to 4) from a subgroup of two ganglia.
In another subgroup of two ganglia, the CPR-R showed a significant photoresponse regarding the CPR-L for a higher light intensity pulses tested (n = 2 to 4) (see Figure 4d).
CPR photoresponse induced by blue light from two subgroups of isolated sixth AG adapted to darkness for 20 min at 24 °C. From recordings observed in the averaged potentials. Table 3 and Table 4 shown data analysis for these electrophysiological parameters. Comparing the CPR-L and CPR-R showed significant differences in the amplitude peak to peak, the time to peak and duration.
CPRs also showed asymmetric light responsiveness at a constant intensity of blue light (14.71 log photons/cm2/s). Determined in the first 10 seconds, showing two subgroups of ganglia. In one subgroup of two biological preparations, we performed four determinations. The firing rate for the CPR-L S–W-test for normality test was 0.90, p < 0.01. For CPR-R showed firing rate with S–W-test for normality test was 0.92, p < 0.05. The CPR-L showed a greater photoresponse, compared to CPR-R (see Figure 5a). CPR-L had a ΔF with a median of 39 (IRQ = 27) impulses/s, and CPR-R had a median of 28 (IRQ = 18) impulses/s. The pairwise comparison of the Mann–Whitney U-test was significant; Z = 2.95, p < 0.01.
For another subgroup of two ganglia, we performed three determinations; The firing rate for the CPR-R S–W-test for normality test was 0.97, p > 0.05. For CPR-L showed firing rate with S–W-test for normality test was 0.97, p > 0.05. CPR-R had slightly higher light responsiveness than CPR-L (see Figure 5b). The latency for CPR-R was 1.59 (±0.48) s, and for CPR-L was 1.43 (±0.47) s. Time to reach a peak had a mean for CPR-R of 4.88 (±0.82), and for CPR-L was 5.16 (±0.50) s. Furthermore, CPR-R had a median of 14 (IRQ = 16) impulses/s, and CPR-L had a ΔF with a median of 9 (IRQ = 10) impulses/s. The pairwise comparison of the two-sample t (48) = −2.30, p < 0.05.

3.4. Response from CPRs to Monochromatic Blue Light at Lower Temperature

In a group of eight ganglia, we studied blue light-induced activity at a lower temperature of 14 (±1) °C. Data analysis of the photoresponse of the left and right CPRs from the first 10 seconds showed two subgroups of ganglia. In a subgroup of five biological preparations, we performed 10 determinations, with CPR-L showing a significant photoresponsiveness, compared to CPR-R (see Figure 6). The latency for the CPR-L was 1.24 (±0.15) s, and for CPR-R was 2.26 (±0.98) s. Pairwise comparison of the Mann–Whitney U-test was significant; Z = −2.34, p < 0.05. CPRs had short latencies at 24 (±1) °C. Time to reach a peak had a mean for CPR-L of 5.48 (±1.56), and 5.81 (±1.32) s for CPR-R. For CPR-L, this parameter was slower at 14 °C than at 24 °C. The firing rate for the CPR-L K–S-test for normality test was 0.09, p > 0.05. For CPR-R showed firing rate with K–S-test for normality test was 0.09, p > 0.05. Furthermore, CPR-L had a firing rate with a median of 25 (IRQ = 33) impulses/s, and CPR-R had a median of 15 (IRQ = 20) impulses/s. The pairwise comparison of two-sample t (177) = 4.14, p < 0.001 (see Figure 6a).
In another subgroup of the three ganglia, we carried out six determinations, with light-induced activity from CPR-R being slightly higher regarding photoresponse than for CPR-L. The latency for CPR-R was 1.02 (±0.28) s, and for CPR-L was 1.26 (±0.40) s. CPR-R had shorter latencies at 24 (±1) °C. Time taken to reach a peak had a mean of 3.52 (±1.10) for CPR-R, and 3.92 (±1.23) seconds for CPR-L. It was faster at 14 °C than at 24 °C. The firing rate for the CPR-R K–S-test for normality test was 0.14, p > 0.05. For CPR-L showed firing rate with K–S-test for normality test was 0.14, p > 0.05. Furthermore, CPR-R had a median of 40 (IRQ = 20) impulses/s, and CPR-L had a firing rate with a median of 36 (IRQ = 17) impulses/s. The pairwise comparison of the two-sample t (112) = −2.10, p < 0.05 (see Figure 6b).

3.5. Response of CPRs to Monochromatic Green Light at Room Temperature

We recorded green light-induced activity from CPRs in a group of seven ganglia at 24 (±1) °C adapted to darkness for 20 min. The monochromatic green light pulses (4 s) cause a sustained train of spikes from CPR-L and -R (see Figure 7a,b). Again, CPRs gradually recovered basal activity in two minutes. Moreover, for intensities ≤ 14.36 (log photons/cm2/s), latency for CPR-L was 1.79 (±1.19) s and 2.01 (±0.65) s for CPR-R. For an intensity of 15.35 (log photons/cm2/s), the latency had a mean of 0.82 (±0.36) s for CPR-L, and of 1.06 (±0.32) s for CPR-R. Besides, CPR-L showed short latencies from 1.79 to 0.82 s depending on light intensities. The pairwise comparison of the Mann–Whitney U-test was significant; Z = 2.33, p < 0.05. Time to reach peak activity was also dependent on light intensities; for ≤14.36 (log photons/cm2/s), this time had a mean for CPR-L of 5.12 (±0.29), and for CPR-R was 5.16 (±0.45) s. For an intensity of 15.35 (log photons/cm2/s), the time to peak had a mean of 3.81 (±0.83) seconds for CPR-L, and of 5.14 (±1.27) seconds for CPR-R. CPR-L showed a time to peak of 5.12 to 3.81 s, depending on intensities. The pairwise comparison of the Mann–Whitney U-test was significant; Z = 2.08, p < 0.05.
As for results of the averaged potentials, Table 5 and Table 6 show data analysis for these electrophysiological parameters. Comparing the CPR-L and CPR-R showed significant differences in the amplitude peak to peak, the time to peak and duration.
We also observed in a subgroup of two ganglia that the variation in the frequency of action potentials per second (ΔF) computed for 10 seconds from the CPRs depends on the light intensities in the range of about one logarithmic unit used in our experiments (n = 4). In one subset where the CPR-L showed a higher photoresponse, data analysis for normality with Shapiro–Wilk test showed the following results: from the CPR-L for light intensity of 14.75 (log photons/cm2/s): was 0.96, p > 0.05. For the CPR-R was 0.96, p > 0.05. The CPR-L had a firing rate with a median of 19 (IRQ = 19) impulses/s, and for CPR-R this value was 11 (IRQ = 10) impulses/s. The pairwise comparison of the two-sample t (61) = 3.73, p < 0.001. For the light intensity of 15.35 (log photons/cm2/s) data analysis for normality with Shapiro–Wilk test showed the following results: for the CPR-L was 0.93, p < 0.01. For the CPR-R was 0.92, p < 0.05. Figure 7c shows that at the light level of 14.37 (log photons/cm2/s), an initial peak mean of ΔF = 4 to 10 impulses/s is observed from the CPRs, and the photoresponse from CPR-L is approximately 0.5 log units higher than that of CPR-R.
In another subgroup of two ganglia, data analysis for normality with Shapiro–Wilk test showed the following results: from the CPR-R for light intensity of 15.35 (log photons/cm2/s): was 0.96, p > 0.05. For the CPR-L was 0.95, p > 0.05. The pairwise comparison of the two-sample t (79) = −3.57, p < 0.001. The CPR-R showed a significant photoresponse regarding the CPR-L for a higher light intensity pulses tested (n = 2 to 4) (see Figure 7d).
Data analysis for the photoresponse determined for the first 10 seconds in CPRs due to constant light intensity pulses also showed two subgroups of ganglia. In one subset of two biological preparations, we performed four determinations, where the CPR-L showed a higher photoresponse, compared with CPR-R (see Figure 8a). CPR-L had a firing rate with a median of 39 (IRQ = 19) impulses/s, and for CPR-R this value was 24 (IRQ = 12) impulses/s. The pairwise comparison of the Mann–Whitney U-test was significant; Z = 4.67, p < 0.001.
In another subgroup of two ganglia, we carried out five determinations, with CPR-R having slightly higher responsiveness than CPR-L. The latency for CPR-R was 2.10 (±0.75) s, and for CPR-L was 1.83 (±0.55) s. Regarding time to reach a peak, the mean for CPR-R was 5.10 (±0.22) s, and for CPR-L was 5.58 (±1) s. Furthermore, CPR-R had a median of 8 (IRQ = 11) impulses/s, and CPR-L had a firing rate with a median of 5 (IRQ = 9) impulses/s. The pairwise comparison of two-sample t (80) = −3.57, p < 0.001 (see Figure 8b).

3.6. Response to Green Monochromatic Light Pulses from CPRs at Lower Temperature

We studied in a group of eight biological preparations green light responsiveness at 14 (±1) °C. Data analysis of light-induced activities in the left and right CPRs from the first 10 seconds showed two subgroups of ganglia. In one subgroup of four biological preparations, we carried out eight determinations, in which CPR-L showed a significant photoresponse, compared with that of CPR-R. The latency for CPR-L was 1.34 (±1.05) s, and for CPR-R was 1.81 (±0.78) s. Time to reach a peak had a mean of 6.61 (±1.27) s for CPR-L, and for CPR-R was 6.48 (±1.48) s. Time to reach a peak at 14 (±1) °C for CPR-L was significantly slower than at 24 (±1) °C. The firing rate for the CPR-L K–S-test for normality test was 0.11, p > 0.05. For CPR-R showed firing rate with K–S-test for normality test was 0.10, p > 0.05. Furthermore, CPR-L had a firing rate with a median of 17 (IRQ = 31) impulses/s, and CPR-R had a median of 10 (IRQ = 16) impulses/s. The pairwise comparison of two-sample t (133) = 3.92, p < 0.001(see Figure 9a).
For another subgroup of four ganglia, we performed eight determinations; CPR-R appears with slightly higher light responsiveness than for CPR-L (see Figure 9b). The latency for CPR-R was 1.30 (±0.78) s, and for CPR-L was 1.58 (±0.59) s. Time taken to reach a peak had a mean for CPR-R of 4.52 (±1.04), and for CPR-L was 5.17 (±0.90) s. The firing rate for the CPR-R K–S-test for normality test was 0.07 p > 0.05. For CPR-L showed firing rate with K–S-test for normality test was 0.10, p > 0.05. Furthermore, CPR-R had a median of 27 (IRQ = 28) impulses/s, and CPR-L had a firing rate with a median of 20 (IRQ = 27) impulses/s. The pairwise comparison of two-sample t (150) = −2.83, p < 0.01(see Figure 9b).

4. Discussion

This research is our first attempt to analyze the responsiveness of left and right caudal photoreceptors caused by blue and green monochromatic light pulses. This study provides robust data to demonstrate the different responses in the CPR neurons located in the left and right side of the last ganglion of an isolated nerve cord including the intensities of light, colors of light, and temperature, by extracellular recordings of action potentials. Our results support the presence of the SWS, and the LWS opsins in the CPRs, which showed sensitivities to blue and green light, respectively [20,21]. In addition, the current results provide support for the functional asymmetries described recently as a novel property for both CPR-L and -R when comparing their responses induced by white light pulses in the same species of crayfish C. quadricarinatus [34]. At room temperature of 24 (±1) °C, we found a significant difference in the amplitude, time to peak, and duration in action potentials extracellularly recorded from CPR-L and -R in most of the comparisons (Table 1, Table 2, Table 3, Table 4, Table 5 and Table 6). Some factors could contribute to these differences: the position within the connective tract connective of the CPR-L-axon is in Wiersma area 82, which is more superficial with respect at to the position of the CPR-R-axon that is in area 79 of the cord map of the crayfish [33,34]. The waveform of the extracellular action potential varies with electrode position relative to the recorded cell [36], the amplitude of the action potential is function on the diameter of the axon [37] and neurons with many dendrites will produce large amplitude spikes [38]. Even more, there is an inverse relationship between the impulse amplitude and duration: the higher the impulse amplitude, the shorter the impulse duration [39].
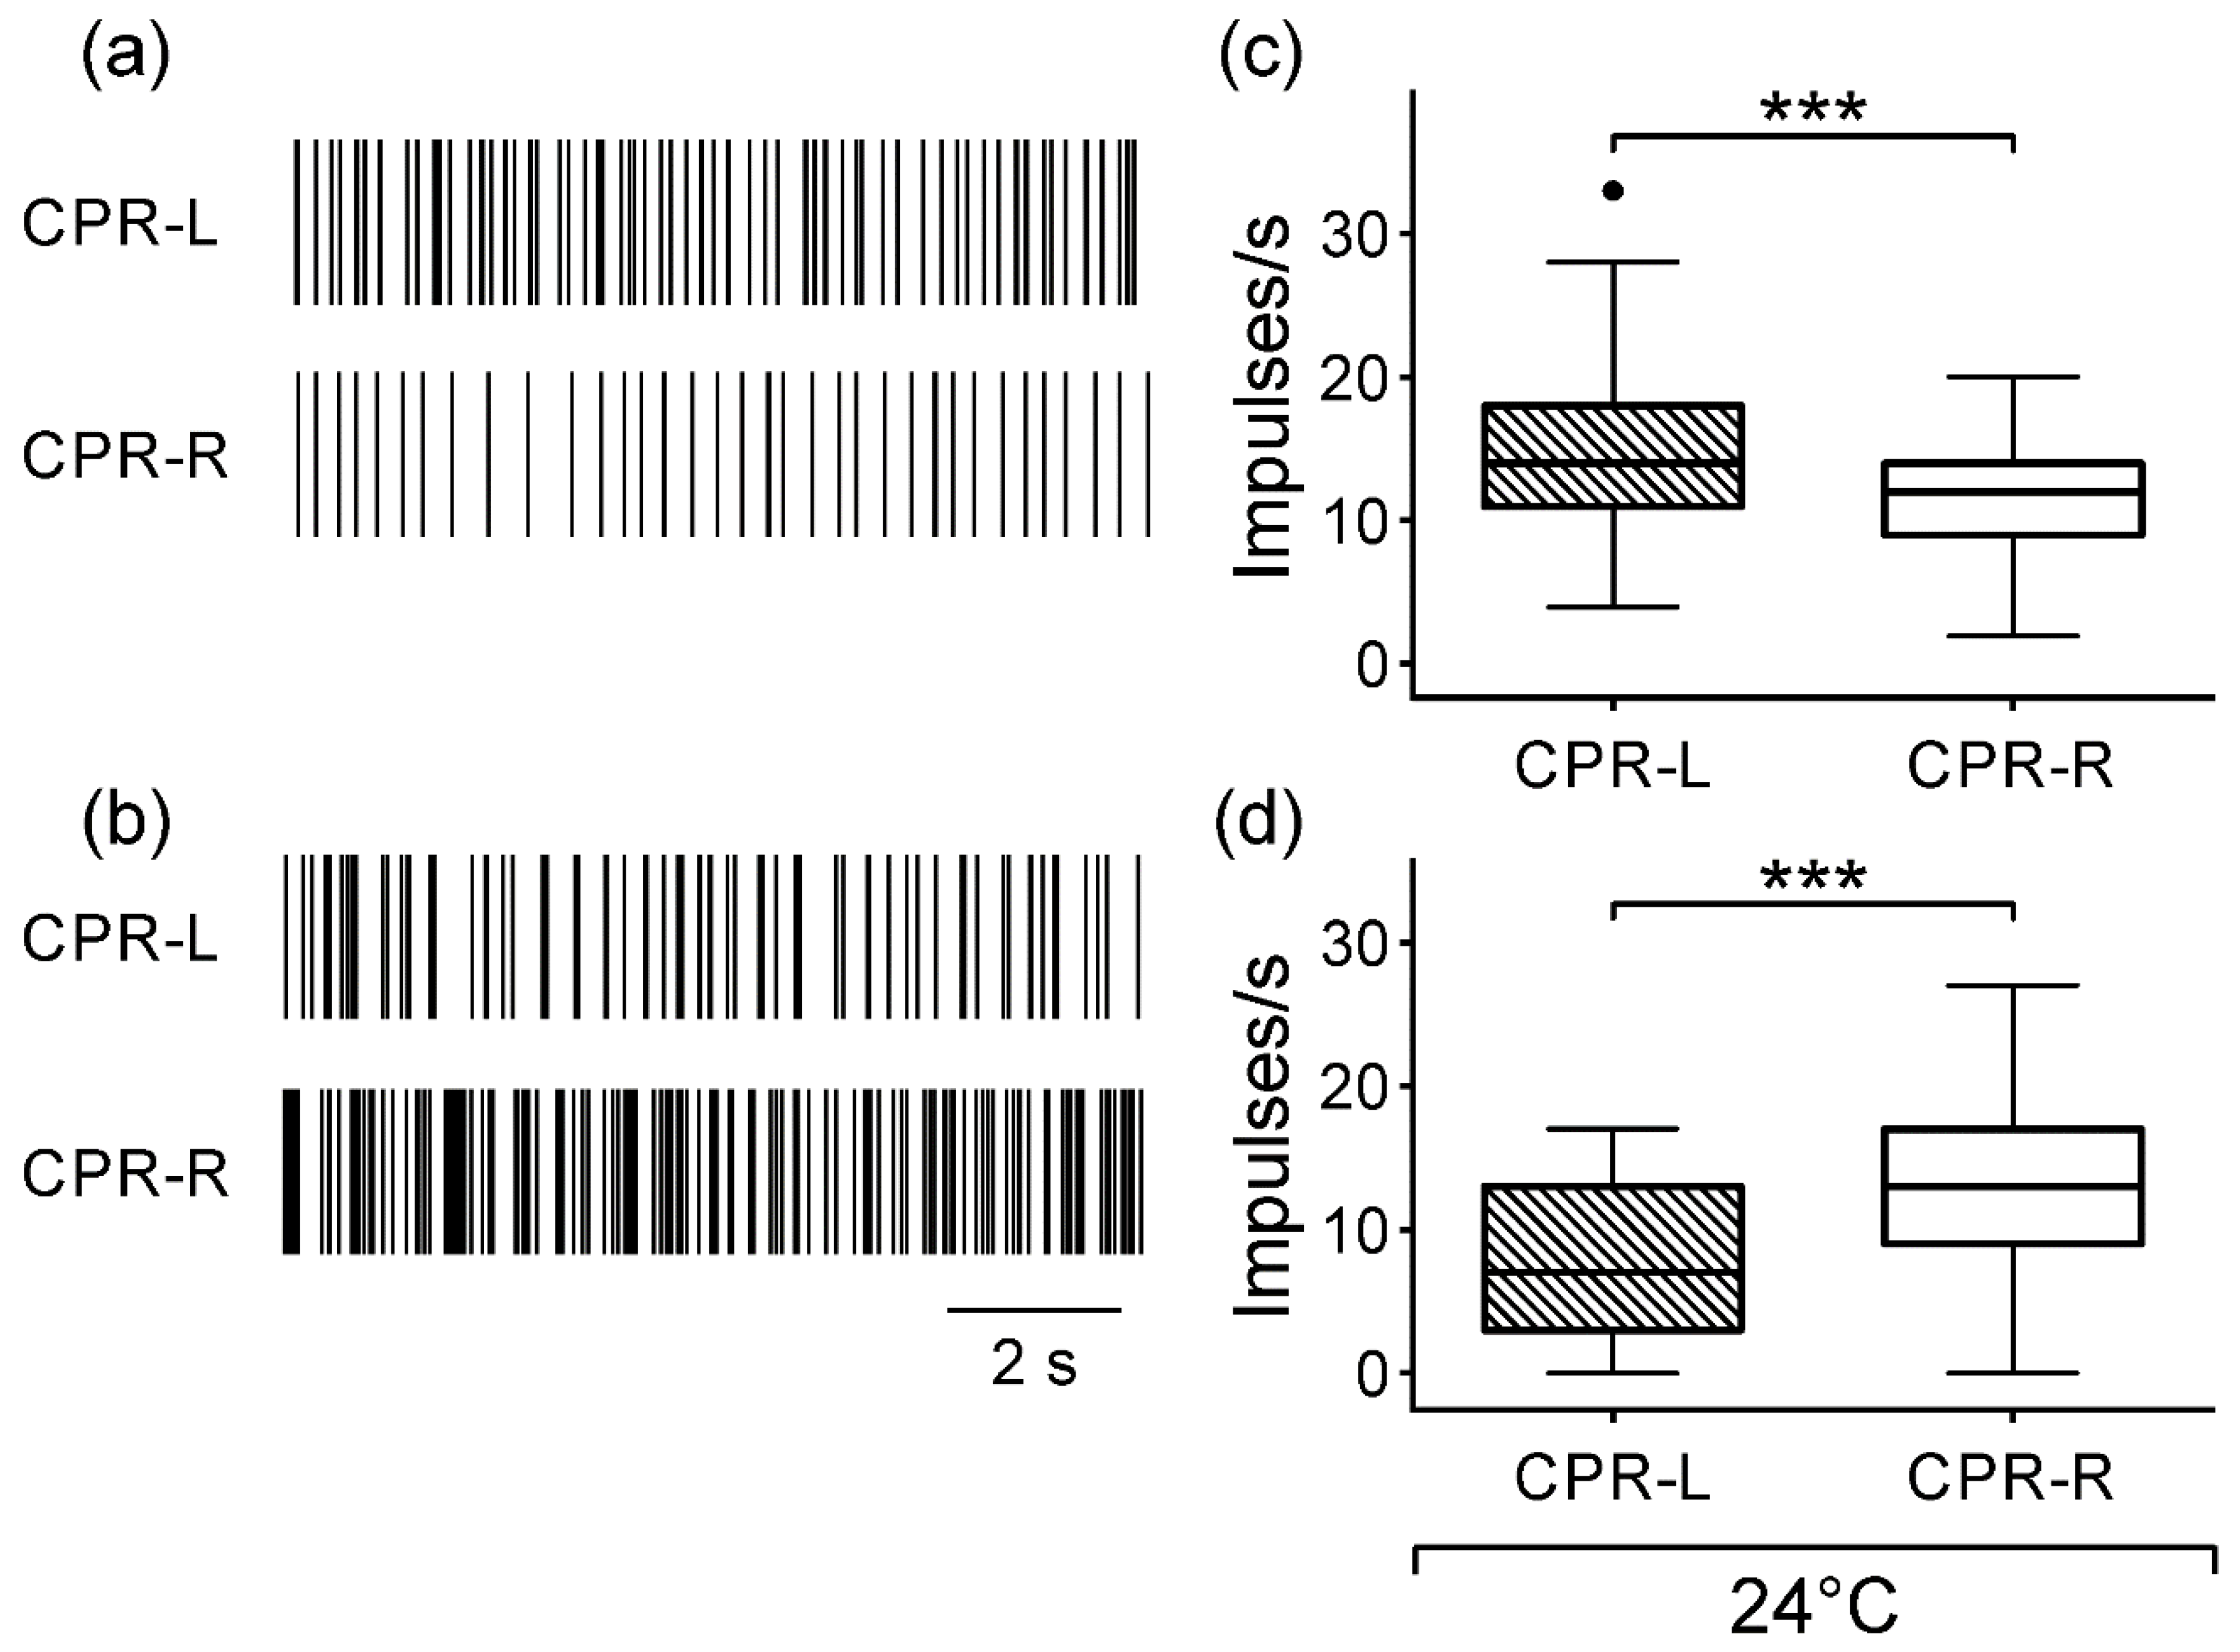
Moreover, both left and right CPRs in the isolated ganglion showed a spontaneous asymmetric activity in darkness (Figure 1). In a subset, the CPR-L showed a median firing rate 14% higher than CPR-R (Figure 2c), and in another subgroup, the CPRs showed an opposed asymmetry of 46% (Figure 2d). At this temperature, we may consider that the endogenous pacemaker activity displays a regular spontaneous firing rate and responds to synaptic inputs to the nervous system in the crayfish [40].
In earlier studies, the effect the temperature on the CPRs was observed, by incubating the ganglion in a cold saline solution. A quiescent spontaneous activity was displayed, and in this manner, the light-induced activity appears robust [8,
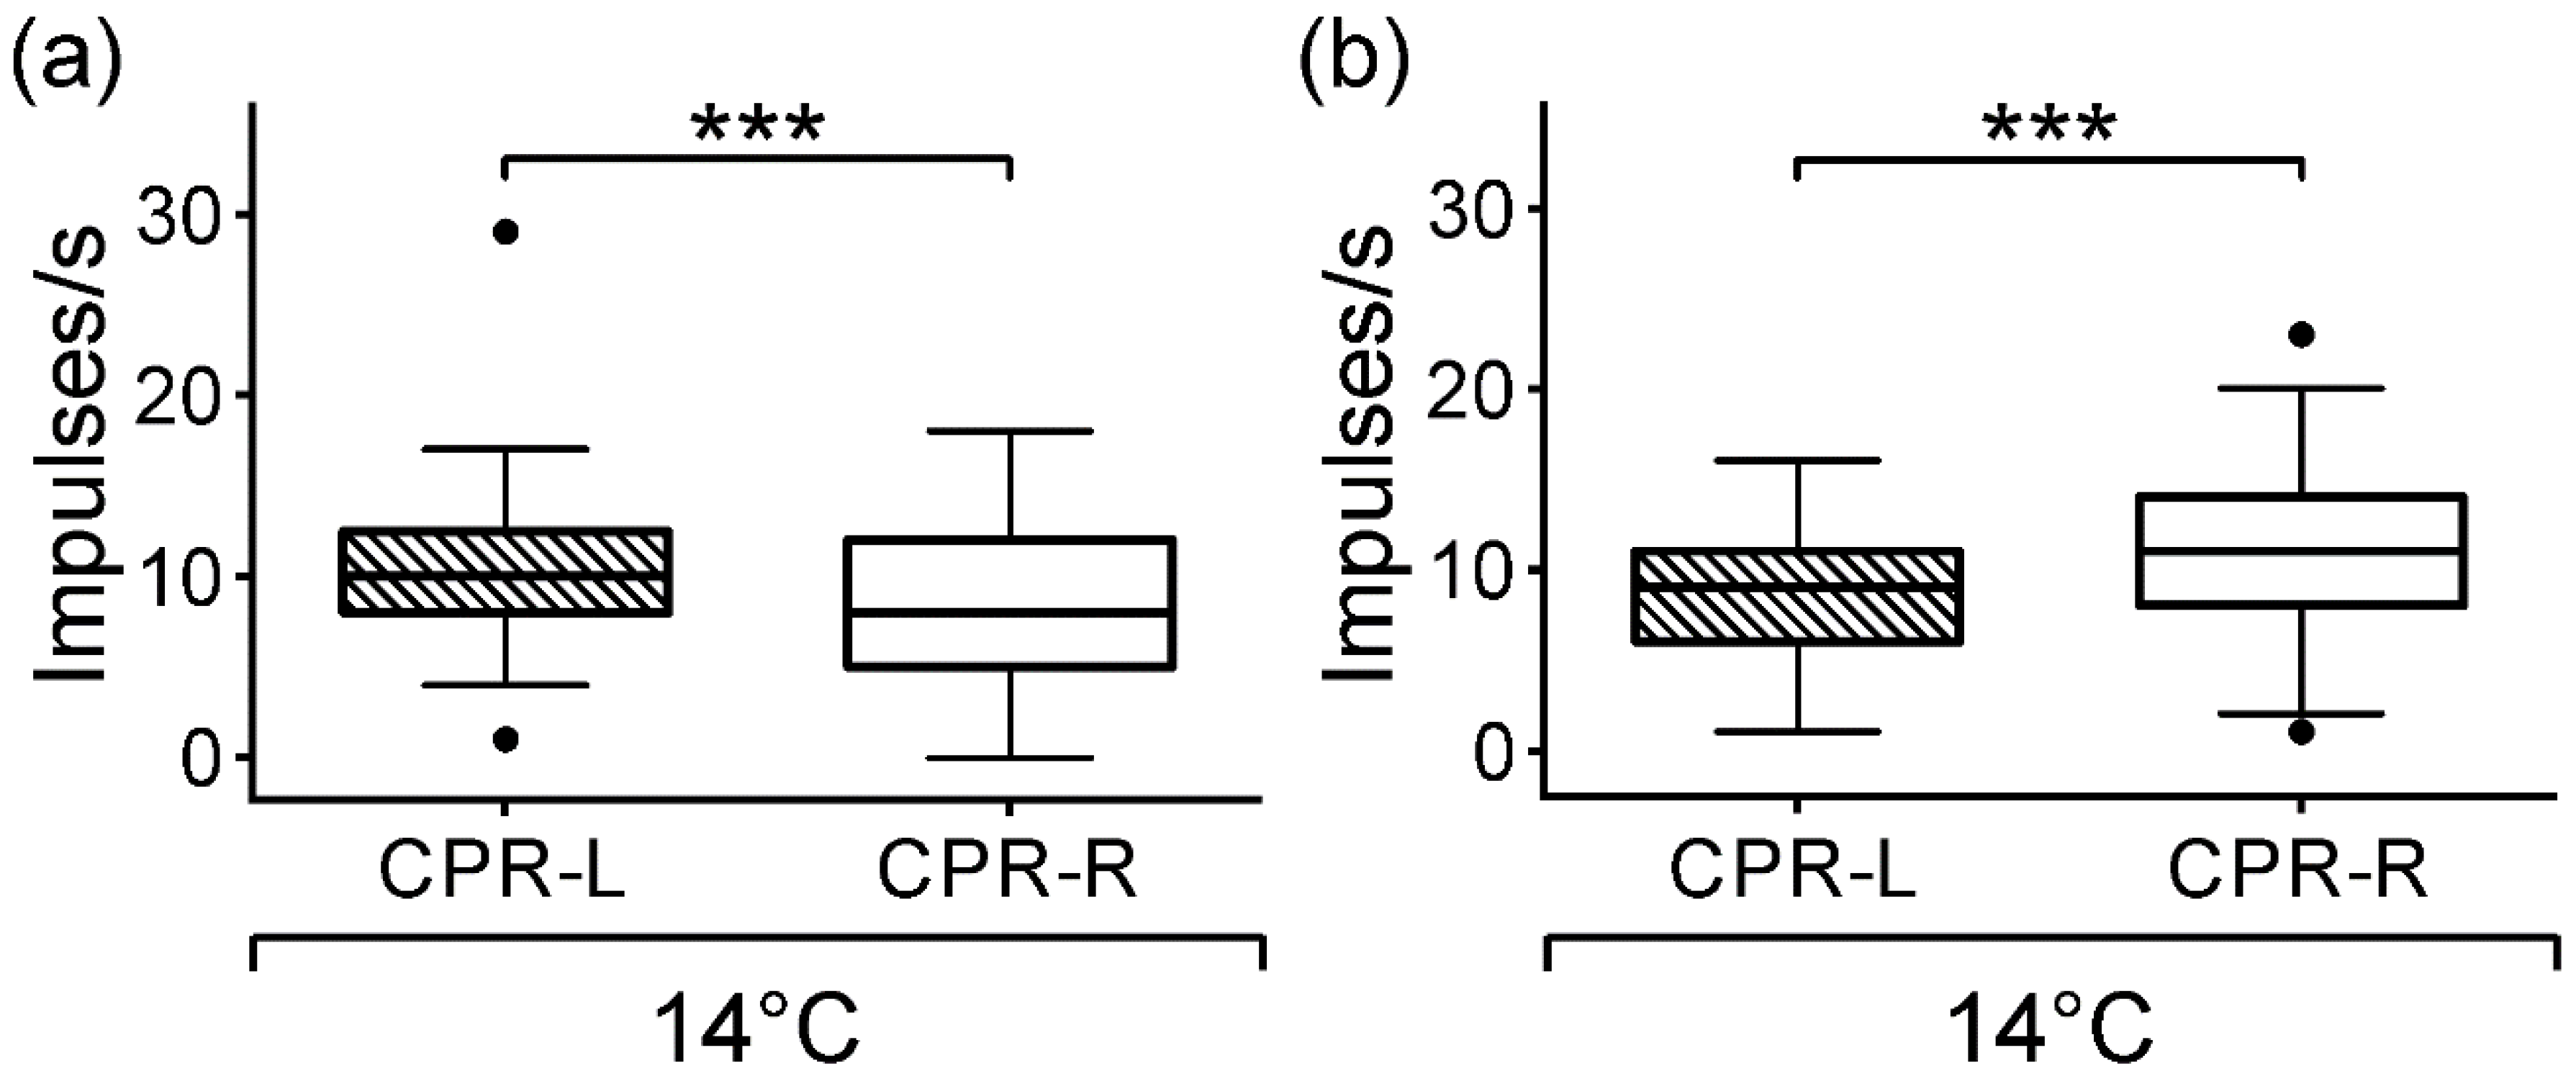
40]. In fact, we found that at a temperature of 14 (±1) °C, the CPRs diminished the firing rate in darkness and maintained significant asymmetric activities (Figure 3). Moreover, CPR showed an abrupt increase in the inter-spike intervals by reducing the bath temperature to 13.5 °C, and this homoclinic bifurcation suggested a thermally sensitive property from this primary photosensitive neuron [41].
In fact, the CPRs receive inhibitory and excitatory synaptic inputs [8,13,16]. Also, various substances postulated as neurotransmitters or modulators differentially influence the spontaneous activity and photoresponse from the CPR [2]. This asymmetric activity in darkness can be a balanced state of inhibitory and excitatory effects of these modulators in the firing rate from both left and right caudal photoreceptors. As suggested, synaptic activity regulates the fluctuations from neuronal networks of the spinal cord, hippocampus, and in the leech ganglia [42,43].
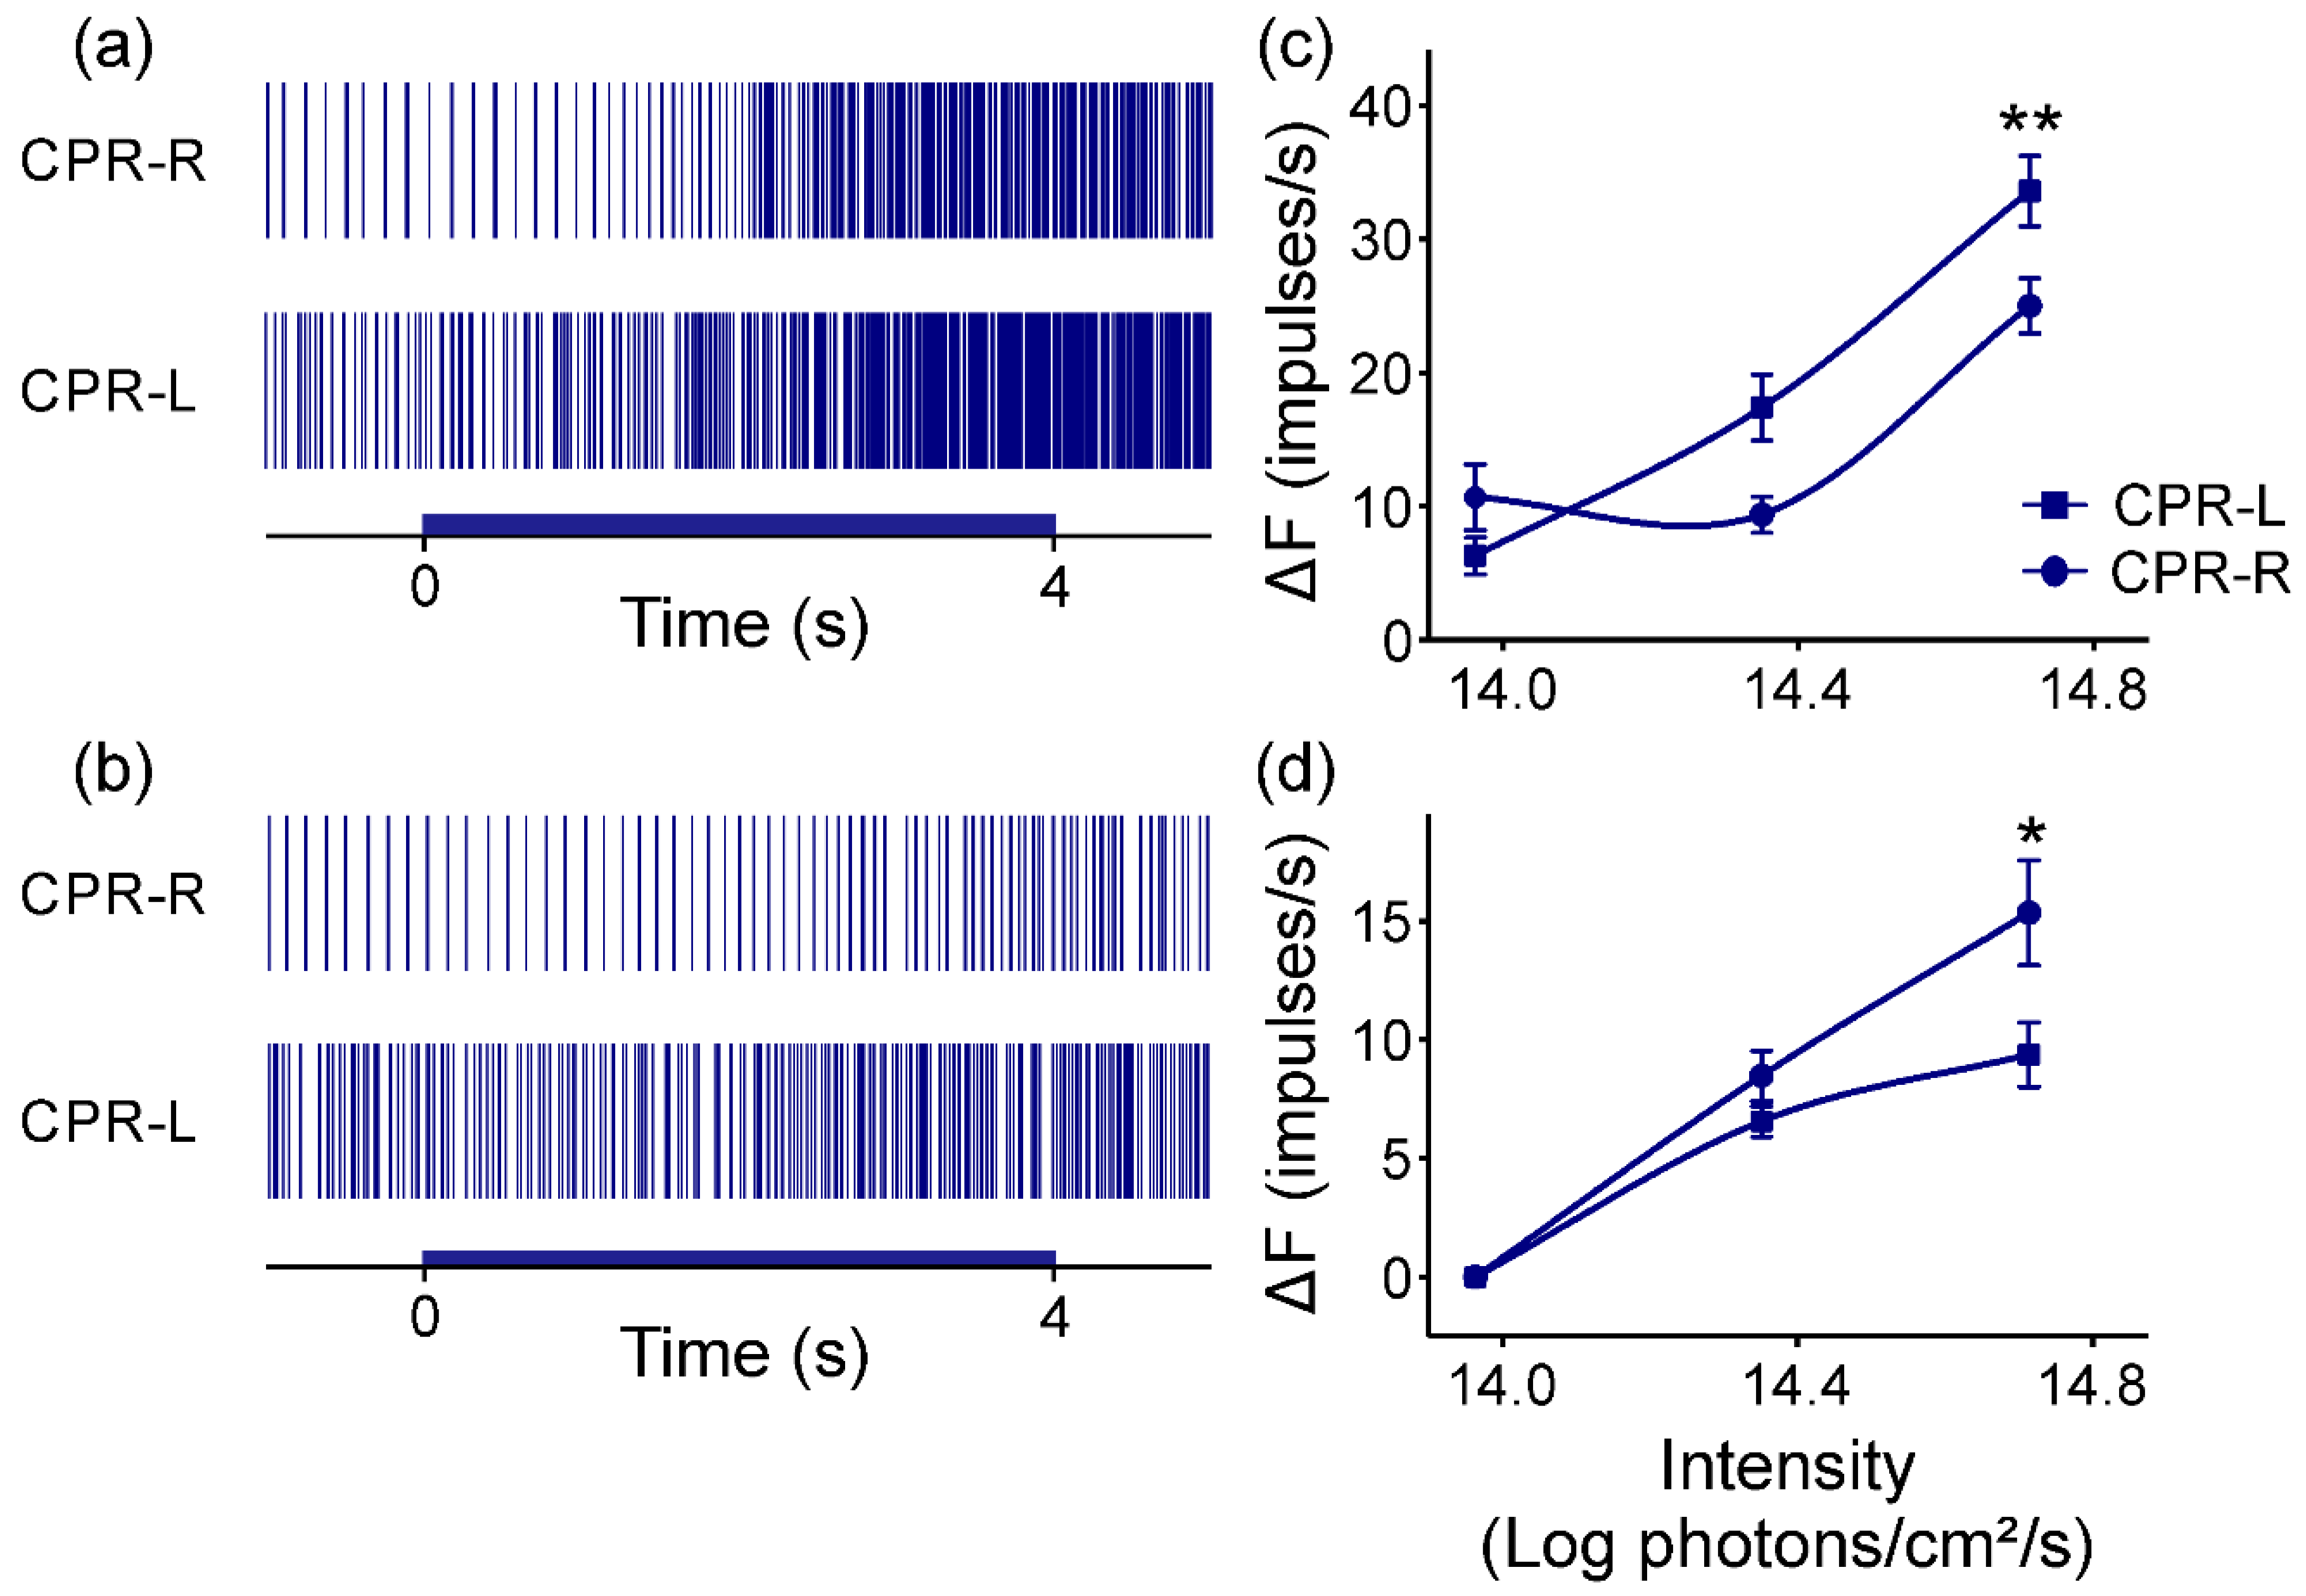
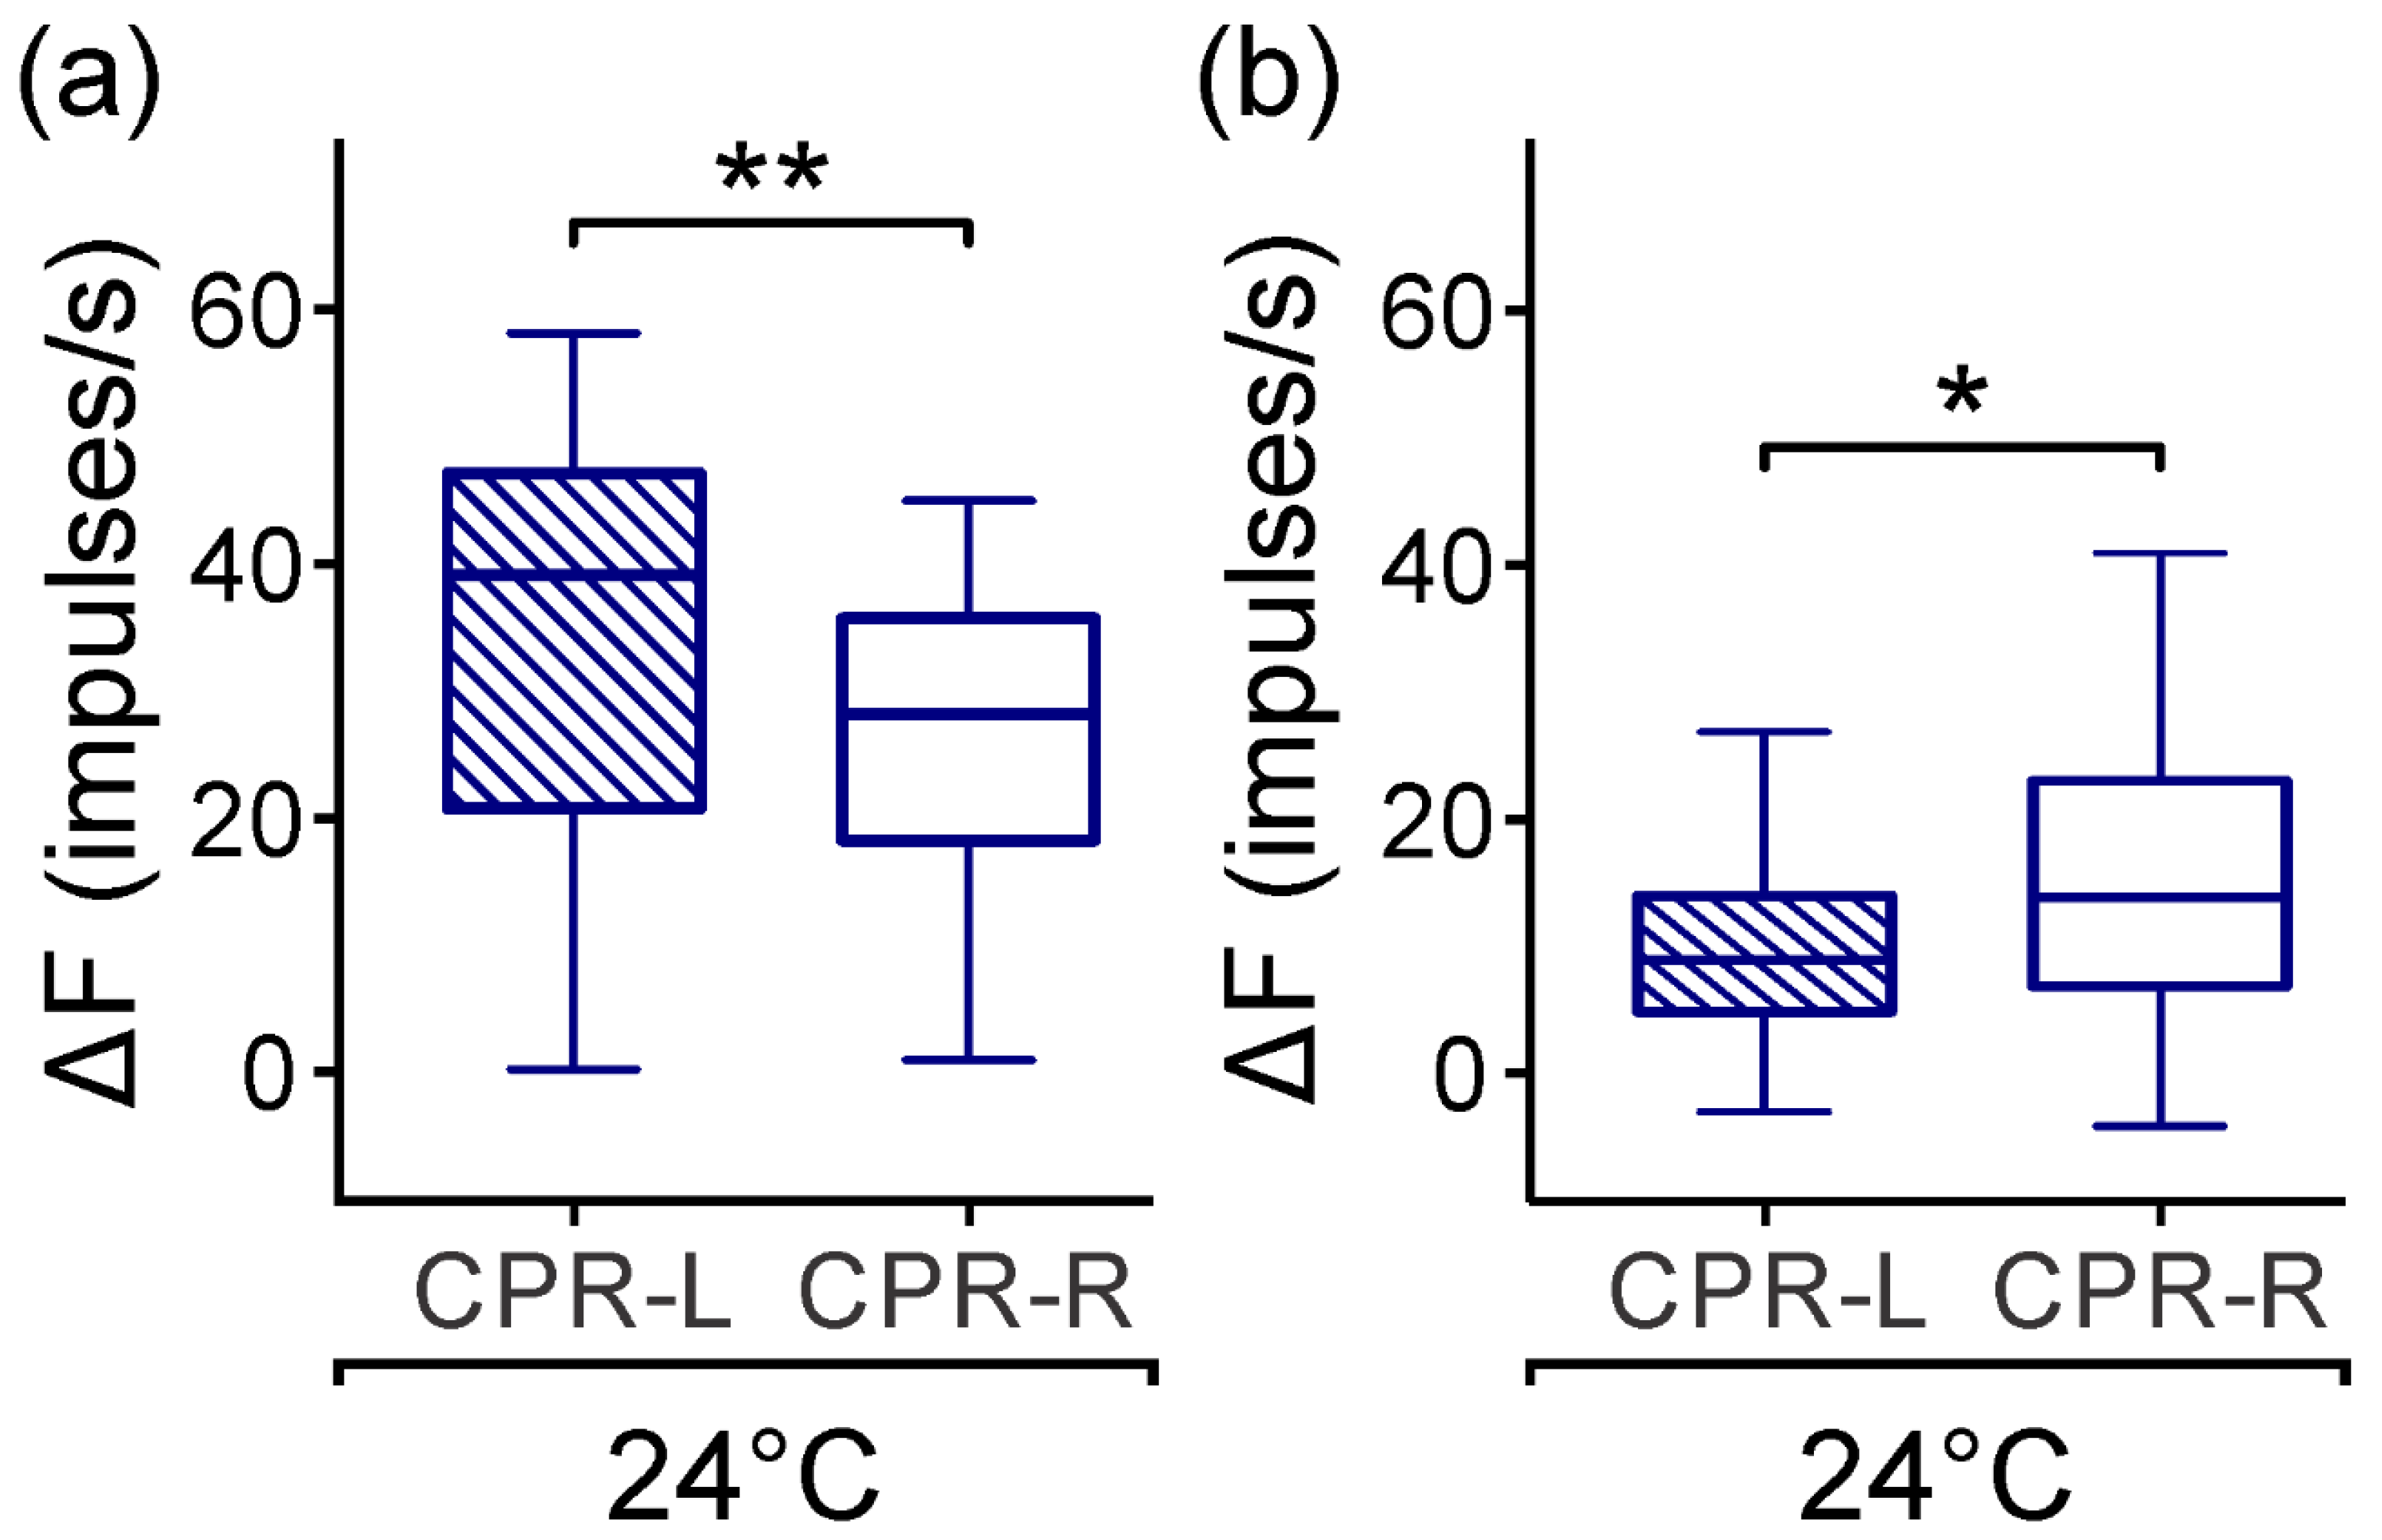
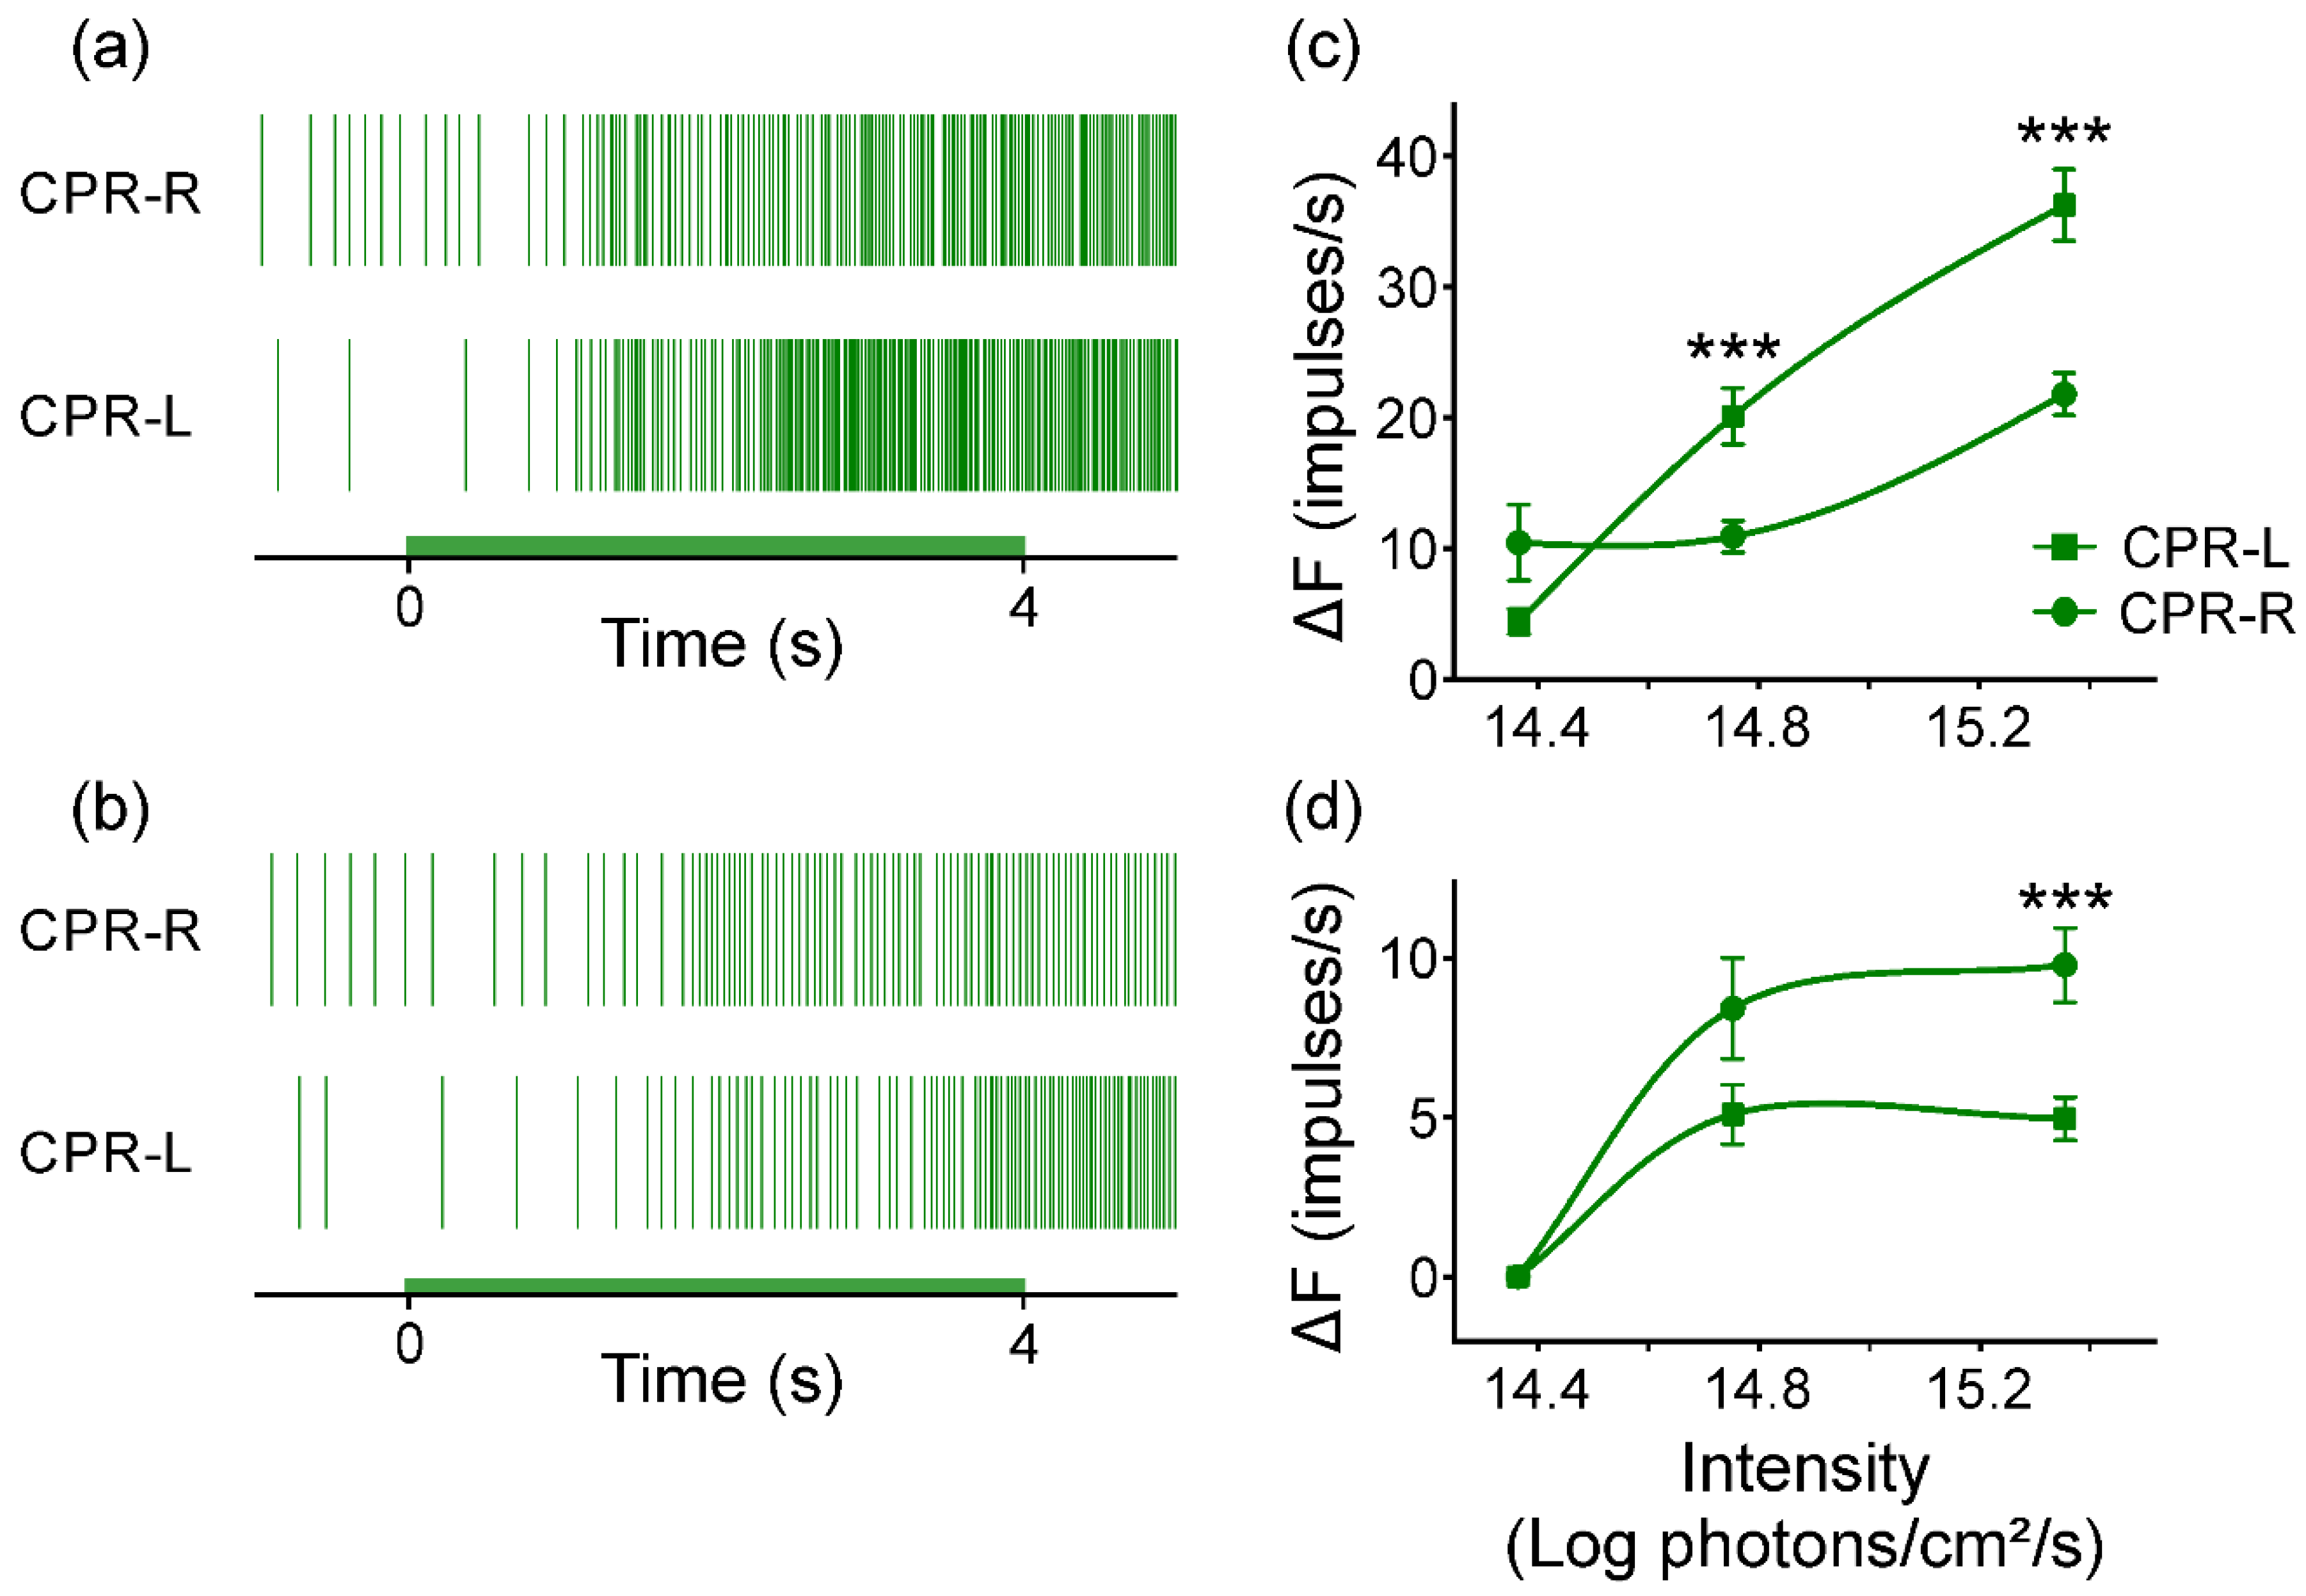
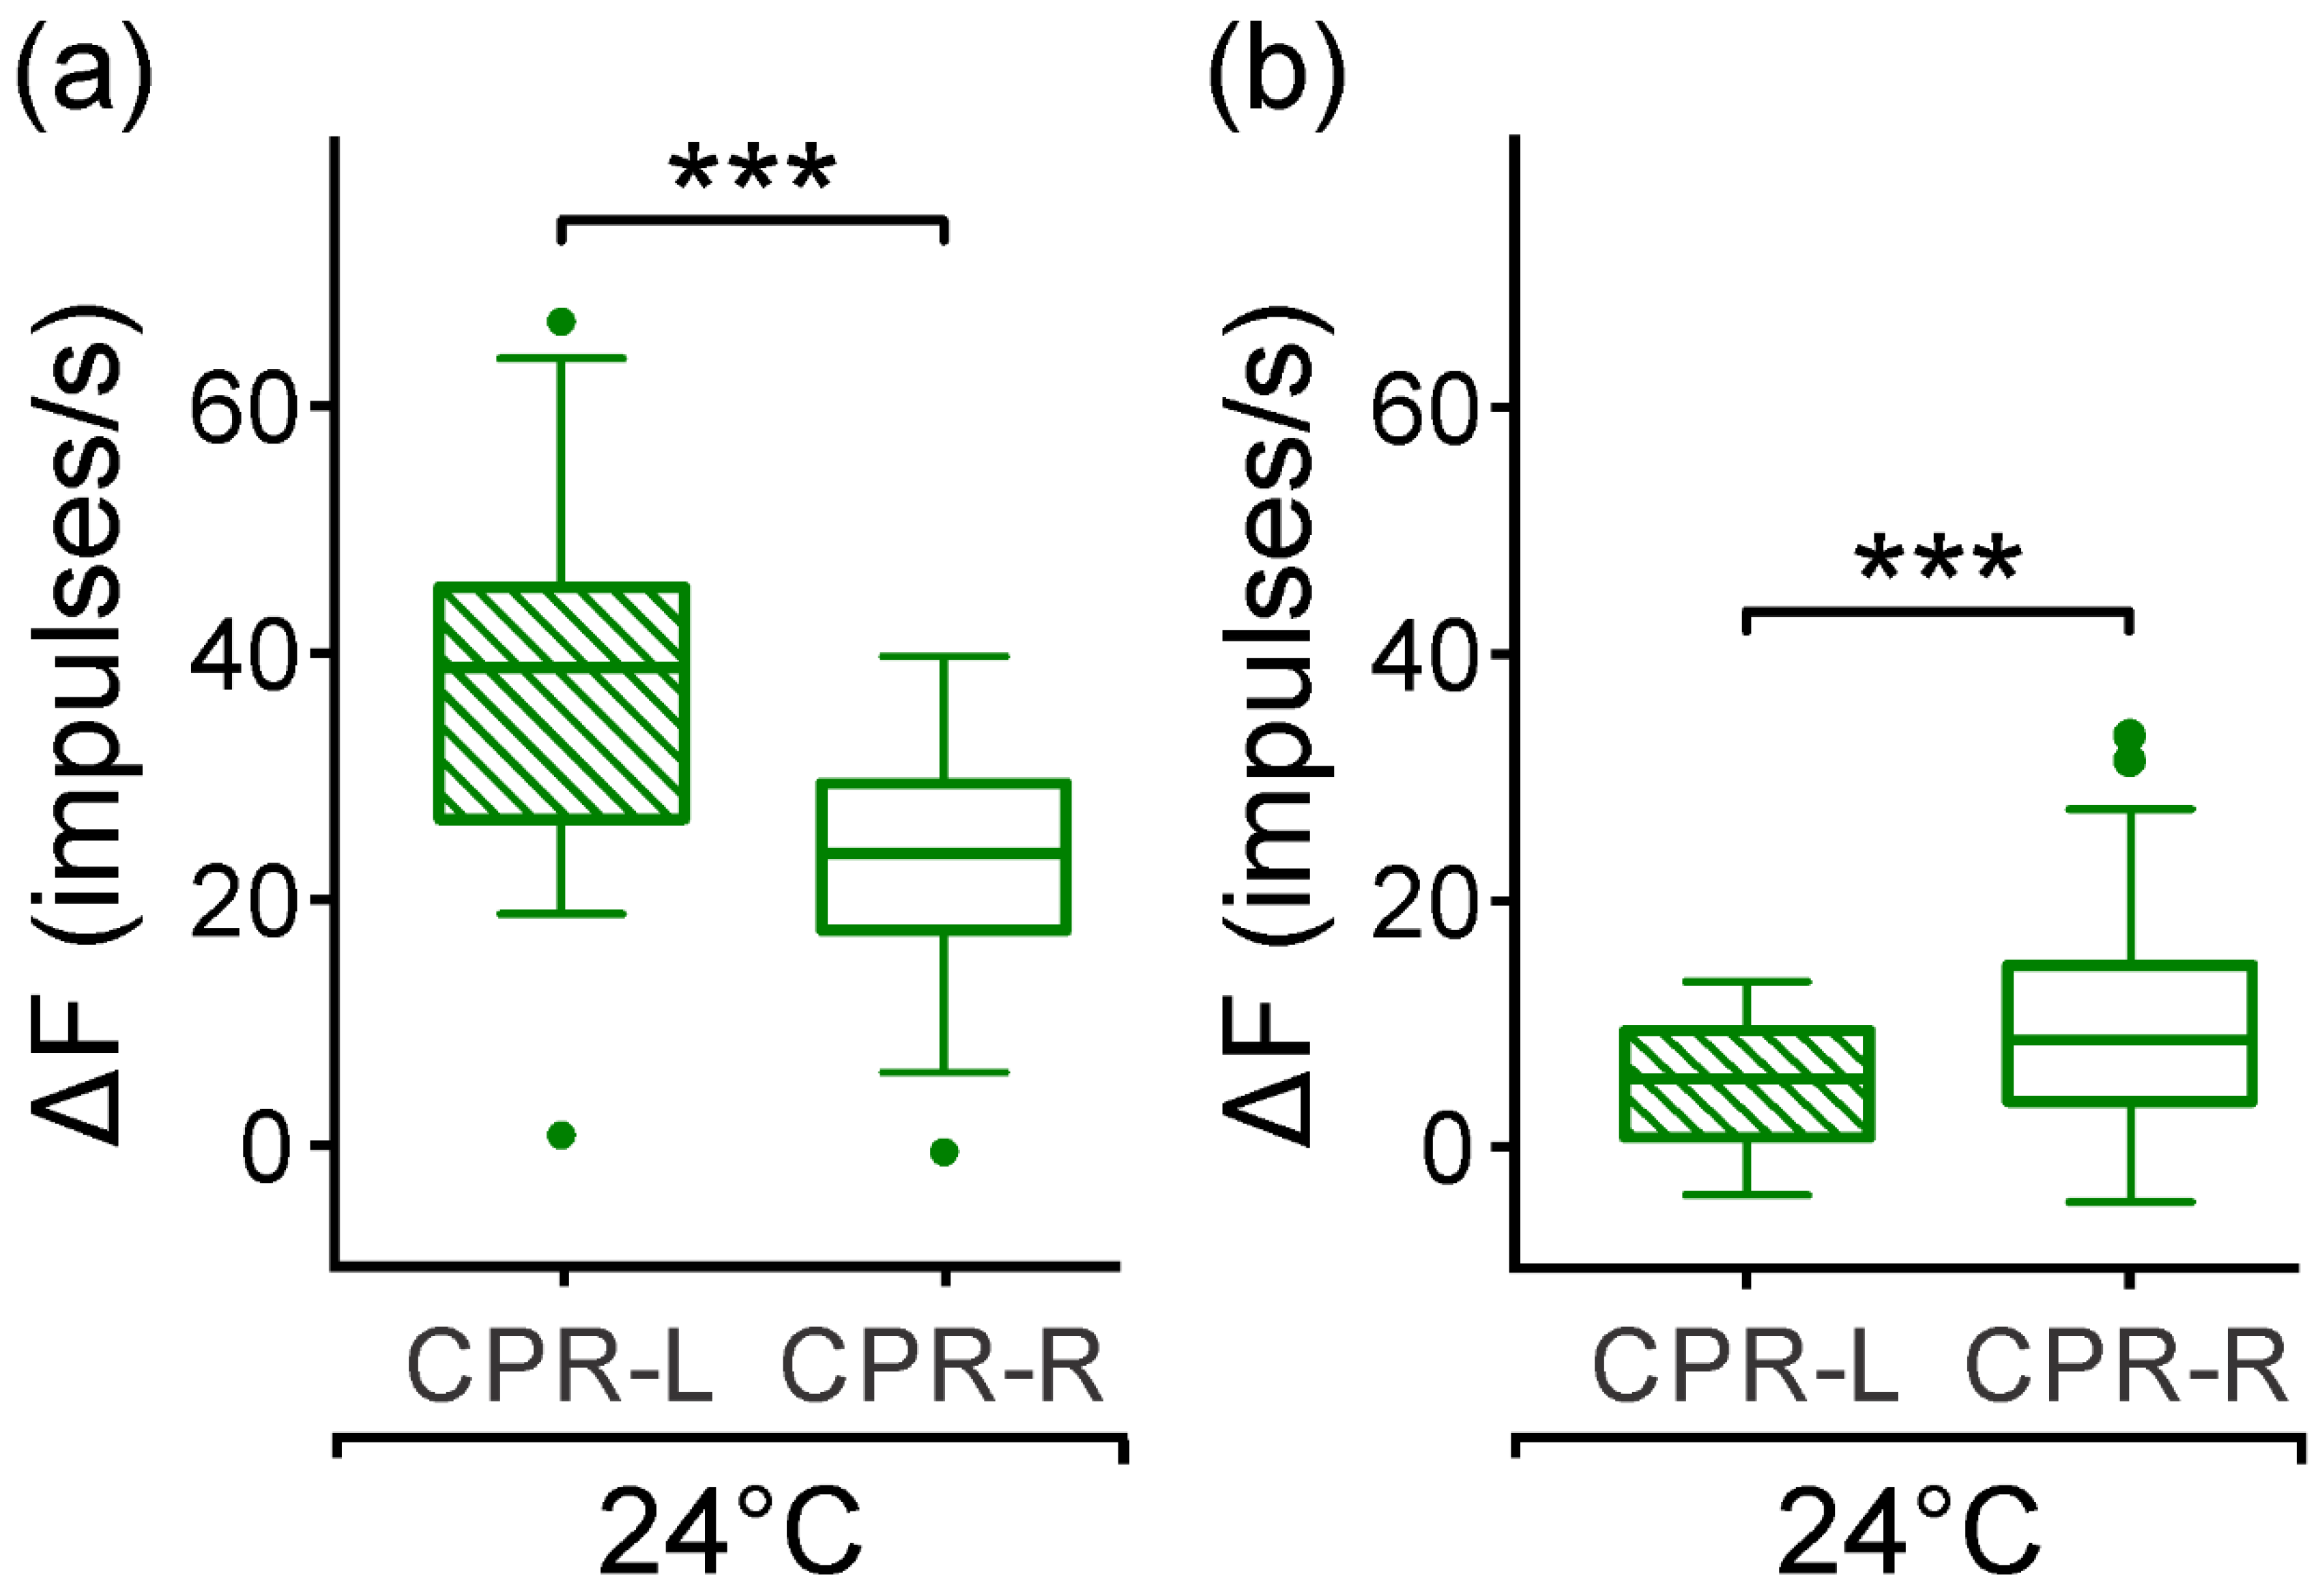
The caudal photoreceptors display both monochromatic light sensitivities after dark adaptation at two temperatures. At 24 (±1) °C, their responses depend on light intensity at a range of 1.4 logarithmic intensity units. There was approximately 0.5 logarithmic intensity units more responsive to blue light than to green (Figure 4 and Figure 7), with latencies and time to peaks diminishing depending on light intensities. The differential photoresponse observed between both right and left photosensitive neurons for both monochromatic light pulses could be attributed to a distinct molecular expression of photopigments SWS and LWS. Battelle [
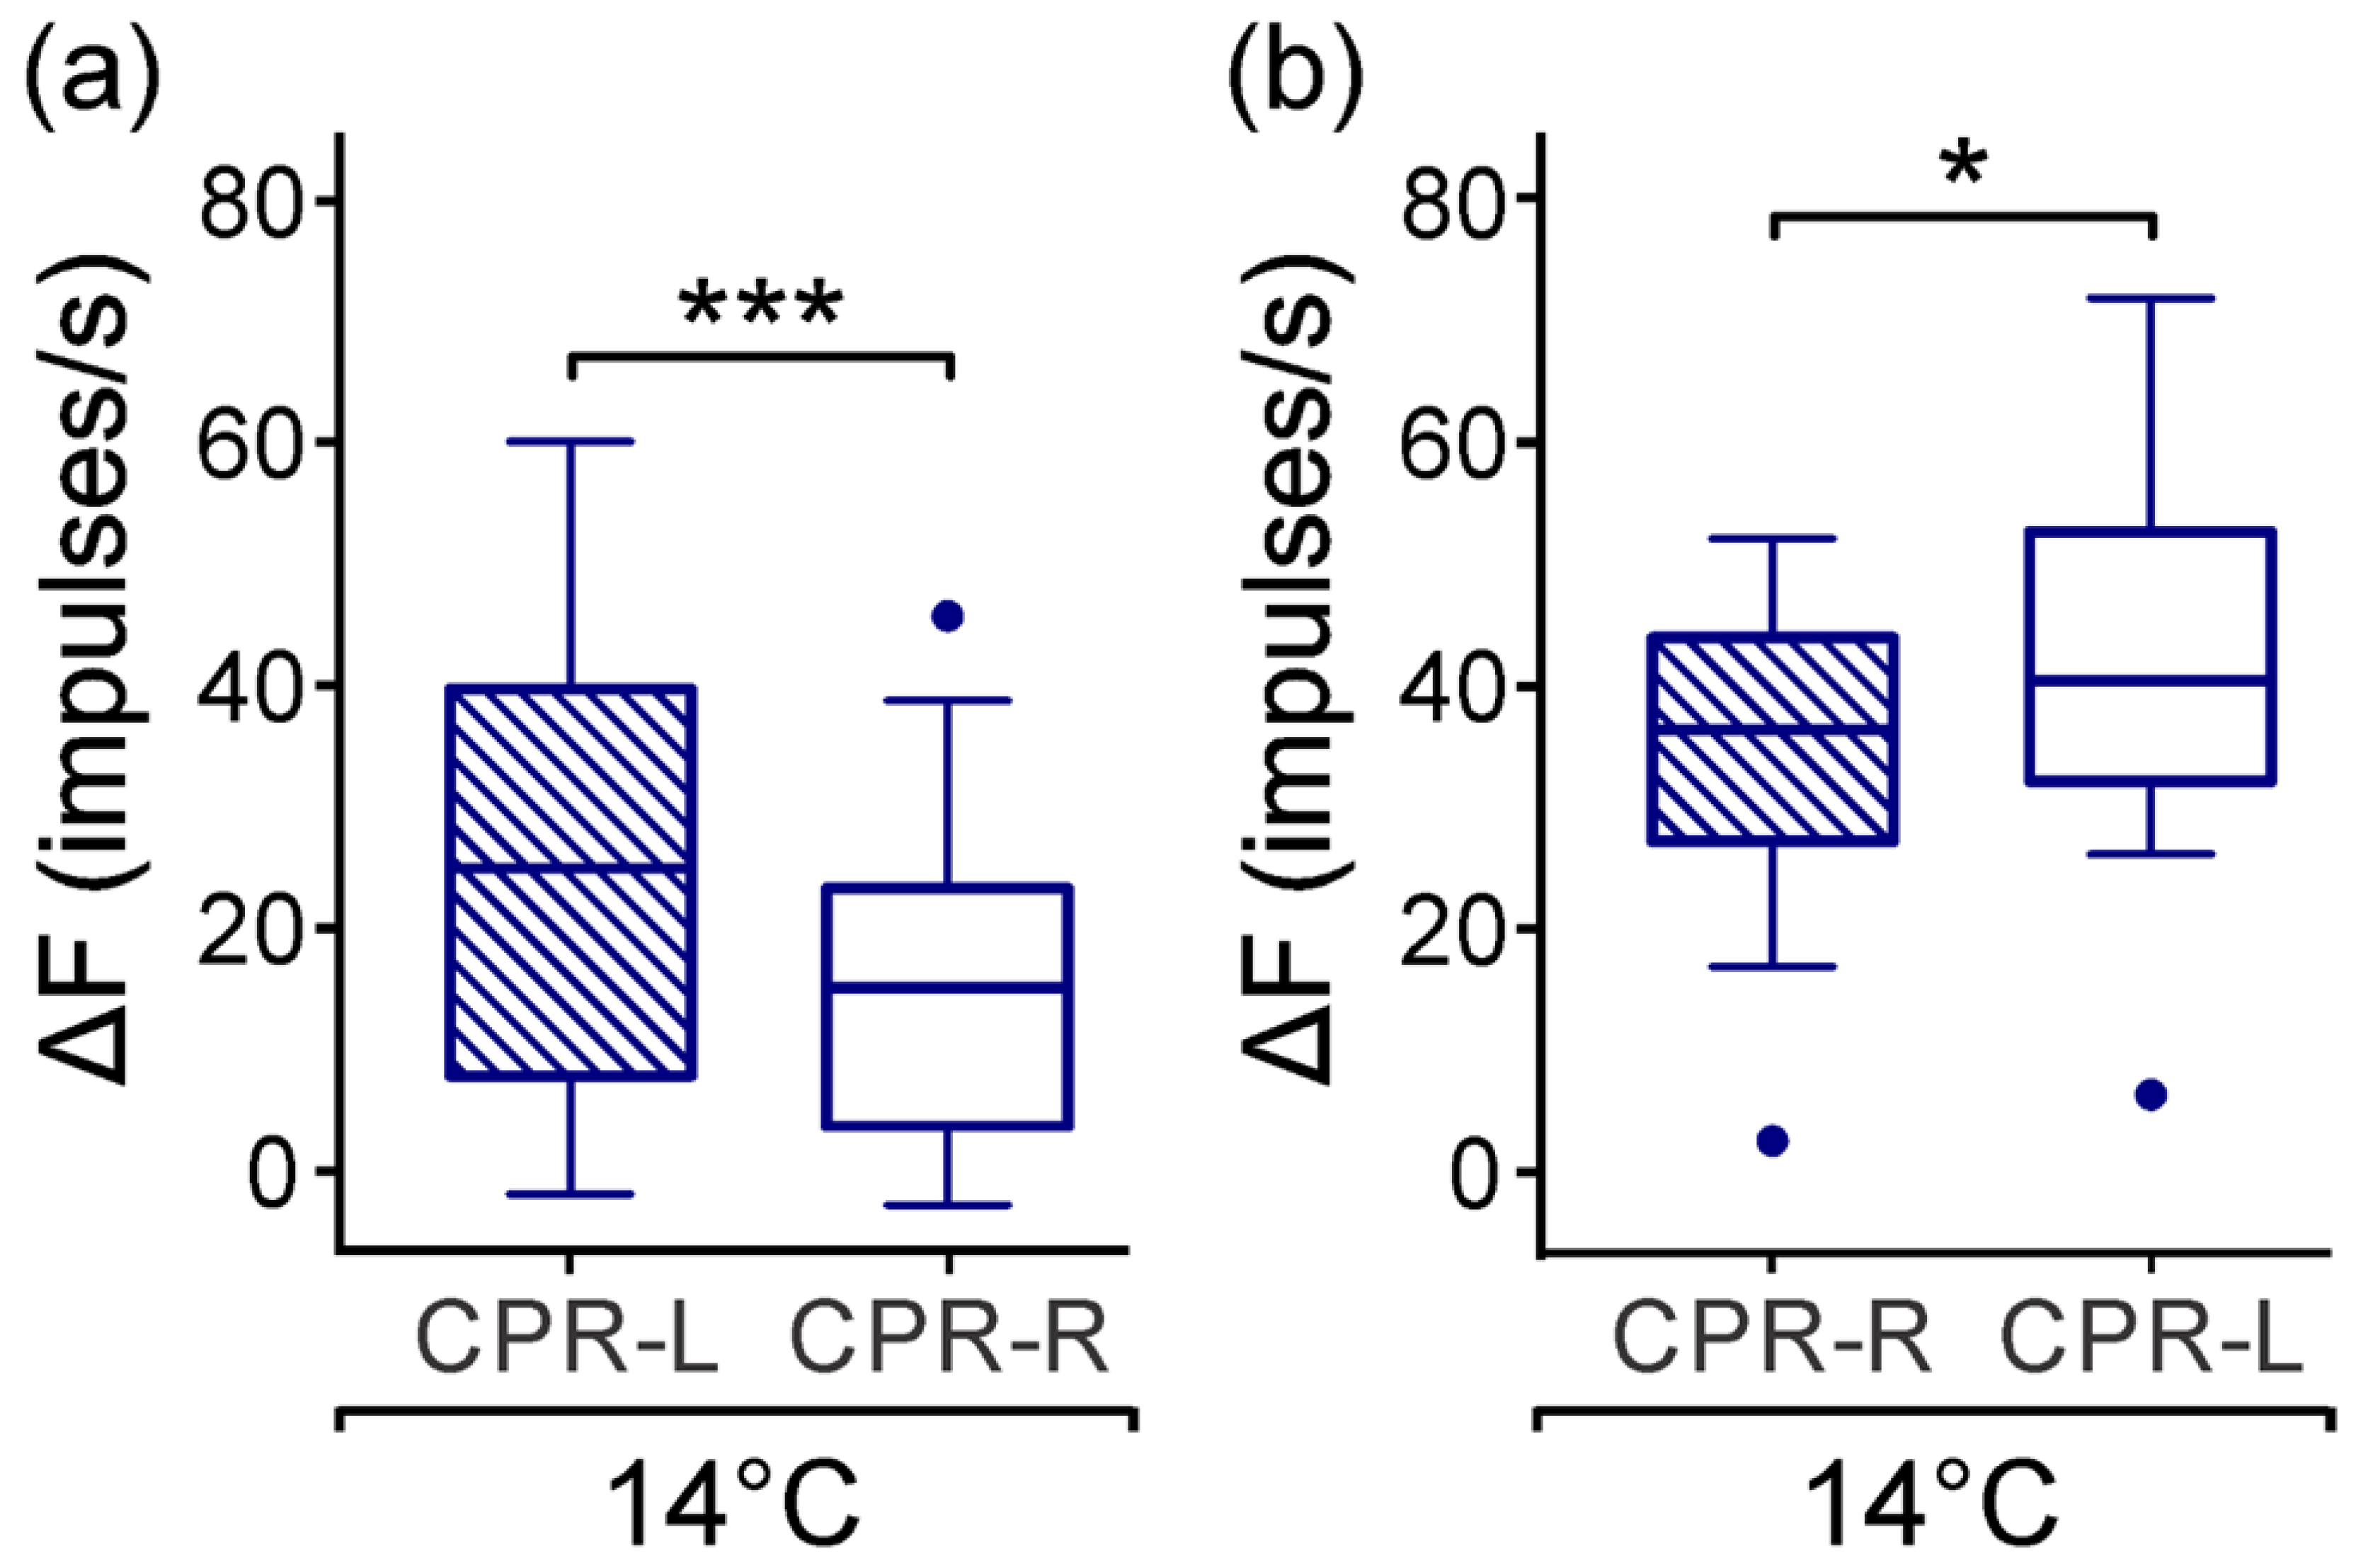
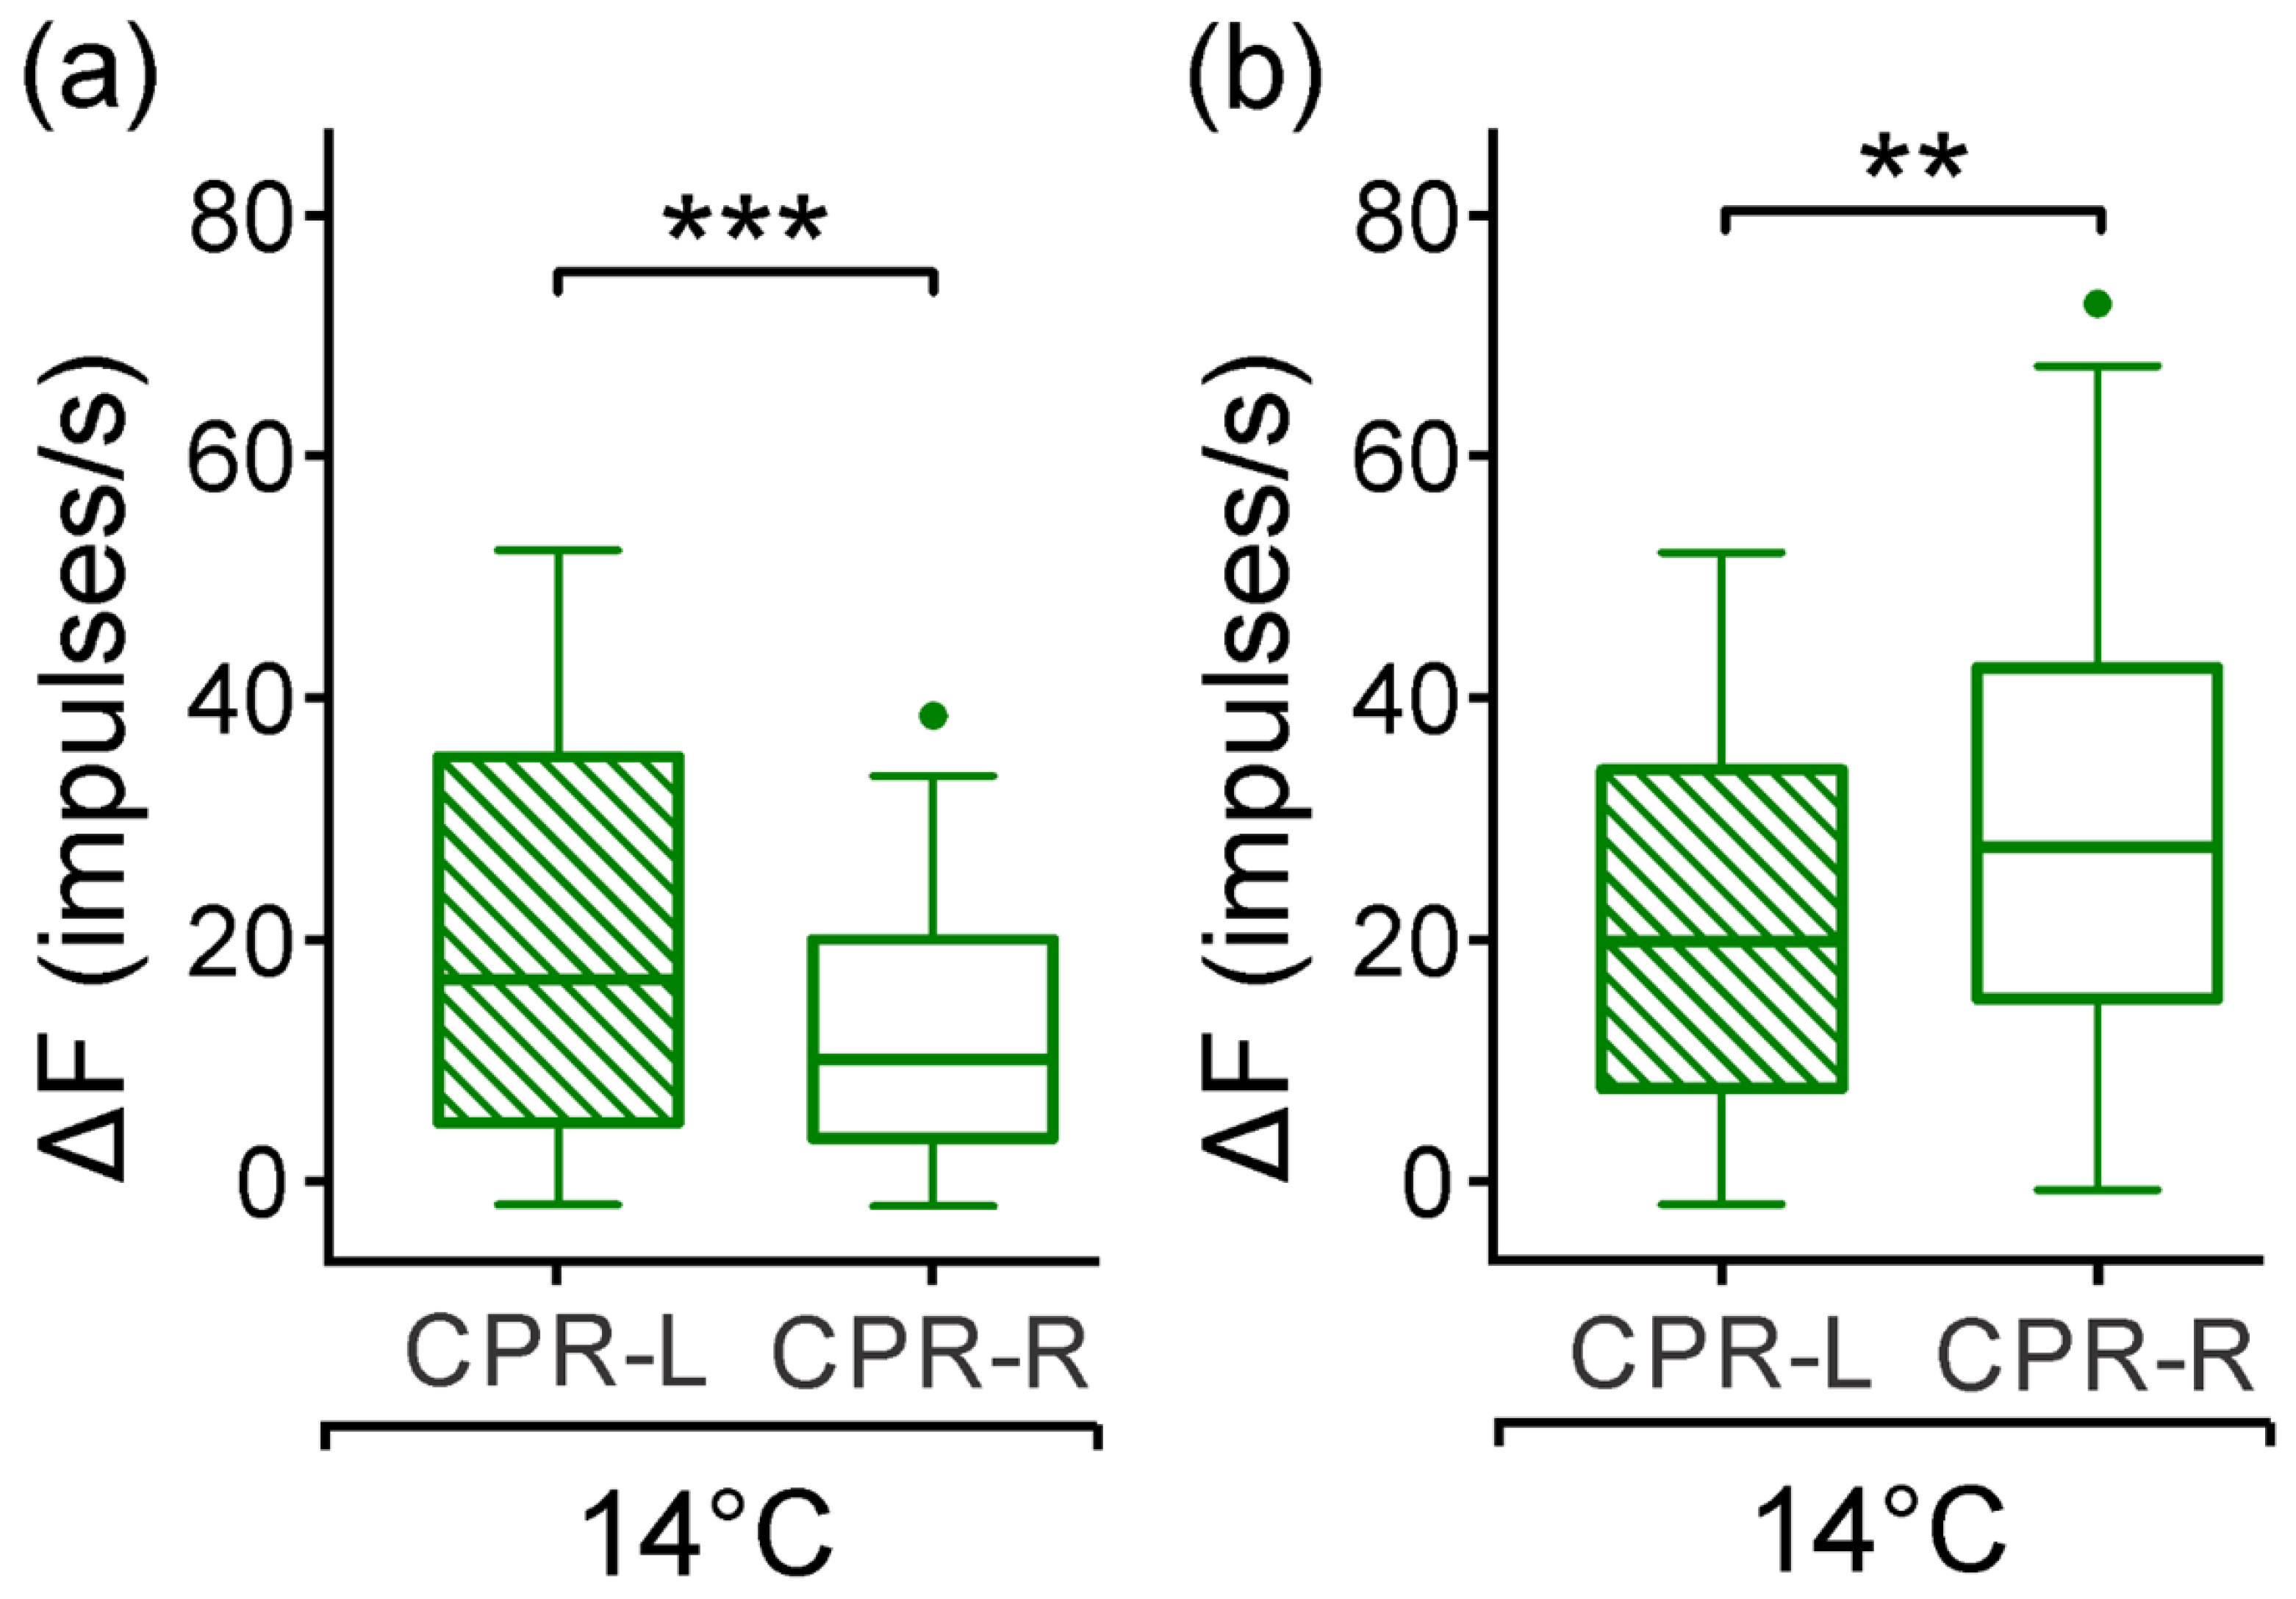
44] reviewed the physiology of opsins with low expression levels in another extraocular photoreceptor model. Lowering the temperature to 14 (±1) °C for the CPRs was also found to cause a robust photoresponse to both monochromatic light pulses and allowed asymmetry with respect to their light-induced activity (Figure 6 and Figure 8) to be more easily observed. Interestingly, the crayfish P. clarkii acclimated at a lower temperature, and the photoresponses induced by white light and recorded at 15° C from the CPR were higher than in caudal photoreceptors from the CPR from animals acclimated to 25 °C [45]. These asymmetric photoresponses here reported from the CPRs resemble those observed with white light pulses [33]. We carried out our studies at 14 to 24 °C. The crayfish C. quadricarinatus are found in the native environment at temperature ranges of 12 to −33 °C [46]. Results from other neuronal models suggest multiple mechanisms to achieve thermal compensation in crustaceans [47,48]. However, the possible mechanisms for the effects of temperature on the CPR responses caused by both monochromatic light wavelengths are still unknown and remain for future analyses. Serpico and Frasnelli [49] suggested that the asymmetrical function of the nervous system plays a part in learning and memory both in vertebrates and invertebrates. In the Caenorhabditis elegants model, left–right asymmetry is occurring in single (paired) neurons in the taste sensitivity respond differently to taste cues [26]. Moreover, monochromatic light modulates circadian rhythms through the non-visual photoreceptor pathways in different biological models [50,51,52]. As aforementioned, the caudal photoreceptor acts as a circadian pacemaker in the crayfish [1,2,7]. We suggest as a topic of future studies the effect of both monochromatic light wavelengths on CPRs and the circadian rhythms of crayfish.
Renart and Machens [53] review the studies on variability: it is reduced if there is greater control of internal variables. That is, the uncontrolled variables induce a greater variability. The results of our investigation show high variability in the activity of the caudal photoreceptors, probably because we have used young animals without distinction of sex. For this study, we control age, height, and weight; but not sex. For future studies, it is suggested to explore the factorial effect of sex and age of the animal on the caudal photoreceptors activity, and their influence on the locomotor behavior.

5. Conclusions

We found a significant difference in the amplitude, peak to peak, and duration in extracellular spikes between CPR-L and CPR-R in most of the comparations. Monochromatic blue and green light cause a photoresponse in CPR-L and -R in a range of 1.4 logarithmic units for both colors. The CPRs appear in a response of 0.5 log units more sensitivity to blue light than green. Both light-induced activities appear more robust at a lower temperature. The monochromatic blue and green light pulses revealed a significant asymmetric firing rate from the left and right caudal photoreceptors. The data support the presence of short-wavelength sensitive opsins from blue light and long-wavelength sensitive opsin from green light in the CPRs. The new data provided here allow the possibility of further investigations into regarding the physiological role of caudal photoreceptors in the crayfish.

Author Contributions

L.R.-S. conceived the experiments, interpreted of the results, and wrote the draft manuscript. J.C.S.-H., J.A.P.-O., and G.C.-R. conducted experiments, acquisition, data analysis, and interpretation of results. E.V.-V. assisted in drafting and revising of the manuscript. All authors approved the final version of the manuscript.

Funding

This study was supported by the Facultad de Medicina, UNAM grant 086/2016, and PAPIIT-UNAM Grant IN214817 to LRS.

Acknowledgments

The authors wish to acknowledge Carlos Jesús Román Moreno. Laboratorio de Pulsos Ultracortos, Centro de Ciencias Aplicadas y Desarrollo Tecnológico, UNAM for their invaluable technical help in calibrating the lamps. The authors also want to thank Josefina Bolado, Head of the Scientific Paper Translation Department, from División de Investigación at Facultad de Medicina, UNAM, for editing the English-language version of this manuscript.

Conflicts of Interest

The authors declare no conflict of interest.

References

  1. Rodríguez-Sosa, L.; Calderón-Rosete, G.; Flores, G. Circadian and ultradian rhythms in the crayfish caudal photoreceptor. Synapse 2008, 62, 643–652. [Google Scholar] [CrossRef] [PubMed]
  2. Rodríguez-Sosa, L.; Calderón-Rosete, G.; Anaya, V.; Flores, G. The caudal photoreceptor in crayfish: An overview. In Photoreceptors: Physiology, Types and Abnormalities; Akutagawa, E., Ozaki, K., Eds.; Nova Science Publishers, Inc.: New York, NY, USA, 2012; pp. 59–78. ISBN 978-1-61942-619-1. [Google Scholar]
  3. Nilsson, D.E. The evolution of eyes and visually guided behaviour. Philos. Trans. R. Soc. B 2009, 364, 2833–2847. [Google Scholar] [CrossRef] [PubMed] [Green Version]
  4. Thommen, Q.; Pfeuty, B.; Schatt, P.; Bijoux, A.; Bouget, F.Y.; Lefranc, M. Probing entrainment of Ostreococcus tauri circadian clock by green and blue light through a mathematical modeling approach. Front. Genet. 2015, 6, 65. [Google Scholar] [CrossRef] [PubMed]
  5. Sullivan, J.M.; Genco, M.C.; Marlow, E.D.; Benton, J.L.; Beltz, B.S.; Sandeman, D.C. Brain photoreceptor pathways contributing to circadian rhythmicity in crayfish. Chronobiol. Int. 2009, 26, 1136–1168. [Google Scholar] [CrossRef] [PubMed]
  6. Rodríguez-Sosa, L.; Calderón-Rosete, G.; Ortega-Cambranis, A.; De-Miguel, F.F. Octopamine cyclic release and its modulation of visual sensitivity in crayfish. Comp. Biochem. Physiol. A Mol. Integr. Physiol. 2017, 203, 83–90. [Google Scholar] [CrossRef] [PubMed]
  7. Strauss, J.; Dircksen, H. Circadian clocks in crustaceans: Identified neuronal and cellular systems. Front. Biosci. 2010, 15, 1040–1074. [Google Scholar] [CrossRef]
  8. Kennedy, D. Physiology of photoreceptor neurons in the abdominal nerve cord of the crayfish. J. Gen. Physiol. 1963, 46, 551–572. [Google Scholar] [CrossRef] [PubMed]
  9. Wilkens, L.A. The crayfish caudal photoreceptor: Advances and questions after the first half century. J. Comp. Physiol. 1988, 91, 61–68. [Google Scholar] [CrossRef]
  10. Simon, T.W.; Edwards, D.H. Light-evoked walking in crayfish: Behavioral and neuronal responses triggered by the caudal photoreceptor. J. Comp. Physiol. A 1990, 166, 745–755. [Google Scholar] [CrossRef]
  11. Wilkens, L.A.; Larimer, J.L. Photosensitivity in the 6th abdominal ganglion of decapod crustaceans: A comparative study. J. Comp. Physiol. A 1976, 106, 69–75. [Google Scholar] [CrossRef]
  12. Larimer, J.L. The interneurons of the abdominal positioning system of the crayfish. Brain Behav. Evol. 2000, 55, 241–247. [Google Scholar] [CrossRef] [PubMed]
  13. Wilkens, L.A.; Larimer, J.L. The CNS photoreceptor of crayfish: Morphology and synaptic activity. J. Comp. Physiol. 1972, 80, 389–407. [Google Scholar] [CrossRef]
  14. Kruszewska, B.; Larimer, J.L. Specific second messengers activate the caudal photoreceptor of crayfish. Brain Res. 1993, 618, 32–40. [Google Scholar] [CrossRef]
  15. Gotow, T.; Nishi, T. A new photosensory function for simple photoreceptors, the intrinsically photoresponsive neurons of the sea slug. Onchidium. Front. Cell. Neurosci. 2009, 3, 18. [Google Scholar] [CrossRef] [PubMed]
  16. Hermann, H.T.; Olsen, R.E. Afferent stochastic modulation of crayfish caudal photoreceptor units. J. Gen. Physiol. 1968, 51, 534–551. [Google Scholar] [CrossRef] [PubMed]
  17. Edwards, D.H. Crayfish extraretinal photoreception. I. Behavioral and motorneuronal responses to abdominal illumination. J. Exp. Biol. 1984, 109, 291–306. [Google Scholar] [PubMed]
  18. Hermann, H.T.; Olsen, R.E. Dynamic statistics of crayfish caudal photoreceptors. Biophys. J. 1967, 7, 279–296. [Google Scholar] [CrossRef]
  19. Nesbit, S.C.; Van Hoof, A.G.; Le, C.C.; Dearworth, J.R. Extracellular recording of light responses from optic nerve fibers and the caudal photoreceptor in the crayfish. J. Undergrad. Neurosci. Educ. 2015, 14, A29–A38. [Google Scholar] [PubMed]
  20. Kingston, A.C.N.; Cronin, T.W. Short- and long-wavelength-sensitive opsins are involved in photoreception both in the retina and throughout the central nervous system of crayfish. J. Comp. Physiol. A 2015, 201, 1137–1145. [Google Scholar] [CrossRef] [PubMed]
  21. Kingston, A.C.N.; Cronin, T.W. Diverse distributions of extraocular opsins in crustaceans, Cephalopods, and Fish. Integr. Comp. Biol. 2016, 56, 820–833. [Google Scholar] [CrossRef] [PubMed]
  22. Henze, M.J.; Dannenhauer, K.; Kohler, M.; Labhart, T.; Gesemann, M. Opsin evolution and expression in arthropod compound eyes and ocelli: Insights from the cricket Gryllus bimaculatus. BMC Evol. Biol. 2012, 12, 163. [Google Scholar] [CrossRef] [PubMed]
  23. Terakita, A.; Nagata, T. Functional properties of opsins and their contribution to light-sensing physiology. Zool. Sci. 2014, 31, 653–659. [Google Scholar] [CrossRef] [PubMed]
  24. Rogers, L.J. Preface. In Brain Asymmetry of Structure and/or Function, 1st ed.; Roger, L.J., Ed.; MDPI: Basel, Switzerland, 2017; p. vii. ISBN 978-3-03842-551-9. Available online: https://www.mdpi.com/journal/symmetry/special_issues/brain_asymmetry (accessed on 18 August 2018).
  25. Levin, M.; Klar, A.J.S.; Ramsdell, A.F. Introduction to provocative questions in left–right asymmetry. Philos. Trans. R. Soc. B 2016, 371, 20150399. [Google Scholar] [CrossRef] [PubMed] [Green Version]
  26. Hobert, O. Development of left/right asymmetry in the Caenorhabditis elegans nervous system: From zygote to postmitotic neuron. Genesis 2014, 52, 528–543. [Google Scholar] [CrossRef] [PubMed]
  27. Palmer, A.R. What determines direction of asymmetry: Genes, environment or chance? Philos. Trans. R. Soc. B 2016, 371, 20150417. [Google Scholar] [CrossRef] [PubMed]
  28. Tobo, S.; Takeuchi, Y.; Hori, M. Morphological asymmetry and behavioral laterality in the crayfish, Procambarus clarkii. Ecol. Res. 2012, 27, 53. [Google Scholar] [CrossRef]
  29. Takeuchi, Y.; Tobo, S.; Hori, M. Morphological asymmetry of the abdomen and behavioral laterality in atyid shrimps. Zool. Sci. 2008, 25, 355–363. [Google Scholar] [CrossRef] [PubMed] [Green Version]
  30. Angilletta, J.M.; Wilson, R.S. Cryptic asymmetry: Unreliable signals mask asymmetric performance of crayfish weapons. Biol. Lett. 2012, 8, 551–553. [Google Scholar] [CrossRef] [PubMed]
  31. Kondoh, Y.; Hisada, M. Neuroanatomy of the terminal (sixth abdominal) ganglion of the crayfish, Procambarus clarkii (Girard). Cell Tissue Res. 1986, 243, 273–288. [Google Scholar] [CrossRef]
  32. Mulloney, B.; Tschuluun, N.; Hall, W.M. Architectonics of crayfish ganglia. Microsc. Res. Tech. 2003, 60, 253–265. [Google Scholar] [CrossRef] [PubMed]
  33. Hermann, H.T. Analysis of the properties of the crayfish caudal photoreceptor (PRU-photoreceptor unit). In Experiments in Physiology and Biochemistry; Kerkut, G.A., Ed.; Academic Press: London, UK, 1972; Volume 3, pp. 155–192. [Google Scholar]
  34. Pacheco-Ortiz, J.A.; Sánchez-Hernández, J.C.; Rodríguez-Sosa, L.; Calderón-Rosete, G.; Villagran-Vargas, E. Left-right asymmetry in firing rate of extra-retinal photosensitive neurons in the crayfish. Gen. Physiol. Biophys. 2018, 37, 13–21. [Google Scholar] [CrossRef] [PubMed]
  35. Van Harreveld, A. A physiological solution for fresh water crustaceans. Proc. Soc. Exp. Biol. Med. 1936, 34, 428–432. [Google Scholar] [CrossRef]
  36. Gold, C.; Henze, D.A.; Koch, C.; Buzsáki, G. On the origin of the extracellular action potential waveform: A modeling study. J. Neurophysiol. 2006, 95, 3113–3128. [Google Scholar] [CrossRef] [PubMed]
  37. Stein, R.B.; Pearson, K.G. Predicted amplitude and form of action potentials recorded from unmyelinated nerve fibers. J. Theor. Biol. 1971, 32, 539–558. [Google Scholar] [CrossRef]
  38. Pettersen, K.H.; Einevoll, G.T. Amplitude variability and extracellular low-pass filtering of neuronal spikes. Biophys. J. 2008, 94, 784–802. [Google Scholar] [CrossRef] [PubMed]
  39. Villagran-Vargas, E.; Ludu, A.; Hustert, R.; Jackson, A.; Heimburg, T. Periodic solutions and refractory period in the soliton theory for nerves and the locust femoral nerve. Biophys. Chem. 2011, 153, 159–167. [Google Scholar] [CrossRef] [PubMed]
  40. Kennedy, D. Responses from the crayfish caudal photoreceptor. Am. J. Ophthalmol. 1958, 46, 19–26. [Google Scholar] [CrossRef]
  41. Feudel, U.; Neiman, A.; Pei, X.; Wojtenek, W.; Braun, H.; Huber, M.; Moss, F. Homoclinic bifurcation in a Hodgkin-Huxley model of thermally sensitive neurons. Chaos 2000, 10, 231–239. [Google Scholar] [CrossRef] [PubMed]
  42. Berg, R.U.; Alaburda, A.; Hounsgaard, J. Balanced inhibition and excitation drive spike activity in spinal half-centers. Science 2007, 315, 390–393. [Google Scholar] [CrossRef] [PubMed]
  43. Mazzoni, A.; Broccard, F.D.; Garcia-Perez, E.; Bonifazi, P.; Ruaro, M.E.; Torre, V. On the dynamics of the spontaneous activity in neuronal networks. PLoS ONE. 2007, 2, e439. [Google Scholar] [CrossRef] [PubMed] [Green Version]
  44. Battelle, B.A. Simple eyes, extraocular photoreceptors and opsins in the American horseshoe crab. Integr. Comp. Biol. 2016, 56, 809–819. [Google Scholar] [CrossRef] [PubMed]
  45. Belanger, J.H. Temperature acclimation of the caudal photoreceptor response in the crayfish Orconectes rusticus (Girard). Can. J. Zool. 1988, 66, 1168–1171. [Google Scholar] [CrossRef]
  46. Masser, M.; Rouse, D. Australian Red Claw Crayfish; Southern Regional Aquaculture Center of the United States: Stoneville, MS, USA, 1997; Publication No. 244; 8p. [Google Scholar]
  47. Caplan, J.S.; Williams, A.H.; Marder, E. Many parameter sets in a multicompartment model oscillator are robust to temperature perturbations. J. Neurosci. 2014, 34, 4963–4975. [Google Scholar] [CrossRef] [PubMed]
  48. Marder, E.; Haddad, S.A.; Goeritz, M.L.; Rosenbaum, P.; Kispersky, T. How can motor systems retain performance over a wide temperature range? Lessons from the crustacean stomatogastric nervous system. J. Comp. Physiol. A 2015, 201, 851–856. [Google Scholar] [CrossRef] [PubMed]
  49. Serpico, D.; Frasnelli, E. Where the standard approach in comparative neuroscience fails and where it works: General intelligence and brain asymmetries. Comp. Cognit. Behav. Rev. 2018, 13, 95–98. [Google Scholar] [CrossRef]
  50. Lira-Oliver, A. Modulation of the intensity of the spectral components of polychromatic light within certain regions in space by passive methods by strategically using material optical properties and texture. Technologies 2018, 6, 11. [Google Scholar] [CrossRef]
  51. Van Diepen, H.C.; Foster, R.G.; Meijer, J.H. A Colourful Clock. PLoS Biol. 2015, 13, e1002160. [Google Scholar] [CrossRef] [PubMed]
  52. Tosini, G.; Ferguson, I.; Tsubota, K. Effects of blue light on the circadian system and eye physiology. Mol. Vis. 2016, 22, 61–72. Available online: http://www.molvis.org/molvis/v22/61 (accessed on 21 May 2018). [PubMed]
  53. Renart, A.; Machens, C.K. Variability in neural activity and behavior. Curr. Opin. Neurobiol. 2014, 25, 211–220. [Google Scholar] [CrossRef] [PubMed]
Figure 1. Simultaneous electrophysiological recordings for left and right caudal photoreceptors (CPR-L and CPR-R, respectively) from isolated ganglion. (a) Schematic of the sixth AG showing the connective between sixth and fifth abdominal ganglia, which were micro-dissected into left and right hemicords. The CPR produces contralateral dendritic branches, and the axon send projection along the ganglia chain. Here both photosensitive neurons were arbitrarily simplified; based on [11]. Extracellular recordings were performed using a suction electrode; adapted from [34]. (b) Recordings of multi-unit activity from the right hemicord. Arrows indicate basal activity of CPR-R. (c) Overdraw waveform of 30 spikes from CPR-R. (d) Recordings of multi-unit activity from the hemicord-left. Arrows show spontaneous activity of CPR-L. (e) Overdraw waveform of 30 spikes from CPR-L.
Symmetry 10 00389 g001
Figure 2. Firing rate from CPR-L and CPR-R in the dark, at room temperature. (a) Lines represent spikes; with asymmetric activity from CPRs clearly observed. CPR-L had higher spontaneous activity than CPR-R. (b) CPR-R displayed a chase opposes and higher spontaneous activity compared to CPR-L. Horizontal scale, 2 s. (c) Box plot for spike firing rate (impulses/s) from CPR-L, which had higher activity than CPL-R. (d) Box plot from firing rate (impulses/s) in another subgroup, where CPR-R expressed a higher spontaneous activity than CPR-L. Differences between subgroups are significant (*** = p < 0.001).
Symmetry 10 00389 g002
Figure 3. Spontaneous activity in the dark from CPRs determined at 14 °C. (a) In a subset, activity in darkness from CPR-L is diminished and slightly higher than for CPR-R. (b) In another subgroup, the CPRs also showed diminished activity at 14 °C, being slightly higher for CPR-R than CPR-L. These differences between subgroups are significant (*** = p < 0.001).
Symmetry 10 00389 g003
Figure 4. CPR photoresponse induced by blue light from two subgroups of isolated sixth AG adapted to darkness for 20 min at 24 °C. (a) Light-induced activity from CPR-L and CPR-R induced by using a pulse of 14.71 (log photons/cm²/s) by 4s; at bottom, a light pulse is indicated. (b) Light responsiveness from CPR-L and CPR-R caused by a pulse of 14.35 (log photons/cm2/s) by 4 s; a light pulse is indicated. (c) Comparison of the photoresponse expressed as ΔF (impulses/s) from CPR-L and CPR-R with respect to light intensity (log photons/cm2/s). Each of the values presented in the ordinates corresponds to the mean (±SE). Photoresponse for higher light intensity from CPR-L vs. CPR-R is clearly observed. (d) Comparison of light-induced activity vs. light intensity in another subgroup, where CPR-R expresses a higher light-induced activity regarding the CPR-L. These differences between subgroups are significant (* = p < 0.05, ** = p < 0.01).
Symmetry 10 00389 g004
Figure 5. Firing rate activity caused by blue light from the CPRs, quantified from 10 seconds at 24 °C. Box plot represents the variation (ΔF) in spike firing rate (impulses/s) from the caudal photoreceptor-left and the caudal photoreceptor-right. (a) The CPR-L shows a higher activity than CPR-R. (b) In contrast, there is another subgroup where CPR-R expresses a slight increase in light-induced activity in comparison to CPR-L. These differences between subgroups are significant (* = p < 0.05, ** = p < 0.01).
Symmetry 10 00389 g005
Figure 6. CPR photoresponse to blue light pulses was measured at 14 °C. (a) In this subgroup, significantly less light-induced activity and a higher response was observed for CPR-L compared to CPR-R. (b) In another subgroup, CPR showed increased light-induced activity at 14 °C, with a slight increase for CPR-R compared to CPR-L. These differences between subgroups are significant (* = p < 0.05, *** = p < 0.001).
Symmetry 10 00389 g006
Figure 7. CPR photoresponse depends on green light intensity. Isolated sixth AG was adapted to the dark for 20 min at 24 °C. (a) Photoresponse of CPR-L and -R due to a pulse of 14.75 (log photons/cm2/s) for 4 s. (b) Light responsiveness from CPR-L and -R from a pulse of 15.35 (log photons/cm2/s) for 4 s. (c) Comparison of photoresponses expressed as ΔF (impulses/s) from CPR-L and -R with respect to light intensity (Log photons/cm2/s). Each of the values presented in the ordinates correspond to the mean (±SE). Photoresponse to higher light intensities for CPR-L vs. CPR-R is clearly observed. (d) Comparison of light-induced activity vs. light intensity in another subgroup, where CPR-R showed a higher light-induced activity regarding the CPR-L. These differences between subgroups are significant (*** = p < 0.001).
Symmetry 10 00389 g007
Figure 8. CPR firing rate activity due to green light. Box plot represents the variation (ΔF) in spike firing rate (impulses/s) in CPR-L and -R quantified from 10 s. (a) CPR-L shows a higher photoresponse activity compared to CPR-R, at 24 (±1) °C. (b) In contrast, there is another subgroup where CPR-R expresses a slightly higher light-induced activity compared to CPR-L at 24 (±1) °C. These differences between subgroups are significant (*** = p < 0.001).
Symmetry 10 00389 g008
Figure 9. Photoresponse induced by monochromatic green light pulses from CPRs at 14 (±1) °C and represented by a box plot graph. (a) In a subset, the response from CPR-L is slightly higher than of CPR-R. Notice that in both left-right caudal photoreceptors, the firing rate diminished at 24 °C. (b) In another subgroup, CPR-R shows a significantly higher activity compared to CPR-L. Observe that both extraretinal photoreceptors show a slight increase in light-induced activity at 14 °C compared to 24 °C. These differences between subgroups are significant (* = p < 0.05, ** = p < 0.01).
Symmetry 10 00389 g009
Table 1. Extracellular parameter waveform spikes from the caudal photoreceptor from CPR-L, which had higher activity than CPR-R in darkness.
Spikes Mean (SD)nNormality Test (a)p-Valuet Statistic (b)Test Statistics Z (c)Pairwise Comparison
Amplitude (mV)CPR-L0.59 (0.03)300.682829×10⁻⁷ 6.58921p < 0.001
CPR-R0.42 (0.03)300.939460.08795
Time to peak (ms)CPR-L0.43 (0.09)300.952060.191893.00895 p < 0.01
CPR-R0.35 (0.11)300.95110.18091
Duration (ms)CPR-L1.98 (0.2)300.9840.91894 −3.17161p < 0.01
CPR-R2.17 (0.37)300.855158×10⁻⁴
(a) Shapiro–Wilk test. (b) Two sample t-test. (c) Mann–Whitney U-test.
Table 2. Extracellular parameter waveform spikes from the caudal photoreceptor, where CPR-R expressed a higher spontaneous activity than CPR-L in darkness.
Spikes Mean (SD)nNormality Test (a)p-Valuet Statistic (b)Test Statistics Z (c)Pairwise Comparison
Amplitude (mV)CPR-L0.32 (0.01)300.944460.11998 6.54584p < 0.001
CPR-R0.28 (0.02)300.775872×10⁻⁵
Time to peak (ms)CPR-L0.46 (0.10)300.952220.19377−4.03904 p < 0.001
CPR-R0.58 (0.12)300.977150.74575
Duration (ms)CPR-L3.03 (0.37)300.984940.93615−0.25296 p > 0.05
CPR-R3.06 (0.51)300.962270.35367
(a) Shapiro–Wilk test. (b) Two sample t-test. (c) Mann–Whitney U-test.
Table 3. Extracellular parameter waveform spikes from the caudal photoreceptor from CPR-L, which had higher activity than CPR-R with blue light pulses.
Spikes Mean (SD)nNormality Test (a)p-Valuet Statistic (b)Test Statistics Z (c)Pairwise Comparison
Amplitude (mV)CPR-L0.47 (0.03)150.944330.4399138.76548 p < 0.001
CPR-R0.14 (0.02)150.915130.16231
Time to peak (ms)CPR-L0.49 (0.13)150.925470.23327 2.57623p < 0.01
CPR-R0.36 (0.18)150.84210.01345
Duration (ms)CPR-L2.07 (0.29)150.91570.16567.17465 p < 0.001
CPR-R1.28 (0.31)150.954220.59316
(a) Shapiro–Wilk test. (b) Two sample t-test. (c) Mann–Whitney U-test.
Table 4. Extracellular parameter waveform spikes from the caudal photoreceptor, where CPR-R expressed a higher spontaneous activity than CPR-L with blue light pulses.
Spikes Mean (SD)nNormality Test (a)p-Valuet Statistic (b)Pairwise Comparison
Amplitude (mV)CPR-L0.68 (0.03)150.978720.960033.91696p < 0.001
CPR-R0.65 (0.02)150.946190.46662
Time to peak (ms)CPR-L0.5 (0.16)150.940790.392470.08234p > 0.05
CPR-R0.5 (0.15)150.947340.48351
Duration (ms)CPR-L2 (0.24)150.980850.974961.56449p > 0.05
CPR-R1.88 (0.19)150.938890.36857
(a) Shapiro–Wilk test. (b) Two sample t-test. (c) Mann–Whitney U-test.
Table 5. Extracellular parameter waveform spikes from the caudal photoreceptor from CPR-L, which had higher activity than CPR-R with green light pulses.
Spikes Mean (SD)nNormality Test (a)p-Valuet Statistic (b)Test Statistics Z (c)Pairwise Comparison
Amplitude (mV)CPR-L0.46 (0.07)150.796770.00334 4.64968p < 0.001
CPR-R0.14 (0.01)150.905230.11443
Time to peak (ms)CPR-L0.42 (0.11)150.910220.136452.65413 p < 0.05
CPR-R0.33 (0.09)150.946580.47229
Duration (ms)CPR-L1.89 (0.27)150.983790.988965.30763 p < 0.001
CPR-R1.25 (0.38)150.890330.06783
(a) Shapiro–Wilk test. (b) Two sample t-test. (c) Mann–Whitney U-test.
Table 6. Extracellular parameter waveform spikes from the caudal photoreceptor, where CPR-R expressed a higher spontaneous activity than CPR-L with green light pulses
Spikes Mean (SD)nNormality Test (a)p-Valuet Statistic (b)Test Statistics Z (c)Pairwise Comparison
Amplitude (mV)CPR-L0.59 (0.05)150.573641.47341 × 10−5 4.65747p < 0.001
CPR-R0.42 (0.02)150.935990.33457
Time to peak (ms)CPR-L0.43 (0.07)150.921840.205491.46147 p > 0.05
CPR-R0.39 (0.09)150.945040.44991
Duration (ms)CPR-L1.90 (0.14)150.944790.44638−3.88483 p < 0.001
CPR-R2.16 (0.21)150.956370.62964
(a) Shapiro–Wilk test. (b) Two sample t-test. (c) Mann–Whitney U-test.

