Influence of NaCl Concentration on Food-Waste Biochar Structure and Templating Effects


1
Division of Environment and Plant Engineering, Korea Institute of Civil Engineering and Building Technology, 283 Goyang- daero, Ilsanseo-gu Goyang-si, Gyeonggi-do 10223, Korea
2
Department of Construction Environment Engineering, University of Science and Technology, 217 Gajeong-ro, Yuseong-gu, Daejeon 34113, Korea
*
Author to whom correspondence should be addressed.
Energies 2018, 11(9), 2341; https://doi.org/10.3390/en11092341
Submission received: 3 August 2018
/
Revised: 30 August 2018
/
Accepted: 31 August 2018
/
Published: 5 September 2018
(This article belongs to the Special Issue Biomass Chars: Elaboration, Characterization and Applications Ⅱ)
Abstract
:Food-waste-derived biochar structures obtained through pyrolysis and with different NaCl concentrations were investigated. Increased NaCl concentration in the samples inhibited cellulose and lignin decomposition, ultimately increasing the biochar yield by 2.7% for 20%-NaCl concentration. NaCl added in solution state exhibited templating effects, with maximum increases in the Brunauer–Emmett–Teller (BET) surface area and pore volume of 1.23 to 3.50 m2∙g−1 and 0.002 to 0.007 cm3∙g−1, respectively, after washing. Adding a high concentration (20%) of NaCl reduced the BET surface area. In contrast, the mean pore diameter increased owing to the increased NaCl clustering area. Increased NaCl clustering with increased added NaCl was shown to have positive effects on NaCl removal by washing. Furthermore, as the NaCl adhered to the KCl scattered in the food waste, a high NaCl concentration also had positive effects on KCl removal. This study reports on an investigation on the effects of varying NaCl concentrations injected in solution form on the structure of food-waste biochar during pyrolysis. The templating effect was considered using both added NaCl and NaCl already contained in the food waste, with implementation of a desalination process essential for food-waste treatment for recycling.
1. Introduction
Carbon-negative biochar can be obtained from biomass via pyrolysis in an oxygen-limited environment [1]. Following the recent 2015 Paris Agreement, which expanded responsibility for greenhouse gas emissions mitigation to both developing and advanced countries, biochar production based on biowaste pyrolysis has become a novel alternative for biomass treatment [2,3,4].
The two main factors determining biochar characteristics are the physical properties of the raw material and the pyrolytic conditions (e.g., temperature, heating rate, and retention time) [5]. Pyrolysis methods can be broadly categorized into fast or slow techniques, respectively featuring a high heating rate of 100–1000 °C·s−1 to produce gas or oil or a low heating rate of 20–100 °C·min−1, which is more effective for biochar production [6,7].
The feedstocks most commonly used in commercial-scale or academic research are green waste materials, such as wood chips, crop residue, switch grass, and sugarcane, and organic wastes, such as sewage sludge and dairy manure [8]. For example, Van Zwieten et al. [9] reported the characteristics of biochar produced from papermill waste via slow pyrolysis at 550 °C, and Kloss et al. [10] analyzed the characteristics of slow pyrolysis for different sources (wheat straw, poplar wood, and spruce wood) at different temperatures (400, 460, and 525 °C). Furthermore, Ronsse et al. [11] compared different feedstocks, including pine wood, wheat straw, green waste, and dried algae, to analyze the corresponding characteristics of the resultant biochar obtained via slow pyrolysis. However, although various feedstocks were comparatively analyzed in previous studies, the feedstocks themselves were mostly limited to the waste of a single organic crop.
Food is the largest waste source containing a blend of various organics and can be a good energy source with high energy content [12]. However, establishing an appropriate recycling method is challenging, as the NaCl content of food waste necessitates specific treatments. At present, composting is the main treatment method for food waste. However, the presence of NaCl continues to affect the compost quality. According to a recent review on food-waste usage by Pham et al. [13], conversion into biochar may be a promising alternative for food-waste treatment, but there is a lack of research on pyrolysis compared to anaerobic digestion and hydrothermal carbonization. Lee et al. [14] verified the potential application of food-waste pyrolysis at 300–500 °C and desalination to biochar production. Nonetheless, the biochar characteristic dependence on the different food source must be investigated.
In Korea, despite seasonal and source differences due to unique food cultures, the average NaCl content of dried food-waste biomass is 3.45% [15]. This implies that desalination is a prerequisite to food-waste recycling, which may increase the value of biochar. Recently, studies using molten NaCl as a template for increasing porosity have been reported. Among them, Fechler et al. [16] generated a porous material by mixing eutectic NaCl with C material and washing the resulting substance with water, and Liu and Antonietti [17] used molten NaCl and glucose to generate a porous C structure. These reports suggest the possibility of a desalination technique that removes the NaCl already present in the food waste, similar to the activation process for activated carbon.
In this context, the present study investigated whether the same activation effects as those obtained for molten NaCl can be achieved by adding NaCl in solution form to food waste. The corresponding changes in biochar structure, Brunauer–Emmett–Teller (BET) surface area, and pore size were examined for varying NaCl concentrations.
2. Materials and Methods
2.1. Materials
Food-waste samples were prepared using data from the Korean Ministry of the Environment (Table 1) [18]. The food waste was broadly classified into grains, vegetables, fruits, and meat, consisting of 10 ingredients with weight percent (wt %) values of 16, 51, 14, and 19, respectively. Whole ingredients of food waste sample were raw except the cooked rice. And the weight measurements were made at room temperature (25 °C). The prepared samples were dried at 105 °C for 24 h and ground into powder.
2.2. Experimental Methods
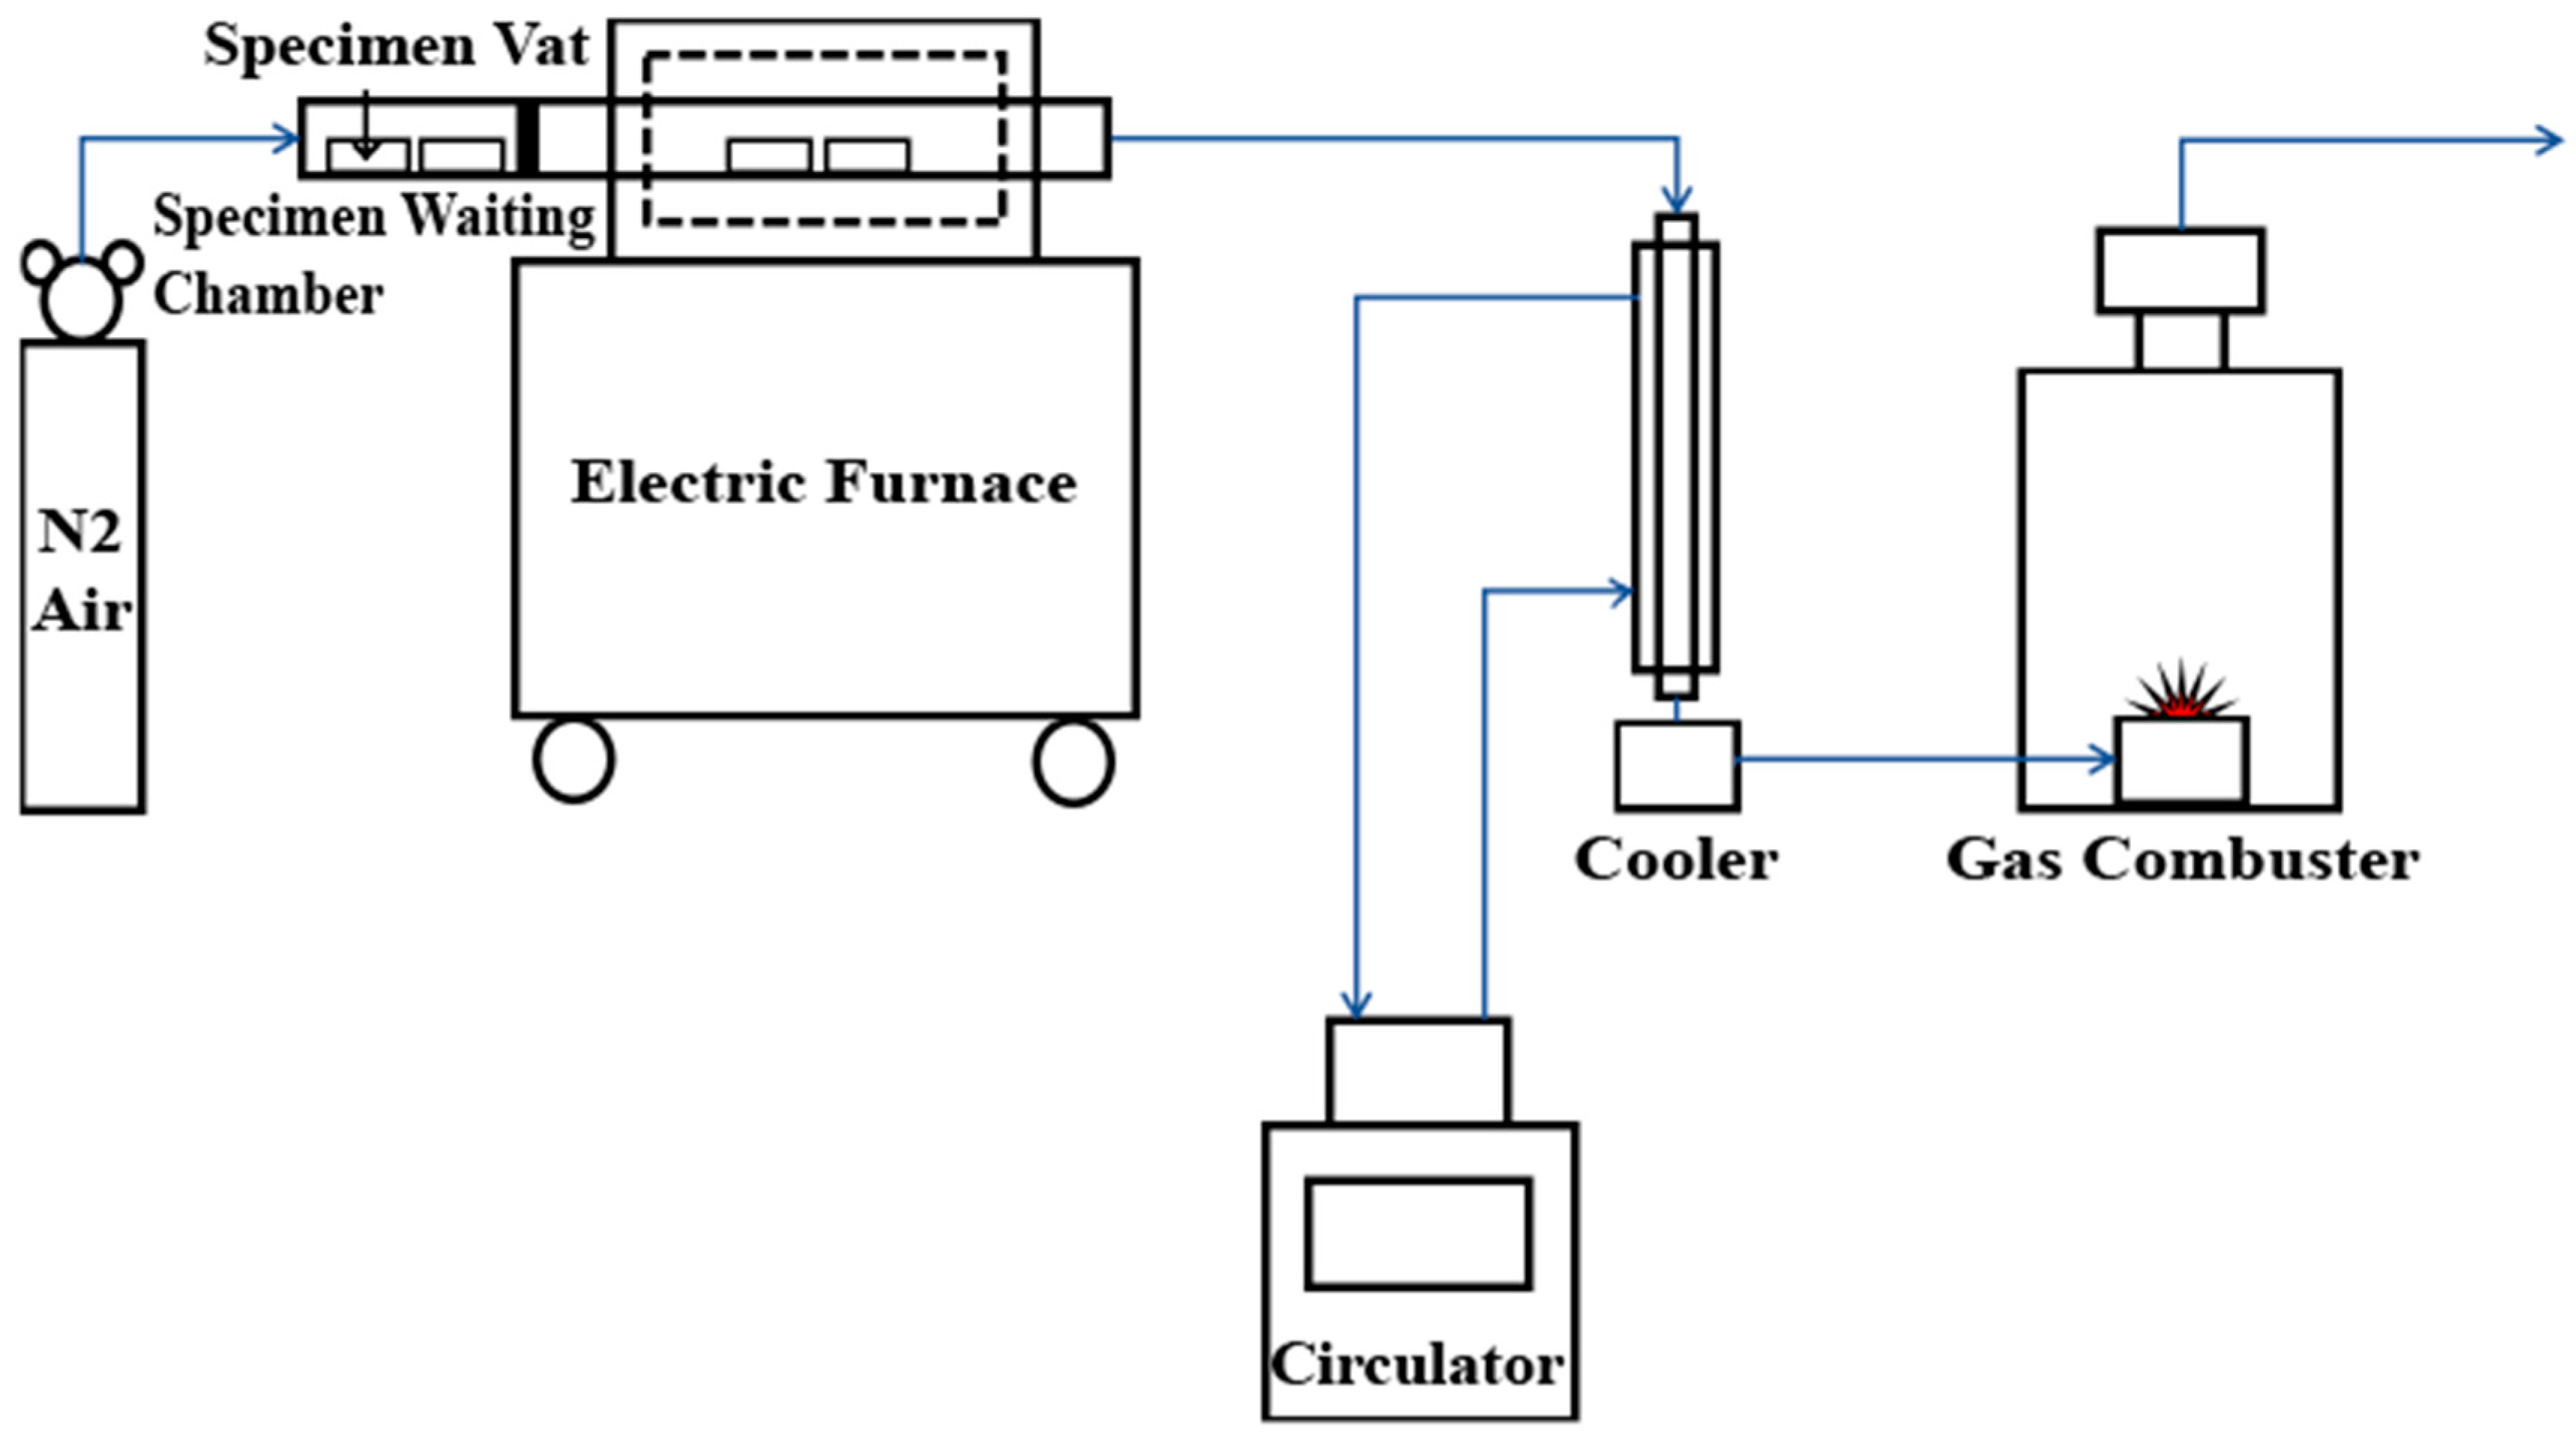
The experiment had four steps: sample preparation, NaCl injection and drying, pyrolysis, and washing. Each independent experiment was repeated twice, and the results were presented as mean values. Solutions of 5, 10, and 20% NaCl were added to 120 g dried food-waste samples, corresponding to 6.32, 13.34, and 15.00 g of NaCl dissolved in distilled water, respectively. The NaCl-free and 5, 10, and 20% NaCl-containing samples are referred to as the 0, 5, 10, and 20%-NaCl samples hereafter. The resulting mixtures were dried at 105 °C for 24 h. Next, the 0%-NaCl dried food samples and those impregnated with NaCl were placed in an electric furnace. The temperature was increased to 500 °C at 20 °C/min (the lowest speed of slow pyrolysis), and the pyrolysis was maintained for 1 h. To prevent sample oxidation, 99.99% N2 gas (SJGAS, Incheon, Korea) was continuously injected into the furnace at 10 L/min through the flowmeter. The samples were subsequently removed from the furnace and cooled at room temperature until the ambient temperature was reached, after which the produced char was weighed. Figure 1 is a schematic of the pyrolysis reactor used in the experiment.
To analyze and compare the differences in BET surface area among the samples, activated C was prepared as follows to be used as a control: For activation, 1 M sodium hydroxide (NaOH) solution was injected into a 0%-NaCl dried food sample at a 1:2 ratio. The sample was then dried at 105 °C before being subjected to pyrolysis under identical conditions as described above. Then, it was washed until the washing water reached pH 7 and dried.
2.3. Analysis Methods
2.3.1. Characterization Analysis Methods
When pyrolysis was complete, a CHNS analyzer (2400SeriesIICHNS/O, Perkin Elmer, Boston, MA, USA) was used to estimate the biochar elemental composition. Under the assumption that C + nitrogen (N) + O + sulfur (S) + hydrogen (H) + sodium (Na) + chlorine (Cl) = 100%, the O content was calculated using the equation 100 (%) − (C + N + S + H + Na + Cl) = O. To estimate the Cl content of the food-waste biochar, combustion ion chromatography (CIC; AQF-2100H, Mitsubishi Chemical Analytech, Chigasaki, Japan) was used. Note that, although CIC was found to be suitable for quantifying the 0%-NaCl biochar and the washed biochar from which the NaCl had been removed, the unwashed 5, 10, and 20%-NaCl biochar samples exceeded the CIC quantifiable range. This was because the NaCl concentrated during pyrolysis. Thus, the following Equation (1) was used, based on the quantified Na content:
To quantify the Na content of the biochar, atomic absorption spectroscopy (AAnalyst400, Perkin Elmer, Boston, MA, USA) was used.
2.3.2. Structural Analysis
BET and scanning electron microscopy (SEM)–energy dispersive X-ray (EDX) analyses were conducted to study the influence of the NaCl in the food waste on the biochar. The biochar microstructures were observed using SEM (Hitachi Ltd. S-4800 Ibaraki, Japan) with EDX (Oxford, EDX S-10, Abingdon, UK), and the BET surface areas were measured to check the templating effect before and after washing. The BET surface area was estimated based on N2 gas sorption analysis at 77 K using a specific surface analyzer (BELSORP-MAX, BEL Japan Inc, Osaka, Japan).
To investigate the structural changes in the food-waste-derived biochar according to NaCl concentration, X-ray diffraction (XRD; DMAX 2500, Rigaku, Tokyo, Japan; 18 kW, 60 kV/300 mA) was employed. The 2θ range recorded for the samples was 10–90 °C. To investigate the presence of NaCl in the biochar as well as its influence, the value for 99%-NaCl powder was estimated, which was compared with the Joint Committee on Powder Diffraction and Standards (JCPDS) entry for NaCl (5–628) to establish the standard value. Fourier transform infrared spectroscopy (FT-IR; VERTEX 80V, Bruker Optics, Billerica, MA, USA) was performed and the KBr pellet method was used, in which a 1 mg sample was mixed with KBr powder and pressurized into a thin film. The structure was analyzed by transmitting 400–4000 nm infrared waves. All biochar samples used in the experiment were analyzed without prior treatment.
3. Results and Discussion
3.1. Biochar Characterization
Table 2 lists the chemical compositions of the food-waste-derived biochar for each NaCl concentration. As the NaCl in biochar can be removed by washing, the biochar samples before and after washing were analyzed to study the changes. The biochars before washing were compared with the 0%-NaCl food-waste-derived biochar as a control. Increased NaCl content was found to be accompanied by decreased C, H, and N contents, whereas the Na and Cl were condensed to crystal form. This indicates that the NaCl injected in an ionized state in the solution formed NaCl crystals during the drying and pyrolysis processes, thereby concentrating the NaCl in the biochar and preventing evaporation during pyrolysis. Regarding the post-wash compositions, the C, H, and N contents increased again in a trend similar to that in the control, whereas the Na and Cl contents decreased. This indicates that, although the increased NaCl content per unit weight made it seem as if the relative C, H, and N contents had decreased, the atomic content per unit weight of these materials was recovered as the washing removed the NaCl.
Comparison of the Na and Cl contents before and after washing showed that the washing removed most of the NaCl. The post-wash Na content in the 5, 10, and 20%-NaCl biochar was higher than that in the 0%-NaCl control. This may be attributed to the influence of the biochar cation exchange capacity, under which a proportion of the Na+ ions generated during washing adsorbed to the biochar [14]. Higher Cl content values were obtained for the 5 and 10%-NaCl biochar samples after washing compared to those of the 0%-NaCl biochar. However, the 20%-NaCl biochar exhibited similar contents to that of the control as the content decreased following washing. This similarity was due to the increased NaCl content of that specimen, which caused the NaCl to cluster rather than disperse. The SEM analysis (Section 3.2.2.) also confirmed that clustered NaCl crystals were scattered throughout the biochar for the 20%-NaCl biochar, whereas relatively small, scattered crystals were observed in the 5 and 10%-NaCl biochar samples. In other words, for 5 and 10%-NaCl content, the crystals were bound to the biochar in a scattered state, and complete NaCl removal through washing was difficult. However, for 20%-NaCl content, a large number of clustered NaCl crystals was obtained. Thus, complete removal is possible.The biochar yield, calculated as follows Equation (2):
As Table 3 indicates, the food-waste biochar yield after NaCl injection was higher than that for NaCl-free food waste in general. Further, as the impregnated NaCl content increased, the char yield increased. In other words, the NaCl injection influenced the pyrolysis, thereby affecting the char yield.
3.2. Structural Analysis
3.2.1. Brunauer–Emmett–Teller Analysis and Pore Size Distribution
Table 4 lists the BET surface area and pore analysis results for the biochar. For the NaCl-free (0%) biochar, the BET surface area was 1.226 m2·g−1. For the NaCl-containing biochar, increases in both BET surface area and pore volume after washing were observed, with differences according to NaCl content. This phenomenon was due to the empty spaces following NaCl removal by washing. Note that the SEM results discussed below (Section 3.2.2.) provide additional support for these findings.
When the total pore and mesopore volumes were compared, almost identical values were obtained; thus, most pores were mesopores. The approximately two-fold increase in mesopore volume after washing also indicated that the mesopores were likely to have been caused by NaCl. The average pore diameter of washed sample is lower than unwashed sample. The average pore dimeter before washing is not induced by NaCl but generated by the volatilization of organic matter. On the other hand, the pore diameter after washing is contained the pore induced by NaCl templating effect. In Section 3.2.2. showed that a single NaCl crystal size is about 2 nm. Therefore the average pore diameter is decreased after washing since the relatively small pore created by NaCl templating effect.
In contrast to the increase in total pore and mesopore volumes with increased NaCl content, the BET surface area exhibited a decreasing trend. An initial increase accompanied the NaCl content increase from 5 to 10%, but this was followed by a decrease when 20%-NaCl content was reached. This is thought to have been due to the excess NaCl allowing the clustered NaCl to exceed the large dispersion of NaCl. In other words, the higher the NaCl content was, the larger the NaCl crystals were; this yielded pores with a larger diameter and volume when the NaCl was removed. In contrast, the BET surface area decreased because of the growth of large mesopores instead of the even dispersion of relatively small mesopores.
There are other studies using NaCl as a template and washing as an activation process. Liu and Antonietti [17] used molten NaCl injected into a single source type, and Lu et al. [19] injected small-particle NaCl powder. But, these approaches differ from that of the present study. The findings of this study suggest that NaCl in solution form can have templating effects, and that the washing process induced activation effects.
In terms of competence, the BET surface areas and pore volumes observed in this study are not comparable to those of activated carbon. To explain this difference, the same sources were used in an experiment in which the activation method was implemented; the results are listed in the bottom row of Table 4. NaOH samples were prepared for activation by NaOH injection, followed by drying and pyrolysis at 500 °C, as in the main experiment. Washing was subsequently performed for neutralization. Between the biochar samples activated using 10%-NaCl and NaOH, the NaOH-treated biochar had a larger pore diameter. However, the difference in BET surface area was not substantial (0.414 m2·g−1). Despite the increased pore diameter, the small increase in BET surface area for NaOH activation may indicate increased pore depth compared to activation based on NaCl crystals.
Studies investigating NaOH activation have reported high BET values for a single organic crop waste source, e.g., fir wood (380 (m2/g)) [20], coconut shell (1842 (m2/g)) [21], and flamboyant pods (1076 (m2/g)) [22]. However, Dai et al. [23] obtained low BET surface area values (12.73 and 12.99 (m2·g−1)) for livestock excretion as a source. This indicates that the BET surface area deviates significantly according to the source, and a lower BET surface area is generally produced when a mixed source is employed. The results of NaCl activation in this study indicate lower BET values than those of the abovementioned studies. However, the overall BET surface area reduction is likely to have resulted from the raw material and not the activation method, based on the comparison with NaOH activation.
3.2.2. Scanning Electron Microscopy Analysis
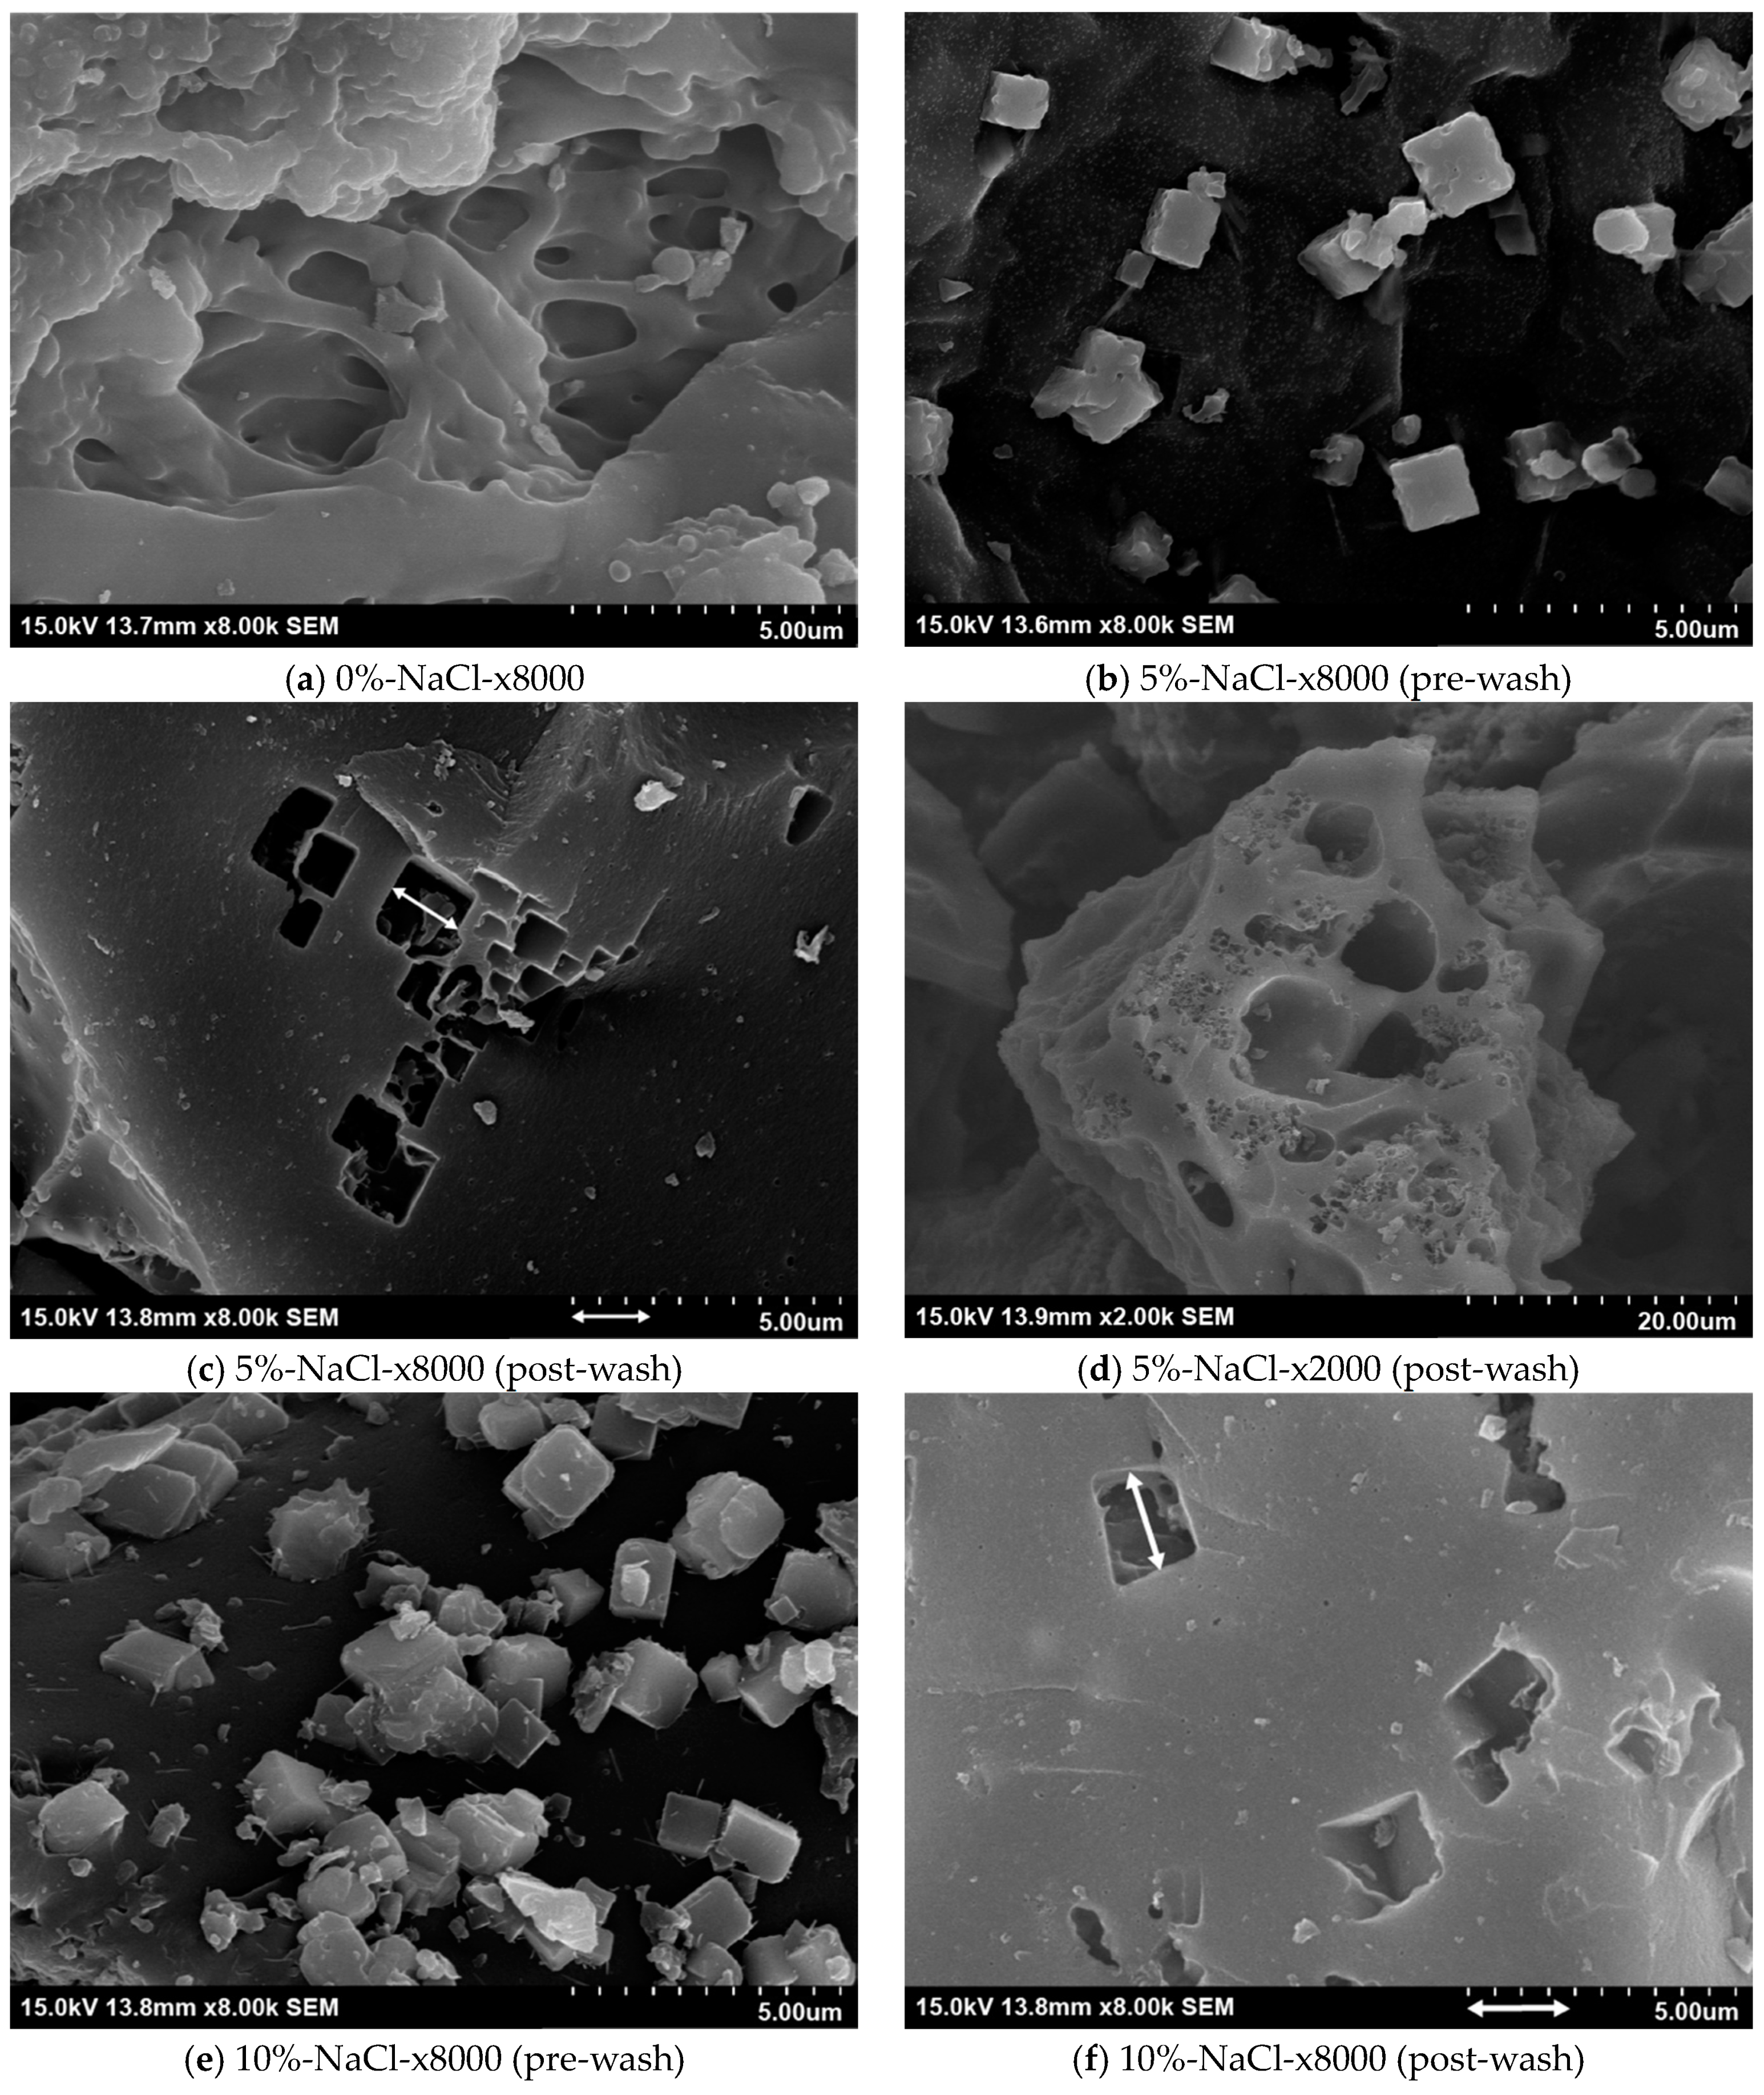
Figure 2 presents images at different magnifications taken before and after biochar washing according to NaCl content. The NaCl crystals are embedded in the biochar surface. In the pre-wash images, the NaCl crystals are clustered together, except for the 20%-NaCl case, in which they are scattered. When crystals cluster, larger pores remain when they are removed through washing. The post-wash images show square-shaped pores identical to the NaCl crystals on the biochar surface. The pore diameter increased from 1.4 to 1.77 and then to 2.3 nm for NaCl contents of 5, 10, and 20%, respectively. In other words, the NaCl injected into the food waste occupied the interparticle spaces, thereby exerting a templating effect that created pores as it left the spaces upon washing. Higher NaCl content corresponded to larger crystals; hence, larger pores were created. The results also suggest that templating effects can be produced using NaCl in solution in addition to molten NaCl.
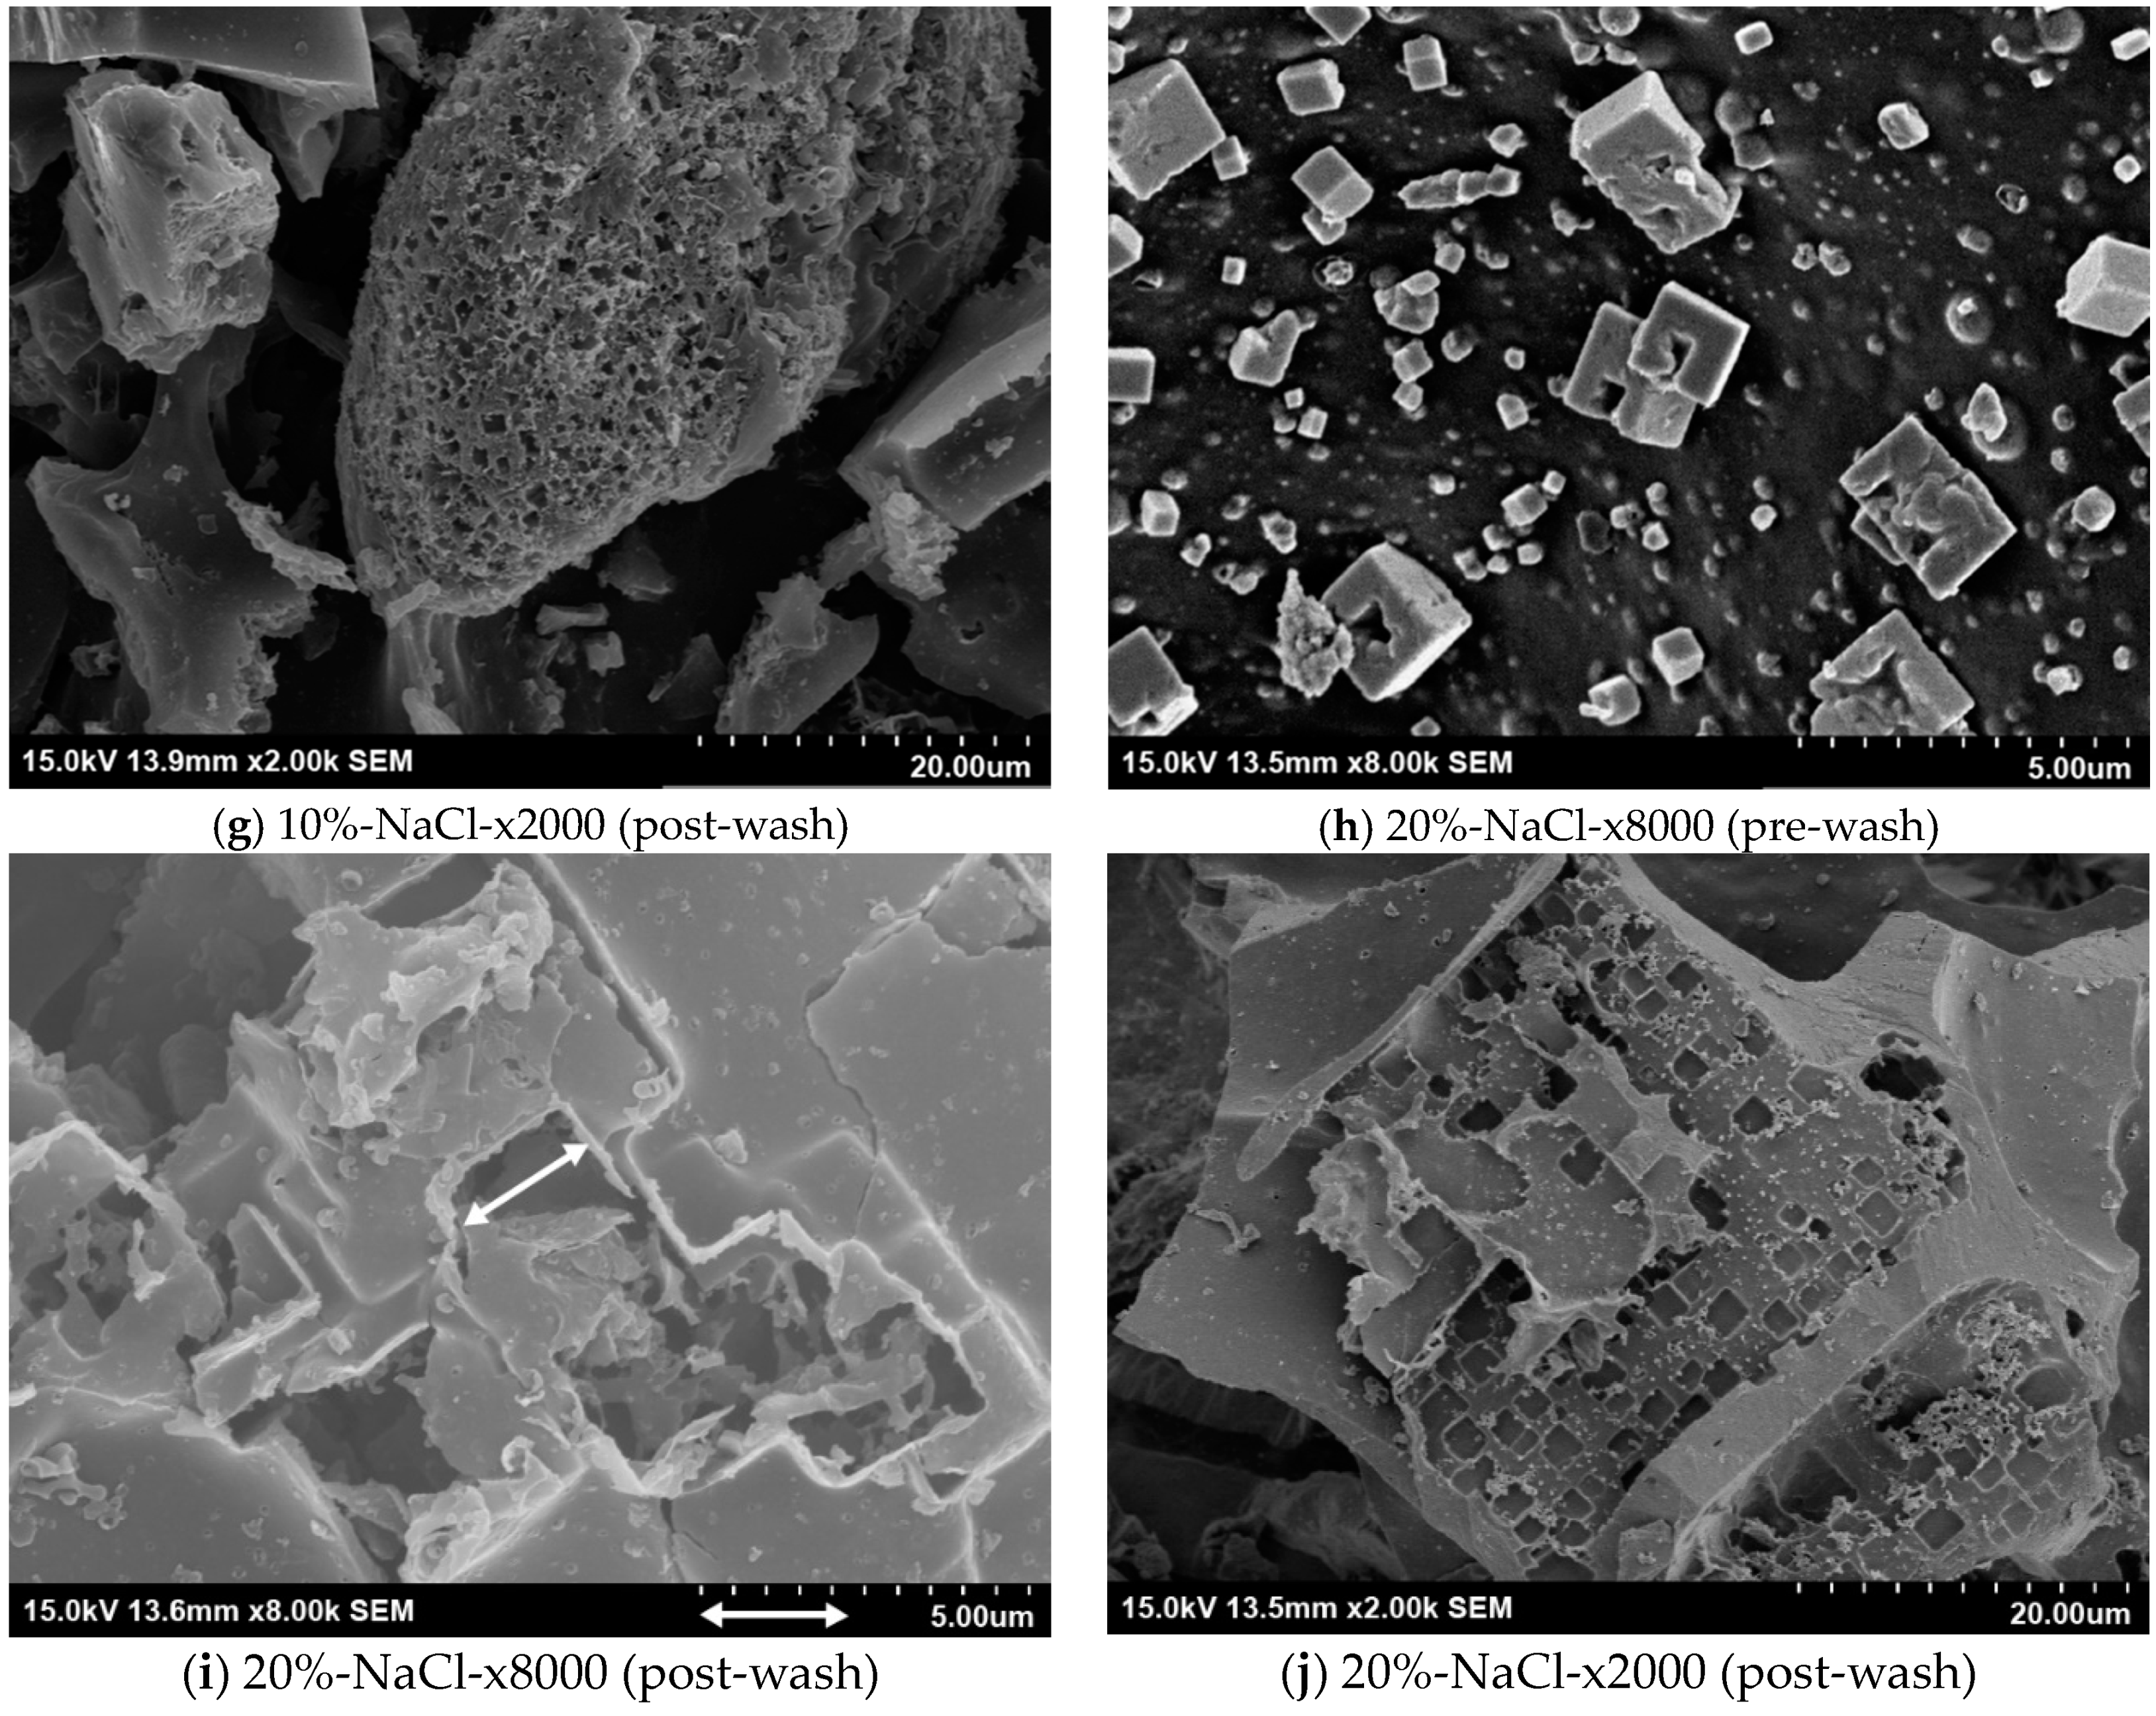
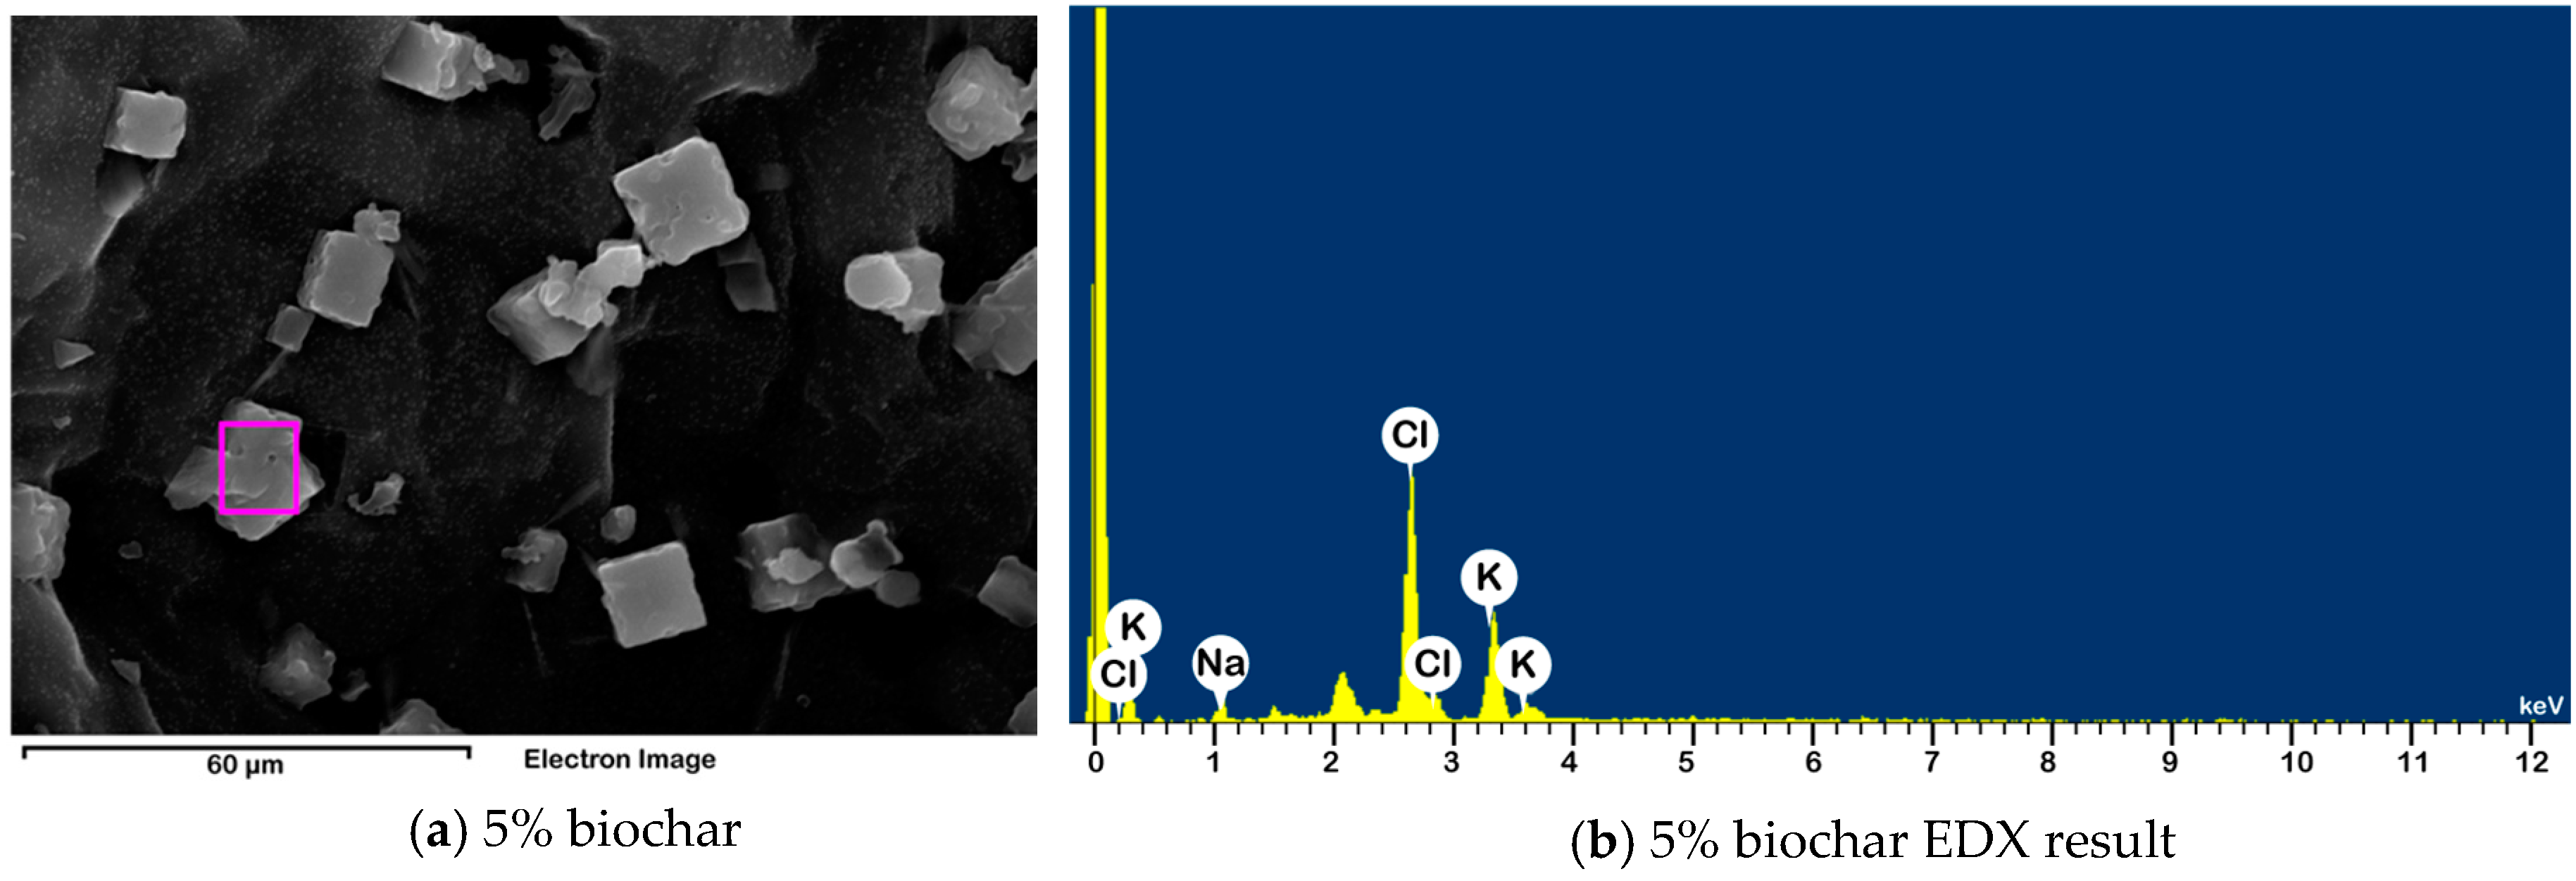
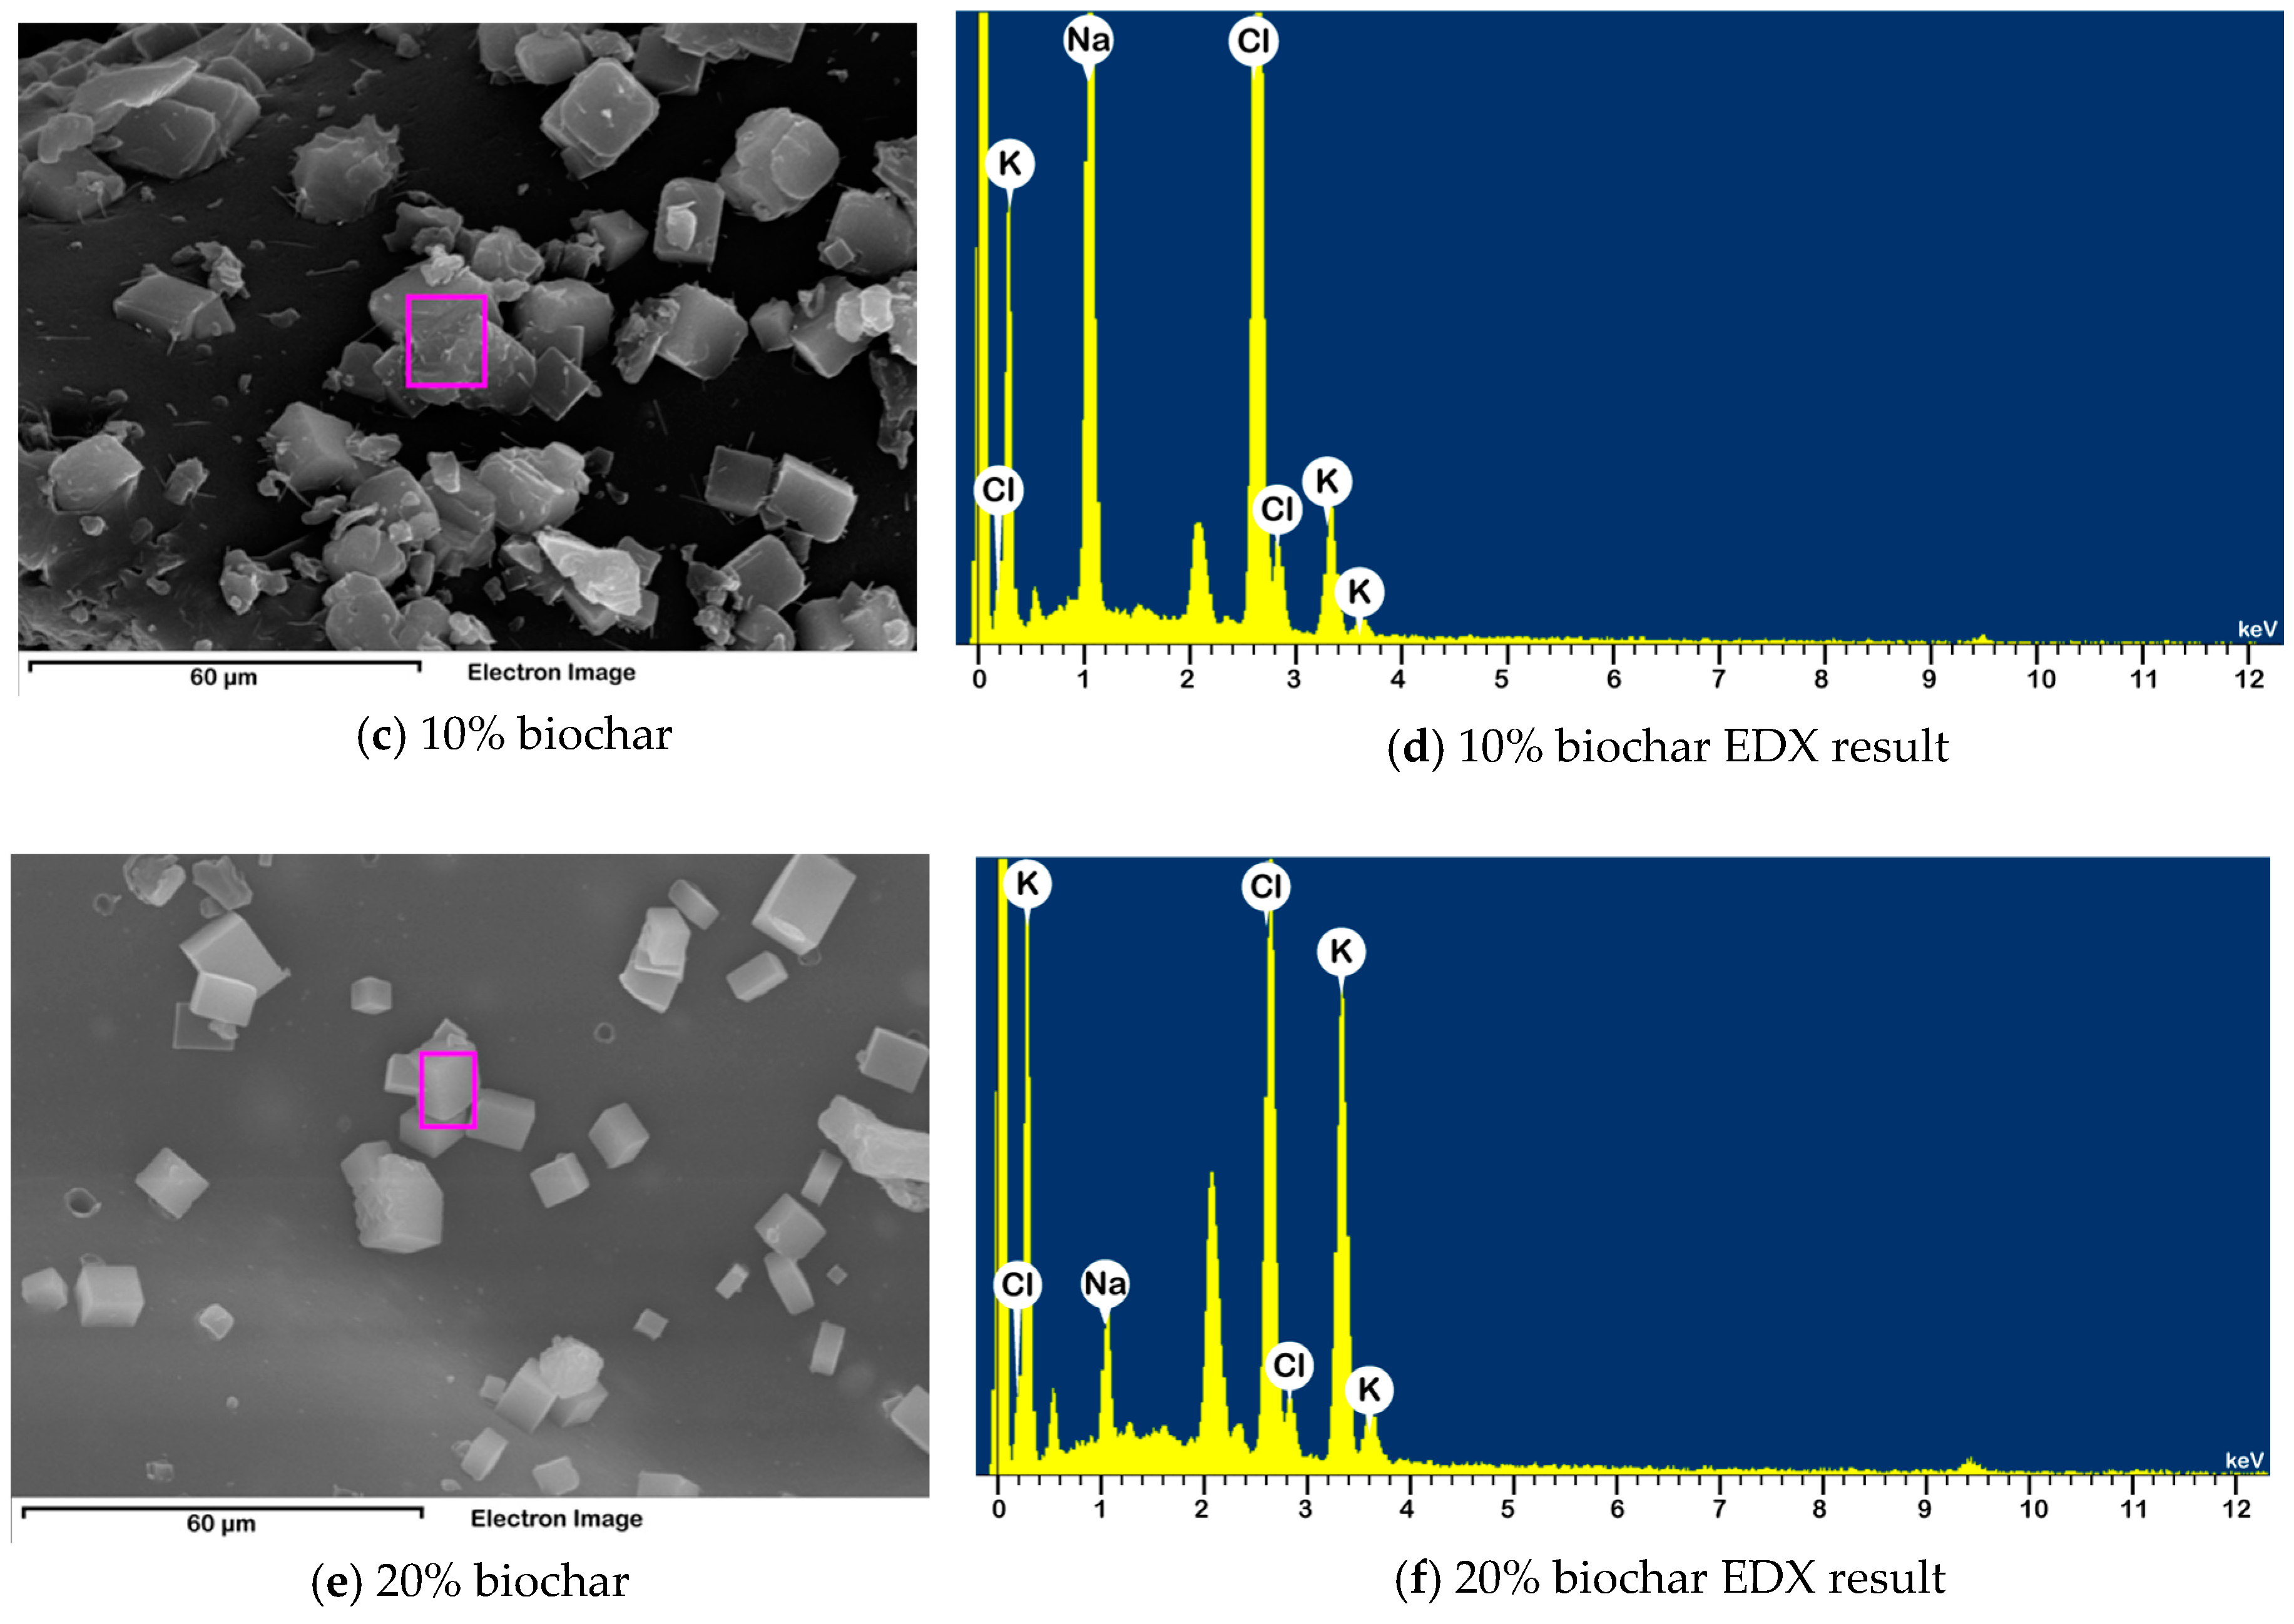
The EDX results of a marked range of figures (a), (c), and (e) in Figure 3 are shown in (b), (d), and (f) in Figure 3, respectively. The EDX results in Figure 3 indicate the places where intercrystal fusion or binding occurred; peaks corresponding to Na, K, and Cl can be seen together. One possible explanation for this phenomenon is the formation of a novel crystal shape upon binding. This may occur through the reformation of some crystals during sintering, as the melting point decreases when sylvite (KCl) and NaCl coexist [24] or through fusion of the injected NaCl and KCl already present in the food sample.
3.2.3. Fourier Transform Infrared Analysis
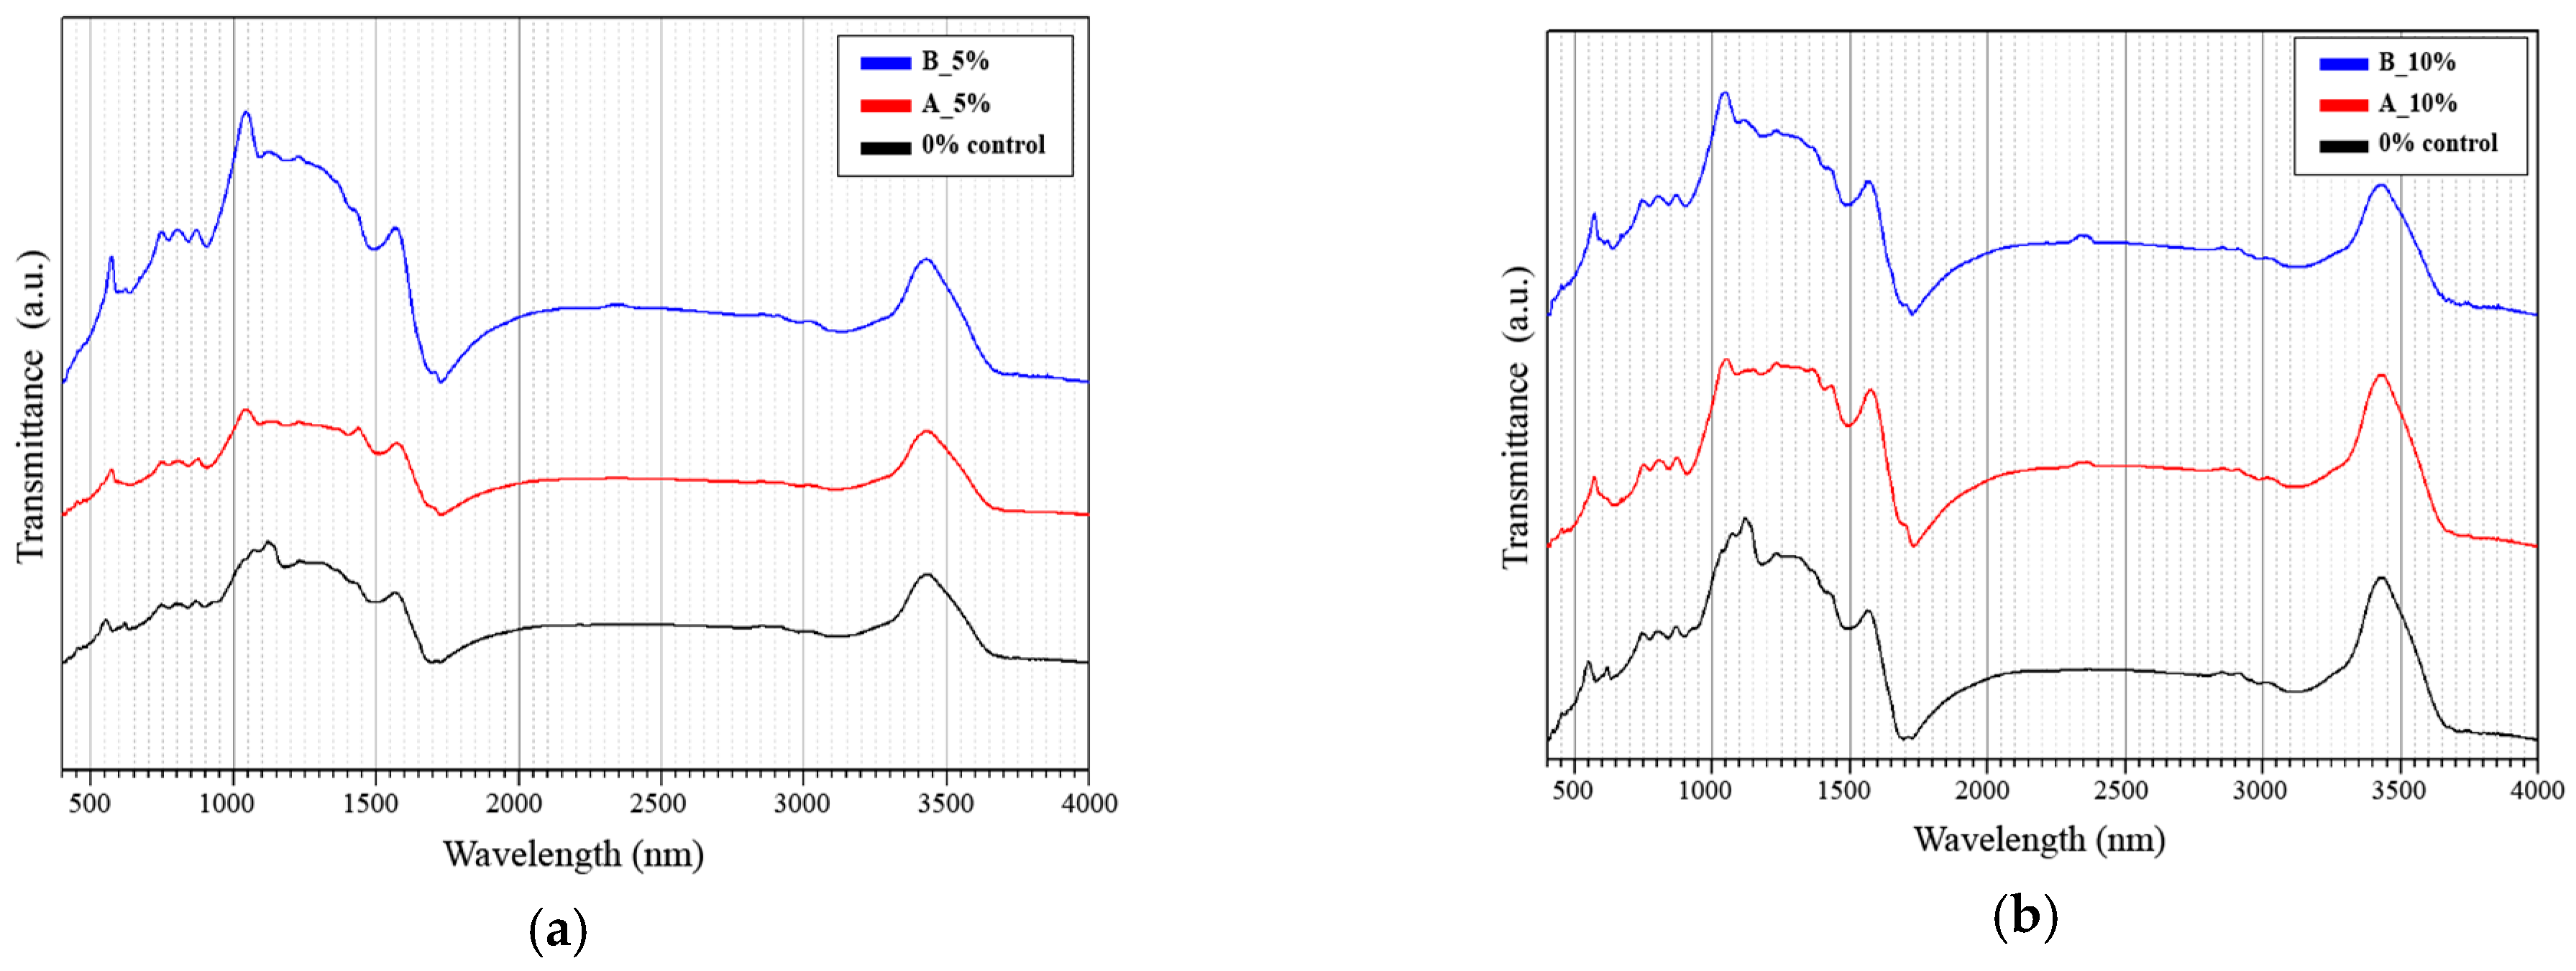
The results of the FT-IR analysis of the biochar according to NaCl content are presented in Figure 4. For the 0%-NaCl biochar sample, a peak appeared at 550 cm−1. For the biochar samples containing NaCl that underwent pyrolysis, a peak appeared at 570 cm−1, as if the peak at 550 cm−1 had shifted to the right. Vandecandelaere et al. [25] reported that peaks at 550 cm−1 indicate the presence of HPO42− ions, whereas peaks at 575 cm−1 are related to PO43− ions. Furthermore, Bekiaris et al. [26] showed that P=O stretching in hydroxyl apatite, apatite, and amorphous calcium phosphate dibasic in biochar yields 570-cm−1 peaks. In other words, if NaCl is present in the biomass during pyrolysis, phosphorus-compound decomposition to PO43− rather than HPO42− is induced. The peak at 520 cm−1 representing C-Cl bonding [27] and that at 646 cm−1 corresponding to C-Cl bending vibration [28] were not detected in the samples examined in this study. Therefore, the NaCl injection did not induce bonding with C.
The broad peak over the 700–1600 cm−1 range in Figure 4 indicates the presence of cellulosic and ligneous constituents. For the NaCl-free (0%) biochar, peaks appeared at 1030, 1070, and 1120 cm−1. With increased NaCl content, the peak at 1030 cm−1 shifted to the right, whereas that at 1120 cm−1 moved to 1130–1150 cm−1. The peaks at 1030 and 1120 cm−1 represent symmetric C-O stretching (cellulose, hemicellulose, and methoxy groups of lignin) and the symmetric C-O stretching characteristic of aliphatic C-O-C in the cellulose group, respectively [29,30]. The shifting of these peaks to the right indicated changes in cellulose from aliphatic C-O-C to alcohol C-O stretching or antisymmetric stretching of C-O-C (glycosyl), as the NaCl in the biochar induces hemolytic cleavage in cellulose [31]. During pyrolysis, cellulose generates levoglucosan production due to heterocyclic cleavage of the glycosidic linkage [31]. However, when NaCl is present, the glycosidic bond breaking is inhibited [31]. Thus, a peak representing the glycosidic linkage appears at 1130–1150 cm−1 for the NaCl-containing biochar.
Although the 0, 5, and 10%-NaCl biochar samples mostly displayed similar peaks, the 20%-NaCl biochar exhibited a phase that could be clearly distinguished. These peaks appeared more prominent at 1230 and 1370–1430 cm−1, positions respectively corresponding to the C-H and O-H bending frequencies in lignin [28,32,33]. The peaks at 2918 and 2850 cm−1 and 3000-3100 cm−1 became more distinct, respectively representing alkanes/aliphatic C-H stretching [34,35,36,37] and C-H stretching in aromatic compounds [38,39]. The peaks at 2918 and 2850 cm−1 are caused by alkyl adsorption and are strongest in the FT-IR spectra of lignin [40]. The peak at 3000–3100 cm−1, which corresponds to aromatic C-H stretching, is another peak appearing in the spectra of macromolecule units such as lignin [38]. In the present study, the finding that food-waste biochar with 20%-NaCl content produced more distinct peaks for lignin than biochar containing 5 or 10%-NaCl did can be taken to indicate that high NaCl content inhibits lignin degradation during pyrolysis. This is further supported by the fact that the peak at 1700 cm−1 corresponding to the carbonyl C=O stretching vibration in cellulose and lignin showed a minor increase for the 5 and 10%-NaCl biochar, whereas a marked increase was detected for the 20%-NaCl biochar. The high NaCl content of the latter probably inhibited the lignin degradation.
The presence of Na during pyrolysis acts as an inhibitor to the conversion of cellulose and lignin into levoglucosan [31,41]. As mentioned above, hemolytic cleavage is induced for cellulose, so that conversion into glycoladehyde and formic acid, rather than levoglucosan, occurs [31]. For lignin, degradation producing a guaiacol group is induced [41]. Thus, for food waste with high NaCl content, a competitive pathway is induced to replace the original degradation pathway, thereby inhibiting fast degradation of lignin and cellulose, and a proportion of these materials is left behind in the biochar. This increase in the residual lignin and cellulose may be interpreted as the cause of the increase in biochar yield reported in Section 3.1 and the increase in H content that accompanied the increase in NaCl content.
The peak at approximately 1560 cm−1 indicates C-N stretching and N-H bending [35,42,43]. The peaks in this region are especially strong for 20%-NaCl biochar, suggesting that high NaCl content may enhance N capture during pyrolysis. The peak representing a nitrile group at 2350 cm−1 is also absent from the 0%-NaCl biochar [28], but gains intensity as the NaCl content increases. This provides additional support for the positive effect of NaCl content on N capture. A possible explanation may lie in the protein coagulation caused by inorganic NaCl, although further research is required to determine the precise cause [44].
3.2.4. X-ray Diffraction Analysis
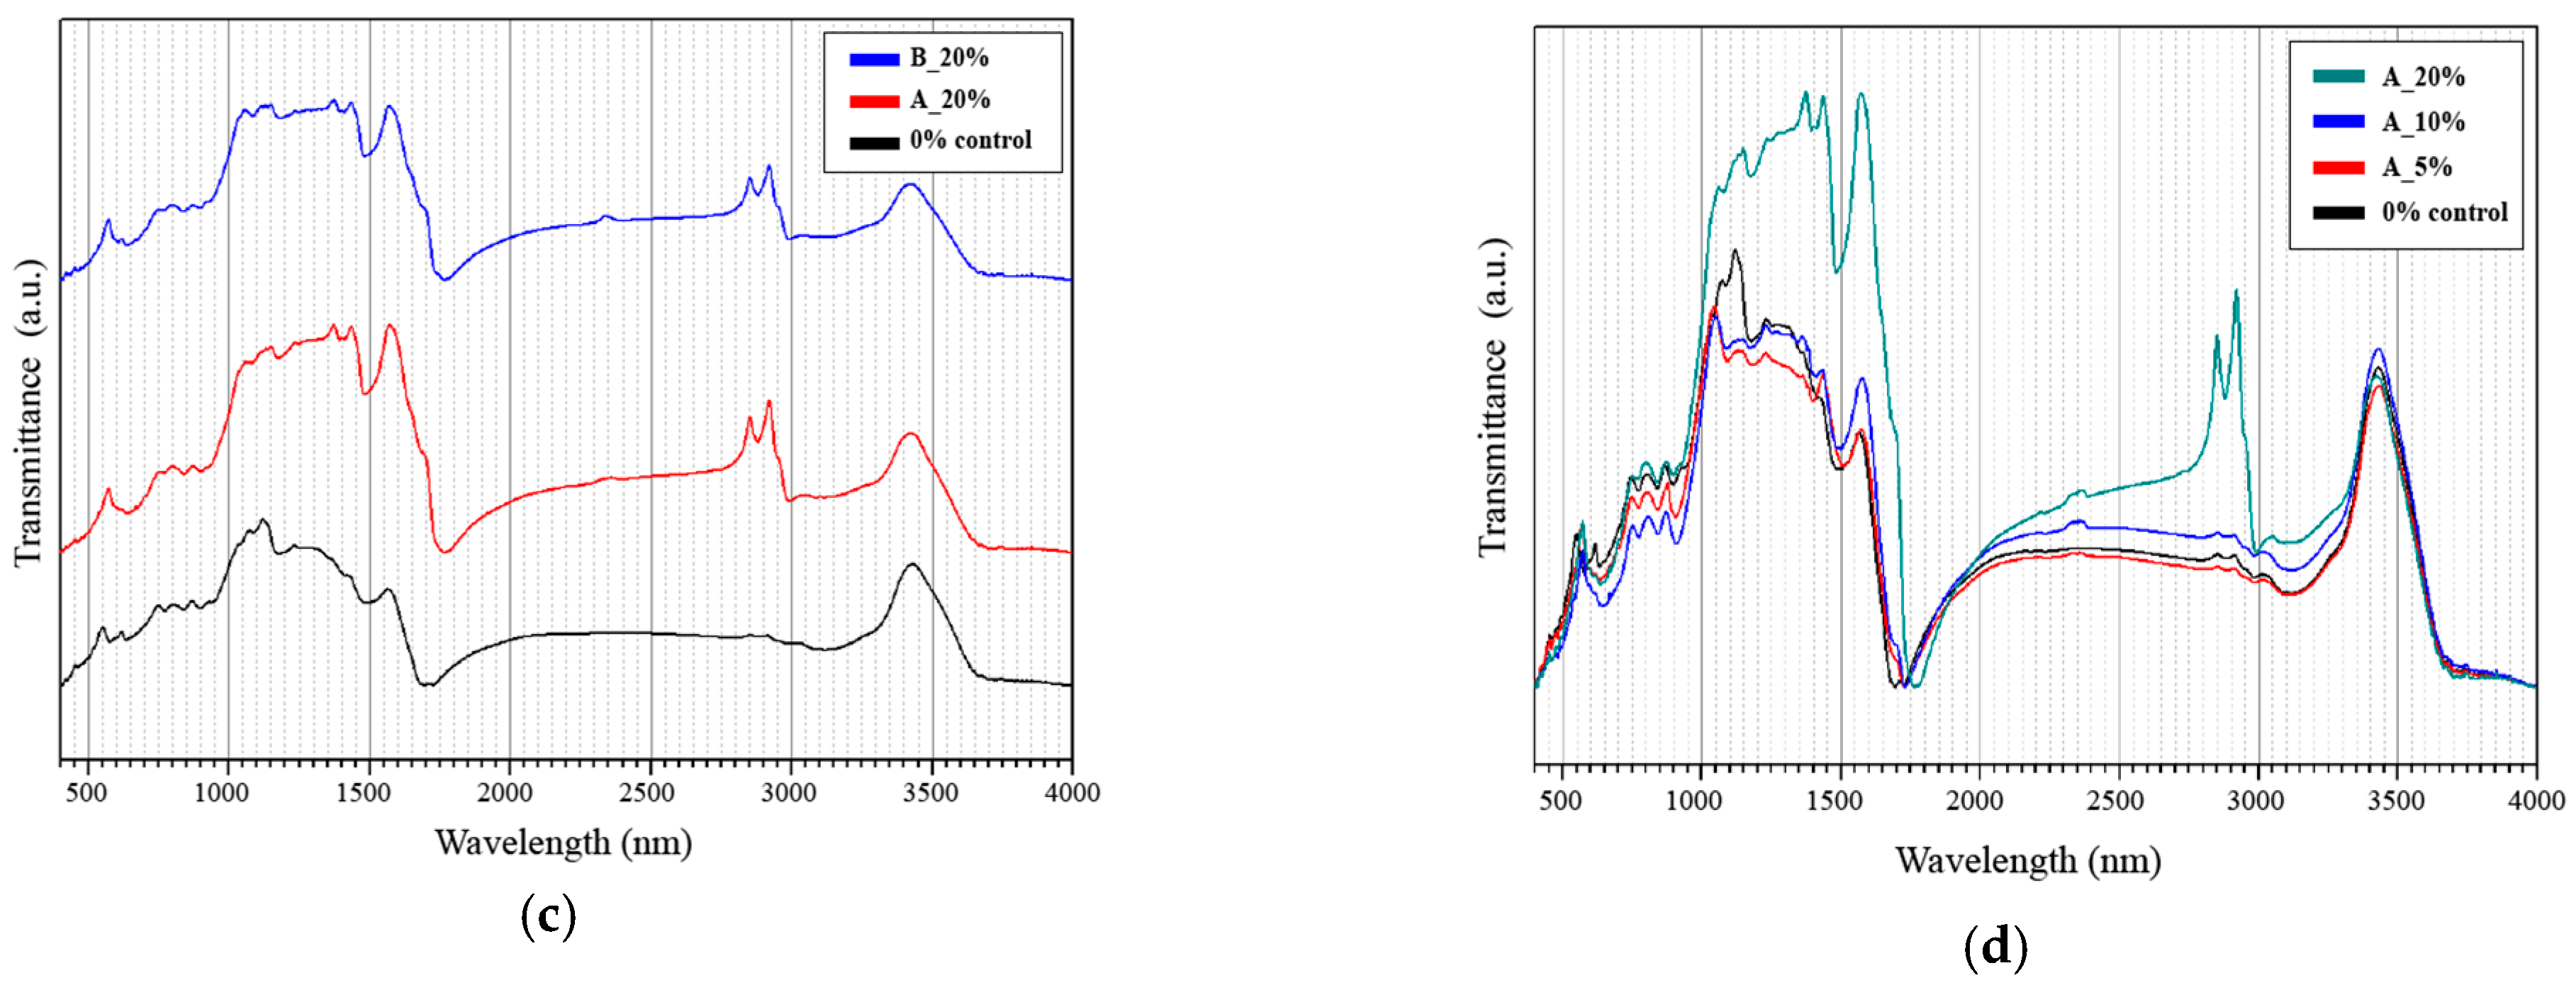
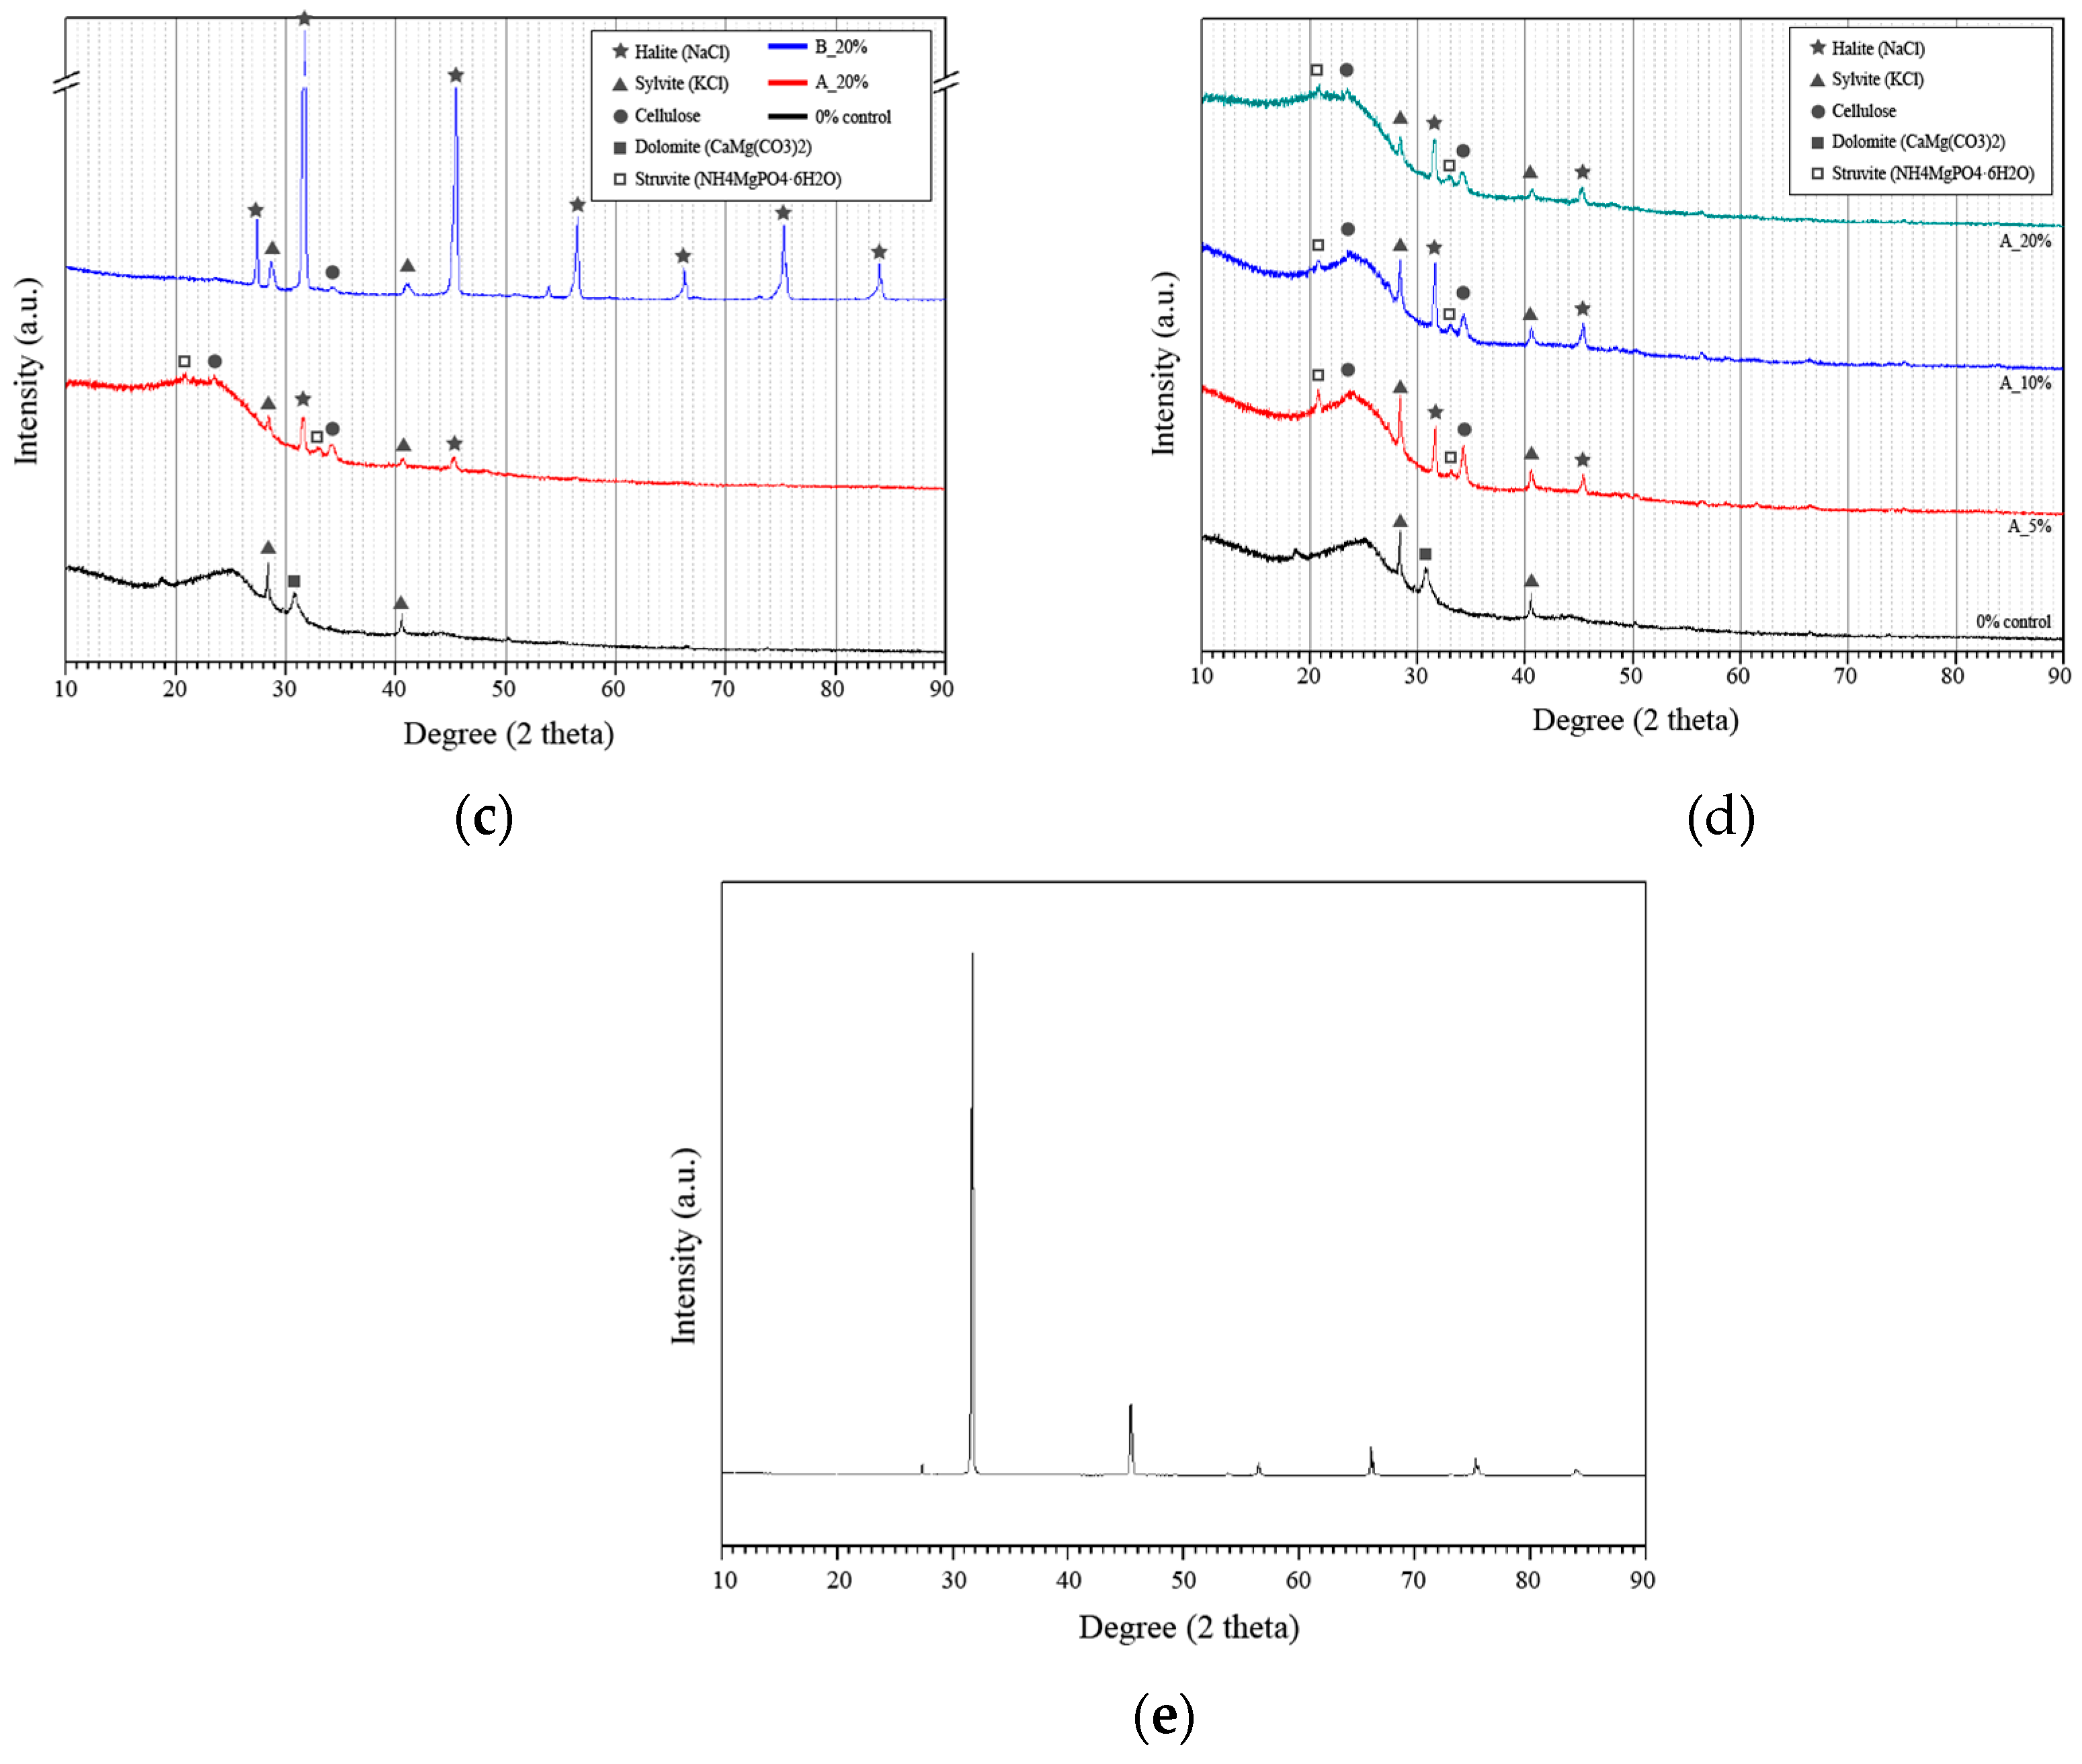
The results of the XRD analysis of the NaCl powder are presented in Figure 5e. The NaCl peaks appear at 27.4, 31.5, 45.5, 56.5, 65.5, 75.5, and 84°. In Figure 5, the XRD result for the 0%-NaCl food-waste biochar indicates peaks at 18.5, 28.4, 30.1, 40.5, 50.3, 66.5, and 74°, with a broad peak in the vicinity of 25°. To analyze the influence of the NaCl content on the biochar structure, the results shown in Figure 5a–d for the biochar samples with varying NaCl concentrations before and after washing were compared with those for the control 0%-NaCl biochar shown in Figure 5e.
Table 5 summarizes the XRD peaks for each sample. The pre-wash biochar samples clearly display NaCl peaks. For the post-wash biochar samples, the NaCl peaks either disappear or lose intensity, indicating that the washing removed most of the NaCl content. The pre-wash results indicate that increased NaCl content in the samples generally shifted the NaCl peak from 31.2 to 31.4 and 31.7°, i.e., from left to right, for 5, 10, and 20%-NaCl content, respectively. This shifting of the peak to a lower angle indicates expansion of the space lattice [45,46]. In the BET surface area analysis discussed above (Section 3.2.1.), the average post-wash pore diameter was found to increase with the NaCl content. The increased pore diameter following the NaCl removal indicates that the increase in NaCl content in turn increased the NaCl crystal size. In other words, the peak shifting from left to right may have been due to the increased crystal size reducing the expansion when the imparted energy was the same, so that a larger expansion occurred in the biochar with lower NaCl content because of the small crystal size.
The peaks at 3.14, 2.22, and 1.81 Å correspond to KCl (JCPDS #41–1476) [34,47]. Regardless of NaCl concentration, the peaks for the pre-wash biochar shifted to the right and then shifted back to the left after washing, being detected at 28.4° and 40.5°, i.e., the same positions as the KCl in the control. The peaks detected in the pre-wash biochar appeared in the position between standard KCl and halite. Note that, when KCl and NaCl are present together, the melting point decreases and reformation occurs during sintering [24]. As shown in Figure 3, the crystal cube shape was deformed for the K, Na, and Cl bindings.
According to Broström et al. [24], XRD analysis of a mixture of NaCl and KCl showed the KCl peaks shifting to the right compared to the standard, i.e., to 29 and 41°. This could be explained by partial binding between the NaCl injected into the food waste during pyrolysis and the KCl already present in the food waste, which caused the KCl peak to shift to the right (to 28.8 and 41°). This was followed by the emergence of peaks at 28.4 and 40.5° due to the independent KCl content remaining after washing, which removed only the KCl bound to NaCl. As Figure 5d shows, the larger the NaCl injection volume was, the smaller the KCl peak intensity was. The peak intensities at 28.4 and 40.5° were 3872 and 1827, 3831 and 1849, 3582 and 1741, and 3248 and 1560 for the 0, 5, 10, and 20%-NaCl samples, respectively. This indicates a decrease in peak intensity with increased NaCl content. As the NaCl content was increased, a higher proportion of the KCl dispersed in the food waste could combine with the injected NaCl. Thus, the amount of residual KCl decreased as the larger amount of KCl bound to the NaCl was removed by washing.
Peaks at 3.78 and 2.61 Å were not detected in the 0%-NaCl biochar but did appear in the NaCl-containing biochar. The peaks at these positions indicate the presence of cellulose [48,49]. As mentioned in Section 3.2.3., when NaCl is added to cellulose undergoing pyrolysis, decomposition of the cellulose into levoglucosan is inhibited [31]. For NaCl-free food waste, the cellulose decomposes to produce levoglucosan during pyrolysis. However, cellulose degradation is inhibited for food waste containing NaCl. Thus, the residual cellulose produced the above peaks. In the pre-wash biochar, the peaks appeared indefinite around 3.78 Å. This can be explained by the strong intensity of the NaCl crystal peak comparatively weakening the cellulose peaks. Therefore, although it was difficult to detect both peaks together in the 20%-NaCl biochar, which had the strongest NaCl peaks, they became discernible after washing, which reduced the NaCl peak intensity.
Finally, the 0%-NaCl biochar had a peak at 30.8°, which indicates the presence of dolomite (CaMg(CO3)2) [34]. On the other hand, biochar samples with added NaCl had peaks at 20.8° and 33°, which indicates the presence of struvite (NH4MgPO4·6H2O) [50], and there is no peak at 30.8°. As mentioned in Section 3.2.3, when NaCl is present during pyrolysis, phosphorus compound decomposes to the form of PO43− not the form of HPO42−. These XRD results support those of the FT-IR. A magnesium (Mg) component contained in the food waste became dolomite during pyrolysis. When NaCl is present during pyrolysis, Mg combined with PO43− and crystallized.
4. Conclusions
Food waste is difficult to recycle due to the innate NaCl content. It is essential to remove NaCl in order to utilize food waste biochar. The use of NaCl in food waste and desalination process as a template and activation process, respectively, could be a way to improve the value of the biochar. Therefore, this study investigated changes in biochar structure according to varying NaCl solution concentrations added to food waste and desalination. As the NaCl concentration increased from 0% to 20%, cellulose and lignin decomposition inhibited during pyrolysis, ultimately increasing the biochar yield by 2.7% for 20%-NaCl concentration. Furthermore, the added NaCl formed crystals exerting a templating effect, inducing an increase in BET surface area and pore volume in the biochar when it was washed. In comparison to the NaOH-based activation method, the NaCl templating method yielded a minor difference BET surface area, while the pore depth was found to be shallower. Adding 20% NaCl reduced the BET surface area while the mean pore diameter increased, owing to the increased NaCl clusters. The phenomenon in which the NaCl clustering increases as a NaCl concentration increases was shown to have positive effects on NaCl removal through washing. Further, as the NaCl adhered to the KCl scattered among the food waste, the high concentration of NaCl also had positive effects on the KCl removal. Finally, a NaCl induced form of struvite and yielded a valuable biochar that can be used as a soil fertilizer.
Author Contributions
Conceptualization, Y.-E.L. and Y.-S.Y.; Validation, Y.-E.L., J.-H.J., Y.-S.Y.; Formal Analysis, Y.-E.L.; Investigation, Y.-E.L.; Resources, Y.-E.L. and J.-H.J.; Writing-Original Draft Preparation, Y.-E.L.; Writing-Review & Editing, Y.-E.L., J.-H.J., Y.-E.L., and I.-T.K.; Supervision, Y.-S.Y.; Project Administration, I.-T.K.
Acknowledgments
This work was supported by the Major Project of the Korea Institute of Civil Engineering and Building Technology (KICT) [grant number 2018-0063].
Conflicts of Interest
The authors declare no conflict of interest.
References
- Glaser, B.; Parr, M.; Braun, C.; Kopolo, G. Biochar is carbon negative. Nat. Geosci. 2009, 2. [Google Scholar] [CrossRef]
- Mathews, J.A. Carbon-negative biofuels. Energy Policy 2008, 36, 940–945. [Google Scholar] [CrossRef]
- Guizani, C.; Jeguirim, M.; Valin, S.; Limousy, L.; Salvador, S. Biomass chars: The effects of pyrolysis conditions on their morphology, structure, chemical properties and reactivity. Energies 2017, 10. [Google Scholar] [CrossRef]
- Brassard, P.; Godbout, S.; Raghavan, V.; Palacios, J.H.; Grenier, M.; Zegan, D. The production of engineered biochars in a vertical auger pyrolysis reactor for carbon sequestration. Energies 2017, 10. [Google Scholar] [CrossRef]
- Ghorbel, L.; Rouissi, T.; Brar, S.K.; López-González, D.; Amarillo Ramirez, A.; Godbout, S. Value-added performance of processed cardboard and farm breeding compost by pyrolysis. Waste Manag. 2015, 38, 164–173. [Google Scholar] [CrossRef] [PubMed]
- Ryu, C.; Sharifi, V.N.; Swithenbank, J. Waste pyrolysis and generation of storable char. Int. J. Energy Res. 2007, 31, 177–191. [Google Scholar] [CrossRef]
- Basu, P. Biomass Gasification, Pyrolysis and Torrefaction: Practical Design and Theory, 2nd ed.; Academic Press: Cambridge, MA, USA, 2013. [Google Scholar]
- Sohi, S.; Lopez-Capel, E.; Krull, E.; Bol, R. Biochar, climate change and soil: A review to guide future research. CSIRO Land Water Sci. Rep. 2009, 5, 17–31. [Google Scholar]
- Van Zwieten, L.; Kimber, S.; Morris, S.; Chan, K.Y.; Downie, A.; Rust, J.; Joseph, S.; Cowie, A. Effects of biochar from slow pyrolysis of papermill waste on agronomic performance and soil fertility. Plant Soil 2010, 327, 235–246. [Google Scholar] [CrossRef]
- Kloss, S.; Zehetner, F.; Dellantonio, A.; Hamid, R.; Ottner, F.; Liedtke, V.; Schwanninger, M.; Gerzabek, M.H.; Soja, G. Characterization of slow pyrolysis biochars:Effects of feedstocks and pyrolysis temperature on biochar properties. J. Environ. Qual. 2012, 41, 990–1000. [Google Scholar] [CrossRef] [PubMed]
- Ronsse, F.; Van Hecke, S.; Dickinson, D.; Prins, W. Production and characterization of slow pyrolysis biochar:Influence of feedstock type and pyrolysis conditions. Gcb Bioenergy 2013, 5, 104–115. [Google Scholar] [CrossRef]
- Lin, C.S.K.; Pfaltzgraff, L.A.; Herrero-Davila, L.; Mubofu, E.B.; Solhy, A.; Clark, J.H.; Koutinas, A.A.; Kopsahelis, N.; Stamatelatou, K.; Dickson, F.; et al. Food waste as a valuable resource for the production of chemicals, materials and fuels. Current situation and global perspective. Energy Environ. Sci. 2013, 6, 426–464. [Google Scholar] [CrossRef]
- Pham, T.P.T.; Kaushik, R.; Parshetti, G.K.; Mahmood, R.; Balasubramanian, R. Food waste-to-energy conversion technologies:Current status and future directions. Waste Manag. 2015, 38, 399–408. [Google Scholar] [CrossRef] [PubMed]
- Lee, Y.-E.; Jo, J.-H.; Kim, I.-T.; Yoo, Y.-S. Chemical Characteristics and NaCl Component Behavior of Biochar Derived from the Salty Food Waste by Water Flushing. Energies 2017, 10. [Google Scholar] [CrossRef]
- Kim, N.C.; Jang, B.M. Sodium chloride decomposting method in food waste compost using triple salt. J. Korra 2004, 12, 86–94. [Google Scholar]
- Fechler, N.; Fellinger, T.-P.; Antonietti, M. “Salt templating”: A simple and sustainable pathway toward highly porous functional carbons from ionic liquids. Adv. Mater. 2013, 25, 75–79. [Google Scholar] [CrossRef] [PubMed]
- Liu, X.; Antonietti, M. Molten salt activation for synthesis of porous carbon nanostructures and carbon sheets. Carbon 2014, 69, 460–466. [Google Scholar] [CrossRef]
- Ministry of Environment (MOE). A Study on Food Waste Reduction Equipment Guidelines and Quality Standard; Ministry of Environment: Sejong City, Korea, 2009.
- Lu, A.-H.; Li, W.C.; Schmidt, W.; Schüth, F. Fabrication of hierarchically structured carbon monoliths via self-binding and salt templating. Microporous Mesoporous Mater. 2006, 95, 187–192. [Google Scholar] [CrossRef]
- Wu, F.-C.; Tseng, R.-L. High adsorption capacity NaOH-activated carbon for dye removal from aqueous solution. J. Hazard. Mater. 2008, 152, 1256–1267. [Google Scholar] [CrossRef] [PubMed]
- Cazetta, A.L.; Vargas, A.M.A.; Nogami, E.M.; Kunita, M.H.; Martins, A.C.; Silva, T.L.; Moraes, J.C.G.; Almeida, V.C.; Guilherme, M.R. NaOH-activated carbon of high surface area produced from coconut shell: Kinetics and equilibrium studies from the methylene blue adsorption. Chem. Eng. J. 2011, 174, 117–125. [Google Scholar] [CrossRef]
- Vargas, A.M.M.; Garcia, C.A.; Reis, E.M.; Lenzi, E.; Costa, W.F.; Almeida, V.C. NaOH-activated carbon from flamboyant (Delonix regia) pods:Optimization of preparation conditions using central composite rotatable design. Chem. Eng. J. 2010, 162, 43–50. [Google Scholar] [CrossRef]
- Dai, Z.; Meng, J.; Muhammad, N.; Muhammad, L.; Wang, H.; He, Y.; Brookes, P.C.; Xu, J. The potential feasibility for soil improvement, based on the properties of biochars pyrolyzed from different feedstocks. J. Soils Sedim. 2013, 13, 989–1000. [Google Scholar] [CrossRef]
- Broström, M.; Enestam, S.; Backman, R.; Mäkelä, K. Condensation in the KCl–NaCl system. Fuel Process. Technol. 2013, 105, 142–148. [Google Scholar] [CrossRef]
- Vandecandelaere, N.; Rey, C.; Drouet, C. Biomimetic apatite-based biomaterials:On the critical impact of synthesis and post-synthesis parameters. J. Mater. Sci. Mater. Med. 2012, 23, 2593–2606. [Google Scholar] [CrossRef] [PubMed] [Green Version]
- Bekiaris, G.; Bruun, S.; Peltre, C.; Houot, S.; Jensen, L.S. FTIR–PAS: A powerful tool for characterising the chemical composition and predicting the labile C fraction of various organic waste products. Waste Manag. 2015, 39, 45–56. [Google Scholar] [CrossRef] [PubMed]
- Porchelvi, E.; Muthu, S. The spectroscopic (FT-IR, FT-Raman and NMR), NCA, Fukui function analysis first order hyperpolarizability, TGA of 6-chloro-3, 4dihydro-2H-1, 2, 4-benzothiazine-7-sulphonamide1, 1-dioxide by ab initio HF and Density Functional method. Spectrochim. Acta Part A Mol. Biomol. Spectrosc. 2014, 123, 230–240. [Google Scholar] [CrossRef] [PubMed]
- Mohanty, P.; Nanda, S.; Pant, K.K.; Naik, S.; Kozinski, J.A.; Dalai, A.K. Evaluation of the physiochemical development of biochars obtained from pyrolysis of wheat straw, timothy grass and pinewood: Effects of heating rate. J. Anal. Appl. Pyrolysis 2013, 104, 485–493. [Google Scholar] [CrossRef]
- Zhao, S.-X.; Ta, N.; Wang, X.-D. Effect of Temperature on the Structural and Physicochemical Properties of Biochar with Apple Tree Branches as Feedstock Material. Energies 2017, 10. [Google Scholar] [CrossRef]
- Ahmad, M.; Lee, S.S.; Dou, X.; Mohan, D.; Sung, J.K.; Yang, J.E.; Ok, Y.S. Effects of pyrolysis temperature on soybean stover- and peanut shell-derived biochar properties and TCE adsorption in water. Bioresour. Technol. 2012, 118, 536–544. [Google Scholar] [CrossRef] [PubMed]
- Patwardhan, P.R.; Satrio, J.A.; Brown, R.C.; Shanks, R.H. Influence of inorganic salts on the primary pyrolysis products of cellulose. Bioresour. Technol. 2010, 101, 4646–4655. [Google Scholar] [CrossRef] [PubMed]
- Nanda, S.; Mohanty, P.; Pant, K.K.; Naik, S.; Kozinski, J.A.; Dalai, A.K. Characterization of North American lignocellulosic biomass and biochars in terms of their candidacy for alternate renewable fuels. Bioenergy Res. 2013, 6, 663–677. [Google Scholar] [CrossRef]
- Silverstein, R.M.; Webster, F.X.; Kiemle, D.J.; Bryce, D.L. Spectrometric Identification of Organic Compounds, 8th ed.; John Wiley & Sons: Hoboken, NJ, USA, 2014. [Google Scholar]
- Yuan, J.-H.; Xu, R.-K.; Zhang, H. The forms of alkalis in the biochar produced from crop residues at different temperatures. Bioresour. Technol. 2011, 102, 3488–3497. [Google Scholar] [CrossRef] [PubMed]
- Cantrell, K.B.; Hunt, P.G.; Uchimiya, M.; Novak, J.M.; Ro, K.S. Impact of pyrolysis temperature and manure source on physicochemical characteristics of biochar. Bioresour. Technol. 2012, 107, 419–428. [Google Scholar] [CrossRef] [PubMed]
- Jin, J.; Li, Y.; Zhang, J.; Wu, S.W.; Cao, Y.; Liang, P.; Zhang, J.; Wong, M.H.; Wang, M.; Shan, S.; et al. Influence of pyrolysis temperature on properties and environmental safety of heavy metals in biochars derived from municipal sewage sludge. J. Hazard. Mater. 2016, 320, 417–426. [Google Scholar] [CrossRef] [PubMed]
- Hossain, M.K.; Strezov, V.; Chan, V.S.; Ziolkowski, A.; Nelson, P.F. Influence of pyrolysis temperature on production and nutrient properties of wastewater sludge biochar. J. Environ. Manag. 2011, 92, 223–228. [Google Scholar] [CrossRef] [PubMed]
- Lammers, K.; Arbuckle-keil, G.; Dighton, J. FT-IR study of the changes in carbohydrate chemistry of three New Jersey pine barrens leaf litters during simulated control burning. Soil Biol. Biochem. 2009, 41, 340–347. [Google Scholar] [CrossRef]
- Socrates, G. Infrared and Raman Characteristic Group Frequencies: Tables and Charts, 3rd ed.; John Wiley & Sons: Hoboken, NJ, USA, 2004. [Google Scholar]
- Zhang, M.; Resende, F.L.P.; Moutsoglou, A.; Raynie, D.E. Pyrolysis of lignin extracted from prairie cordgrass, aspen, and Kraft lignin by Py-GC/MS and TGA/FTIR. J. Anal. Appl. Pyrolysis 2012, 98, 65–71. [Google Scholar] [CrossRef]
- Kleen, M.; Gellerstedt, G. Influence of inorganic species on the formation of polysaccharide and lignin degradation products in the analytical pyrolysis of pulps. J. Anal. Appl. Pyrolysis 1995, 35, 15–41. [Google Scholar] [CrossRef]
- Jiang, W.; Saxena, A.; Song, B.; Ward, B.B.; Beveridge, T.J.; Myneni, S.C. Elucidation of functional groups on gram-positive and gram-negative bacterial surfaces using infrared spectroscopy. Langmuir 2004, 20, 11433–11442. [Google Scholar] [CrossRef] [PubMed]
- Zhang, B.; Xiong, S.; Xiao, B.; Yu, D.; Jia, X. Mechanism of wet sewage sludge pyrolysis in a tubular furnace. Int. J. Hydrog. Energy 2011, 36, 355–363. [Google Scholar] [CrossRef]
- Robertson, T.B. Contributions to the theory of the mode of action of inorganic salts upon proteins in solution. J. Biol. Chem. 1911, 9, 303–326. [Google Scholar]
- Sawabe, T.; Akiyoshi, M.; Yoshida, K.; Yano, T. Estimation of neutron-irradiation-induced defect in 3C–SiC from change in XRD peak shift and DFT study. J. Nucl. Mater. 2011, 417, 430–434. [Google Scholar] [CrossRef]
- Parra, M.R.; Haque, F.Z. Aqueous chemical route synthesis and the effect of calcination temperature on the structural and optical properties of ZnO nanoparticles. J. Mater. Res. Technol. 2014, 3, 363–369. [Google Scholar] [CrossRef]
- Ewais, E.M.M.; Ahmed, Y.M.Z.; El-Amir, A.A.M.; El-didamony, H. Cement kiln dust/rice husk ash as a low temperature route for wollastonite processing. Epitoany-J. Silicate Based Composite Mater. 2014. [Google Scholar] [CrossRef]
- Ciolacu, D.; Ciolacu, F.; Popa, V.I. Amorphous cellulose—Structure and characterization. Cell. Chem. Technol. 2011, 45, 13. [Google Scholar]
- Wei, L.; Agarwal, U.P.; Hirth, K.C.; Matuana, L.M.; Sabo, R.C.; Stark, N.M. Chemical modification of nanocellulose with canola oil fatty acid methyl ester. Carbohydr. Polym. 2017, 169, 108–116. [Google Scholar] [CrossRef] [PubMed]
- Lu, X.; Shih, K.; Li, X.Y.; Liu, G.; Zeng, E.Y.; Wang, F. Accuracy and application of quantitative X-ray diffraction on the precipitation of struvite product. Water Res. 2016, 90, 9–14. [Google Scholar] [CrossRef] [PubMed]
Figure 1.
Schematic of the pyrolysis reactor used in this study.

Figure 2.
(a–j) scanning electron microscopy (SEM) images of biochar samples with different NaCl contents before and after washing: (a) 0%-NaCl-x8000; (b) 5%-NaCl-x8000 (pre-wash); (c) 5%-NaCl-x8000 (post-wash); (d) 5%-NaCl-x2000 (post-wash); (e) 10%-NaCl-x8000 (pre-wash); (f) 10%-NaCl-x8000 (post-wash); (g) 10%-NaCl-x2000 (post-wash); (h) 20%-NaCl-x8000 (pre-wash); (i) 20%-NaCl-x8000 (post-wash); (j) 20%-NaCl-x2000 (post-wash).


Figure 3.
(a–f) NaCl crystal shape deformations and EDX results for biochar samples with different NaCl contents. (a) 5% biochar; (b) 5% biochar EDX result; (c) 10% biochar; (d) 10% biochar EDX result; (e) 20% biochar; (f) 20% biochar EDX result.
Figure 3.
(a–f) NaCl crystal shape deformations and EDX results for biochar samples with different NaCl contents. (a) 5% biochar; (b) 5% biochar EDX result; (c) 10% biochar; (d) 10% biochar EDX result; (e) 20% biochar; (f) 20% biochar EDX result.


Figure 4.
FT-IR results for (a) 5%, (b) 10%, and (c) 20%-NaCl biochar after and before washing, with the results for 0%-NaCl biochar. (d) FT-IR results for 0%, 5%, 10%, and 20%-NaCl biochar after washing.
Figure 4.
FT-IR results for (a) 5%, (b) 10%, and (c) 20%-NaCl biochar after and before washing, with the results for 0%-NaCl biochar. (d) FT-IR results for 0%, 5%, 10%, and 20%-NaCl biochar after washing.


Figure 5.
XRD results for (a) 5%, (b), 10%, and (c) 20%-NaCl biochar samples after and before washing, with 0%-NaCl biochar result. (d) XRD results for 0%, 5%, 10%, and 20%-NaCl samples after washing. (e) XRD result for NaCl powder.
Figure 5.
XRD results for (a) 5%, (b), 10%, and (c) 20%-NaCl biochar samples after and before washing, with 0%-NaCl biochar result. (d) XRD results for 0%, 5%, 10%, and 20%-NaCl samples after washing. (e) XRD result for NaCl powder.


Table 1.
Standard Food-Waste Samples.
| Classification | Composition Ratio (wt %) | Food-Ingredient Processing Methods | |
|---|---|---|---|
| Food Ingredients | Processing Method | ||
| Grains | 16 | Rice (16) | |
| Vegetables | 51 | Napa cabbage (9) | Cutting width: <100 mm |
| Potato (20) | Chopped into 5 mm pieces | ||
| Onion (20) | |||
| Daikon (2) | |||
| Fruits | 14 | Apple (7) | Split lengthwise into 8 pieces |
| Mandarin/orange (7) | |||
| Meat | 19 | Meat (19) | Cutting width: ~3 cm. |
| Total | 100 | 100 | |
Table 2.
Chemical composition of food-waste-derived biochar with different NaCl contents. (A: washed biochar; B: unwashed biochar; –: Not detected.).
Table 2.
Chemical composition of food-waste-derived biochar with different NaCl contents. (A: washed biochar; B: unwashed biochar; –: Not detected.).
| (wt %) | C | H | N | S | O | Na | Cl |
|---|---|---|---|---|---|---|---|
| B_0% | 76.29 0.05 | 2.94 0.02 | 6.04 0.15 | – | 14.13 0.10 | 0.24 0.03 | 0.38 0.01 |
| B_5% | 62.47 0.23 | 2.39 0.10 | 5.05 0.01 | – | 12.62 0.15 | 7.02 0.01 | 10.47 0.02 |
| A_5% | 75.90 0.13 | 2.90 0.07 | 6.03 0.09 | – | 12.16 0.04 | 2.20 0.10 | 0.82 0.10 |
| B_10% | 52.43 0.54 | 2.06 0.05 | 4.04 0.02 | – | 10.59 0.35 | 12.29 0.09 | 18.60 0.14 |
| A_10% | 76.21 0.11 | 3.00 0.01 | 5.91 0.19 | – | 12.04 0.01 | 2.09 0.14 | 0.77 0.16 |
| B_20% | 38.95 0.89 | 1.98 0.50 | 3.41 0.05 | – | 8.63 1.08 | 18.64 0.99 | 28.40 1.53 |
| A_20% | 74.92 1.36 | 3.97 0.72 | 6.21 0.01 | – | 12.30 1.09 | 2.27 0.30 | 0.34 0.15 |
Table 3.
Effect of NaCl Concentrations on Food Waste Biochar Yield.
| Added NaCl | Food Waste (g) | NaCl Content (g) | Weight after Pyrolysis (g) | Char Yield (wt %) |
|---|---|---|---|---|
| 0% | 120.00 | - | 27.29 0.18 | 22.77 0.15 |
| 5% | 120.00 | 6.32 | 34.79 0.28 | 23.73 0.23 |
| 10% | 120.00 | 13.34 | 42.04 0.41 | 23.92 0.34 |
| 20% | 120.00 | 30.00 | 60.59 2.40 | 25.49 2.01 |
Table 4.
Brunauer–Emmett–Teller (BET) Surface Area and Pore Volume Analysis of Food-Waste-Derived Biochar with Different NaCl Contents.
Table 4.
Brunauer–Emmett–Teller (BET) Surface Area and Pore Volume Analysis of Food-Waste-Derived Biochar with Different NaCl Contents.
| Sample | BET Specific Surface Area (m2∙g−1) | Total Pore Volume (p/p0 = 0.990) (cm3∙g−1) | Average Pore Diameter (nm) | Mesopore Surface Area (m2∙g−1) | Mesopore Volume (cm3∙g−1) |
|---|---|---|---|---|---|
| B_0% | 1.226 | 0.00201 | 6.552 | 0.672 | 0.00176 |
| B_5% | 0.824 | 0.00193 | 9.475 | 0.465 | 0.00177 |
| A_5% | 2.946 | 0.00458 | 7.556 | 1.158 | 0.00377 |
| B_10% | 1.184 | 0.00341 | 11.505 | 0.902 | 0.00329 |
| A_10% | 3.500 | 0.00623 | 8.501 | 1.686 | 0.00537 |
| B_20% | 0.795 | 0.00256 | 14.119 | 0.651 | 0.00248 |
| A_20% | 2.485 | 0.00653 | 12.610 | 1.623 | 0.00613 |
| NaOH | 3.914 | 0.01746 | 17.845 | 2.452 | 0.01675 |
Table 5.
X-ray diffraction analysis peaks for NaCl and food-waste-derived biochar with different NaCl contents.
Table 5.
X-ray diffraction analysis peaks for NaCl and food-waste-derived biochar with different NaCl contents.
| NaCl | 0% | B_5% | A_5% | B_10% | A_10% | B_20% | A_20% |
|---|---|---|---|---|---|---|---|
| 18.7 (4.74) | |||||||
| 20.8 (4.27) | 20.8 (4.27) | 20.8 (4.27) | 20.8 (4.27) | 20.8 (4.27) | |||
| 23.5 (3.78) | 23.5 (3.78) | 23.5 (3.78) | |||||
| 27.4 (3.25) | 27 (3.30) | 27.2 (3.26) | 27.2 (3.27) | 27.2 (3.27) | 27.4 (3.25) | 27.2 (3.27) | |
| 28.4 (3.14) | 28.8 (3.10) | 28.4 (3.14) | 28.8 (3.10) | 28.4 (3.14) | 28.8 (3.10) | 28.4 (3.14) | |
| 30.8 (2.90) | |||||||
| 31.5 (2.84) | 31.2 (2.86) | 31.6 (2.83) | 31.4 (2.85) | 31.6 (2.83) | 31.7 (2.82) | 31.6 (2.83) | |
| 33 (2.71) | 33 (2.71) | 33 (2.71) | 33 (2.71) | ||||
| 34.3 (2.61) | 34.3 (2.61) | 34.3 (2.61) | 34.3 (2.61) | 34.3 (2.61) | 34.3 (2.61) | ||
| 40.5 (2.22) | 41 (2.20) | 40.5 (2.22) | 41 (2.20) | 40.5 (2.22) | 41 (2.20) | 40.5 (2.22) | |
| 45.5 (1.99) | 45 (2.01) | 45.5 (1.99) | 45 (2.01) | 45.5 (1.99) | 45.5 (1.99) | 45.2 (2.00) | |
| 50.3 (1.81) | 51 (1.79) | 50.3 (1.81) | 50.3 (1.81) | 50.3 (1.81) | |||
| 53.5 (1.71) | 53.8 (1.70) | ||||||
| 56.5 (1.63) | 55.5 (1.65) | 56.5 (1.63) | 56 (1.64) | 56.4 (1.63) | 56.5 (1.63) | 56.2 (1.63) | |
| 61.5 (1.51) | 61.5 (1.51) | ||||||
| 65.5 (1.42) | 65.2 (1.43) | 65.7 (1.42) | 66.2 (1.41) | ||||
| 66.5 (1.40) | 67.5 (1.39) | 66.5 (1.40) | 66.5 (1.40) | ||||
| 75.5 (1.26) | 74 (1.28) | 74.7 (1.27) | 75.2 (1.26) | ||||
| 84 (1.15) | 82.5 (1.17) | 83.5 (1.16) | 84 (1.15) |
© 2018 by the authors. Licensee MDPI, Basel, Switzerland. This article is an open access article distributed under the terms and conditions of the Creative Commons Attribution (CC BY) license (http://creativecommons.org/licenses/by/4.0/).
Share and Cite
MDPI and ACS Style
Lee, Y.-E.; Jo, J.-H.; Kim, I.-T.; Yoo, Y.-S. Influence of NaCl Concentration on Food-Waste Biochar Structure and Templating Effects. Energies 2018, 11, 2341. https://doi.org/10.3390/en11092341
AMA Style
Lee Y-E, Jo J-H, Kim I-T, Yoo Y-S. Influence of NaCl Concentration on Food-Waste Biochar Structure and Templating Effects. Energies. 2018; 11(9):2341. https://doi.org/10.3390/en11092341
Chicago/Turabian StyleLee, Ye-Eun, Jun-Ho Jo, I-Tae Kim, and Yeong-Seok Yoo. 2018. "Influence of NaCl Concentration on Food-Waste Biochar Structure and Templating Effects" Energies 11, no. 9: 2341. https://doi.org/10.3390/en11092341
Note that from the first issue of 2016, this journal uses article numbers instead of page numbers. See further details here.