A Study on the Fuel Economy Potential of Parallel and Power Split Type Hybrid Electric Vehicles


1
School of Mechanical Engineering, Sungkyunkwan University, Suwon-si 16419, Korea
2
Eco-Vehicle R&D Division, Hyundai Powertech, Hwaseong-si 18583, Korea
*
Author to whom correspondence should be addressed.
Energies 2018, 11(8), 2103; https://doi.org/10.3390/en11082103
Submission received: 27 April 2018
/
Revised: 1 August 2018
/
Accepted: 9 August 2018
/
Published: 13 August 2018
(This article belongs to the Section F: Electrical Engineering)
Abstract
:What is the best number of gear steps for parallel type hybrid electric vehicles (HEVs) and what are the pros and cons of the power split type HEV compared to the parallel type have been interesting issues in the development of HEVs. In this study, a comparative analysis was performed to evaluate the fuel economy potential of a parallel HEV and a power split type HEV. First, the fuel economy potential of the parallel HEV was investigated for the number of gear steps. Four-speed, six-speed, and eight-speed automatic transmissions (ATs) and a continuously variable transmission (CVT) were selected, and their drivetrain losses were considered in the dynamic programming (DP). It was found from DP results that the power electronics system (PE) loss decreased because the magnitude of the motor load leveling power decreased as the number of gear steps increased. On the other hand, the drivetrain losses including the electric oil pump (EOP) loss increased with increasing gear step. The improvement rate from the 4-speed to the 6-speed was the greatest, while it decreased for the higher gear step. The fuel economy of the CVT HEV was rather low due to the large EOP loss in spite of the reduced PE loss. In addition, the powertrain characteristics of the parallel HEV were compared with the power split type HEV. In the power split type HEV, the PE loss was almost double compared to that of the parallel HEV because two large capacity motor-generators were used. However, the drivetrain loss and EOP loss of the power split type HEV were found to be much smaller due to its relatively simple architecture. It is expected that the power characteristics of the parallel and power split type HEVs obtained from the DP results can be used in the development of HEV systems.
1. Introduction
To meet the more severe regulations regarding vehicle fuel economy and CO2 emissions all over the world [1,2], major automobile companies have announced milestones for vehicle electrification. For instance, Toyota has plans to electrify half of its total vehicles by 2030 [3]. Mercedes-Benz also aims to electrify all vehicles by 2022 [4]. In addition, vehicle electrification has been accelerated as interest in vehicle connectivity and automation increases.
It is expected that hybrid electric vehicles (HEVs) and plug-in hybrid electric vehicles (PHEVs) will account for more than 40% of total vehicle sales by 2030 [5]. HEVs have the following advantages: (1) it is possible to meet the regulations with minor changes in vehicle configuration from the existing structure and (2) they can be extended to PHEVs simply by increasing the capacity of the battery.
Two types of HEV powertrains have been developed: (1) add-on type and (2) dedicated hybrid transmissions (DHTs) [6]. Add-on type HEV powertrains have an architecture where the motor is added to the existing transmission. Transmission mounted electric device (TMED) type parallel HEVs are a typical add-on type configuration, where one motor is installed between the engine and transmission, and the engine and motor power are transmitted to the wheels in parallel through the transmission. Automatic transmission (AT), dual clutch transmission (DCT), and continuously variable transmission (CVT) have been adopted for the add-on type HEV. In conventional internal combustion engine (ICE) vehicles, the transmission provides various gear steps to improve the fuel economy and vehicle performance.
In conventional ICE vehicles, fuel consumption can be reduced by 0.66% moving from a 5-speed AT to a 6-speed AT [7] and by 6.5% moving from a 5-speed to an 8-speed [8]. This is because the engine operation point can be moved to a more efficient region by the increased gear step. In HEVs, the same effect in the engine and motor operation is expected with an increased number of gear steps. However, improvement of the fuel economy based on the number of gear steps may be different because the motor works in concert with the engine. Few studies have been performed that focus on the fuel economy potential of a parallel HEV as a function of the number of gear steps. The engine and motor behavior were investigated for a parallel HEV based on the number of gear steps [9]. However, the transmission efficiency including hydraulic system loss was not considered. In evaluating the fuel economy, the effect of power loss due to additional drivetrain components such as clutch and brake needed for the increased gear steps must be considered. Therefore, it is necessary to analyze the engine and motor operation characteristics and fuel economy with respect to the number of gear steps in an add-on type parallel HEV.
The DHT type HEV adopts a specialized transmission architecture for HEV. DHT has a relatively simple structure, which consists of planetary gear sets and two high capacity motor-generators (MGs). DHT type HEVs can implement various driving modes such as power split, series, and parallel mode. A typical example of a DHT is the power split type transmission, where the engine power is split to the mechanical and electrical paths at planetary gear in the DHT. The power split type HEV has low system efficiency at a particular speed ratio due to the power circulation, which occurs along a closed path [10,11]. Studies were performed on the optimal configuration and design methodology to improve the fuel economy of the power split type HEV [12,13]. In addition, various configurations of the power split type HEV were investigated in terms of the fuel economy [14,15,16,17]. It is well known that the power split type HEV provides improved fuel economy due to the electrical-continuously variable transmission (e-CVT) function. However, two large MGs are a drawback as they increase the cost of the power electronic system. Since the fuel economy and system efficiency of the HEV depend on the powertrain architecture, a comparative analysis of the fuel economy potential for add-on type and DHT type HEVs will provide helpful insight into the development of HEVs.
In this study, the maximum fuel economy potential of parallel HEVs was evaluated for the number of gear steps by considering power electronics, system loss, and drivetrain loss. To compare the fuel economy of HEVs under the optimal conditions, backward simulators were developed based on dynamic programming, and the maximum fuel economy potential and engine and motor operation characteristics were investigated. In addition, the fuel economy potential of the parallel HEV was compared with that of a power split type HEV, and the design aspects are discussed in terms of the fuel economy and losses.
2. Dynamic Programming to Evaluate the Fuel Economy Potential Considering Powertrain Characteristics and Drivetrain Components Losses of Parallel HEV
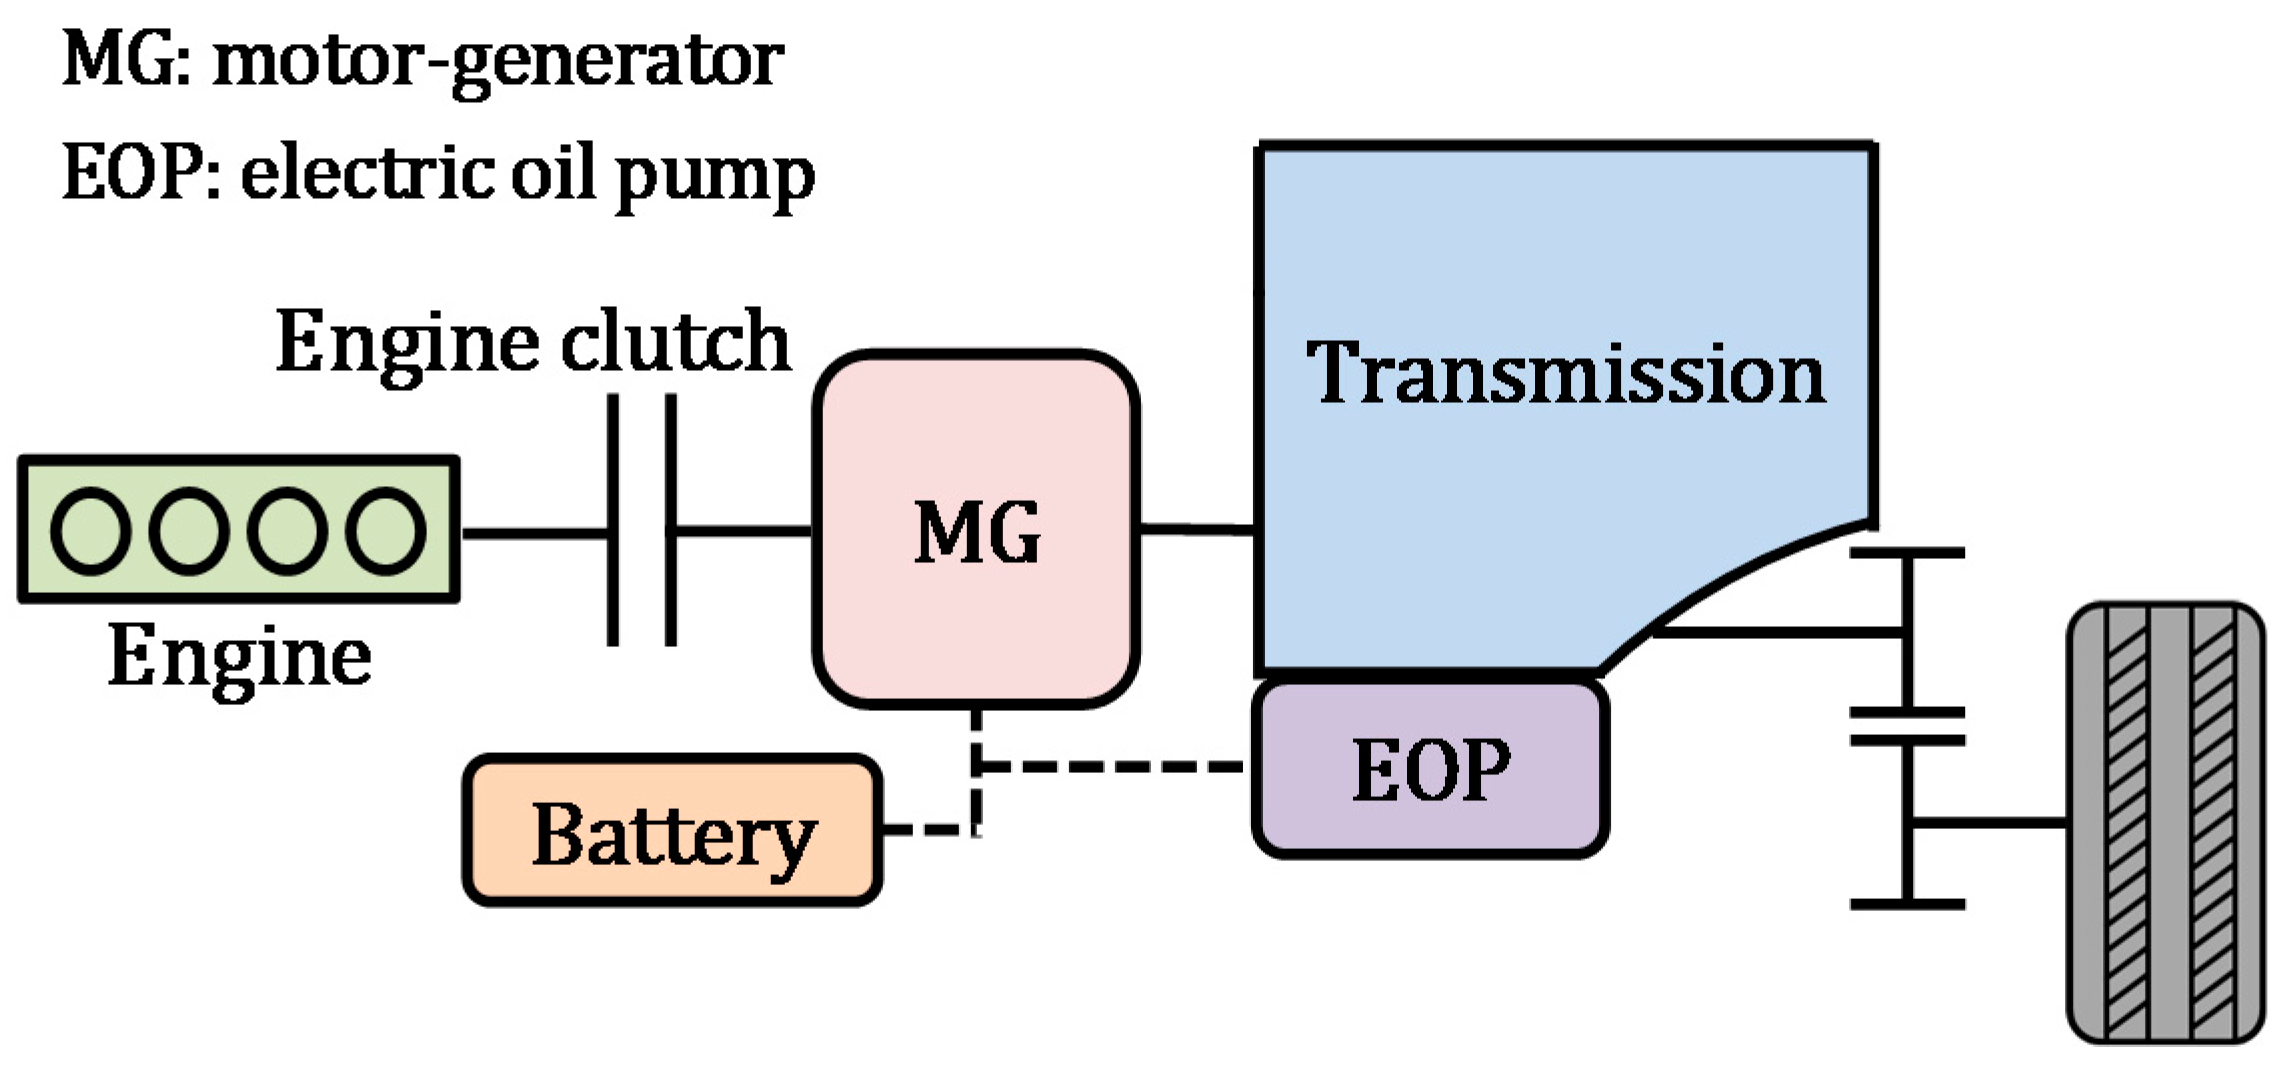
The target parallel HEV is a TMED type where the MG is connected to the transmission directly. In the TMED type, the engine and motor power are transmitted to the wheel in parallel (Figure 1). In this study, 4-speed AT, 6-speed AT, 8-speed AT, and CVT were selected, and backward simulators were developed to investigate the maximum fuel economy potential. In the simulator, the following powertrain components were considered.
2.1. Transmission
In the automatic transmission, the output torque is represented as follows:
where and are the torque and transmission gear ratio, respectively. The subscripts TM_AT, in, and out denote the automatic transmission, input, and output, respectively.
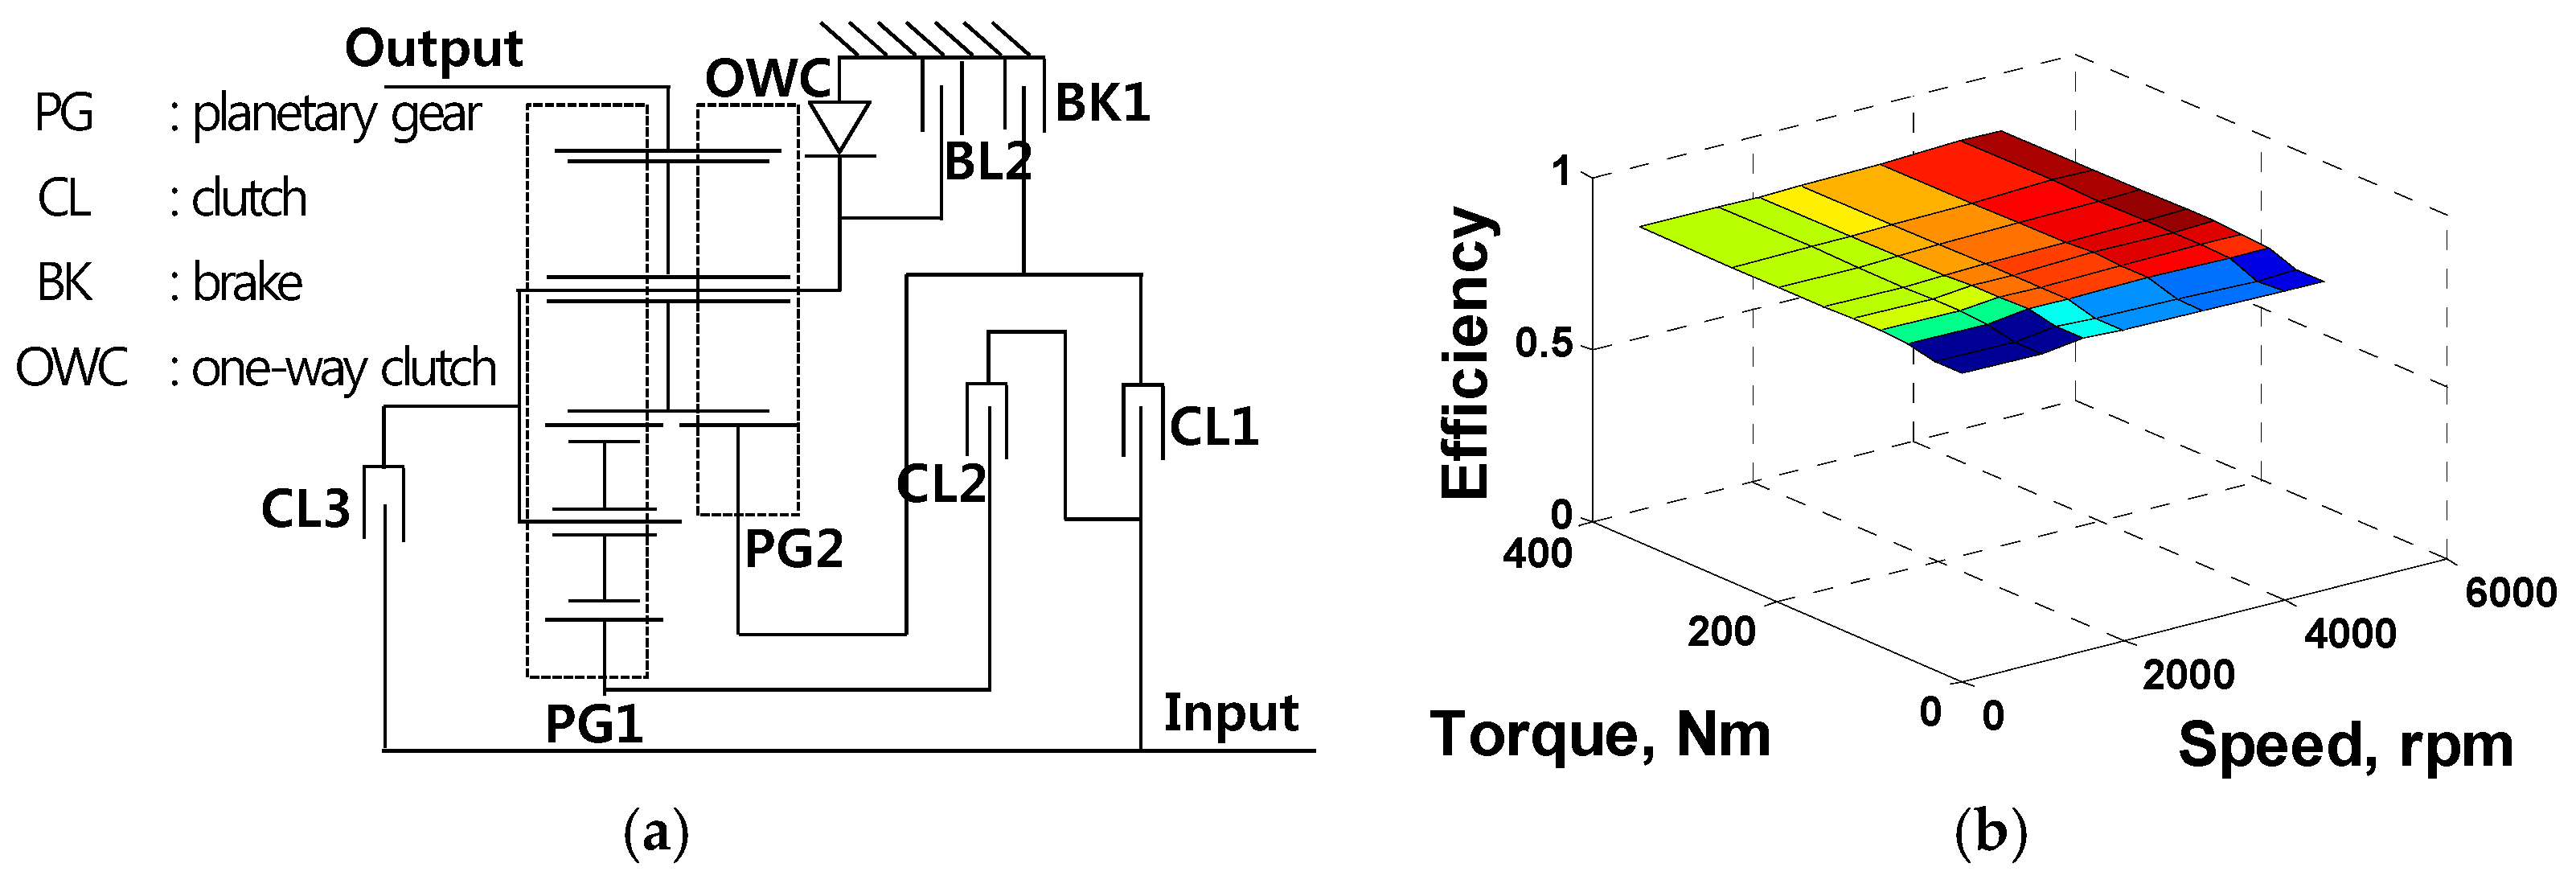
In the automatic transmission, mechanical loss occurs in the drivetrain components, which include planetary gears, clutches, brakes, and final reduction gear. Figure 2 shows a schematic diagram of the 4-speed AT investigated in this study and its transmission efficiency of the 1st gear step. The transmission efficiency map was constructed from the experimental results. Transmission efficiency for the other gear steps, 6-speed AT, and 8-speed AT were constructed in a similar way.
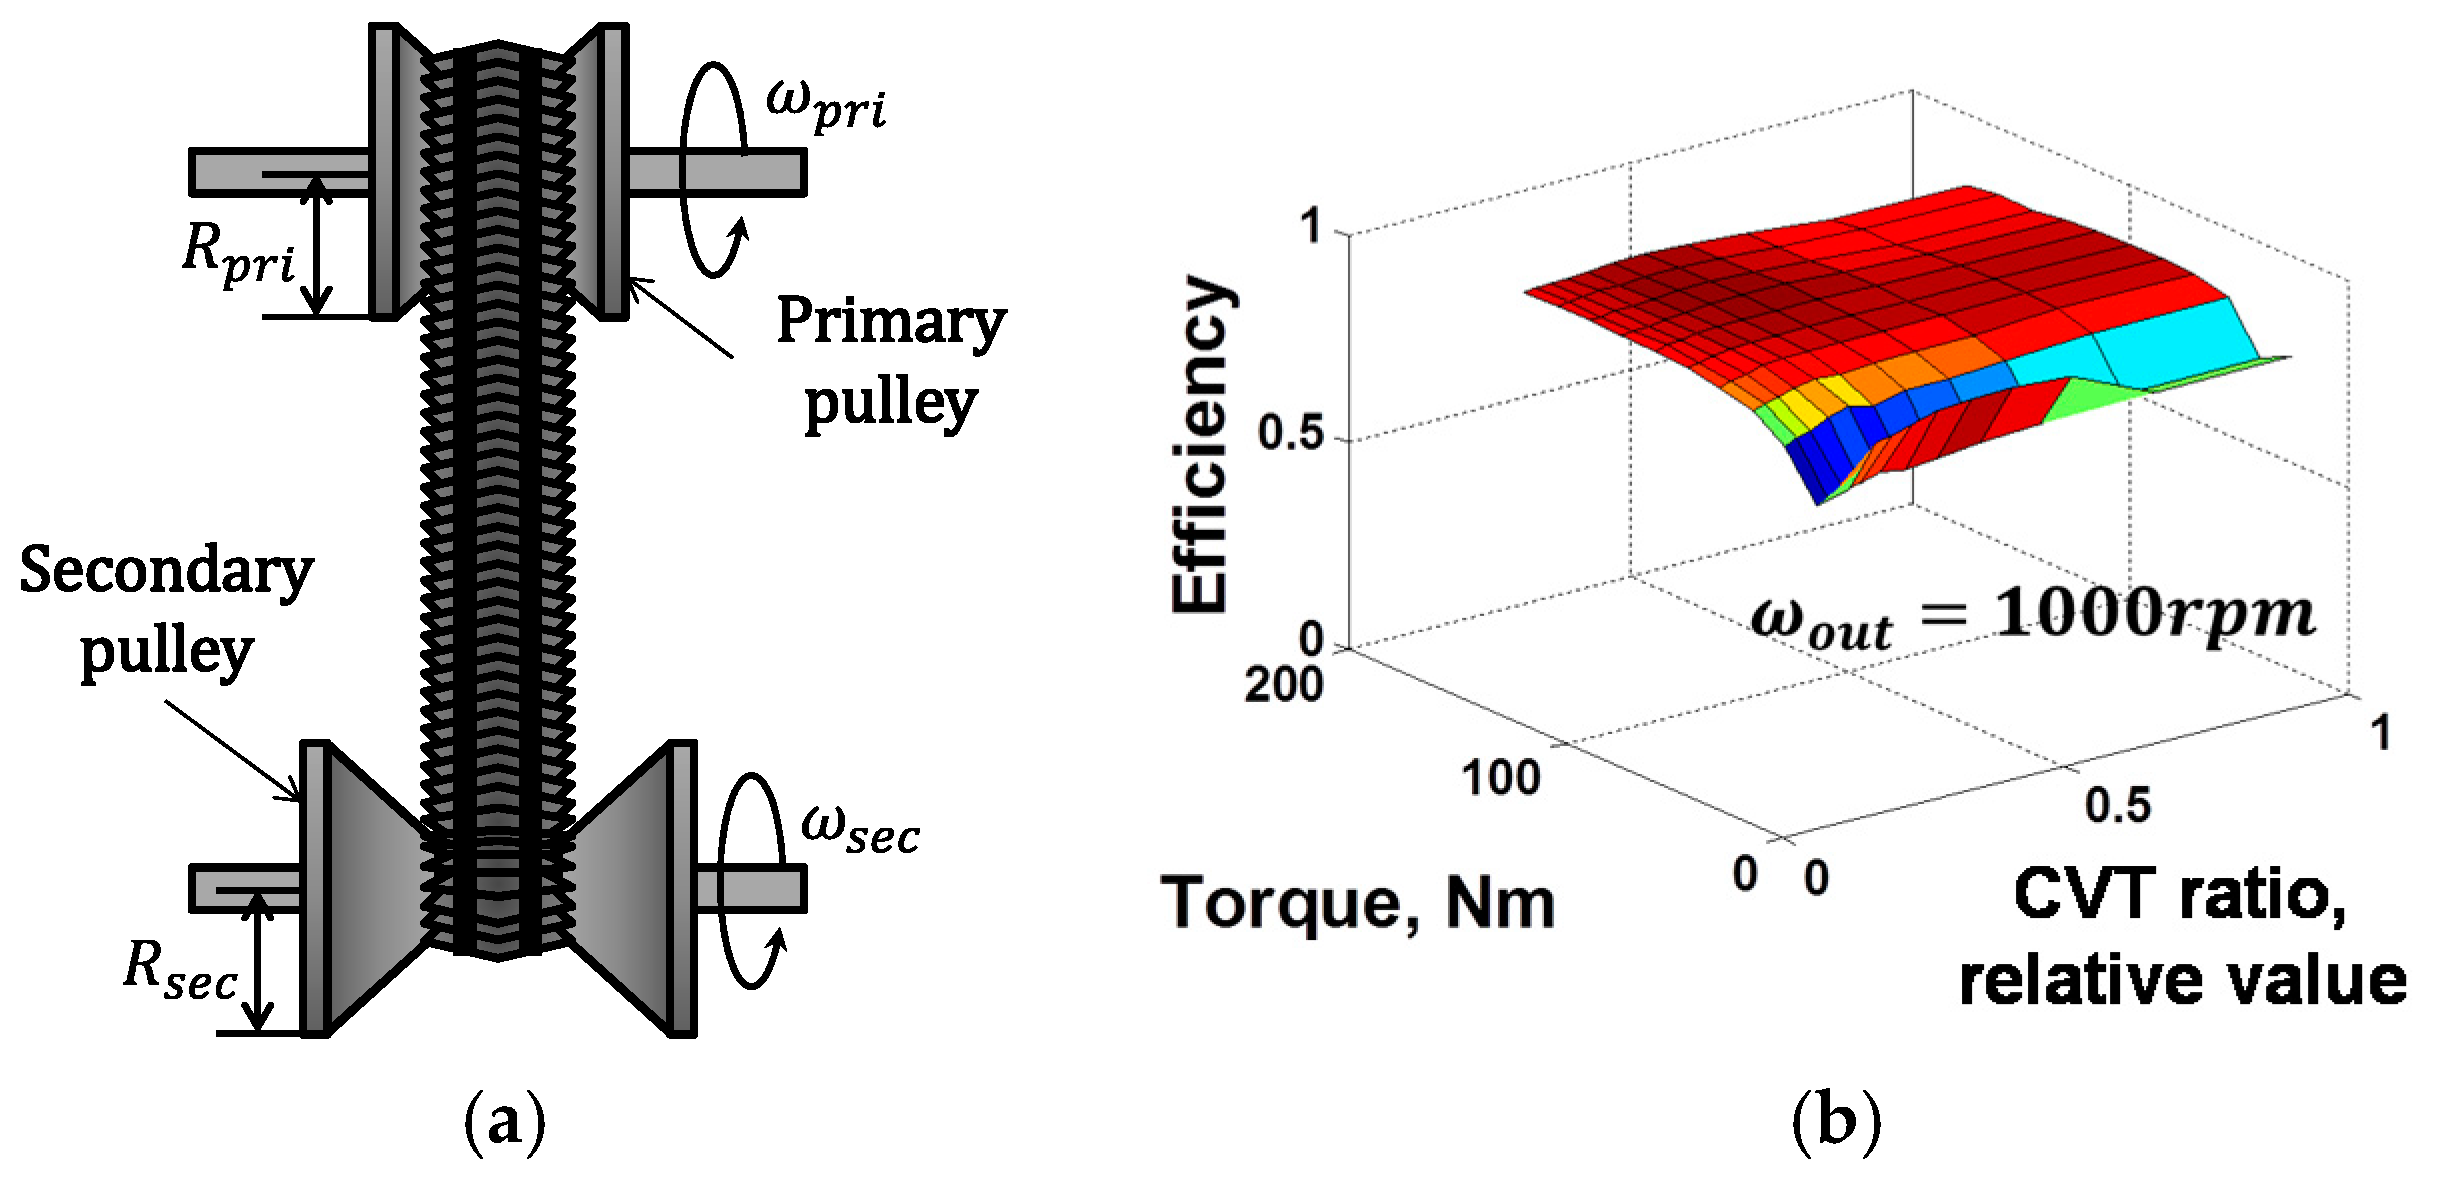
A schematic diagram of the CVT used in this study is shown in Figure 3a. In the CVT, power is transmitted through the belt, and a continuously variable transmission ratio is provided by changing the belt pitch radius in a continuous manner. The CVT ratio is defined as follows:
where the subscript TM_CVT, and are the continuously variable transmission, primary pulley, and secondary pulley, respectively. is the rotational speed.
2.2. Engine
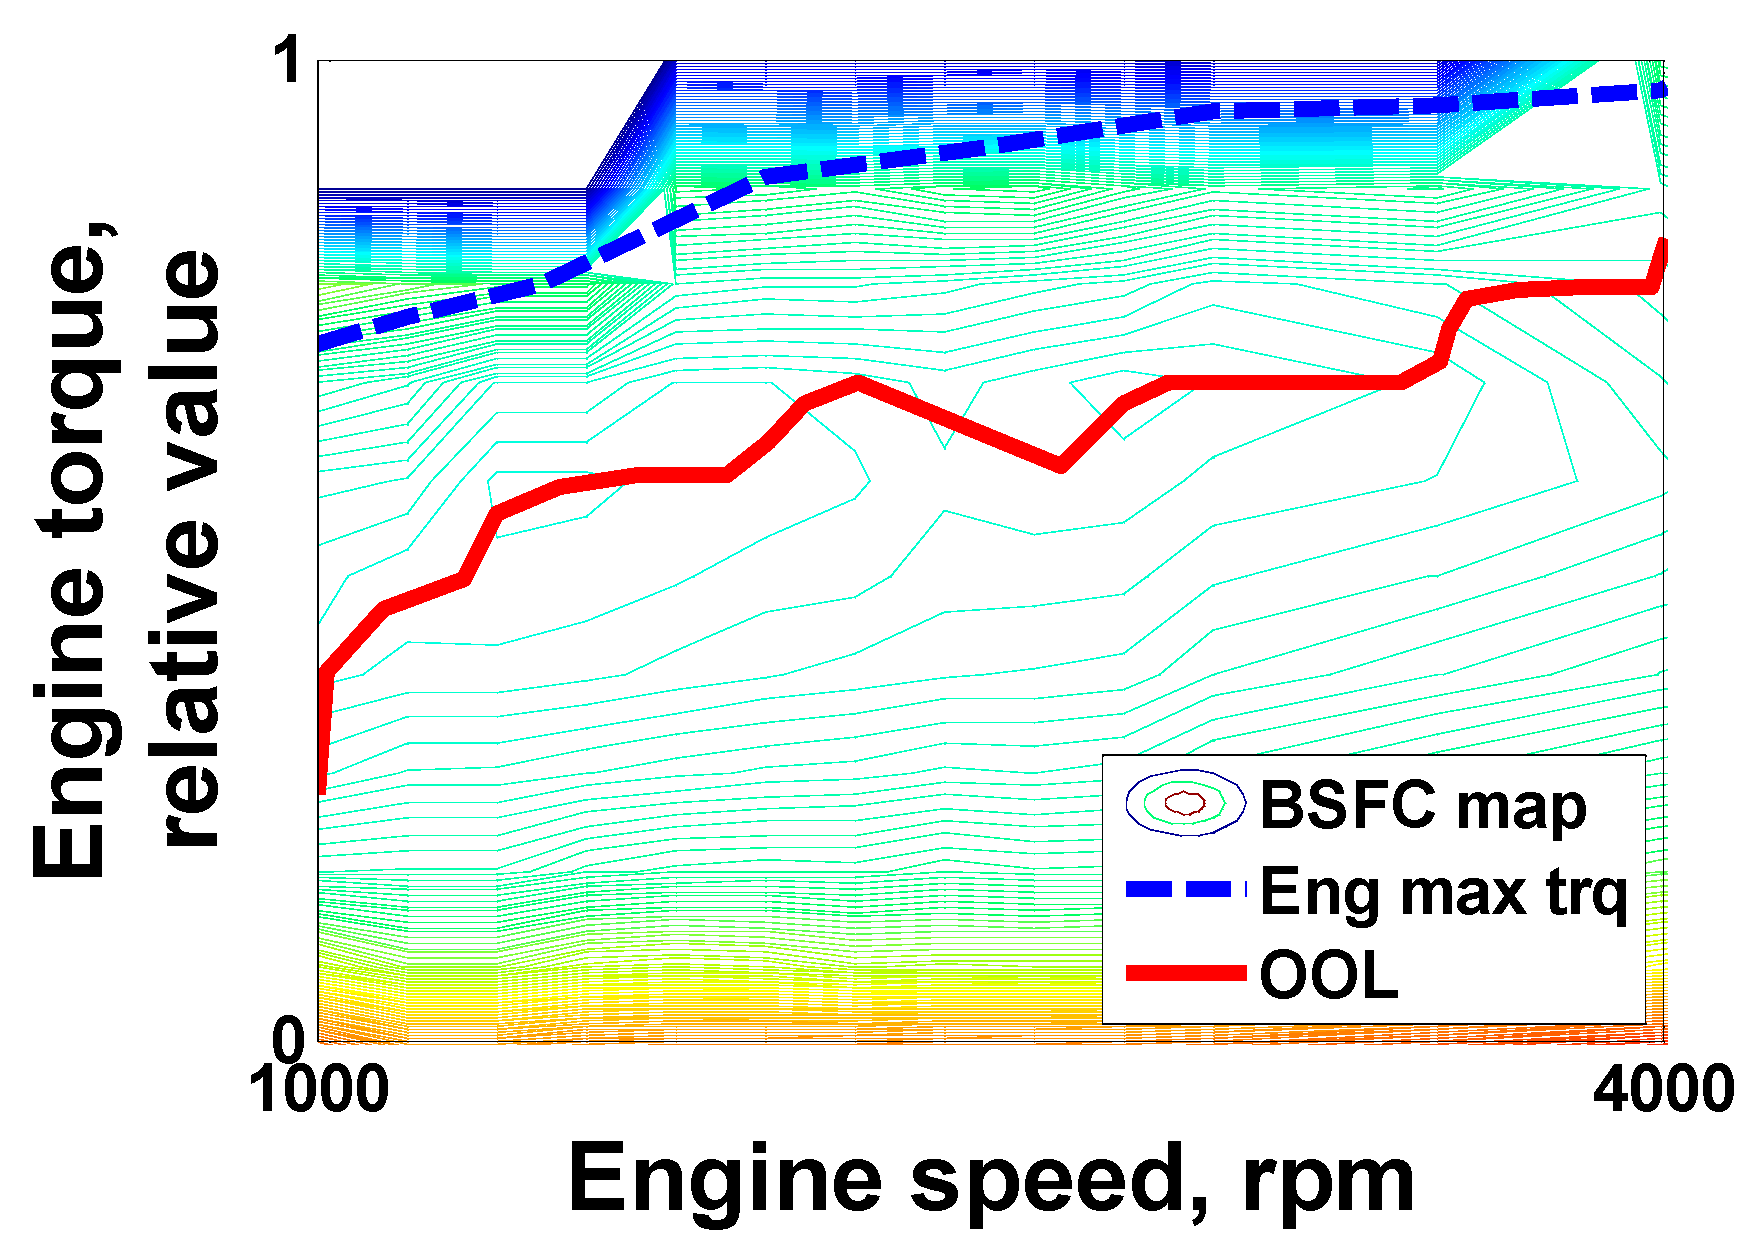
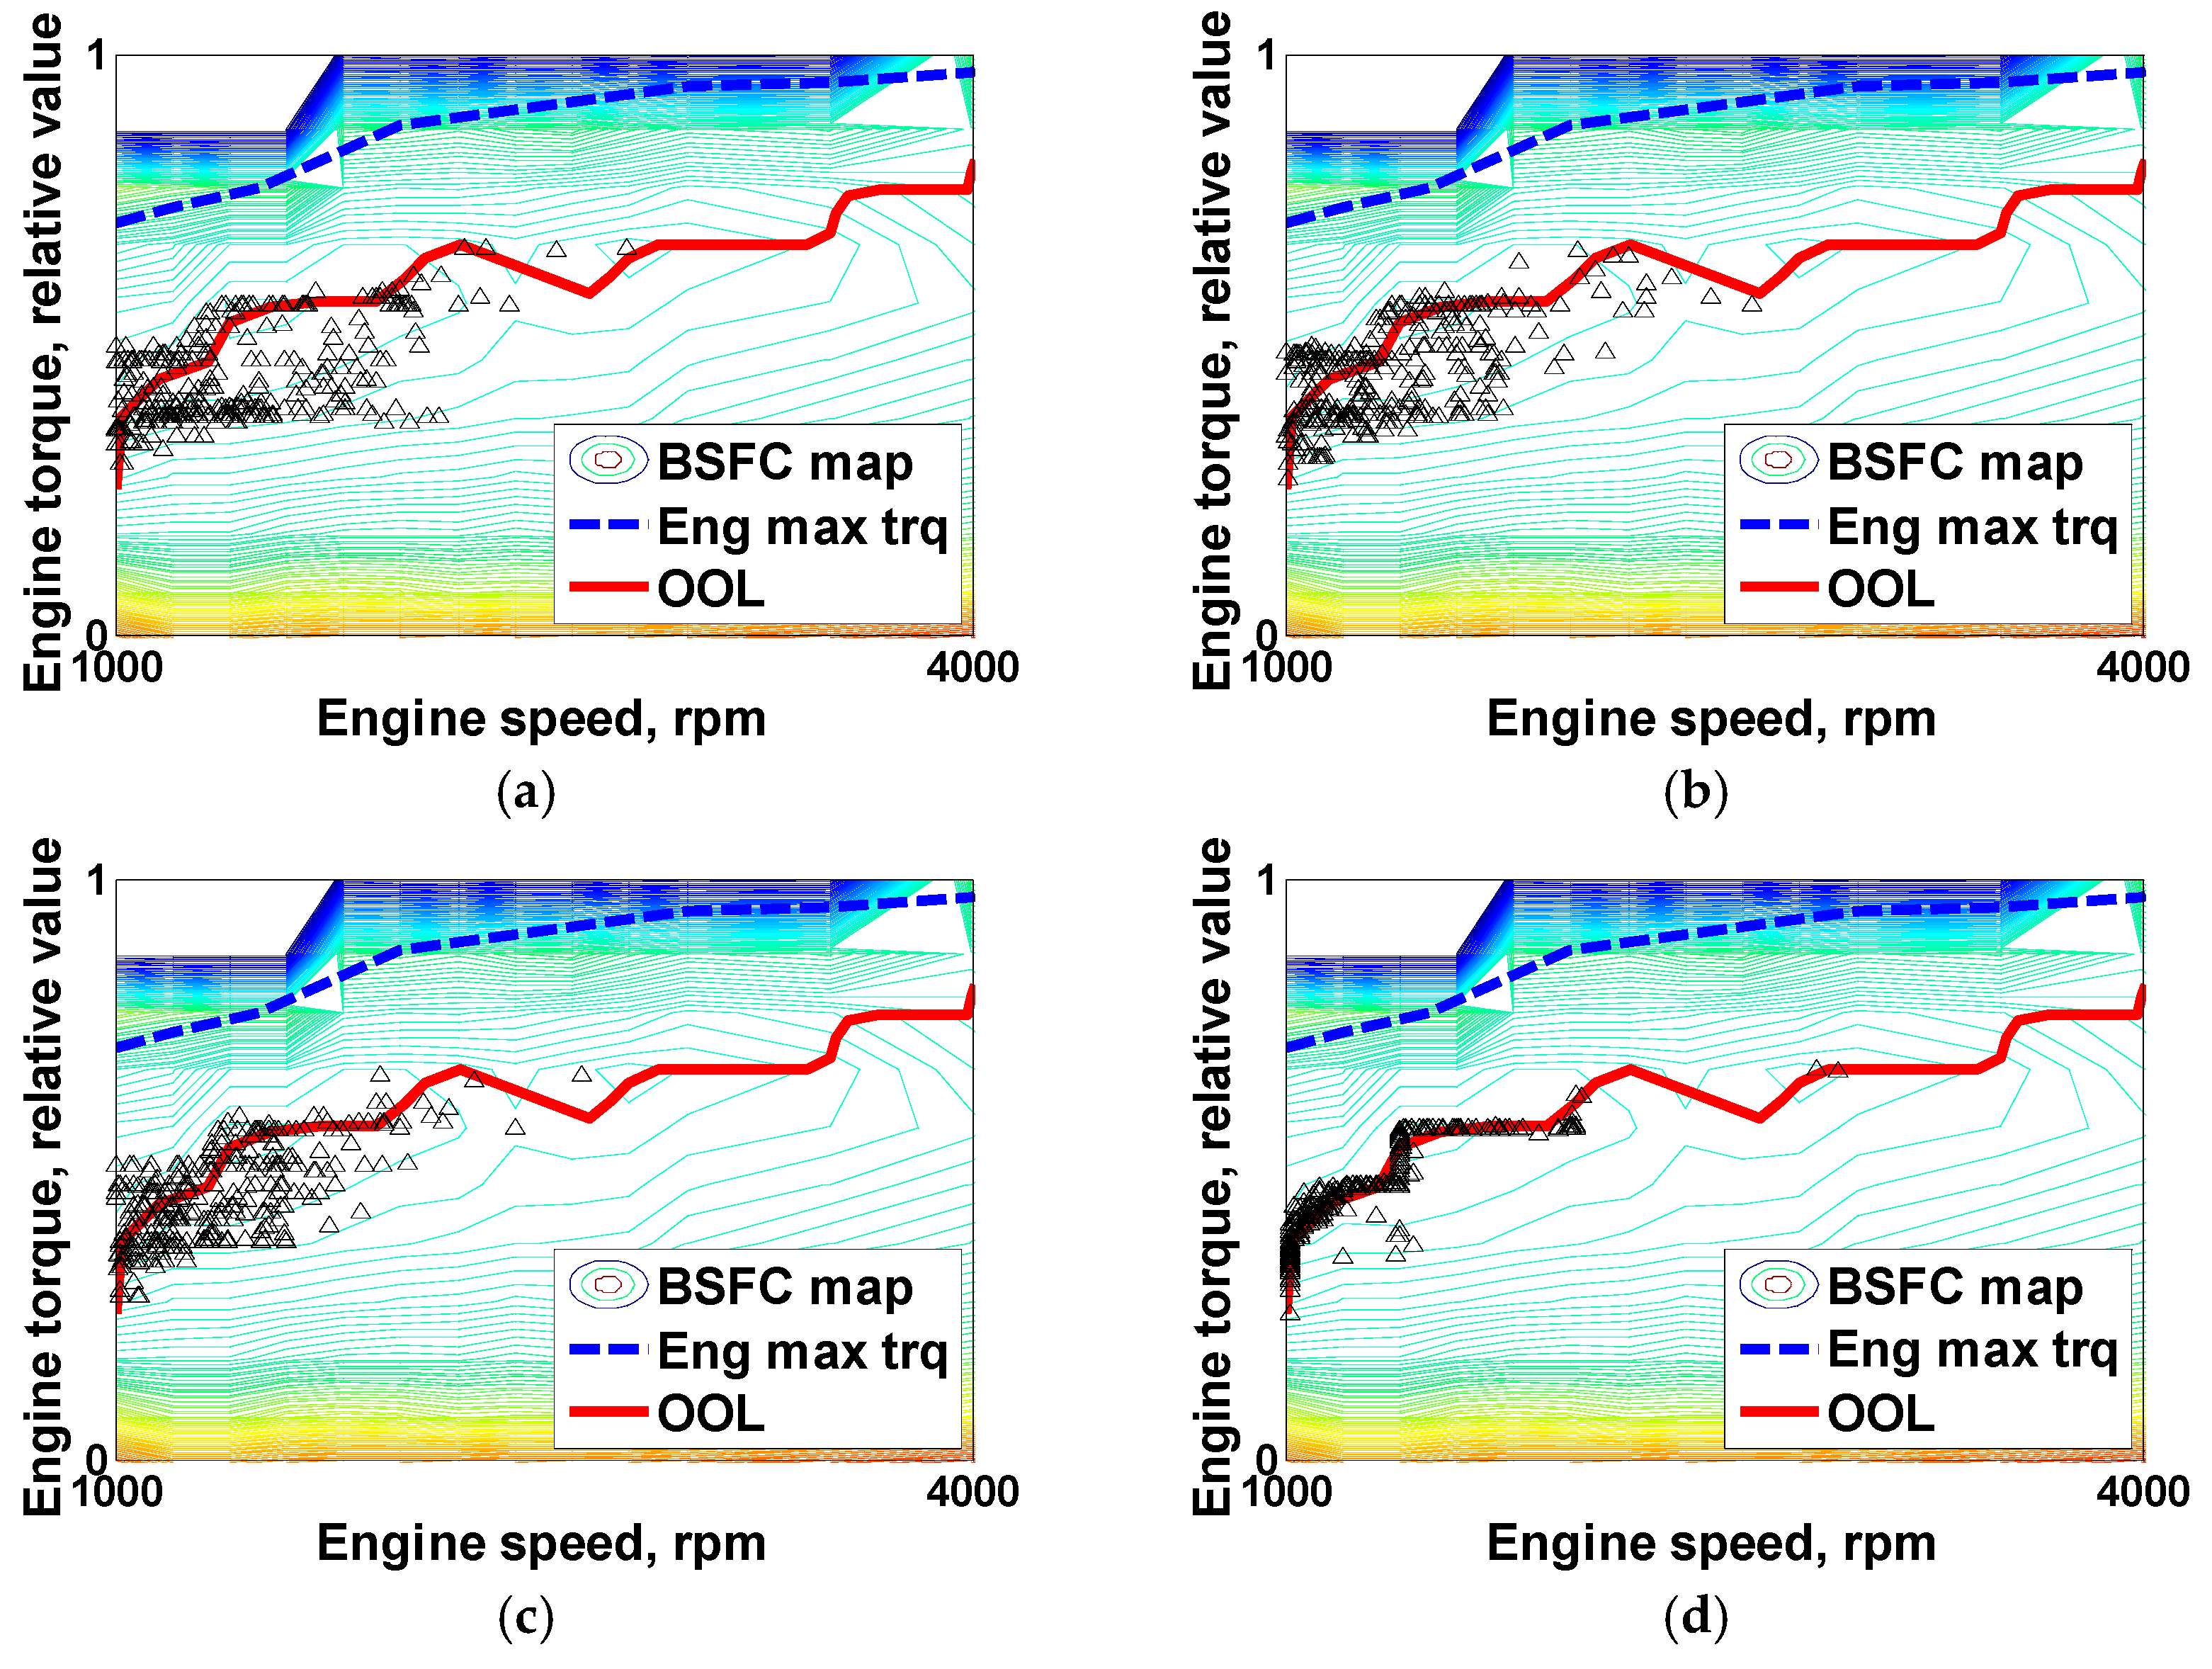
Figure 4 shows the characteristic map of the engine used in this study. The brake specific fuel consumption (BSFC), maximum torque, and optimal operating line (OOL) are shown. The engine OOL was obtained by connecting the engine operation points that have the smallest instantaneous fuel rate at the specific engine power.
2.3. Motor-Generator
Figure 5 shows the MG efficiency and maximum and minimum torque. The MG efficiency is represented by considering the discharging and charging state as follows:
where and are the power and efficiency, respectively.
2.4. Battery
The battery state of charge (SOC) was calculated as follows [19]:
where , , and are the current battery SOC, current, and battery capacity, respectively.
2.5. Electric Oil Pump
In this study, we assumed that one electric oil pump (EOP) was used for the hydraulic system to control the clutches and brakes in the transmission as well as to lubricate the drivetrain components [20]. Figure 6 illustrates a schematic diagram of the hydraulic system of the TMED type parallel HEV.
Some flow from the EOP is used to control the friction elements through the pressure control valve (PCV). The lubrication flow is supplied to the drivetrain components with reduced pressure through the PCV. In addition, leakages occur through the valve spool and seals of the clutch and brake. The hydraulic system power loss can be calculated by considering the efficiency of the EOP driving motor as follows [21]:
where the subscript EOP denotes the electric oil pump, and is the efficiency of the EOP driving motor.
Each hydraulic power loss is obtained as follows:
Control: For the clutch and brake control, the control power loss can be calculated as:
where and denote the pressure and flow rate, respectively, and and are the initial and final times.
In this study, we assumed that a constant control flow rate is consumed whenever the shift is performed.
Lubrication: We assumed that lubrication is performed with constant flow at constant pressure. Lubrication power loss is obtained as follows:
Leakage: Leakage occurs at the valve spool and seals of the clutch and brake. The flow rate of the leakage is calculated using the equations in Table 1.
Considering the leakage of the spool and seal, the leakage power loss is calculated as:
Specifications of the target parallel HEV investigated in this study are shown in Table 2.
2.6. Dynamic Programming for the Fuel Economy Potential of the Parallel HEV
A comparative analysis was performed to investigate the fuel economy potential of TMED type parallel HEVs for the number of gear steps. Since the fuel economy of an HEV depends on both the system configuration and the control strategy, the fuel economy potential should be evaluated when the HEV system is under optimal control. To solve the optimization problem, dynamic programming has been used to evaluate the fuel economy [14,15,16,17] or find the structures of HEV/PHEV [12,13], including the drivetrain losses [22].
In this study, a backward simulator was developed based on dynamic programming and consisted of local and global optimization [9,22]. The instantaneous fuel consumption rate for the engine speed and torque was calculated at each step in local optimization. In global optimization, the optimization problem was solved to minimize the fuel consumption by integrating the instantaneous fuel consumption rate from the local optimization [9,22,23,24,25].
The minimum fuel consumption from the initial (k = 1) step to the kth step is obtained by accumulating the instantaneous fuel consumption rates of the next step to of the minimum fuel consumption from the initial to (k − 1)-th step. The value of the state that does not guarantee optimality is deleted using Bellman’s principle. The optimal cost at each step is represented as follows [9,22,23,24,25]:
where and indicate the cost function and fuel consumption at the k step, respectively. By repeating the calculation of the optimal cost from k = 1 to N, the fuel consumption is obtained at each time step with respect to the driving time and battery SOC and is called the optimal field. Using the optimal field, the optimal paths of the engine, motor, and battery power that minimize the fuel consumption for the given driving cycle were obtained under the constraint of initial and final battery SOC.
3. Comparative Analysis of the Maximum Fuel Economy Potential of Parallel HEVs for the Number of Gear Steps
Maximum fuel economy potential of TMED type parallel HEV was investigated with respect to the number of gear steps for the following two cases:
- When transmission efficiency and EOP loss are not considered
- When transmission efficiency and EOP loss are considered
Backward simulations were performed for city cycle (urban dynamometer driving schedule (UDDS)) to analyze the powertrain characteristics of the parallel HEV.
3.1. Comparison without Considering Transmission Efficiency and EOP Loss
Table 4 compares the engine energy and efficiency, battery energy, power electronics system loss, and fuel economy with respect to the number of gear steps for UDDS.
The dynamic programming results in Table 4 show that the engine efficiency is improved as the number of gear step increases. The engine efficiency was obtained as follows [26]:
The engine efficiency improvement can be explained by the engine operation on the OOL, as shown in Figure 7. Figure 7 shows that the engine operation was performed more closely to the OOL with increasing gear steps. The engine of the CVT HEV operated almost on the OOL. The improvement rate of the engine efficiency was 0.13% to 0.66% as the number of gear steps increased.
During driving, the battery discharge and charge energy decrease with an increased number of gear steps. Table 5 shows the operation time for each driving mode and gear step for UDDS.
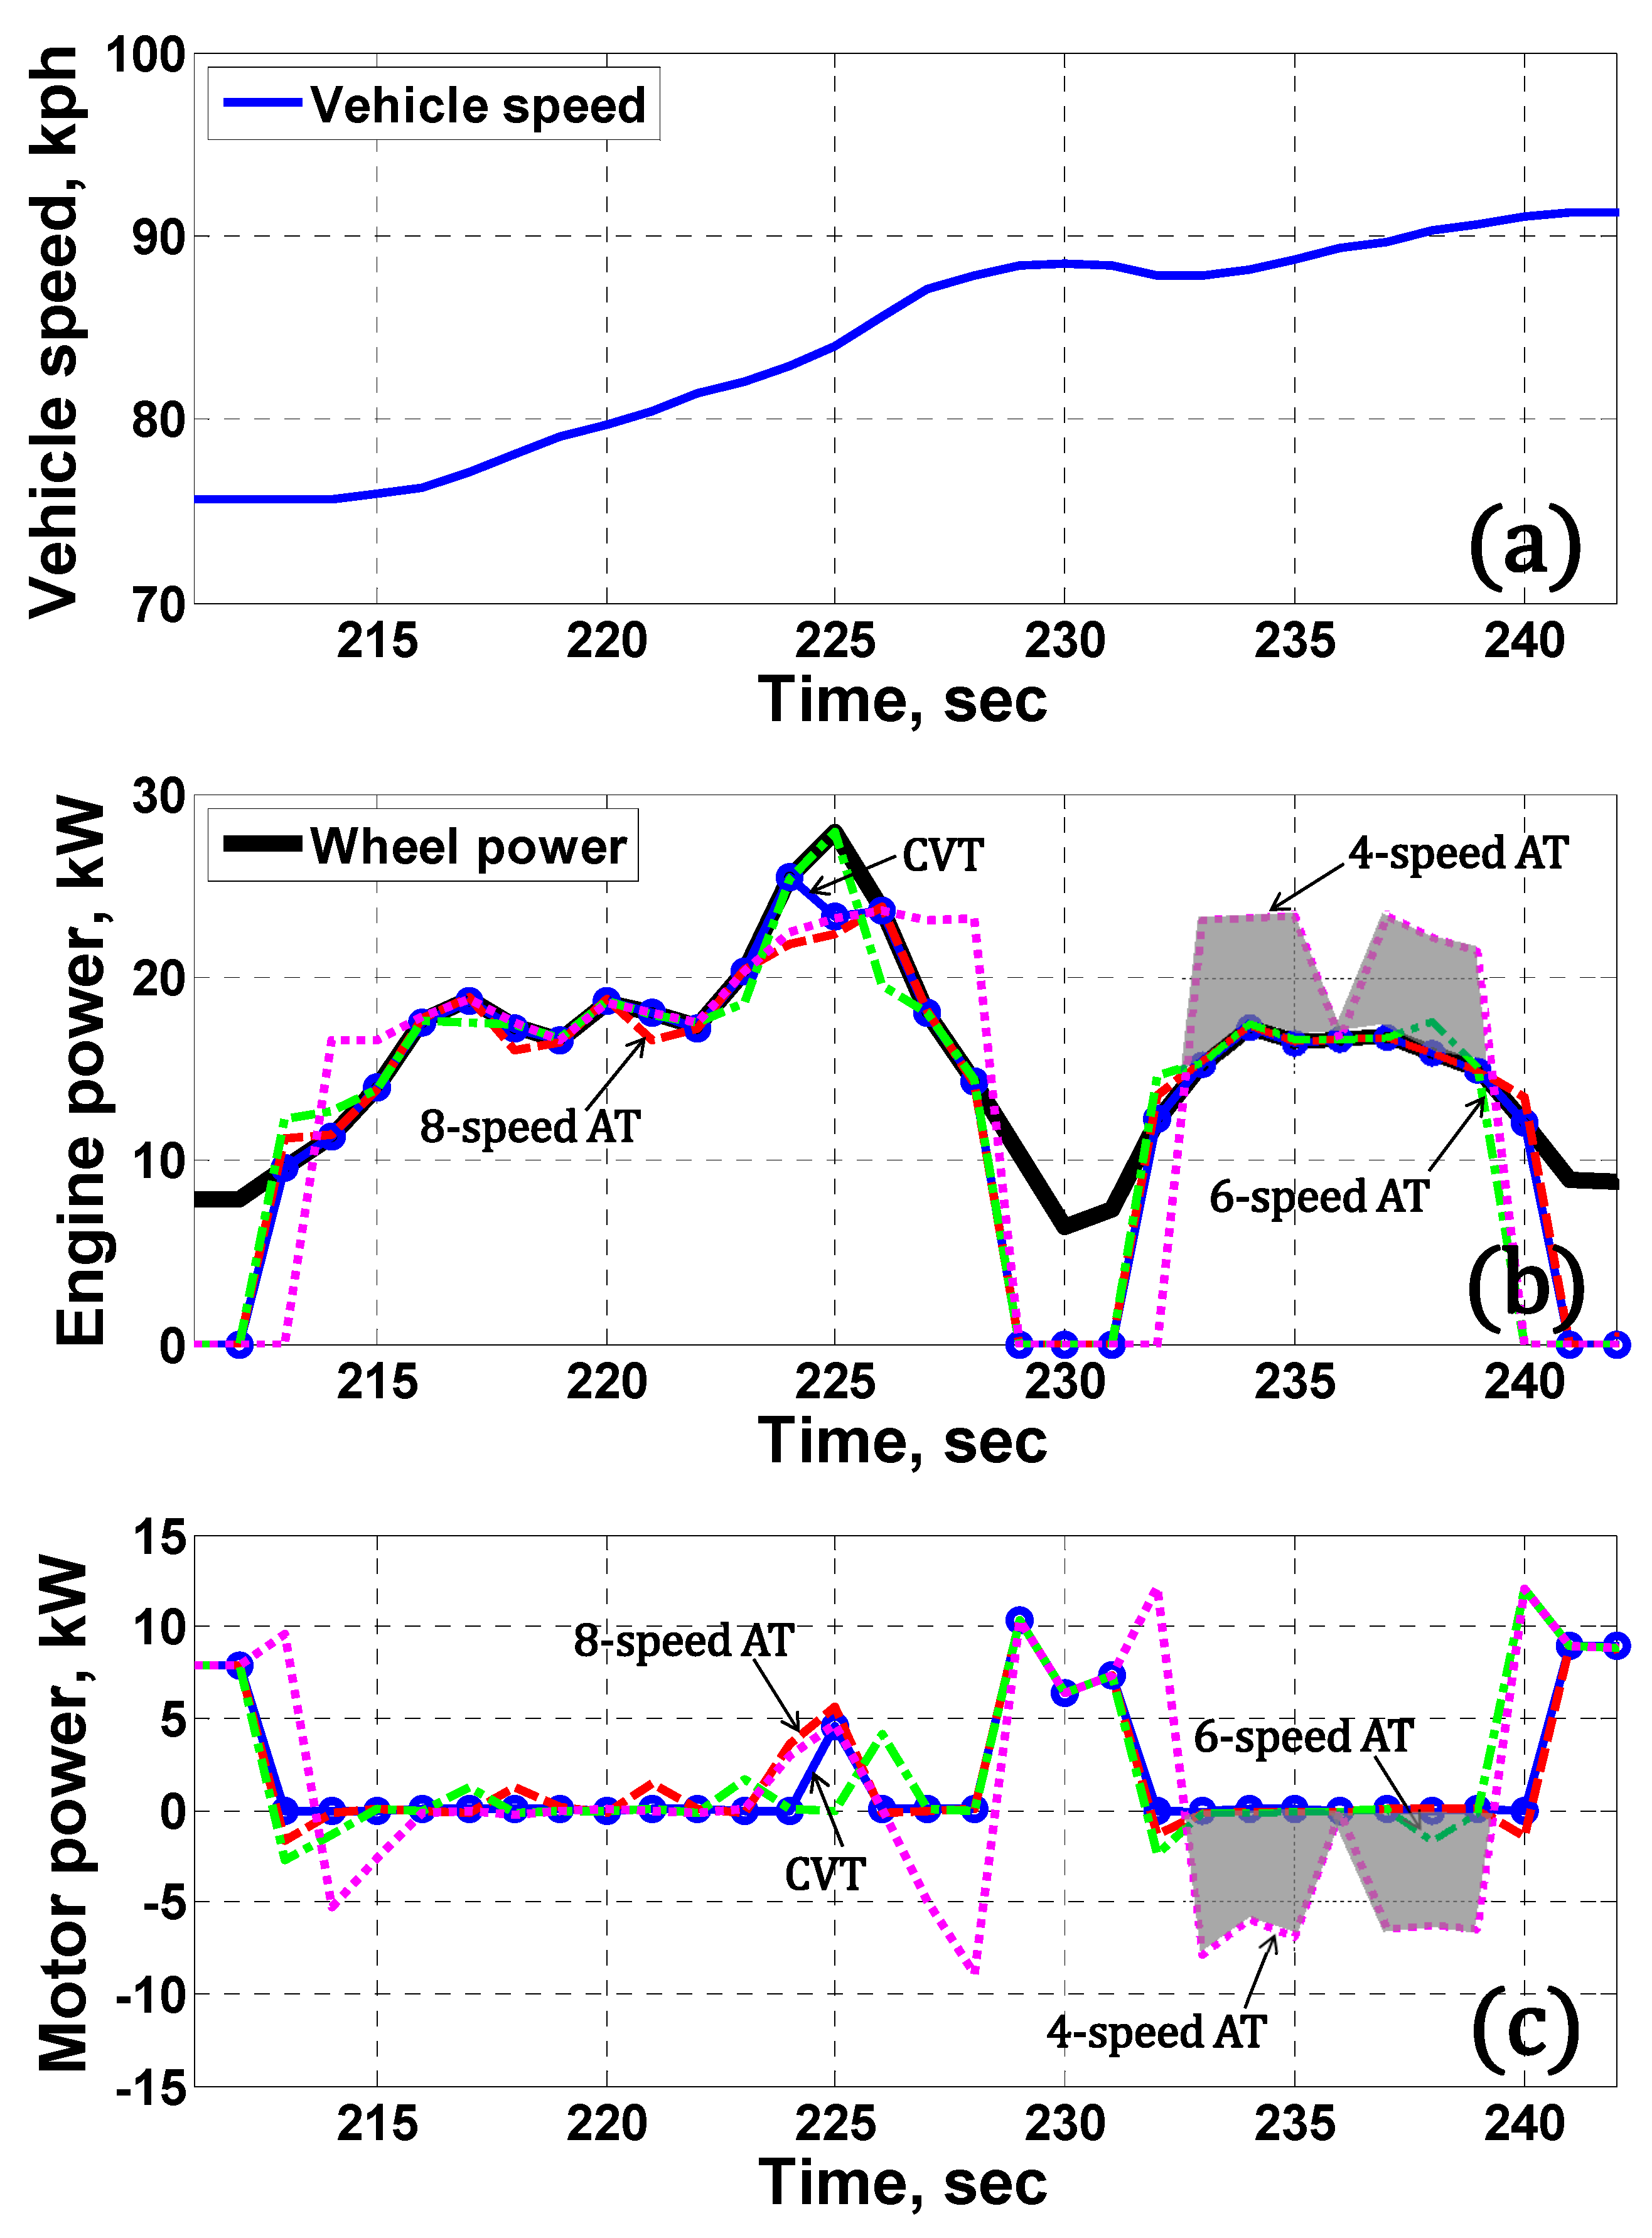
Since the CVT ratio is continuous, the total gear ratio span is divided into 12 steps with the same interval. As the number of gear steps increases from the 4-speed ⟶ 6-speed ⟶ 8-speed ⟶ CVT, the operation time of the EV mode becomes shorter from 493 s ⟶ 489 s ⟶ 488 s ⟶ 482 s, which results in decreasing battery energy. The demanded wheel powers are compared in Figure 8 with respect to the number of gear steps for t = 211–242 s of UDDS. In this region, the vehicle drives in HEV mode using the engine and motor. Most of the demanded wheel power is supplied by the engine (Figure 8b). Extra or insufficient power is compensated for by the motor, which is called ‘motor load leveling’ (Figure 8c). As the number of gear steps increases, the magnitude of the motor load leveling power decreases (Figure 8c) since the engine produces power that is closer to the demanded wheel power (Figure 8b), which was observed in the literature [9]. For instance, as shown in t = 233–239 s, the 4-speed AT shows the largest motor load leveling power (gray area) meanwhile that of the CVT is almost zero. This results in decreasing battery discharge and charge energy for driving from 2522 kJ ⟶ 2417 kJ ⟶ 2387 kJ ⟶ 2333 kJ and 201 kJ ⟶ 84 kJ ⟶ 54 kJ ⟶ 3 kJ for the 4-speed AT ⟶ 6-speed AT ⟶ 8-speed AT ⟶ CVT, respectively. As a result, the power electronics system (PE) loss such as the battery and motor loss decreases (Table 4).
There are two reasons why the PE loss decreases: (1) a decrease in the motor load leveling energy and (2) an increase in the motor operation efficiency. The decrease in the motor load leveling energy for an increasing number of gear steps can be seen in Figure 8. The motor efficiency is improved as shown in Table 4 because the motor operation points can be moved to a higher efficiency region by the increased number of gear steps. In braking, the battery charge energy increases from 2258 kJ ⟶ 2272 kJ ⟶ 2275 kJ ⟶ 2278 kJ (Table 4) as the number of gear steps increases because the motor can be operated in a more efficient region for regenerative braking. As a result, the PE loss decreases as the number of gear steps increases.
The dynamic programming results in Table 4 show that the fuel economy is improved as the number of gear steps increases. The improvement rate of the fuel economy was obtained as 1.39% ⟶ 0.41% ⟶ 0.73% from the 4-speed AT ⟶ 6-speed AT, 6-speed AT ⟶ 8-speed AT and 8-speed AT ⟶ CVT, respectively. It is noted that the improvement rate of the 4-speed ⟶ 6-speed is much higher than that of the 6-speed ⟶ 8-speed.
Table 6 shows of each gear step for the target transmissions. In this study, was defined as follows:
where the subscript and denote the transmission and final reduction gear, respectively.
Table 5 and Table 6 show that the 4-speed AT, 6-speed AT, and 8-speed AT operate in the 2nd gear step for 240 s, the 3rd gear step for 169 s, and the 3rd gear step for 167 s in EV mode, respectively. The CVT uses the 8th and 9th ratio steps for 68 s and 90 s, respectively. In EV mode, of the target transmissions is 6.33, 6.70, 5.97 and 5.08–7.18, respectively. This implies that the total gear ratio provides the optimal operation of MG used in this study when the vehicle drives in EV mode. On the other hand, in HEV mode, the 4-speed AT, 6-speed AT, 8-speed AT, and CVT select the 3rd gear step (108 s), 4th gear step (78 s), 6th gear step (56 s), and 11th and 12th steps (69 s, 91 s), respectively. The optimal gear ratio of is in HEV mode. In regenerative braking mode, the 1st gear step of each transmission is mostly selected, which provides the highest transmission ratio since large moves the motor operation points to the higher efficiency region for UDDS.
3.2. Comparison Considering Transmission Efficiency and EOP Loss
Next, the maximum fuel economy potentials of the 4-speed AT, 6-speed AT, 8-speed AT, and CVT type parallel HEV were investigated by considering both the power electronics system loss and the transmission efficiency and EOP loss for UDDS. The transmission efficiency was included in the backward simulations as a map with respect to the gear step, input speed, and torque as shown in Figure 2b and Figure 3b. The EOP loss was calculated using Equations (7)–(10) for each transmission system.
Table 7 compares the engine energy and efficiency, transmission average efficiency, battery energy, power electronics system loss, and fuel economy for UDDS when transmission efficiency and EOP loss were considered. It is seen that the engine energy increased compared to that of Table 4 due to the transmission efficiency and EOP loss. As the number of gear steps increases, the engine efficiency is improved because the engine can be operated closer to the OOL. The improvement rate of the engine efficiency is 0.08% to 0.24%, which is smaller than that of the case (Table 3) without transmission efficiency and EOP loss.
As the number of gear steps increases, the amount of battery discharge and charge energy during driving decrease from 2411 kJ ⟶ 2255 kJ ⟶ 2223 kJ ⟶ 2105 kJ and 321 kJ ⟶ 162 kJ ⟶ 126 kJ ⟶ 17 kJ for the 4-speed ⟶ 6-speed ⟶ 8-speed ⟶ CVT, respectively. This is because the amount of energy that flows through the motor and battery decreases with decreasing motor load leveling power. As a result, the PE loss from the motor and battery decreases as 577 kJ ⟶ 515 kJ ⟶ 501 kJ ⟶ 462 kJ for the 4-speed ⟶ 6-speed ⟶ 8-speed ⟶ CVT. The EOP loss of the CVT HEV shows the largest value of 490 kJ since the EOP had to manage the ratio control with high pressure and small flow rate and lubrication with low pressure and high flow rate.
The fuel economy is improved by increasing the number of gear steps for multi-step AT from 28.09 km/L ⟶ 28.46 km/L ⟶ 28.59 km/L for the 4-speed ⟶ 6-speed ⟶ 8-speed, respectively. However, the fuel economy of the CVT HEV dropped to 27.92 km/L due to the large EOP loss in spite of the reduced PE loss. Accordingly, improvements in fuel economy were obtained at 1.32%, 0.46%, and −2.34% for the 4-speed ⟶ 6-speed, 6-speed ⟶ 8-speed, and 8-speed ⟶ CVT, respectively. Fuel economy improvement rate was the greatest from the 4-speed to 6-speed, while the improvement rate decreased significantly for the higher gear step because of the effect of motor load leveling and increased drivetrain loss including the EOP loss, which is quite different from the fuel economy improvement rate of multi-step AT in conventional ICE vehicles. This result gives an important insight in determination of the number of gear steps for parallel HEV.
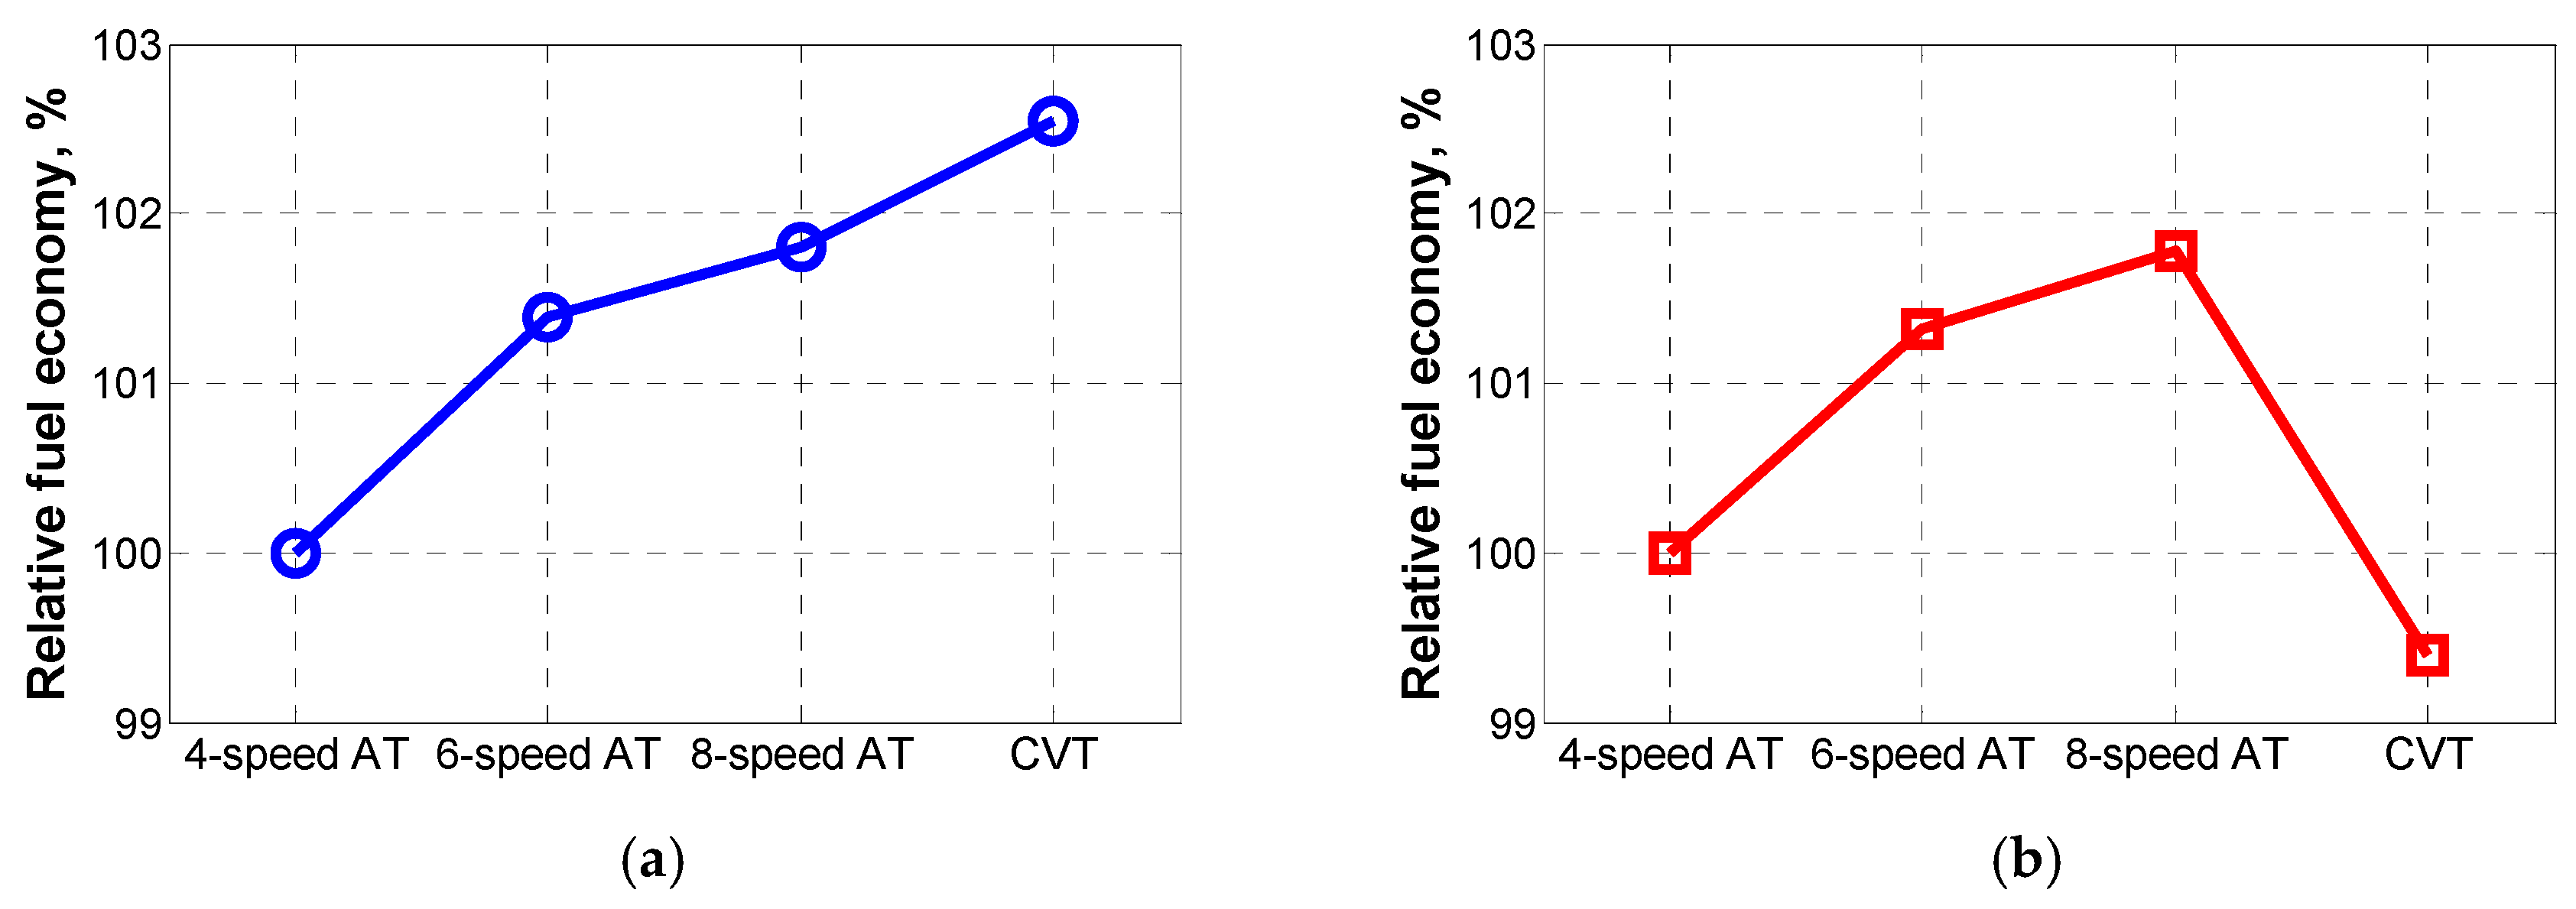
The relative fuel economy from the dynamic programming is compared in Figure 9 for the parallel HEV with respect to the number of gear steps for a city cycle (UDDS). In Figure 9, the relative fuel economy was represented in percentage on the basis of that of the 4-speed AT HEV. When the transmission efficiency and EOP loss were not considered (Figure 9a), the fuel economy of the multi-step AT improved with increasing gear steps, and the improvement rate from the 4-speed ⟶ 6-speed shows the largest value. Considering the transmission efficiency and EOP loss (Figure 9b), the fuel economy increases from 4-speed ⟶ 6-speed ⟶ 8-speed, showing the highest improvement rate at 4-speed ⟶ 6-speed. However, that of the CVT HEV drops due to the relatively large EOP loss. A comparative analysis of the data in Table 4 and Table 7, and Figure 9 shows that the fuel economy of the TMED type parallel HEV increased with an increasing number of gear steps since the engine efficiency increased. Meanwhile, the motor load leveling power and power electronics system loss decreased. A positive effect of the increased number of gear steps was observed in the multi-step AT HEV, and the largest improvement was obtained when the gear step increased from 4-speed to 6-speed. At higher gear steps, the positive effect decreased because of the negative effect of the increased power loss. When transmission efficiency and EOP loss were considered, similar behavior of the fuel economy was found for the multi-step AT in spite of the negative effect of the increased power loss. In CVT HEV, the fuel economy decreased compared to the multi-step AT HEV because of the increased hydraulic power loss due to a 3–4 times higher line pressure [27].
4. Comparison of Fuel Economy Potential for Parallel HEV and Power Split Type HEV
Powertrain characteristics of parallel HEVs were compared with power split type HEV. A TMED type 8-speed AT HEV and a Toyota hybrid system (THS) 3rd generation were selected as target HEVs.
4.1. Target Power Split Type HEV
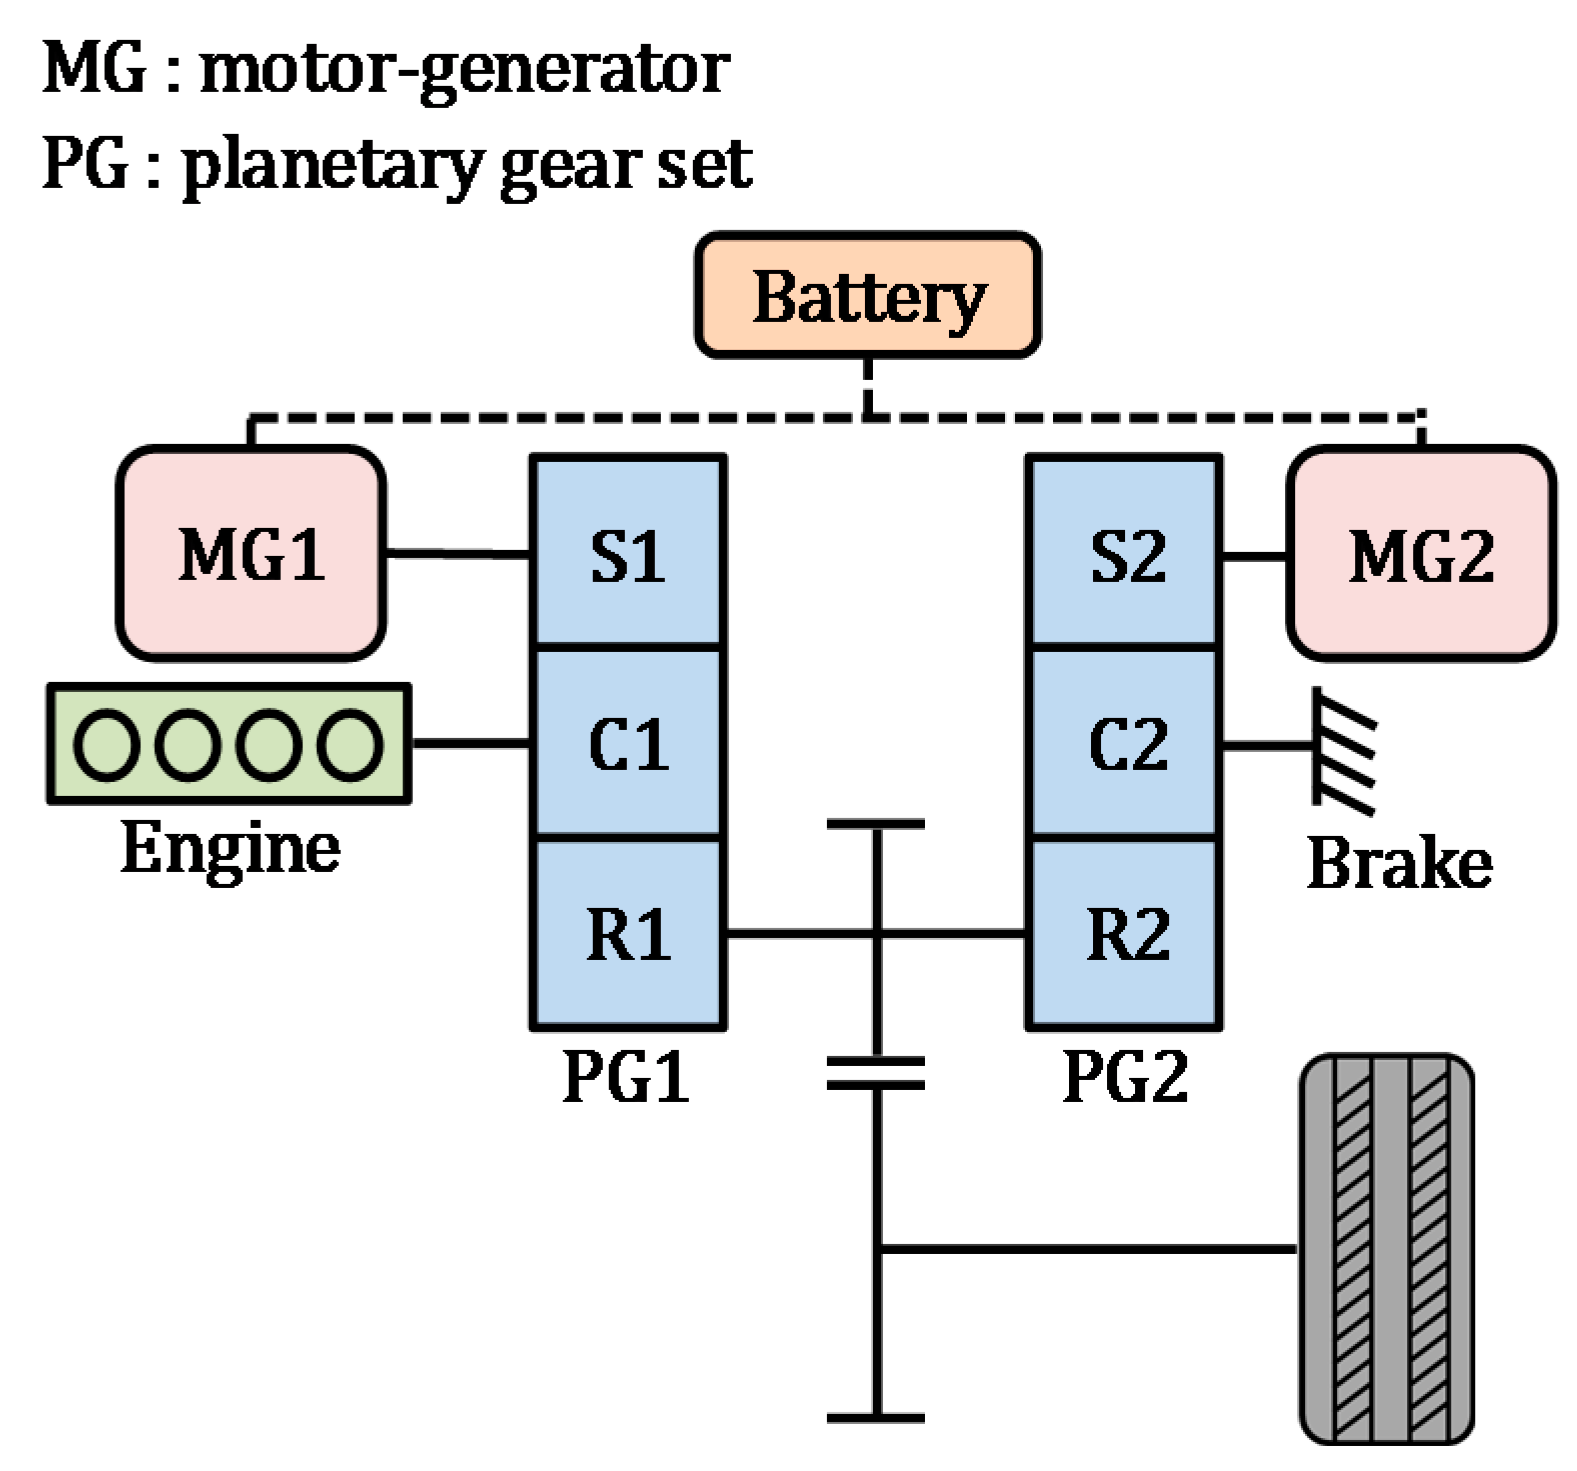
Figure 10 shows a schematic diagram of THS HEV, which consists of one engine, two motor-generators (MG1, MG2), and two planetary gear sets (PG1, PG2). The THS is an input-split type in which the engine power is split to mechanical and electrical paths at the PG1, and the e-CVT function can be realized by the MG1 speed control. The PG2 serves as a simple reduction gear because the brake is always engaged at the carrier (C) [28,29].
Power flow, motor speed, and torque equations of the power split type HEV are shown in Table 8 for each driving mode. In HEV mode, the engine power is split at the PG1 when the speed ratio is higher than the mechanical point [30]. The engine power transmitted to MG1 is used for generating, and the remaining power to the wheel is used to propel the vehicle. When the speed ratio is lower than the mechanical point, i.e., a high vehicle speed, the power flows through the closed loop of the mechanical and electrical paths. Once power circulation occurs, the powertrain efficiency drastically drops since the power is transmitted through the electrical path with relatively low efficiency [10,11].
For a fair comparison, the same vehicle specifications should be used for both the parallel and power split type HEVs. The same vehicle weight and engine were used. In addition, both HEVs must have the same acceleration performance. In this study, the MG2 capacity of the power split type HEV was determined to provide the same acceleration performance as the parallel type as follows:
0–100 kph Acceleration Performance: Within 9.4 s
To select the MG2 capacity that satisfies the acceleration performance, the model ‘Split Single Mode HEV With Fixed Ratio On Mg1 2wd Midsize’ in Autonomie was used [31]. Simulation results showed that the MG2 power was 90 kW, which gives a 0–100 kph acceleration performance of 9.31 s.
The EOP loss of the power split type HEV was calculated using Equation (7). In the power split type HEV, the EOP works only for lubrication because clutch and brake are not used.
Drivetrain component loss of the target power split type HEV was obtained for the reduction gear, planetary gear set, MG1 unloaded loss, bearing, and differential gear [22,32]. Drivetrain component losses used in this study are shown in Table 9. A backward simulator was developed based on dynamic programming using the vehicle specifications and drivetrain losses (Table 9).
4.2. Comparative Analysis of Power Split Type HEV and Parallel HEV
Powertrain characteristics of the power split type HEV were compared to the 8-speed AT parallel HEV. The backward simulations were performed for a city cycle (UDDS). In Table 10, the engine efficiency, battery energy, power electronics system loss, transmission loss, and fuel economy are compared for UDDS. The engine efficiency of the power split type HEV is 38.17%, which is slightly higher than that of parallel HEV (37.98%). This is because e-CVT function of the power split type can cause the engine to operate in a more efficient region. During driving, the battery discharge and charge energy of the power split type HEV are 3272 kJ and 1068 kJ, which are much larger than that of 2223 kJ and 126 kJ of the parallel HEV, respectively. The reason why the battery charge energy is approximately eight times higher is that some part of the engine power (which is split at the PG1) generates MG1 to charge the battery in HEV mode. In braking, the battery charge energy of the power split type HEV is larger than that of the parallel HEV because more energy can be recuperated by the larger MG2, whose capacity is 90 kW. The larger battery discharge and charge energy cause an increase in PE loss, which is almost double (874 kJ) that of the parallel HEV (501 kJ). On the other hand, the drivetrain loss of the power split type HEV is 343 kJ, which is much smaller than that of the parallel HEV (635 kJ) due to its relatively simple architecture. The EOP loss of the power split type HEV was 57 kJ, which is much less than that of the parallel HEV (237 kJ). This is because the EOP works only for lubrication without clutch and brake control.
For UDDS, although the PE loss of the power split type HEV is much larger due to the two large motors, the fuel economy is slightly higher at 28.66 km/L compared to the parallel HEV (28.59 km/L).
Table 10 shows that reduced drivetrain loss and EOP loss due to the relatively simple structure have a positive effect on the fuel economy of the power split type HEV. Meanwhile, the increased PE loss from the two large MGs has a negative effect.
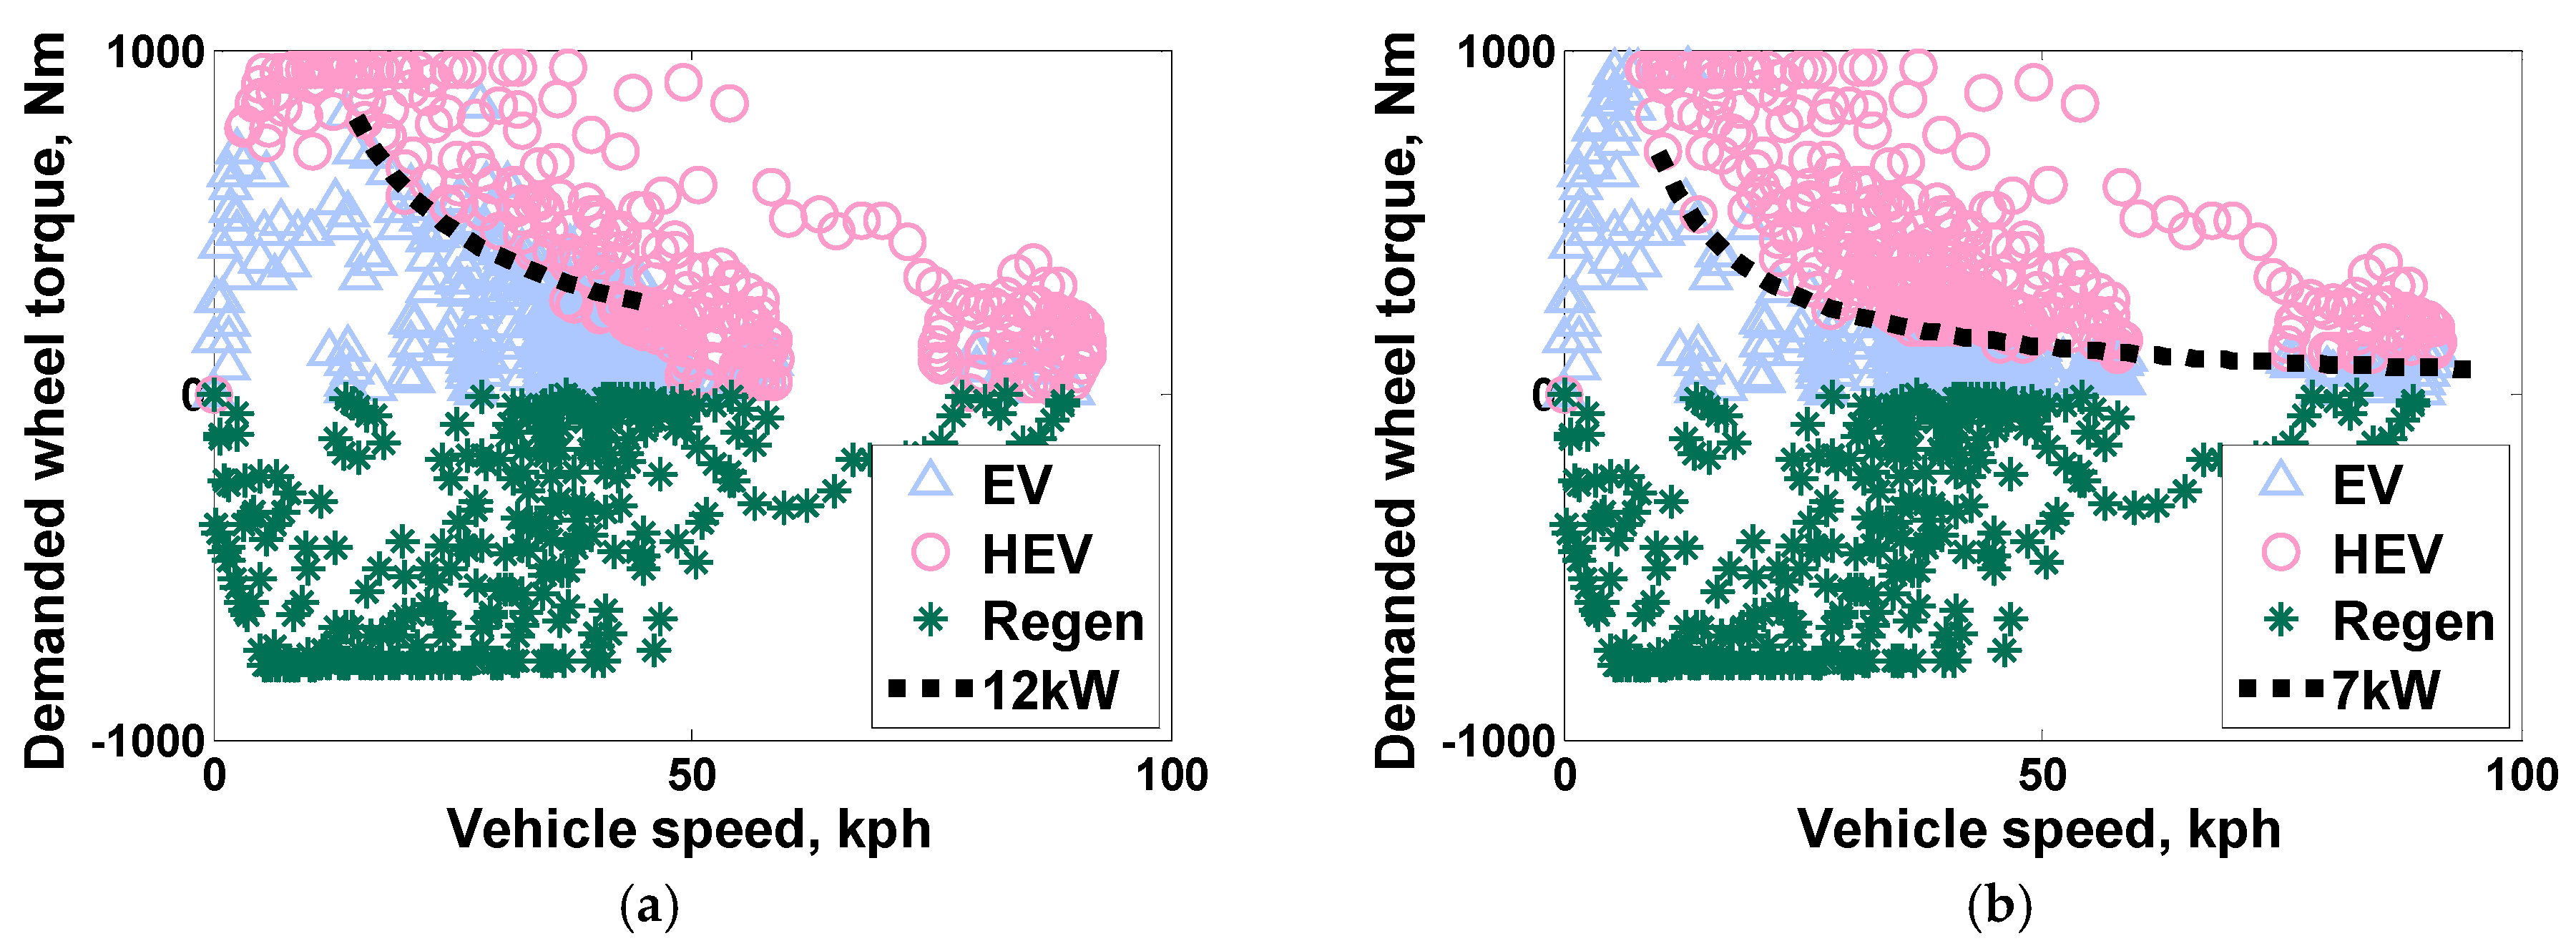
The dynamic programming results of the vehicle operation points are shown in Figure 11 with respect to the demanded wheel torque and vehicle speed. As shown in Figure 11a, when the power split type HEV drives for UDDS, the mode shift occurs approximately at the demanded wheel power of 12 kW when the vehicle speed is below 40 kph. Between 40 kph and 55 kph, the mode shift power becomes lower. The HEV mode is mostly selected for a vehicle speed above 55 kph. On the other hand, for the parallel HEV, which has a 38 kW MG, the mode shift is performed at around 7 kW (Figure 11b), which means that the EV mode is selected in the lower power region rather than the power split type. This is because the motor capacity of the parallel HEV is much smaller than that of the power split HEV.
From the comparative analysis using dynamic programming, it was found that the following factors need to be evaluated quantitatively in the development of the HEV:
- Parallel HEV
- Positive factors can be obtained from the small power electronics system loss and relatively low cost using one small capacity MG
- Negative factors are the large drivetrain component loss including the EOP loss inherent from the relatively complicated architecture
- Power split type HEV
- Positive factors come from the improved engine efficiency by the e-CVT function using two mgs and small drivetrain loss from a relatively simple architecture
- Negative factors relate to the large power electronics system loss due to the two large capacity MGs.
5. Conclusions
Fuel economy potential and power characteristics were compared for parallel and power split type HEVs. First, to investigate the fuel economy of the parallel HEV with respect to the number of gear steps, 4-speed AT, 6-speed AT, 8-speed AT, and CVT were selected as target transmissions. Using the dynamic programming, a comparative analysis was performed to investigate the fuel economy, transmission loss, and power electronics system loss. In the dynamic programming, transmission efficiency was considered with respect to the speed, torque and gear ratio. In addition, EOP loss was included by considering the flow rate for control, lubrication, and leakage. It was found that as the number of gear steps increased, the engine efficiency increased since the engine operation performed more closely to the OOL. In addition, the engine power becomes closer to the demanded wheel power. As a result, the motor load leveling power decreased with the increasing number of gear steps, and power electronics system loss decreased. Fuel economy improvement rate was the greatest from the 4-speed to 6-speed, while the improvement rate decreased for the higher gear steps because of the effect of motor load leveling and increased drivetrain loss including the EOP loss. The CVT HEV showed a negative improvement rate compared to the multi-step AT HEV because one EOP must manage the ratio control with high pressure and small flow rate as well as the lubrication with low pressure and high flow rate. Therefore, the positive effect of the improved engine efficiency and reduced power electronics system loss by the increased gear step and negative effect of the power loss inherent from the additional drivetrain elements should be considered in the design of parallel HEVs.
In addition, the powertrain characteristics of the 8-speed AT type parallel HEV were compared to those of the power split type HEV, i.e., Toyota hybrid system (THS). A comparative analysis using dynamic programming showed that the power electronics system loss of the power split type HEV was almost double that of the parallel HEV due to the two large MGs. However, the drivetrain loss of the power split type HEV was smaller due to its relatively simple architecture. Also, the EOP loss was much smaller because the EOP works only for lubrication.
It is expected that the power characteristics of the parallel and power split type HEV obtained from the DP results can be used in the development of an HEV system.
Author Contributions
H.K. performed comparative analysis for evaluating the fuel economy potential of a parallel HEV and a power split type HEV using dynamic programming and wrote the paper. J.W. and J.Y. contributed in development of the drivetrain models including EOP loss. H.S. provided a basis of backward simulator for dynamic programming. C.P. provided the resources and experimental data of the transmissions for TMED HEVs. H.K. supervised this research and wrote the paper.
Funding
This research was partially funded by Hyundai Powertech Company.
Acknowledgments
Authors want to express their acknowledgments to Hyundai Powertech Company for their technical support.
Conflicts of Interest
The authors declare no conflict of interest.
Nomenclature
| C | battery capacity |
| N | transmission gear ratio |
| P | power |
| Q | flow rate |
| T | torque |
| V | voltage |
| i | current |
| p | pressure |
| efficiency | |
| speed | |
| Subscript | |
| batt | battery |
| pri | primary |
| sec | secondary |
References
- An, F.; Earley, R.; Green-Weiskel, L. Global Overview on Fuel Efficiency and Motor Vehicle Emission Standards: Policy Options and Perspectives for International Cooperation; United Nations Background Paper No. 3; United Nations Department of Economic and Social Affairs: New York, NY, USA, 2011. [Google Scholar]
- Chambliss, S.; Miller, J.; Façanha, C.; Minjares, R.; Blumberg, K. The Impact of Stringent Fuel and Vehicle Standards on Premature Mortality and Emissions. International Council on Clean Transportation, 2013. Available online: https://www.theicct.org/sites/default/files/publications/ICCT_HealthClimateRoadmap_2013_revised.pdf (accessed on 11 August 2018).
- Toyota. Toyota Aims for Sales of More Than 5.5 Million Electrified Vehicles Including 1 Million Zero-Emission Vehicles per Year by 2030. Available online: https://newsroom.toyota.co.jp/en/corporate/20353243.html (accessed on 22 April 2018).
- Krishna, S. Mercedes-Benz Plans Electric Versions of All Its Models by 2022. Available online: https://www.engadget.com/2017/09/11/mercedes-benz-electric-versions-2022/ (accessed on 22 April 2018).
- International Energy Agency (IEA). World Energy Outlook. 2009. Available online: http://www.worldenergyoutlook.org/media/weowebsite/2009/WEO2009.pdf (accessed on 22 April 2018).
- Goppelt, G. The DHT Redefining Hybrid Transmissions. MTZ Worldw. 2016, 77, 8–15. [Google Scholar] [CrossRef]
- Moawad, A.; Rousseau, A. Effect of Transmission Technologies on Fuel Efficiency—Final Report; Argonne National Laboratory: Lemont, IL, USA, 2012; pp. 28–31.
- Moskalik, A.; Hula, A.; Barba, D.; Kargul, J. Investigating the Effect of Advanced Automatic Transmissions on Fuel Consumption Using Vehicle Testing and Modeling. SAE Int. J. Engines 2016, 9, 1916–1928. [Google Scholar] [CrossRef]
- Kim, H.; Wi, J.; Yoo, J.; Son, H.; Park, C.; Kim, H. Influence of number of gear step on engine and motor operation characteristics for parallel HEV. In Proceedings of the 2018 Thirteenth International Conference on Ecological Vehicles and Renewable Energies (EVER2018), Monte Carlo, Monaco, 10–12 April 2018. [Google Scholar]
- Kim, N.; Kwon, J.; Rousseau, A. Trade-off between multi-mode powertrain complexity and fuel consumption. In Proceedings of the 25th World Battery, Hybrid and Fuel Cell Electric Vehicle Symposium & Exhibition, Shenzhen, China, 5–8 November 2010. [Google Scholar]
- Kim, J.; Kim, N.; Hwang, S.; Hori, Y.; Kim, H. Motor control of input-split hybrid electric vehicles. Int. J. Automot. Technol. 2009, 10, 733. [Google Scholar] [CrossRef]
- Kim, H.; Kum, D. Comprehensive design methodology of input-and output-split hybrid electric vehicles: In search of optimal configuration. IEEE/ASME Trans. Mechatron. 2016, 21, 2912–2923. [Google Scholar] [CrossRef]
- Son, H.; Park, K.; Hwang, S.; Kim, H. Design methodology of a power split type plug-in hybrid electric vehicle considering drivetrain losses. Energies 2017, 10, 437. [Google Scholar] [CrossRef]
- Zhang, X.; Li, C.-T.; Kum, D.; Peng, H. Prius+ and Volt-: Configuration Analysis of Power-Split Hybrid Vehicles With a Single Planetary Gear. IEEE Trans. Veh. Technol. 2012, 61, 3544–3552. [Google Scholar] [CrossRef]
- Yang, Y.; Hu, X.; Pei, H.; Peng, Z. Comparison of power-split and parallel hybrid powertrain architectures with a single electric machine: Dynamic programming approach. Appl. Energy 2016, 168, 683–690. [Google Scholar] [CrossRef]
- Wang, R.; Lukic, S.M. Dynamic programming technique in hybrid electric vehicle optimization. In Proceedings of the 2012 IEEE International Electric Vehicle Conference (IEVC), Greenville, SC, USA, 4–8 March 2012; IEEE: Piscataway, NJ, USA, 2012; pp. 1–8. [Google Scholar]
- Wang, X.; He, H.; Sun, F.; Zhang, J. Application study on the dynamic programming algorithm for energy management of plug-in hybrid electric vehicles. Energies 2015, 8, 3225–3244. [Google Scholar] [CrossRef]
- Vroemen, B.G. Component Control for the Zero Inertia Powertrain; Technische Universiteit Eindhoven: Eindhoven, The Netherlands, 2001. [Google Scholar]
- Pang, S.; Farrell, J.; Du, J.; Barth, M. Battery state-of-charge estimation. In Proceedings of the American Control Conference, Arlington, VA, USA, 25–27 June 2001; IEEE: Piscataway, NJ, USA, 2001; pp. 1644–1649. [Google Scholar]
- Kim, Y.; Lee, J.; Jo, C.; Kim, Y.; Song, M.; Kim, J.; Kim, H. Development and control of an electric oil pump for automatic transmission-based hybrid electric vehicle. IEEE Trans. Veh. Technol. 2011, 60, 1981–1990. [Google Scholar] [CrossRef]
- Song, M.; Oh, J.; Choi, S.; Kim, Y.; Kim, H. Optimal line pressure control for an automatic transmission-based parallel hybrid electric vehicle considering mode change and gear shift. Adv. Mech. Eng. 2014, 6, 216098. [Google Scholar] [CrossRef]
- Son, H.; Kim, H. Development of near optimal rule-based control for plug-in hybrid electric vehicles taking into account drivetrain component losses. Energies 2016, 9, 420. [Google Scholar] [CrossRef]
- Onori, S.; Serrao, L.; Rizzoni, G. Hybrid Electric Vehicles: Energy Management Strategies; Springer: Berlin, Germany, 2016. [Google Scholar]
- Kirk, D.E. Optimal Control Theory: An Introduction; Courier Corporation: Mineola, NY, USA, 2012. [Google Scholar]
- Kim, N. Energy Management Strategy for Hybrid Electric Vehicles Based on Pontryagin’s Minimum Principle; Seoul National University: Seoul, Korea, 2009. [Google Scholar]
- Department of Energy. Electric and Hybrid Vehicle Research, Development, and Demonstration Program; Petroleum-Equivalent Fuel Economy Calculation. Federal Register; 2000. Available online: https://www.federalregister.gov/documents/2000/06/12/00-14446/electric-and-hybrid-vehicle-research-development-and-demonstration-program-petroleum-equivalent-fuel (accessed on 22 April 2018).
- Wi, J.; Kim, H.; Yoo, J.; Son, H.; Kim, B.; Kim, H. Energy consumption of parallel type hybrid electric vehicle with continuously variable transmission using electric oil pump. In Proceedings of the 2018 Thirteenth International Conference on Ecological Vehicles and Renewable Energies (EVER2018), Monte Carlo, Monaco, 10–12 April 2018. [Google Scholar]
- Negoro, A.B.; Purwadi, A. Performance Analysis on Power Train Drive System of the 2012 Toyota Camry Hybrid. Procedia Technol. 2013, 11, 1054–1064. [Google Scholar] [CrossRef]
- Kim, N.; Rousseau, A.; Rask, E. Autonomie Model Validation with Test Data for 2010 Toyota Prius; SAE Technical Paper 0148-7191; SAE: Warrendale, PA, USA, 2012. [Google Scholar]
- Ma, C.; Kang, J.; Choi, W.; Song, M.; Ji, J.; Kim, H. A comparative study on the power characteristics and control strategies for plug-in hybrid electric vehicles. Int. J. Automot. Technol. 2012, 13, 505–516. [Google Scholar] [CrossRef]
- Autonomie, A. What Can Autonomie Do for You. Available online: https://www.autonomie.net/docs/5%20-%20Presentations/Software/what_can_autonomie.pdf (accessed on 22 April 2018).
- Haka, R.J. Determination of Efficiency (Torque Related Losses) in Planetary Gearsets: Generalized Theory for Simple and Compound Gearsets. In Proceedings of the ASME 2003 International Design Engineering Technical Conferences and Computers and Information in Engineering Conference, Chicago, IL, USA, 2–6 September 2003; American Society of Mechanical Engineers: New York, NY, USA, 2003; pp. 1085–1097. [Google Scholar]
Figure 1.
Schematic diagram of TMED type parallel HEV.

Figure 2.
(a) Schematic diagram of the 4-speed AT; (b) Transmission efficiency at the 1st gear step.
Figure 2.
(a) Schematic diagram of the 4-speed AT; (b) Transmission efficiency at the 1st gear step.

Figure 3.
(a) Schematic diagram of CVT; (b) Mechanical efficiency map of CVT [18].
Figure 3.
(a) Schematic diagram of CVT; (b) Mechanical efficiency map of CVT [18].

Figure 4.
Engine characteristic map.

Figure 5.
Motor-generator efficiency map.

Figure 6.
Schematic diagram of the hydraulic system for TMED type parallel HEV.

Figure 7.
Engine operating points for UDDS without considering the transmission efficiency and EOP loss: (a) 4-speed AT HEV; (b) 6-speed AT HEV; (c) 8-speed AT HEV; (d) CVT HEV.
Figure 7.
Engine operating points for UDDS without considering the transmission efficiency and EOP loss: (a) 4-speed AT HEV; (b) 6-speed AT HEV; (c) 8-speed AT HEV; (d) CVT HEV.

Figure 8.
Engine and motor power with respect to the number of gear steps for UDDS (t = 211–242 s): (a) Vehicle speed; (b) Engine power; (c) Motor power.
Figure 8.
Engine and motor power with respect to the number of gear steps for UDDS (t = 211–242 s): (a) Vehicle speed; (b) Engine power; (c) Motor power.

Figure 9.
Improvement rate of fuel economy for number of gear steps for the city cycle: (a) Without considering transmission efficiency and EOP loss; (b) Considering transmission efficiency and EOP loss.
Figure 9.
Improvement rate of fuel economy for number of gear steps for the city cycle: (a) Without considering transmission efficiency and EOP loss; (b) Considering transmission efficiency and EOP loss.


Figure 11.
Mode shift map: (a) Power split type HEV; (b) Parallel HEV.


Table 1.
Leakage flow rates [21].
Table 1.
Leakage flow rates [21].
| Location | Leakage Feature | Equations |
|---|---|---|
| Valve spool |  | |
| Seal |  |
Table 2.
Specifications of TMED type parallel HEV.
| Component | Specification | |
|---|---|---|
| Engine | Max power | 114 kW |
| Max torque | 185 Nm | |
| Max speed | 6000 rpm | |
| Motor-Generator | Max power | 38 kW |
| Max torque | 205 Nm | |
| Max speed | 6000 rpm | |
| Battery | Capacity | 1.6 kWh |
| Nominal voltage | 270 V | |
| Vehicle | Weight | 1800 kg |
| Transmission | AT | 4-speed |
| 6-speed | ||
| 8-speed | ||
| CVT | Metal belt type | |
Table 3.
Power flow, motor speed, and torque equations for the parallel HEV [9].
Table 3.
Power flow, motor speed, and torque equations for the parallel HEV [9].
| Driving Mode | Power Flow | Equations |
|---|---|---|
| EV mode |  | |
| HEV mode |  | |
| Regenerative braking mode |  |
Table 4.
Engine energy and efficiency, battery energy, power electronics system loss, and fuel economy for UDDS.
Table 4.
Engine energy and efficiency, battery energy, power electronics system loss, and fuel economy for UDDS.
| 4-Speed AT | 6-Speed AT | 8-Speed AT | CVT | ||||||
|---|---|---|---|---|---|---|---|---|---|
| Driving | Braking | Driving | Braking | Driving | Braking | Driving | Braking | ||
| Engine energy (kJ) | 4200 | - | 4148 | - | 4137 | - | 4122 | - | |
| Consumed fuel energy (kJ) | 11,090 | - | 10,939 | - | 10,894 | - | 10,814 | - | |
| Engine efficiency (%) | 37.87 | - | 37.92 | - | 37.97 | - | 38.12 | - | |
| Improvement rate (%) | base | - | 0.13 | - | 0.26 | - | 0.66 | - | |
| Battery energy (kJ) | Discharge (+) | 2522 | 0 | 2417 | 0 | 2389 | 0 | 2333 | 0 |
| Charge (−) | 201 | 2258 | 84 | 2272 | 54 | 2275 | 3 | 2278 | |
| Power electronics system loss (kJ) | Battery + MG | 327 | 249 | 287 | 234 | 277 | 231 | 259 | 228 |
| Total | 576 | 521 | 508 | 487 | |||||
| MG efficiency (%) | 91.05 (EV mode) | 92.87 | 91.72 (EV mode) | 93.46 | 91.78 (EV mode) | 93.56 | 91.94 (EV mode) | 93.71 | |
| Fuel economy (km/L) | 33.84 | 34.31 | 34.45 | 34.70 | |||||
| Improvement rate (%) |  |  |  | ||||||
Table 5.
Operation time according to mode and gear step for UDDS (s).
| 4-Speed AT | 6-Speed AT | 8-Speed AT | CVT | |||||||||
|---|---|---|---|---|---|---|---|---|---|---|---|---|
| Mode Gear Step | EV | HEV | Regen | EV | HEV | Regen | EV | HEV | Regen | EV | HEV | Regen |
| 1st | 140 | 32 | 217 | 74 | 17 | 159 | 75 | 13 | 149 | 43 | 1 | 113 |
| 2nd | 240 | 76 | 64 | 157 | 41 | 91 | 143 | 34 | 86 | 14 | 2 | 27 |
| 3rd | 100 | 108 | 29 | 169 | 58 | 39 | 167 | 49 | 47 | 7 | 4 | 9 |
| 4th | 13 | 86 | 6 | 68 | 78 | 19 | 52 | 37 | 19 | 17 | 6 | 36 |
| 5th | - | - | - | 15 | 65 | 5 | 35 | 38 | 10 | 18 | 11 | 9 |
| 6th | - | - | - | 6 | 47 | 3 | 6 | 56 | 2 | 52 | 15 | 22 |
| 7th | - | - | - | - | - | - | 8 | 42 | 2 | 44 | 15 | 20 |
| 8th | - | - | - | - | - | - | 2 | 38 | 1 | 68 | 18 | 17 |
| 9th | - | - | - | - | - | - | - | - | - | 90 | 32 | 21 |
| 10th | - | - | - | - | - | - | - | - | - | 67 | 48 | 18 |
| 11th | - | - | - | - | - | - | - | - | - | 46 | 69 | 15 |
| 12th | - | - | - | - | - | - | - | - | - | 16 | 91 | 9 |
| Total | 493 | 302 | 316 | 489 | 306 | 316 | 488 | 307 | 316 | 482 | 312 | 316 |
Table 6.
for target transmissions.
| Gear Step | 4-Speed AT | 6-Speed AT | 8-Speed AT | CVT |
|---|---|---|---|---|
| 1st | 11.41 | 14.21 | 15.10 | 13.46–14.51 |
| 2nd | 6.33 | 8.57 | 9.30 | 12.42–13.46 |
| 3rd | 4.07 | 6.70 | 5.97 | 11.37–12.42 |
| 4th | 2.76 | 4.25 | 4.68 | 10.32–11.37 |
| 5th | - | 3.06 | 4.07 | 9.27–10.32 |
| 6th | - | 2.37 | 3.38 | 8.22–9.27 |
| 7th | - | - | 2.69 | 7.18–8.22 |
| 8th | - | - | 2.14 | 6.13–7.18 |
| 9th | - | - | - | 5.08–6.13 |
| 10th | - | - | - | 4.03–5.08 |
| 11th | - | - | - | 2.98–4.03 |
| 12th | - | - | - | 1.94–2.98 |
Table 7.
Engine energy and efficiency, transmission efficiency, battery energy, power electronics system loss, and fuel economy for UDDS.
Table 7.
Engine energy and efficiency, transmission efficiency, battery energy, power electronics system loss, and fuel economy for UDDS.
| 4-Speed AT | 6-Speed AT | 8-Speed AT | CVT | ||||||
|---|---|---|---|---|---|---|---|---|---|
| Driving | Braking | Driving | Braking | Driving | Braking | Driving | Braking | ||
| Engine energy (kJ) | 5064 | - | 5003 | - | 4987 | - | 5108 | - | |
| Consumed fuel energy (kJ) | 13,359 | - | 13,187 | - | 13,125 | - | 13,443 | - | |
| Engine efficiency (%) | 37.91 | - | 37.94 | - | 37.99 | - | 38.00 | - | |
| Improvement rate (%) | base | - | 0.08 | - | 0.21 | - | 0.24 | - | |
| Battery energy (kJ) | Discharge (+) | 2411 | 4 | 2255 | 5 | 2223 | 5 | 2105 | 12 |
| Charge (−) | 321 | 2022 | 162 | 2028 | 126 | 2029 | 17 | 2032 | |
| Power electronics system loss (kJ) | Battery + MG | 335 | 242 | 292 | 223 | 278 | 223 | 238 | 224 |
| Total | 577 | 515 | 501 | 462 | |||||
| Transmission | Efficiency (%) | 92.22 | 92.32 | 92.42 | 93.40 | ||||
| EOP loss (kJ) | 220 | 226 | 237 | 490 | |||||
| MG efficiency (%) | 90.35 (EV mode) | 92.25 | 90.72 (EV mode) | 93.05 | 90.95 (EV mode) | 93.06 | 90.36 (EV mode) | 93.21 | |
| Fuel economy (km/L) | 28.09 | 28.46 | 28.59 | 27.92 | |||||
| Improvement rate (%) |  |  |  | ||||||
Table 8.
Power flow, motor speed, and torque equations for the power split type HEV.
| Driving Mode | Power Flow | Equations |
|---|---|---|
| EV mode |  | |
| HEV mode |  | |
| Regenerative braking mode |  |
Table 9.
Drivetrain component loss of power split type HEV.
| Drivetrain Components | Loss |
|---|---|
| Reduction gear [22] | |
| Planetary gear set [22,32] (PG1, PG2) | |
| MG1 unloaded loss [22] |  |
Table 10.
Engine energy and efficiency, battery energy, power electronics system loss, transmission loss, and fuel economy of the power split type HEV and parallel HEV.
Table 10.
Engine energy and efficiency, battery energy, power electronics system loss, transmission loss, and fuel economy of the power split type HEV and parallel HEV.
| Power Split Type HEV | Parallel HEV | ||||
|---|---|---|---|---|---|
| Driving | Braking | Driving | Braking | ||
| Engine energy (kJ) | 4998 | - | 4987 | - | |
| Consumed fuel energy (kJ) | 13,094 | - | 13,125 | - | |
| Engine efficiency (%) | 38.17 | - | 37.99 | - | |
| Battery energy (kJ) | Discharge (+) | 3272 | 2 | 2223 | 5 |
| Charge (−) | 1068 | 2123 | 126 | 2029 | |
| Power electronics system loss (kJ) | Battery + MG | 717 | 157 | 278 | 223 |
| Total | 874 | 501 | |||
| Transmission (kJ) | Drivetrain loss | 343 | 635 | ||
| EOP loss | 57 | 237 | |||
| Fuel economy (km/L) | 28.66 | 28.59 | |||
| Improvement rate (%) | 0.24 | base | |||
© 2018 by the authors. Licensee MDPI, Basel, Switzerland. This article is an open access article distributed under the terms and conditions of the Creative Commons Attribution (CC BY) license (http://creativecommons.org/licenses/by/4.0/).
Share and Cite
MDPI and ACS Style
Kim, H.; Wi, J.; Yoo, J.; Son, H.; Park, C.; Kim, H. A Study on the Fuel Economy Potential of Parallel and Power Split Type Hybrid Electric Vehicles. Energies 2018, 11, 2103. https://doi.org/10.3390/en11082103
AMA Style
Kim H, Wi J, Yoo J, Son H, Park C, Kim H. A Study on the Fuel Economy Potential of Parallel and Power Split Type Hybrid Electric Vehicles. Energies. 2018; 11(8):2103. https://doi.org/10.3390/en11082103
Chicago/Turabian StyleKim, Hyunhwa, Junbeom Wi, Jiho Yoo, Hanho Son, Chiman Park, and Hyunsoo Kim. 2018. "A Study on the Fuel Economy Potential of Parallel and Power Split Type Hybrid Electric Vehicles" Energies 11, no. 8: 2103. https://doi.org/10.3390/en11082103
Note that from the first issue of 2016, this journal uses article numbers instead of page numbers. See further details here.