SOLIS—A Novel Decision Support Tool for the Assessment of Solar Radiation in ArcGIS


Department of Spatial Economy, Faculty of Environmental Engineering and Geodesy, Wrocław University of Environmental and Life Sciences, 50-357 Wrocław, Poland
*
Author to whom correspondence should be addressed.
Energies 2018, 11(8), 2105; https://doi.org/10.3390/en11082105
Submission received: 13 July 2018
/
Revised: 8 August 2018
/
Accepted: 9 August 2018
/
Published: 13 August 2018
(This article belongs to the Special Issue Sustainable Energy Development Strategies: Energy Efficiency and Renewables)
Abstract
:The global Sustainable Development Goals influence the implementation of energy development strategies worldwide. However, in order to support local stakeholders in sustainable energy development strategies and climate change adaptation plans and the implementation of policies, there is a need to equip local decision makers with tools enabling the assessment of sustainable energy investments. In order to do so, the aim of this study is to create a novel tool for the assessment of solar radiation (SOLIS) in ArcGIS. The SOLIS tool builds on the existing ArcGIS algorithm by including input data conversion and post-processing of the results. This should expand the group of potential users of solar radiation analyses. The self-filtering tool excludes surfaces that are not suitable for solar energy investments due to geometrical reasons. The reduction of the size of the output data is positive for technical reasons (speed of the calculation and occupied storage place) and for cognitive reasons (reduction of the number of objects necessary to analyse by the user). The SOLIS tool limits the requirement for users to insert three-dimensional (3D) models of roofs (with any geometry) and select solar radiation calculation periods. The highlight of this research is to develop the decision support tool for the assessment of solar radiation, which would reduce the requirements for potential users, in order to promote indicator-based assessments among non-Geographical Information Systems (GIS) specialists.
1. Introduction
Urban development, as seen in the light of the current global climate challenges, has to be remodelled from existing solutions into more environmentally friendly solutions in many aspects. In 2015, over 150 countries agreed on the new 17 ambitious Sustainable Development Goals [1]. The seventh goal is to “ensure access to affordable, reliable, sustainable and modern energy for all”, and one of the targets of this goal is to “increase substantially the share of renewable energy in the global energy mix by 2030”. In order to meet the Sustainable Development Goals, countries and cities around the globe have to analyse the existing energy use patterns [2,3], and as a result, identify the most suitable renewable energy resources that can be used in relation to their local potential as effectively as possible [4,5,6]. Researchers have already found some ways to analyse the relationships between the effectiveness of urban energy systems and urban development [7,8], including economic aspects of the energy sector development [9,10]. However, not all of the results are really helpful for practitioners as some of the research findings expand the domain only in a theoretical direction. The topics of the sustainable energy development strategies that are being discussed require an urgent change in practices, and therefore, energy efficiency in renewables has to boost both the current knowledge and the economy sectors worldwide.
In order to transfer the outcomes of research into practice, the outcomes of studies should support stakeholders, who are responsible for investments in renewable energy, by supplying them with clear and easily understandable solutions. One of the aspects of such support may be the development and application of indicator-based systems, tools, and techniques for the assessment of natural conditions for sustainable energy development on a local basis. Such solutions should be prepared for different kinds of renewable resources, like hydropower [11,12], wind energy [13,14], or solar energy [15]. In the case of those renewables that are more diffused and based on the systems that are built from a larger number of smaller installations, decision support systems for energy planning should be supported especially at the local level [16]. It would help stakeholders to make the most optimal decision as possible, according to the local conditions and needs. Technological support in calculating different aspects of investments is the current direction of the sustainable energy planning development [17,18,19]. Hussain Mirjat et al. [17] in the analytical hierarchy process, using multi-criteria decision-making system assessed the results for the long-term electricity planning, comparing reference scenario, renewable energy technologies scenario, clean coal maximum scenario, and energy efficiency and conservation scenario. Hirzel et al. [18] also incorporated multi-criteria decision approach, however, based on the local requirements, they developed the solution enabling ex-ante evaluation of energy projects in order to the needs of public funding institutions. The applicable aspects of energy analyses from the practical point of view, were also proved by the Oprea and Bâra [19], who presented it in the context of green certificates support scheme.
Enhancing local planning is currently undertaken by geodesign [20,21,22,23,24,25] tools based on Geographical Information Systems (GIS). There are many possibilities to amplify decision making process with the use of GIS. One of the options is to use an existing software package [13], however, in the context of increasing amount of available data, GIS is more often combined with business intelligence solutions [22,24], which are helpful to incorporate the visual data discovery process. Some of the systems include supervised self-learning process, enabling the extrapolation of results in the time dimension, which allows for preparing projections of future states [21]. More complex solution include developing GIS-based calculation algorithms, which are very effective in data processing [23,25], however, it might be problematic for the laymen users to modify them and to influence the data processing workflow. However, one of the most promising solutions in order to implement GIS-based decision support systems in spatial management into practise, is the application of the systems into web-based platforms [20], which allows nonprofessional in the field of GIS to carry on self-defined analyses. In all of these cases, the use of systems, tools, or models enable efficient data processing and present information obtained as the outcome in recognizable manner. Studies showed that the use of the planning support systems can effectively satisfy the needs of practitioners in terms of user-friendliness [26]. One of such diffused resources of renewable energy, of which their location can be chosen using GIS solutions, is solar energy. This is one of the easiest resources in the case of highly developed urbanised areas. Therefore, this study focuses on the calculation of the solar radiation for the needs of local stakeholders in order to decide how suitable each roof top is for the installation of the photovoltaic panels.
The most popular GIS software available is ArcGIS [27,28]. Currently ArcGIS contains a tool for solar radiation calculation [29], however, the use of this mechanism requires specialised knowledge of the GIS user. Such solutions might be ineffective for stakeholders, who are specialists in the field of urban design. The high level of complexity of the tool might be a barrier that discourages practitioners from making use of it. Therefore, this research relates to the concept of developing new tools for GIS software in order to make the results more applicable for other users [30,31,32]. The current gap in practical implementations is the lack of GIS tools to calculate solar radiation on three-dimensional (3D) objects (roofs) which limits the complexity of the analysis.
The aim of this study is to create a GIS tool for the assessment of solar radiation (named SOLIS) that can be used by the people without the practice in using GIS. The goal is to reduce the steps users need to take to support input data and selecting the period for which the solar radiation should be calculated. As the result, SOLIS may promote the use of geospatial analyses in a decision-making process that supports urban planning in order to meet the sustainable development goals and help cities to adapt to climate change.
2. The Methodological Framework of SOLIS
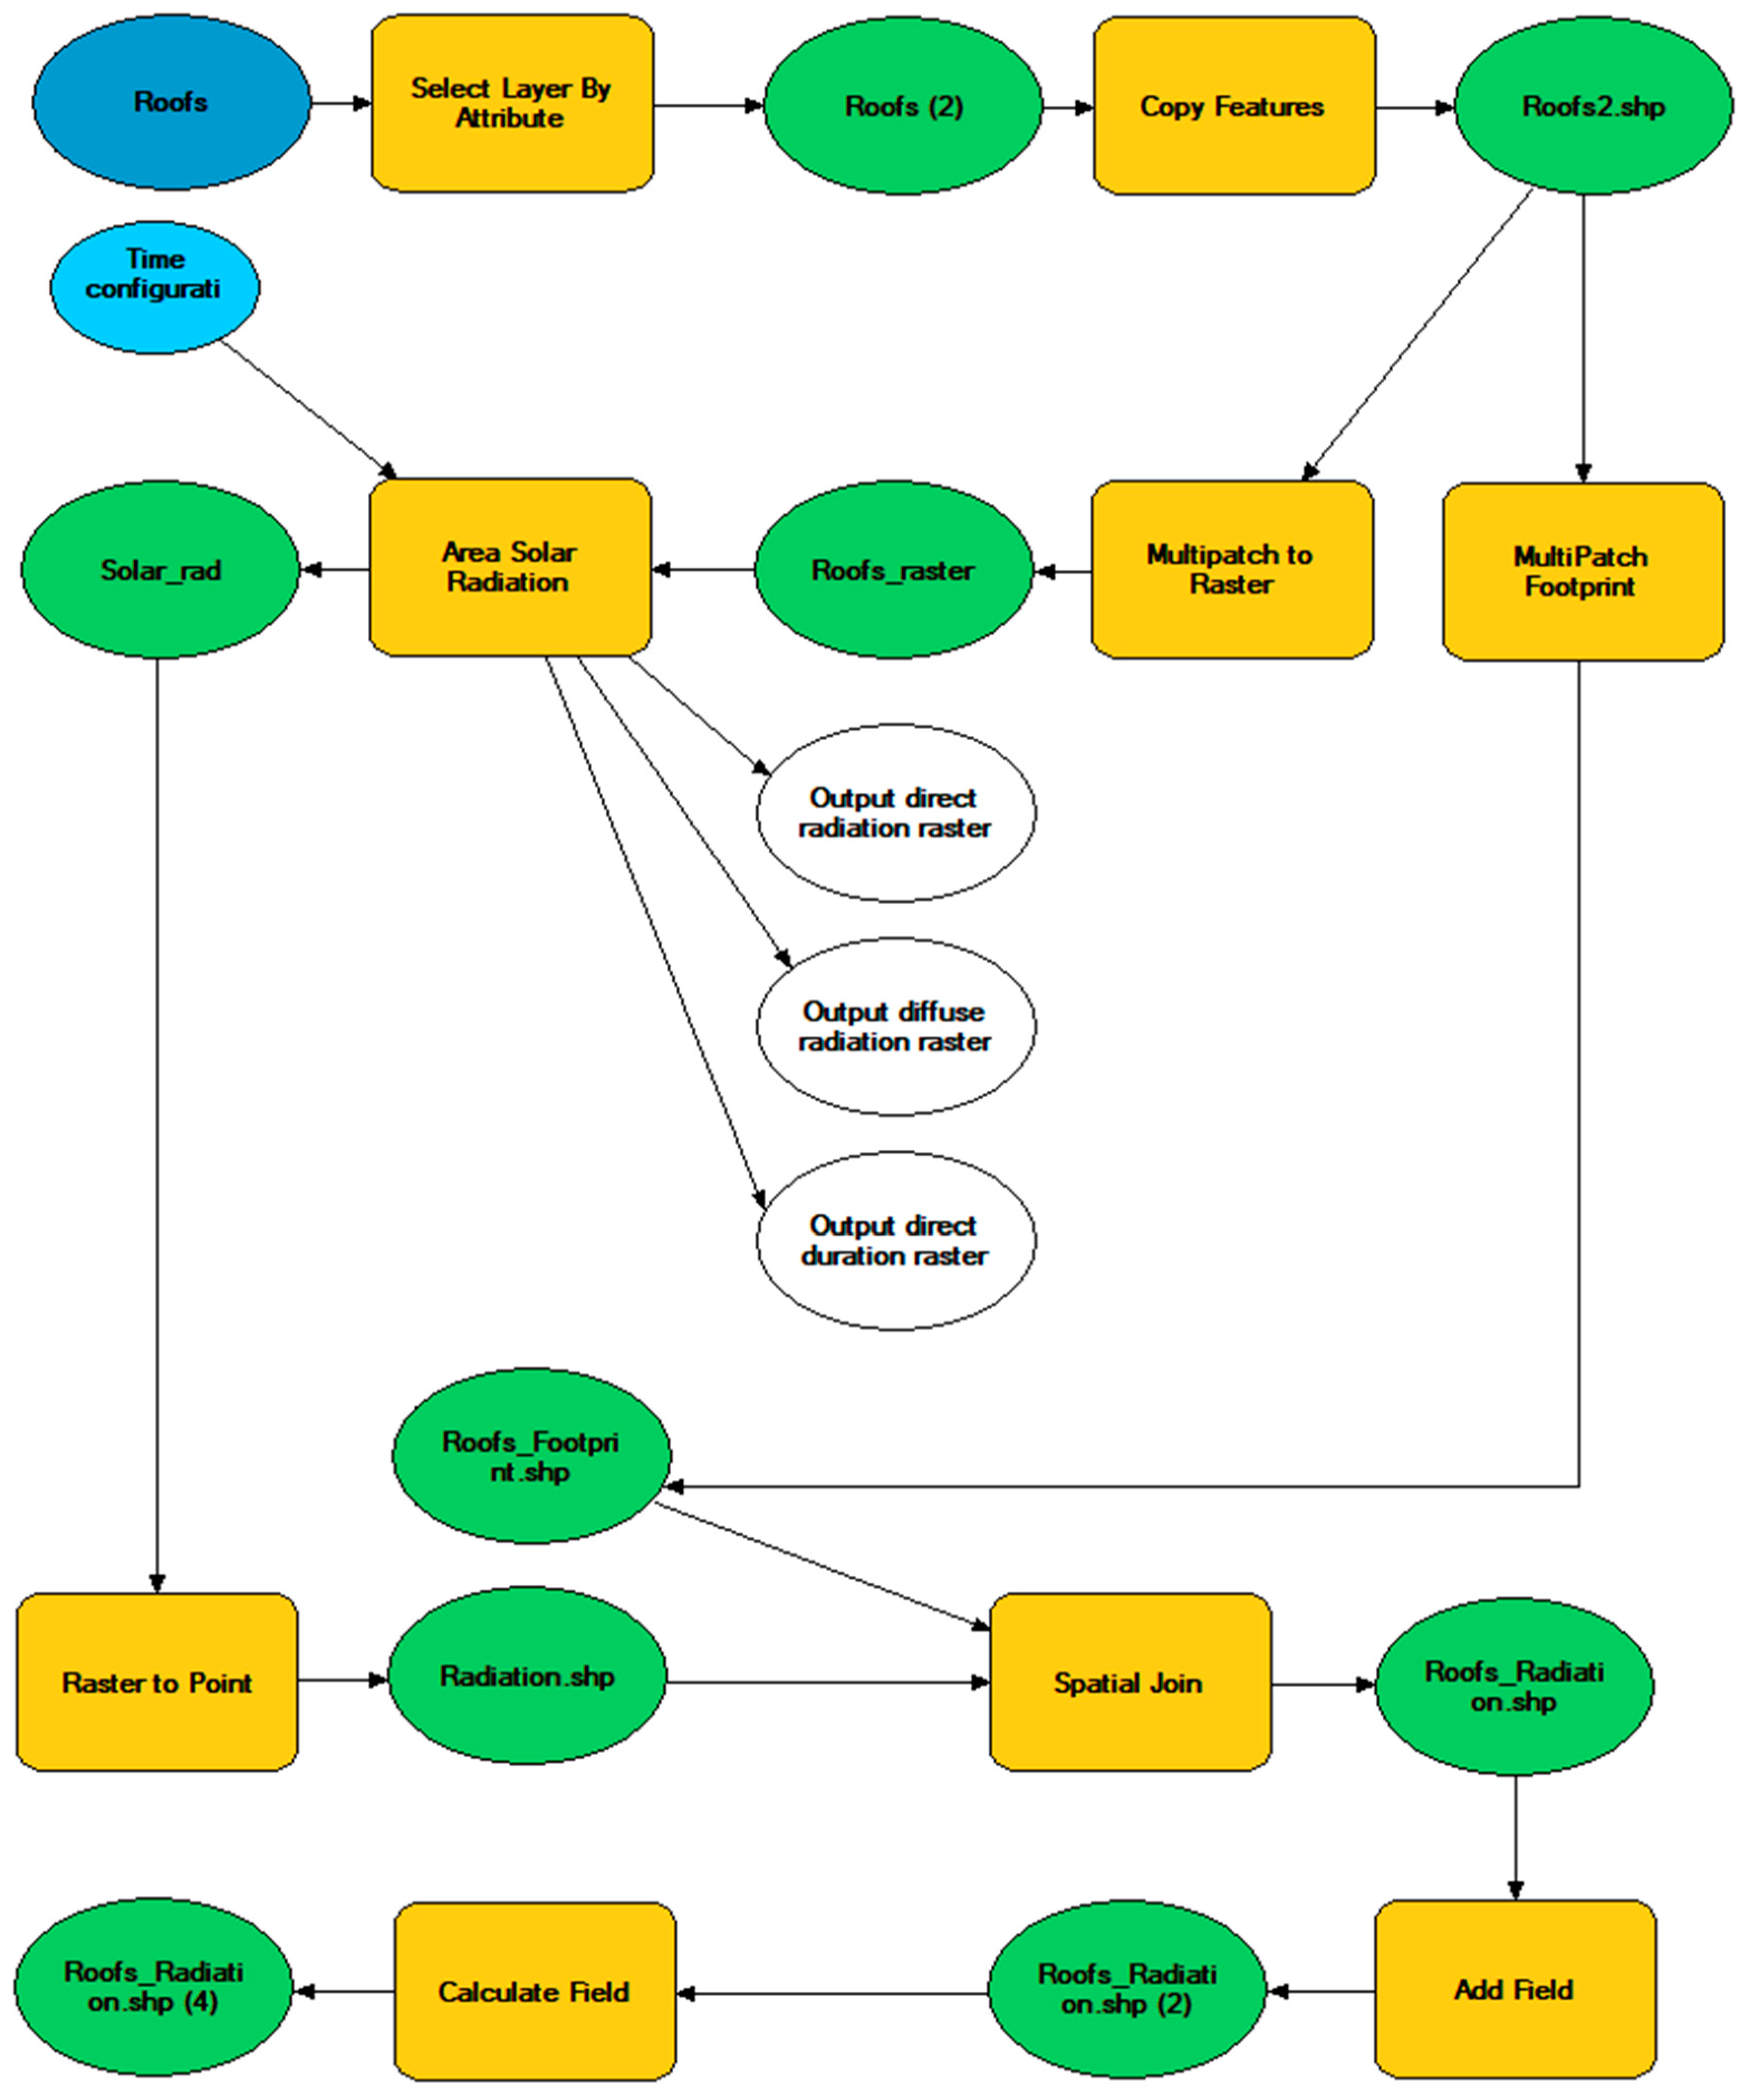
SOLIS was developed as a tool, which can be uploaded into the toolboxes in ArcGIS. The calculation workflow is presented as a model builder layout in Figure 1. The development of the tool was based on the existing systems, which are available in the Spatial Analyst toolbox in ArcGIS. As SOLIS aims to limit the requirements for the user, the methodological framework presents how SOLIS (1) converts the input data; (2) calculates the solar radiation; and (3) post-processes the results into user-friendly data.
2.1. The Conversion of Input Data
The SOLIS model is based on a multipatch feature, namely 3D vector data of roofs of buildings. The multipatch feature is a separate GIS object, which represents a 3D object by a collection of patches. In the model, every surface of a geometrically complex roof is referred to as a separate patch. The multipatch feature is characterised by a Z-value, which represents the height of each patch [33] by a minimum height (Min Z of geometry) and a maximum height (Max Z of geometry). The Min Z and Max Z allow for the calculation of all the analysed objects with a slope designation to all of them. The height value, as well as the surface area of the roofs, are required as input data for the presented SOLIS model. It was decided to limit the model to the minimum value of the roof surface area of the patches. Based on the average size of the photovoltaic panel, which is approximately 2 m2, it was decided that smaller patches that are included in the calculation need to have minimum surface are of 2 m2 as well. This data filtration enables to focus not only on surfaces that might be economically suitable, but also allows for the exclusion of outliers in datasets, caused by mistakes in data processing. Subsequently, the height value of multipatch objects allows for the creation of a raster of roofs, which was a basis for subsequent calculations of the solar radiation.
2.2. The Calculation of Solar Radiation
The calculation of the solar radiation is based on the existing tool (Solar Area Radiation) in ArcGIS, which calculates the slope and the aspect using built-in query, and finally calculates the solar radiation. The output radiation raster is of a floating-point type, and it consists of units that are expressed in watt hours per square meter (Wh/m2) [34]. However, the existing tool does not represent the values for any given roof or its patches, but it represents the value of radiation per predetermined size of raster cell, which might be omitted by the user while starting the calculation. It may lead to a misinterpretation of the results, as the tool allows for the user to engage into taking further steps while leaving the raster size value blank. In the case of SOLIS, the raster size is predefined as 1 m2, which enables the interpretation of the outcomes of the assessment at the relative scale (per m2). Furthermore, the solar radiation raster in the existing tool is a multiple band raster, which means that it contains multiple spatially coincident matrices of cell values representing the same spatial area [35]. These indices, that obtaining a table of attributes with radiation values could be more difficult, because the multiple band raster requires a change into a single-band raster or into vector data (i.e., into a point geometry shapefile). SOLIS converts the results into further steps, which are described in Section 2.3. Moreover, SOLIS is enriched by the possibility of selecting a period for which to calculate the solar radiation, i.e., a day, month, year, or a freely-selected other period.
2.3. Post-Processing of the Results
As stated above, the Area Solar Radiation tool is allowed for the creation of raster cells, which represent the values of radiation per given cell size. Thus, the calculation of solar radiation per roof patch require a spatial join. This spatial join helps to obtain the summarised value of solar radiation, as well as obtain the average value of solar radiation per patch of roof. The spatial join requires point geometry vector data (obtained from the solar radiation raster) and polygon geometry vector data of roofs patches, where the calculations of summarised and average values of solar radiation are done. Therefore, the multipatch of roofs is inverted into a multipatch footprint, which is one of the easiest tools to obtain the polygons of roofs. The Multipatch Footprint tool creates polygon footprints representing the two-dimensional area that is occupied by a multipatch feature class [36].
3. The Verification of SOLIS
In order to verify the developed tool, two data samples were tested. Each data sample represents a different type of urban design from a European city. Sample A represents a medium-density development constructed before World War II, which at that time was a remote neighbourhood at the outskirts of the city. Sample B visualises a post-war development in the form of blocks of flats, built-up in the Soviet times. The decision about selecting such kinds of neighbourhoods was based on the different types of roofs in these areas. The samples contain objects with flat roofs, gable roofs, hip roofs, dormer roofs, and other (roof) geometries.
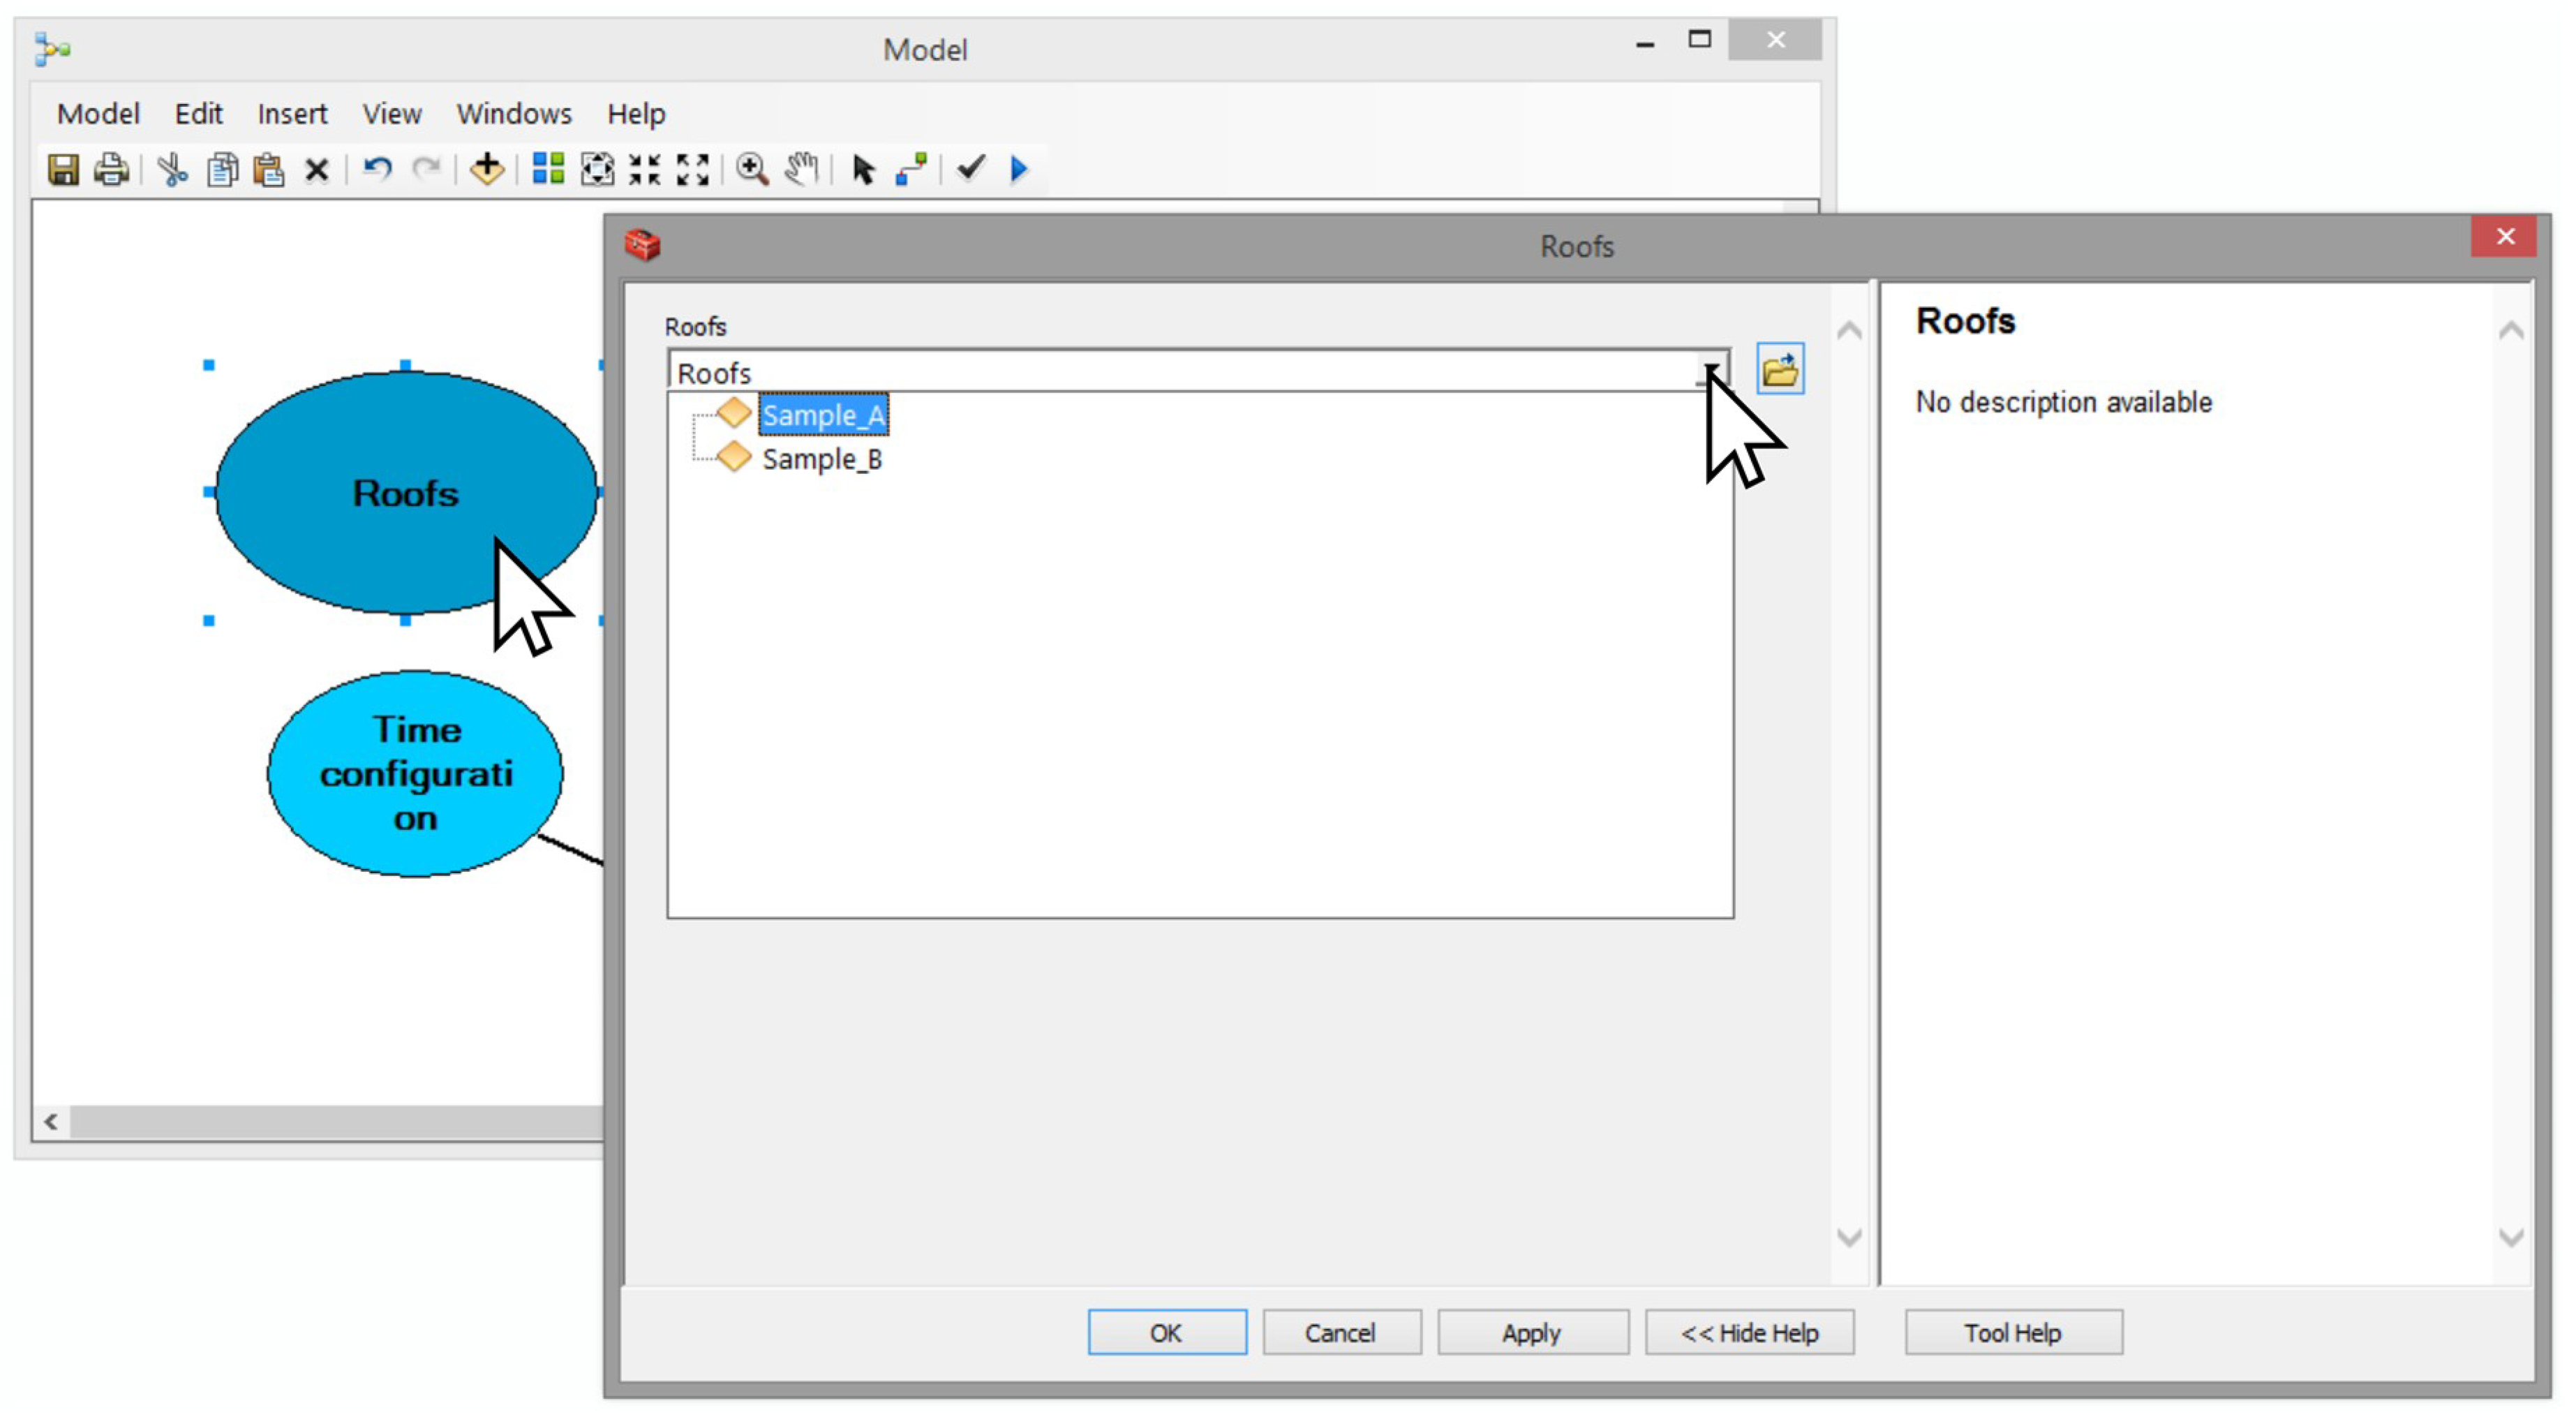
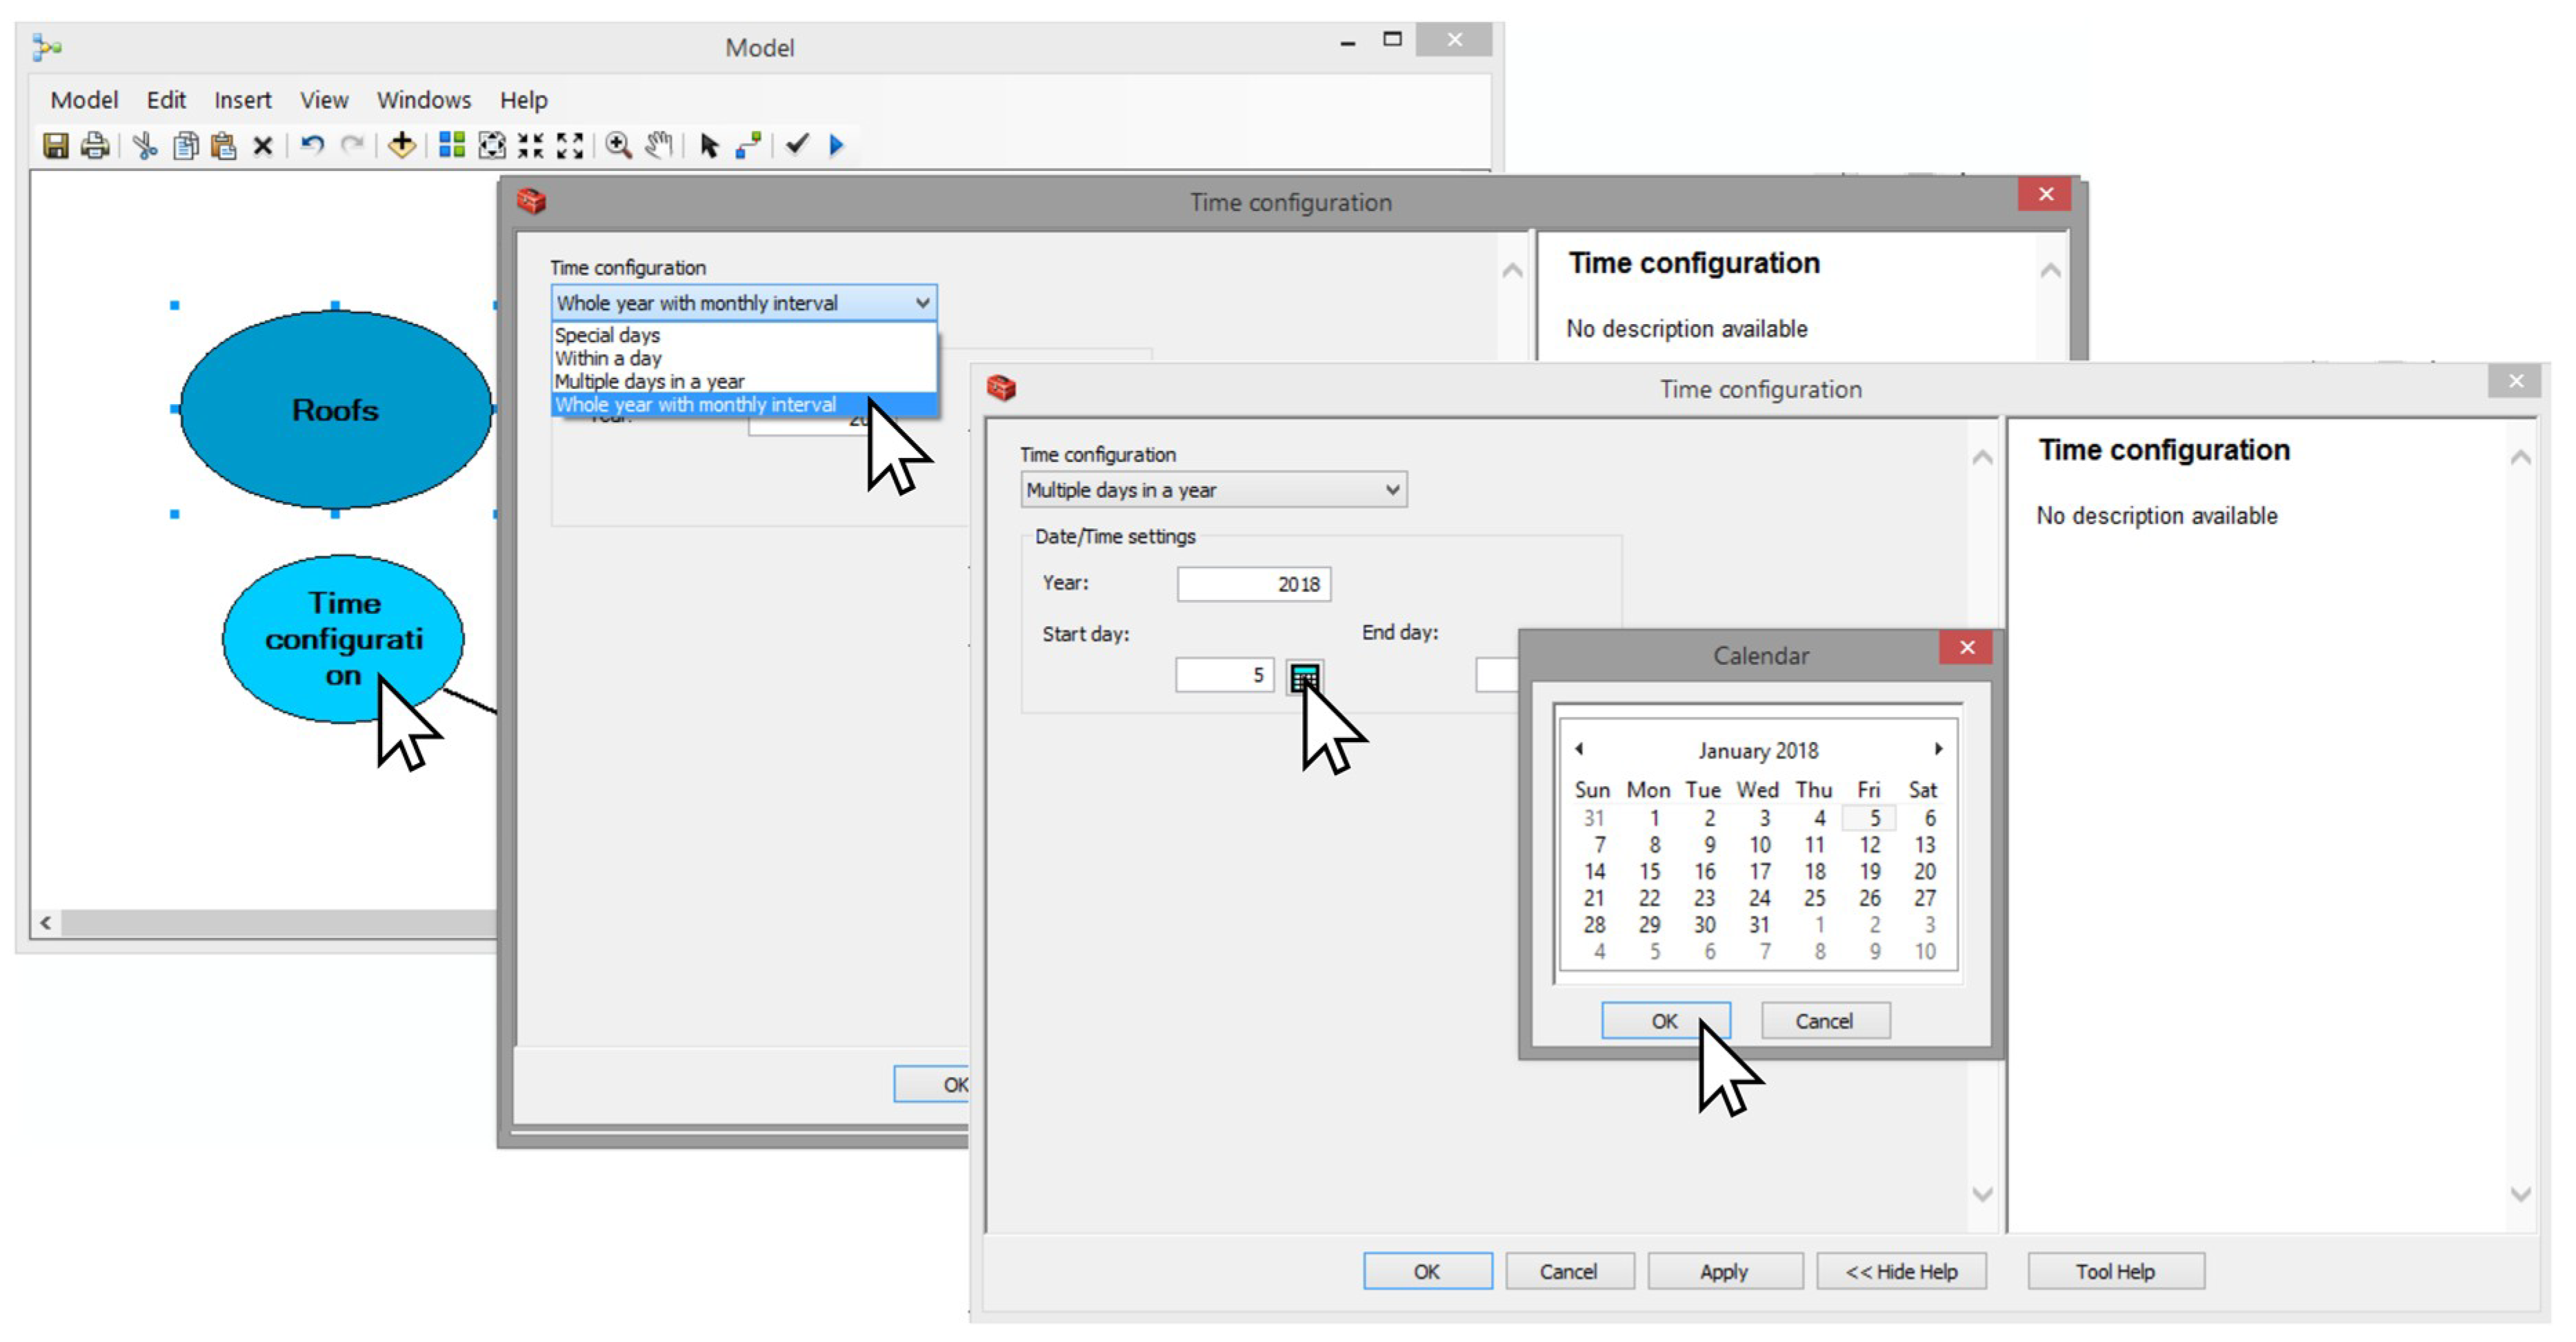
3.1. The SOLIS Interface
While using SOLIS, the user is requested for two things. Firstly, it is necessary to show the location of the input data. The input data format is an Esri shapefile in a multipatch geometry, as described in Section 2.1. Once the input data is defined, the second question to the user is the time for which solar radiation should be calculated. The available options are to calculate solar radiation per: (1) special days; (2) within a day; (3) multiple days in a year; or (4) whole year with a monthly interval. Obviously, the weather conditions on exact dates are unknown [37]. However, in order to support investment decisions, mean values are detailed enough, as the approximate radiation would describe general conditions for solar energy production in sufficient detail for practical use. The layout of the SOLIS interfaces is presented in Figure 2 and Figure 3.
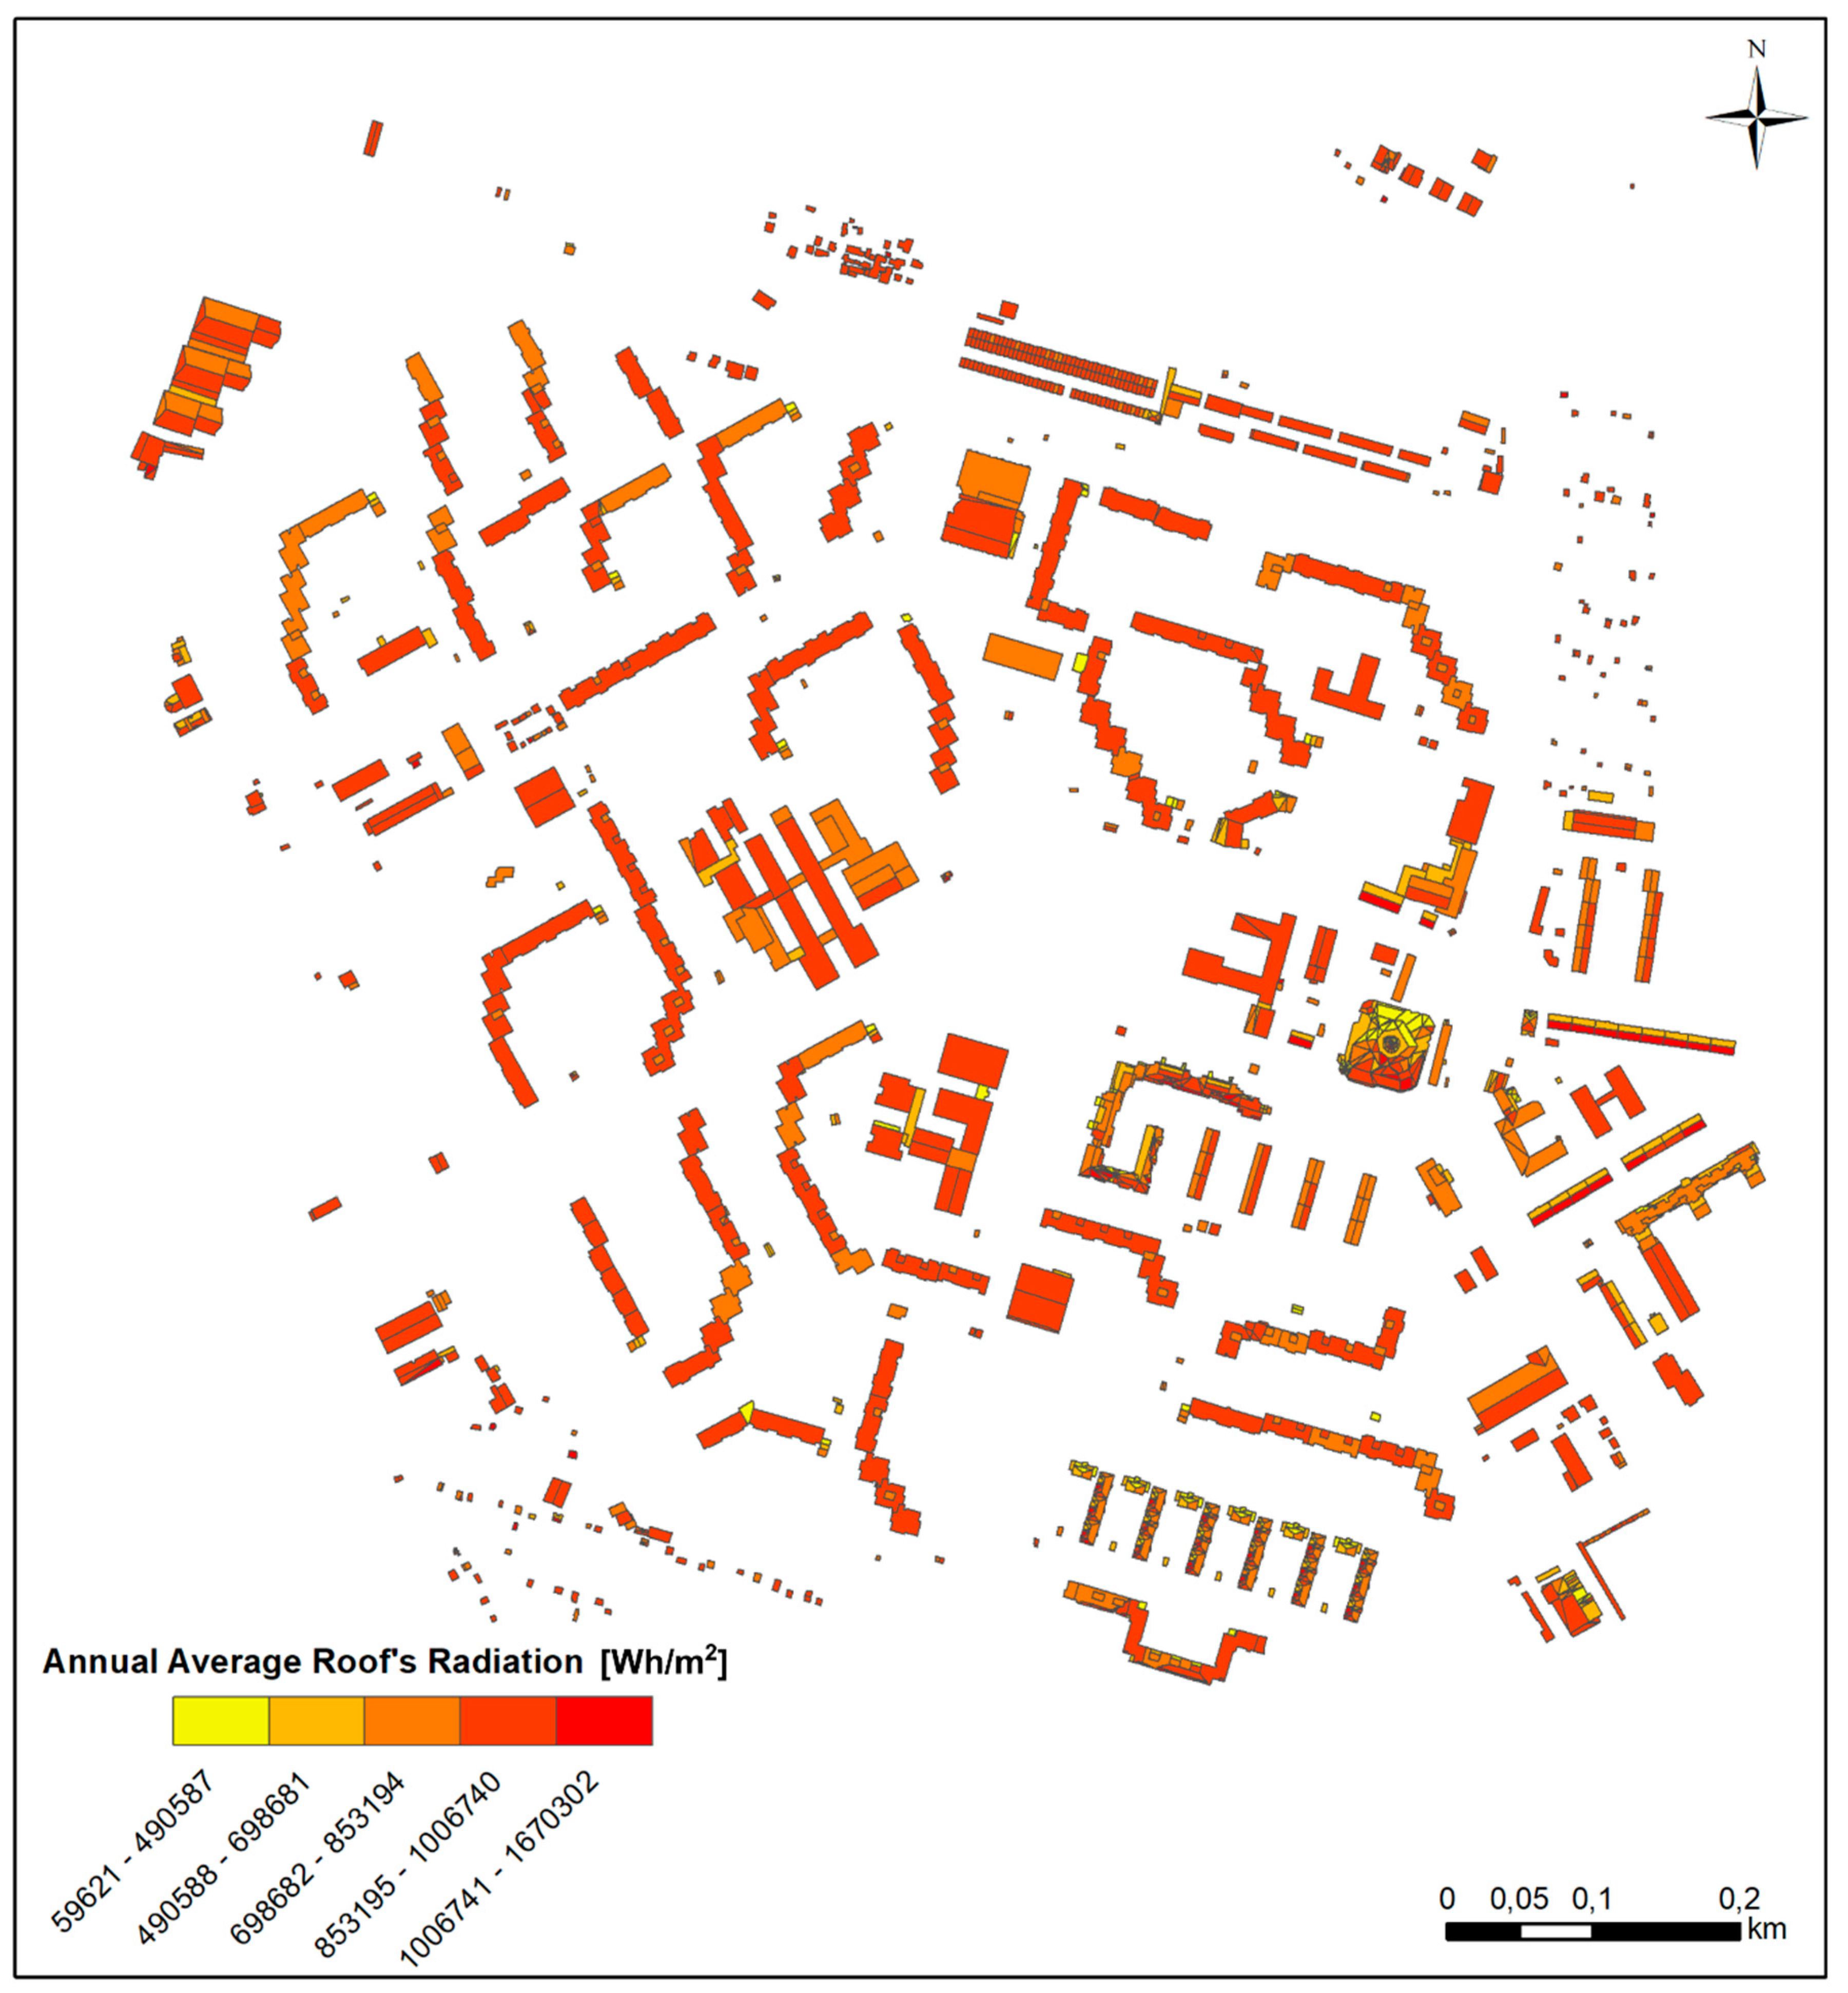
3.2. SOLIS Results
The feedback of the assessment of solar radiation by SOLIS could be both graphic and numerical. The tool gives the value of the mean solar radiation per square meter as well as the total radiation on the roof surface. The graphic comparison of different roofs may be helpful for stakeholders to decide about the location that is the most suitable to invest in photovoltaic panels. This may be of particular importance when the housing community has already decided about investing in a specific number of photovoltaic panels, and the only consideration yet to take place is where to locate them in order to maximise the benefits of such panels. The graphic results of calculations for the analysed samples are presented in Figure 4 and Figure 5. The numeric values might be useful to assess whether the placement of solar energy installations is rational at the tested area at all. The users get the value of the mean solar radiation, and when knowing the technical parameters of the available photovoltaic panels, in particularly the energy efficiency of each technology, they get an indication of how much energy that the installation may produce and if the investment is rational at all.
Sample A represents the development with more complex roof constructions, therefore, more 3D patches were analysed—3313 patches (1,589,902.05 m2). In case of sample B, the number of assessed roof surfaces was 1780 (133,839.22 m2). Besides the area of patches, which can be checked individually for each object, the number of patches might be also important for decisions makers, due to the complexity of geometry of analysed roofs. The fewer the number of surfaces with similar area, the easier the photovoltaic panels installation can be carried out. It is related with the issue of installation of frames into which photovoltaic panels can be connected. In both analysed samples, most of surfaces were noticed on the third (698,682 Wh/m2–853,194 Wh/m2) and fourth group (853,195 Wh/m2–1,006,740 Wh/m2). Results for sample A are as follows: 1st group—193 patches (6%), 2789.86 m2 (2%); 2nd group—344 patches (10%), 6941.90 m2 (4%); 3rd group—650 patches (20%), 19,868.97 m2 (13%); 4th group—2029 patches (61%), 126,900.18 m² (80%); 5th group—97 patches (3%), 2401.14 m2 (2%). Results for sample B are as follows: 1st group—160 patches (9%), 2704.97 m2 (2%); 2nd group—256 patches (14%), 8370.61 m2 (6%); 3rd group—525 patches (30%), 35,617.26 m2 (27%); 4th group—714 patches (40%), 84,609.62 m2 (63%); 5th group—125 patches (7%), 2536.76 m2 (2%).
In order to interpret the results correctly, there is a need to refer to uncertainty of the solar radiation simulation. There are recent studies proving the differences between solar radiation accumulated by solar collectors and results that were obtained by artificial solar simulations [38]. Based on the research of de Almeida Rocha et al. [39], three inputs that has higher influence on the uncertainties on solar radiation results are: geographical latitude, orientation of simulated surface, and geometry of shading objects. First, two elements (geographical latitude, orientation of simulated surface) are taken into account in the SOLIS calculation; therefore, results are not biased by those drivers. However, the results presented for sample A and B do not include other objects than buildings (i.e., trees), which may influence the uncertainty caused by this factor. However, it has to be highlighted that it is not the uncertainty of the SOLIS, but the uncertainty of samples A and B, as the local data source does not include other 3D objects than buildings.
4. Discussion
Strategies for the development of sustainable energy are strongly related with renewable energy sources. Fulfilling the Sustainable Development Goals will require new investments; not only centralised investments, but also dispersed varieties. In order to support local stakeholders in the processes of (1) sustainable energy development strategies; (2) climate change adaptation plans; and (3) policies implementation [40,41,42], there is a need to equip these local stakeholders with tools that enable the assessment of sustainable energy investments [43]. The developed tool for geospatial analyses—SOLIS—facilitates the assessment of the solar radiation at the local level, and it noticeably reduces the requirements of the users in terms of GIS knowledge and skills. Additional processes included in the conversion of input data and post-processing of the results expand the group of potential users of solar radiation analyses. Developed decision support tools fit into the current direction of studies in the field of energy planning [17,18,44,45]. SOLIS benefits from the potential that was emphasised in other studies, such as the use of 3D modelling and visualisation of the results, which effectively support decision making processes on energy issues in the built environment [46].
The proposed approach has some limitations that have to be highlighted. Firstly, as the model is based on the digital model of the surface (in this case roofs), it does not take into account the weather conditions that have a significant impact on the actual solar radiation [47]. This aspect may increase due to future climate change and a constantly increasing amount and duration of periods with extreme weather [48,49,50,51]. As Ohunakin et al. [48] presented, considering future changes of solar radiation is a common element in the recent studies on the effect of climate change on solar radiation. It cannot be denied, the climate changes are already well proven in the literature [49], and their implications to the economic development are severe [51]. Besides the limitation of external conditions, there is a limitation that is caused by the data source itself. Nowadays, it is quite common that local authorities have access to digital terrain models, including a detailed information about the roof geometry [52,53]. However, not all urban 3D models contain information on greenery. Therefore, the analysis includes only the shading effect of other objects that are defined in the input data. In the case of the two tested samples only, buildings were included, as the tested neighbourhoods got buildings exceeding the height of any existing greenery. However, for other study areas, this aspect should be taken into account.
The future works on SOLIS could follow the direction of the application of the model into GIS web-based applications, so that users would not need to have (access to) the ArcGIS desktop themselves. The development of GIS web-based platforms in that field is a common direction of studies conducted recently [54,55,56,57,58]. Some advantages of their implementations are: enhancing public participation in the decision making process [54], gathering and sharing of collected data from various studies [55], exploring telecouplings among users [56], monitoring and forecasting in continuous mode [57], as well as monitoring in the real time with the location on a map [58]. As the application of geoportals became popular in the beginning of the 21st century [59,60,61], a growing number of local authorities have access to the 3D spatial data. Therefore, the implementation of SOLIS into the GIS web-based platform may increase the applicability of the proposed tool in the future.
5. Conclusions
The development and application of indicator systems, tools and techniques for the assessment of sustainable energy development is essential for the implementation of sustainable energy development strategies. The conclusions from the literature review prove that, currently, sustainable energy planning is lacking instruments for effective assessment of their implementation. Therefore, the highlight of this research is to develop the decision support tool for the assessment of solar radiation, which would limit the requirements for the user, in order to promote it among non-GIS specialists. The research improves the state of art from the practical perspective, by delivering to potential users novel decision support mechanism.
The SOLIS, presented in this paper, develops the existing ArcGIS algorithm by including input data conversion and post-processing of the results. The SOLIS limits the requirements for the users to inserting 3D models of roofs (with any given geometry) and selection of the solar radiation calculation period. As the result, SOLIS supports holders with the vector data, which enable both visual as well as numerical analyses about the suitability of the tested roofs in order to locate photovoltaic panels on top of them. The data filtration by the smallest analysed unit (in the proposed model it is 2 m2) allows for the exclusion of surfaces that are not suitable for solar energy investments on account of the geometrical reasons. Post-processing of the results allow for the user to prepare comparable datasets for every analysed surfaces, which might be effective for reporting local conditions of solar radiation (like presented on the sample and B in this article).
Presented workflow of the SOLIS is characterised by some advantages, which might be helpful in sustainable energy planning. From a technical point of view, SOLIS allows for speeding up the calculation process and results in smaller storage requirements. Exclusion of very small objects in the analytical process, might also be helpful to avoid the problem of topological errors, which are usually caused by the data source. An additional benefit of this component of SOLIS is the reduction of the size of the output data and the number of objects, which are finally analysed by the user. It enables avoiding an important data redundancy problem, which is relevant because of the limited cognitive abilities of human beings. In conclusion, SOLIS makes the solar radiation assessment easier to conduct, and therefore, possibly more applicable for a wider group of users in a decision-making process when engaging in the implementation of sustainable energy systems. In order to disseminate the results of the research, the SOLIS is available as a toolbox for ArcGIS for versions 10.3 and 10.6 in Supplementary Materials.
Supplementary Materials
The SOLIS toolbox for ArcGIS ver. 10.3 and 10.6 is freely available online at https://www.mdpi.com/1996-1073/11/8/2105/s1.
Author Contributions
Conceptualisation, J.K.K.; Methodology, J.K.K.; Software, J.K.K. and M.Ś.; Validation, J.K.K. and M.Ś.; Formal Analysis, J.K.K.; Investigation, J.K.K.; Resources, J.K.K. and M.Ś.; Data Curation, J.K.K. and M.Ś.; Writing-Original Draft Preparation, J.K.K.; Writing-Review & Editing, J.K.K.; Visualisation, M.Ś.; Supervision, J.K.K.; Project Administration, J.K.K.; Funding Acquisition, J.K.K.
Funding
This research was supported by the Department of Spatial Economy of the Wrocław University of Environmental and Life Sciences.
Acknowledgments
We would like to thank to prof. Joost van Hoof of The Hague University of Applied Sciences, The Hague, The Netherlands, for proofreading of this paper.
Conflicts of Interest
The authors declare no conflict of interest.
References
- United Nations. Transforming Our World: The 2030 Agenda for Sustainable Development—A/RES/70/1. United Nations General Assembly 70th Session. 2015. Available online: http://www.un.org/en/development/desa/population/migration/generalassembly/docs/globalcompact/A_RES_70_1_E.pdf (accessed on 6 July 2018).
- Hernik, J.; Rutkowska, A.; Noszczyk, T. Correlation between selected socioeconomic variables and the number of renewable energy sources in Świȩtokrzyskie Voivodeship (Poland). Eng. Rural Dev. 2016, 15, 498–504. [Google Scholar]
- Kazak, J.; Dziezyc, H.; Forys, I.; Szewranski, S. Indicator-based analysis of socially sensitive and territorially sustainable development in relation to household energy consumption. Eng. Rural Dev. 2018, 17, 1653–1661. [Google Scholar] [CrossRef]
- Maqbool, R. Efficiency and effectiveness of factors affecting renewable energy projects; an empirical perspective. Energy 2018, 158, 944–956. [Google Scholar] [CrossRef]
- Boerenfijn, P.; Kazak, J.K.; Schellen, L.; van Hoof, J. A multi-case study of innovations in energy performance of social housing for older adults in the Netherlands. Energy Build. 2018, 158. [Google Scholar] [CrossRef]
- Van Hoof, J.; Boerenfijn, P. Re-inventing existing real estate of social housing for older people: Building a new de benring in Voorst, The Netherlands. Buildings 2018, 8, 89. [Google Scholar] [CrossRef]
- Skiba, M.; Mrówczyńska, M.; Bazan-Krzywoszańska, A. Modeling the economic dependence between town development policy and increasing energy effectiveness with neural networks. Case study: The town of Zielona Góra. Appl. Energy 2017, 188, 356–366. [Google Scholar] [CrossRef]
- Woch, F.; Hernik, J.; Linke, H.; Sankowski, E.; Bęczkowska, M.; Noszczyk, T. Renewable energy and rural autonomy: A case study with generalizations. Pol. J. Environ. Stud. 2017, 26, 2823–2832. [Google Scholar] [CrossRef]
- Bazan-Krzywoszańska, A.; Mrówczyńska, M.; Skiba, M.; Łączak, A. Economic conditions for the development of energy efficient civil engineering using RES in the policy of cohesion of the European Union (2014–2020). Case study: The town of Zielona Gora. Energy Build. 2016, 118, 170–180. [Google Scholar] [CrossRef]
- Mrówczyńska, M.; Łączak, A.; Bazan-Krzywoszańska, A.; Skiba, M. Improving energy efficiency with the risk of investment of reference to urban development of Zielona Góra. Teh. Vjesn. 2018, 25, 916–922. [Google Scholar] [CrossRef]
- Moiz, A.; Kawasaki, A.; Koike, T.; Shrestha, M. A systematic decision support tool for robust hydropower site selection in poorly gauged basins. Appl. Energy 2018, 224, 309–321. [Google Scholar] [CrossRef]
- Bousquet, C.; Samora, I.; Manso, P.; Rossi, L.; Heller, P.; Schleiss, A.J. Assessment of hydropower potential in wastewater systems and application to Switzerland. Renew. Energy 2017, 113, 64–73. [Google Scholar] [CrossRef]
- Kazak, J.; van Hoof, J.; Szewranski, S. Challenges in the wind turbines location process in Central Europe—The use of spatial decision support systems. Renew. Sustain. Energy Rev. 2017, 76, 425–433. [Google Scholar] [CrossRef]
- Płuciennik, M.; Hełdak, M.; Szczepański, J.; Patrzałek, C. Application of spatial models in making location decisions of wind power plant in Poland. IOP Conf. Ser. Mater. Sci. Eng. 2017, 245, 072016. [Google Scholar] [CrossRef]
- Ranalli, J.; Calvert, K.; Bayrakci Boz, M.; Brownson, J.R.S. Toward comprehensive solar energy mapping systems for urban electricity system planning and development. Electr. J. 2018, 31, 8–15. [Google Scholar] [CrossRef]
- Hettinga, S.; Nijkamp, P.; Scholten, H. A multi-stakeholder decision support system for local neighbourhood energy planning. Energy Policy 2018, 116, 277–288. [Google Scholar] [CrossRef]
- Hussain Mirjat, N.; Uqaili, M.; Harijan, K.; Mustafa, M.; Rahman, M.; Khan, M. Multi-criteria analysis of electricity generation scenarios for sustainable energy planning in Pakistan. Energies 2018, 11, 757. [Google Scholar] [CrossRef]
- Hirzel, S.; Hettesheimer, T.; Viebahn, P.; Fischedick, M. A decision support system for public funding of experimental development in energy research. Energies 2018, 11, 1357. [Google Scholar] [CrossRef]
- Oprea, S.V.; Bâra, A. Analyses of wind and photovoltaic energy integration from the promoting scheme point of view: Study case of Romania. Energies 2017, 10, 2101. [Google Scholar] [CrossRef]
- Nyerges, T.; Ballal, H.; Steinitz, C.; Canfield, T.; Roderick, M.; Ritzman, J.; Thanatemaneerat, W. Geodesign dynamics for sustainable urban watershed development. Sustain. Cities Soc. 2016, 25, 13–24. [Google Scholar] [CrossRef] [Green Version]
- Kazak, J.K. The use of a decision support system for sustainable urbanization and thermal comfort in adaptation to climate change actions—The case of the Wrocław larger urban zone (Poland). Sustainability 2018, 10, 1083. [Google Scholar] [CrossRef]
- Szewrański, S.; Chruściński, J.; van Hoof, J.; Kazak, J.; Świąder, M.; Tokarczyk-Dorociak, K.; Żmuda, R. A location intelligence system for the assessment of pluvial flooding risk and the identification of storm water pollutant sources from roads in suburbanised areas. Water 2018, 10, 746. [Google Scholar] [CrossRef]
- Wang, T.; Han, Q.; de Vries, B. A semi-automatic neighborhood rule discovery approach. Appl. Geogr. 2017, 88, 73–83. [Google Scholar] [CrossRef]
- Kazak, J.; Chalfen, M.; Kamińska, J.; Szewrański, S.; Świąder, M. Geo-dynamic decision support system for urban traffic management. In Dynamics in GIscience; Springer: Berlin, Germany, 2018; pp. 195–207. ISBN 978-3-319-61297-3. [Google Scholar]
- Wang, T.; Han, Q.; de Vries, B. SIRPSS—Sustainable Industrial Site Redevelopment Planning Support System. In Lecture Notes in Business Information Processing, Decision Support Systems VIII: Sustainable Data-Driven and Evidence-Based Decision Support; Springer: Berlin, Germany, 2018; pp. 3–14. [Google Scholar]
- Russo, P.; Lanzilotti, R.; Costabile, M.F.; Pettit, C.J. Towards satisfying practitioners in using Planning Support Systems. Comput. Environ. Urban Syst. 2018, 67, 9–20. [Google Scholar] [CrossRef]
- Świader, M.; Szewrański, S.; Kazak, J.K. Foodshed as an example of preliminary research for conducting environmental carrying capacity analysis. Sustainability 2018, 10, 882. [Google Scholar] [CrossRef]
- Szewrański, S.; Świąder, M.; Kazak, J.K.; Tokarczyk-Dorociak, K.; van Hoof, J. Socio-environmental vulnerability mapping for environmental and flood resilience assessment: The case of ageing and poverty in the city of Wrocław, Poland. Integr. Environ. Assess. Manag. 2018, 1–6. [Google Scholar] [CrossRef]
- Nicolau, E.; Sciences, A.; Medicine, V. Aspects of solar radiation analysis using ArcGis. Bull. UASVM Hortic. 2013, 70, 437–440. [Google Scholar]
- Nakata-Osaki, C.M.; Souza, L.C.L.; Rodrigues, D.S. THIS—Tool for Heat Island Simulation: A GIS extension model to calculate urban heat island intensity based on urban geometry. Comput. Environ. Urban Syst. 2018, 67, 157–168. [Google Scholar] [CrossRef]
- Szewrański, S.; Chruściński, J.; Kazak, J.; Świąder, M.; Tokarczyk-Dorociak, K.; Żmuda, R. Pluvial Flood Risk Assessment Tool (PFRA) for rainwater management and adaptation to climate change in newly urbanised areas. Water 2018, 10, 386. [Google Scholar] [CrossRef]
- Samela, C.; Albano, R.; Sole, A.; Manfreda, S. A GIS tool for cost-effective delineation of flood-prone areas. Comput. Environ. Urban Syst. 2018, 70, 43–52. [Google Scholar] [CrossRef]
- ESRI. Multipatches. Available online: http://desktop.arcgis.com/en/arcmap/10.3/guide-books/extensions/3d-analyst/multipatches.htm (accessed on 6 July 2018).
- ESRI. Area Solar Radiation. Available online: http://desktop.arcgis.com/en/arcmap/10.3/tools/spatial-analyst-toolbox/area-solar-radiation.htm (accessed on 6 July 2018).
- ESRI. Raster Bands. Available online: http://desktop.arcgis.com/en/arcmap/10.3/manage-data/raster-and-images/raster-bands.htm (accessed on 6 July 2018).
- ESRI. Multipatch Footprint. Available online: http://desktop.arcgis.com/en/arcmap/10.3/tools/3d-analyst-toolbox/multipatch-footprint.htm (accessed on 6 July 2018).
- Hay, J.E.; Hanson, K.J. Evaluating the solar resource: A review of problems resulting from temporal, spatial and angular variations. Sol. Energy 1985, 34, 151–161. [Google Scholar] [CrossRef]
- Sowmy, S.D.; Schiavon Ara, P.J.; Prado, R.T.A. Uncertainties associated with solar collector efficiency test using an artificial solar simulator. Renew. Energy 2017, 108, 644–651. [Google Scholar] [CrossRef]
- De Almeida Rocha, A.P.; Goffart, J.; Houben, L.; Mendes, N. On the uncertainty assessment of incident direct solar radiation on building facades due to shading devices. Energy Build. 2016, 133, 295–304. [Google Scholar] [CrossRef]
- Geneletti, D.; Zardo, L. Ecosystem-based adaptation in cities: An analysis of European urban climate adaptation plans. Land Use Policy 2016, 50, 38–47. [Google Scholar] [CrossRef]
- Damsø, T.; Kjær, T.; Christensen, T.B. Local climate action plans in climate change mitigation—Examining the case of Denmark. Energy Policy 2016, 89, 74–83. [Google Scholar] [CrossRef]
- Kiełkowska, J.; Tokarczyk-Dorociak, K.; Kazak, J.; Szewrański, S.; van Hoof, J. Urban adaptation to climate change plans and policies—The conceptual framework of a methodological approach. J. Ecol. Eng. 2018, 19. [Google Scholar] [CrossRef]
- Jaques, L.; Bradshaw, M.; Carson, L.; Budd, A.; Huleatt, M.; Hutchinson, D.; Lambert, I.; LePoidevin, S.; McKay, A.; Miezitis, Y.; et al. Solar energy. In Australian Energy Resource Assessment; Australian Government: Canberra, Australia, 2010; pp. 261–284. [Google Scholar]
- Asaleye, D.A.; Breen, M.; Murphy, M.D. A decision support tool for building integrated renewable energy microgrids connected to a smart grid. Energies 2017, 10, 1765. [Google Scholar] [CrossRef]
- Cristea, C.; Jocea, A.F. GIS Application for wind energy. Energy Procedia 2016, 85, 132–140. [Google Scholar] [CrossRef]
- Patlakas, P.; Koronaios, G.; Raslan, R.; Neighbour, G.; Altan, H. Case studies of environmental visualization. Energies 2017, 10, 1459. [Google Scholar] [CrossRef]
- Hay, J.E.; Suckling, P.W. An assessment of the networks for measuring and modelling solar radiation in British Columbia and adjacent areas of western Canada. Can. Geogr. Géographe Can. 1979, 23, 222–238. [Google Scholar] [CrossRef]
- Ohunakin, O.S.; Adaramola, M.S.; Oyewola, O.M.; Matthew, O.J.; Fagbenle, R.O. The effect of climate change on solar radiation in Nigeria. Sol. Energy 2015, 116, 272–286. [Google Scholar] [CrossRef]
- Kalbarczyk, R.; Kalbarczyk, E.; Ziemiańska, M.; Raszka, B. Assessment of air thermal conditions in the lowland part of south-western Poland for agriculture development purposes. Atmosphere 2018, 9, 215. [Google Scholar] [CrossRef]
- Marzo, A.; Trigo-Gonzalez, M.; Alonso-Montesinos, J.; Martínez-Durbán, M.; López, G.; Ferrada, P.; Fuentealba, E.; Cortés, M.; Batlles, F.J. Daily global solar radiation estimation in desert areas using daily extreme temperatures and extraterrestrial radiation. Renew. Energy 2017, 113, 303–311. [Google Scholar] [CrossRef]
- Dąbrowska, J.; Pawęska, K.; Dąbek, P.B.; Stodolak, R. The implications of economic development, climate change and European water policy on surface water quality threats. Acta Sci. Pol. Form. Circumiectus 2017, 16, 111–123. [Google Scholar] [CrossRef]
- Yang, S.; Pilet, T.J.; Ordonez, J.C. Volume element model for 3D dynamic building thermal modeling and simulation. Energy 2018, 148, 642–661. [Google Scholar] [CrossRef]
- Eicker, U.; Zirak, M.; Bartke, N.; Romero Rodríguez, L.; Coors, V. New 3D model based urban energy simulation for climate protection concepts. Energy Build. 2018, 163, 79–91. [Google Scholar] [CrossRef]
- Mekonnen, A.D.; Gorsevski, P.V. A web-based participatory GIS (PGIS) for offshore wind farm suitability within Lake Erie, Ohio. Renew. Sustain. Energy Rev. 2015, 41, 162–177. [Google Scholar] [CrossRef] [Green Version]
- Gobakis, K.; Mavrigiannaki, A.; Kalaitzakis, K.; Kolokotsa, D.D. Design and development of a Web based GIS platform for zero energy settlements monitoring. Energy Procedia 2017, 134, 48–60. [Google Scholar] [CrossRef]
- McCord, P.; Tonini, F.; Liu, J. The Telecoupling GeoApp: A Web-GIS application to systematically analyze telecouplings and sustainable development. Appl. Geogr. 2018, 96, 16–28. [Google Scholar] [CrossRef]
- Repetto, M.P.; Burlando, M.; Solari, G.; De Gaetano, P.; Pizzo, M.; Tizzi, M. A web-based GIS platform for the safe management and risk assessment of complex structural and infrastructural systems exposed to wind. Adv. Eng. Softw. 2018, 117, 29–45. [Google Scholar] [CrossRef]
- Ashkezari, A.D.; Hosseinzadeh, N.; Chebli, A.; Albadi, M. Development of an enterprise Geographic Information System (GIS) integrated with smart grid. Sustain. Energy Grids Netw. 2018, 14, 25–34. [Google Scholar] [CrossRef]
- Maguire, D.J.; Longley, P.A. The emergence of geoportals and their role in spatial data infrastructures. Comput. Environ. Urban Syst. 2005, 29, 3–14. [Google Scholar] [CrossRef]
- De Longueville, B. Community-based geoportals: The next generation? Concepts and methods for the geospatial Web 2.0. Comput. Environ. Urban Syst. 2010, 34, 299–308. [Google Scholar] [CrossRef]
- Lance, K.T.; Georgiadou, Y.P.; Bregt, A.K. Evaluation of the Dutch subsurface geoportal: What lies beneath? Comput. Environ. Urban Syst. 2011, 35, 150–158. [Google Scholar] [CrossRef]
Figure 1.
The SOLIS calculation workflow.

Figure 2.
SOLIS interface: input data panel.

Figure 3.
SOLIS interface: time configuration panel.

Figure 4.
The results of the SOLIS assessment—sample A.

Figure 5.
The results of the SOLIS assessment—sample B.

© 2018 by the authors. Licensee MDPI, Basel, Switzerland. This article is an open access article distributed under the terms and conditions of the Creative Commons Attribution (CC BY) license (http://creativecommons.org/licenses/by/4.0/).
Share and Cite
MDPI and ACS Style
Kazak, J.K.; Świąder, M. SOLIS—A Novel Decision Support Tool for the Assessment of Solar Radiation in ArcGIS. Energies 2018, 11, 2105. https://doi.org/10.3390/en11082105
AMA Style
Kazak JK, Świąder M. SOLIS—A Novel Decision Support Tool for the Assessment of Solar Radiation in ArcGIS. Energies. 2018; 11(8):2105. https://doi.org/10.3390/en11082105
Chicago/Turabian StyleKazak, Jan K., and Małgorzata Świąder. 2018. "SOLIS—A Novel Decision Support Tool for the Assessment of Solar Radiation in ArcGIS" Energies 11, no. 8: 2105. https://doi.org/10.3390/en11082105
Note that from the first issue of 2016, this journal uses article numbers instead of page numbers. See further details here.