Sustainable Returns: The Effect of Regional Industrial Development Policy on Institutional Investors’ Behavior in China


1
Department of Information and Finance Management, College of Management, National Taipei University of Technology, No.1, Sec. 3, Chung-Hsiao East Rd., Taipei 10608, Taiwan
2
Ph.D. Program in Management, College of Management, National Taipei University of Technology, Taipei 10608, Taiwan
3
Department of Finance, China University of Science and Technology, No.245, Academia Road, Sec. 3, Nangang Dist., Taipei 11581, Taiwan
*
Author to whom correspondence should be addressed.
Sustainability 2018, 10(8), 2769; https://doi.org/10.3390/su10082769
Submission received: 9 June 2018
/
Revised: 23 July 2018
/
Accepted: 31 July 2018
/
Published: 6 August 2018
(This article belongs to the Special Issue Economic Geography: Location, Innovation and Sustainable Development)
Abstract
:Within the market economy system controlled by the Chinese government, this study mainly explores whether government policies can sufficiently guide the investment decisions of professional investors. Thus, we examine whether professional investment institutions can support the government’s policy for long-term investment to produce sustainable returns and create value for both the country and investment institutions. To perform this test, we use the annual data from firms held by institutional investors and listed in China A-shares to run a panel regression model. We then explore the following three issues: first, we examined whether firm-level characteristics or regional industrial development policy affect the investment behavior of the institutional investors. Second, we investigated whether four types of institutions have different favorite economic regions in China under the regional industrial development policy. Third, we analyzed which type of institutional investor supports the regional industrial development policy. The above four types of institutions are: independent, grey, domestic, and qualified foreign institutions. Empirical results show that both firm-level characteristics and regional industrial development policy can affect the investment behavior of the institutional owners. Of all the firm-level characteristics selected by institutions in China, return on equity (ROE) is the condition most commonly selected for all types of institutions, whereas the dividend yield (DY) is considered only by qualified foreign institutional investors (QFIIs). Notably, both independent and domestic institutions have the same firm selection criteria. As for the institutions’ favorite industries for investment, only grey institutions prefer the power industry and QFIIs prefer manufacturing industry. In addition, all four types of institutional investors have different industrial favorites in the four economic regions in China under the regional industrial development policy. For example, independent institutions prefer the information industry and grey institutions appear to be interested in every industry. Moreover, domestic institutions prefer the manufacturing and information industries, whereas QFIIs prefer the manufacturing industry. Regarding the regional participation of institutions, both domestic institutions and QFIIs seem to focus on every region. Moreover, independent institutions focus on the eastern and western regions, whereas grey institutions only focus on the western region. Finally, domestic institutions received the greatest level of support, followed by grey and independent institutions, whereas the QFIIs receive the least support. Put simply, domestic institutions are deeply engaged in industrial development all over China, whereas QFIIs are only slightly engaged in this development.
1. Introduction
The global financial crisis of 2007–2008 was considered by many economists the worst financial crisis since the Great Depression in the 1930s. This crisis caused many enterprises to enter liquidation, so governments attempted to eliminate or mitigate the effects of financial crises by publicizing the financial situations of institutions by requiring regular reporting under standardized accounting procedures and ensuring institutions have sufficient assets to meet their contractual obligations. In other words, this crisis increased the importance of corporate governance. Moreover, the majority of large shareholders believe that professional institutional investors can enhance the monitoring of corporate governance [1,2], indicating that they can play important stewardship roles in corporate governance [3]. Hernandez [4] defined stewardship as the “extent to which an individual willingly subjugates their personal interests to act in the protection of others’ long-term welfare”. Stewardship is a pro-social action, involving cognitive and affective mechanisms as antecedents to stewardship actions. Lydenberg [5] advocated for the transparency of the fiduciary duty of such investors when engaging in long-term investment for the benefits of society as a whole. Institutional investors form the model of another image of ownership: the steward.
Furthermore, as shown in Ferreira et al. [6], all institutional investors strongly prefer large firms with good corporate governance, whereas foreign institutions prefer firms that are included in the Morgan Stanley Capital International (MSCI) world index and are cross-listed on a U.S. stock exchange. Notably, the institutional investors can be divided into 75.42% independent (independent institutions are “active institutions”, since more attention is paid to corporate governance and the managerial behavior of the firms in which they invest. Independent institutions have the following characteristics: they like to collect information, have fewer restrictions on their investments [6], and have fewer business relationships with the firms in which they invest, and their income and management costs mainly depend on performance) and 24.58% grey (grey institutions are “passive institutions”, since they pay less attention to monitoring corporate governance, and hold shares without considering management actions. Moreover, they have more business relationships with the firms in which they invest [6]) institutional investors based on their business ties with the firm in which they invest. The investors can also be split into domestic (99.15%) institutional investors and qualified foreign institutional investors (QFIIs) (0.847%) based on the geographical origin of institutions (Table 1). In addition, given the few institutional investors in the Chinese stock market during the early phase, their shares in the stock market have experienced rapid growth. For example, QFIIs are the main foreign investors in China, and their total investment quota grew from $425 million U.S. in June 2003 to $19 billion U.S. in September 2010 [7], further increasing to $81.738 billion U.S. by the end of September 2016 [8]. Note, QFIIs have been allowed to access to China securities market since China entered the World Trade Organization (WTO) in 2001. Hence, the above four types of institutional investors were considered in this study, even if the proportion of QFIIs is very small compared with the other three types of institutional investor: independent, grey, and domestic institutional investors.
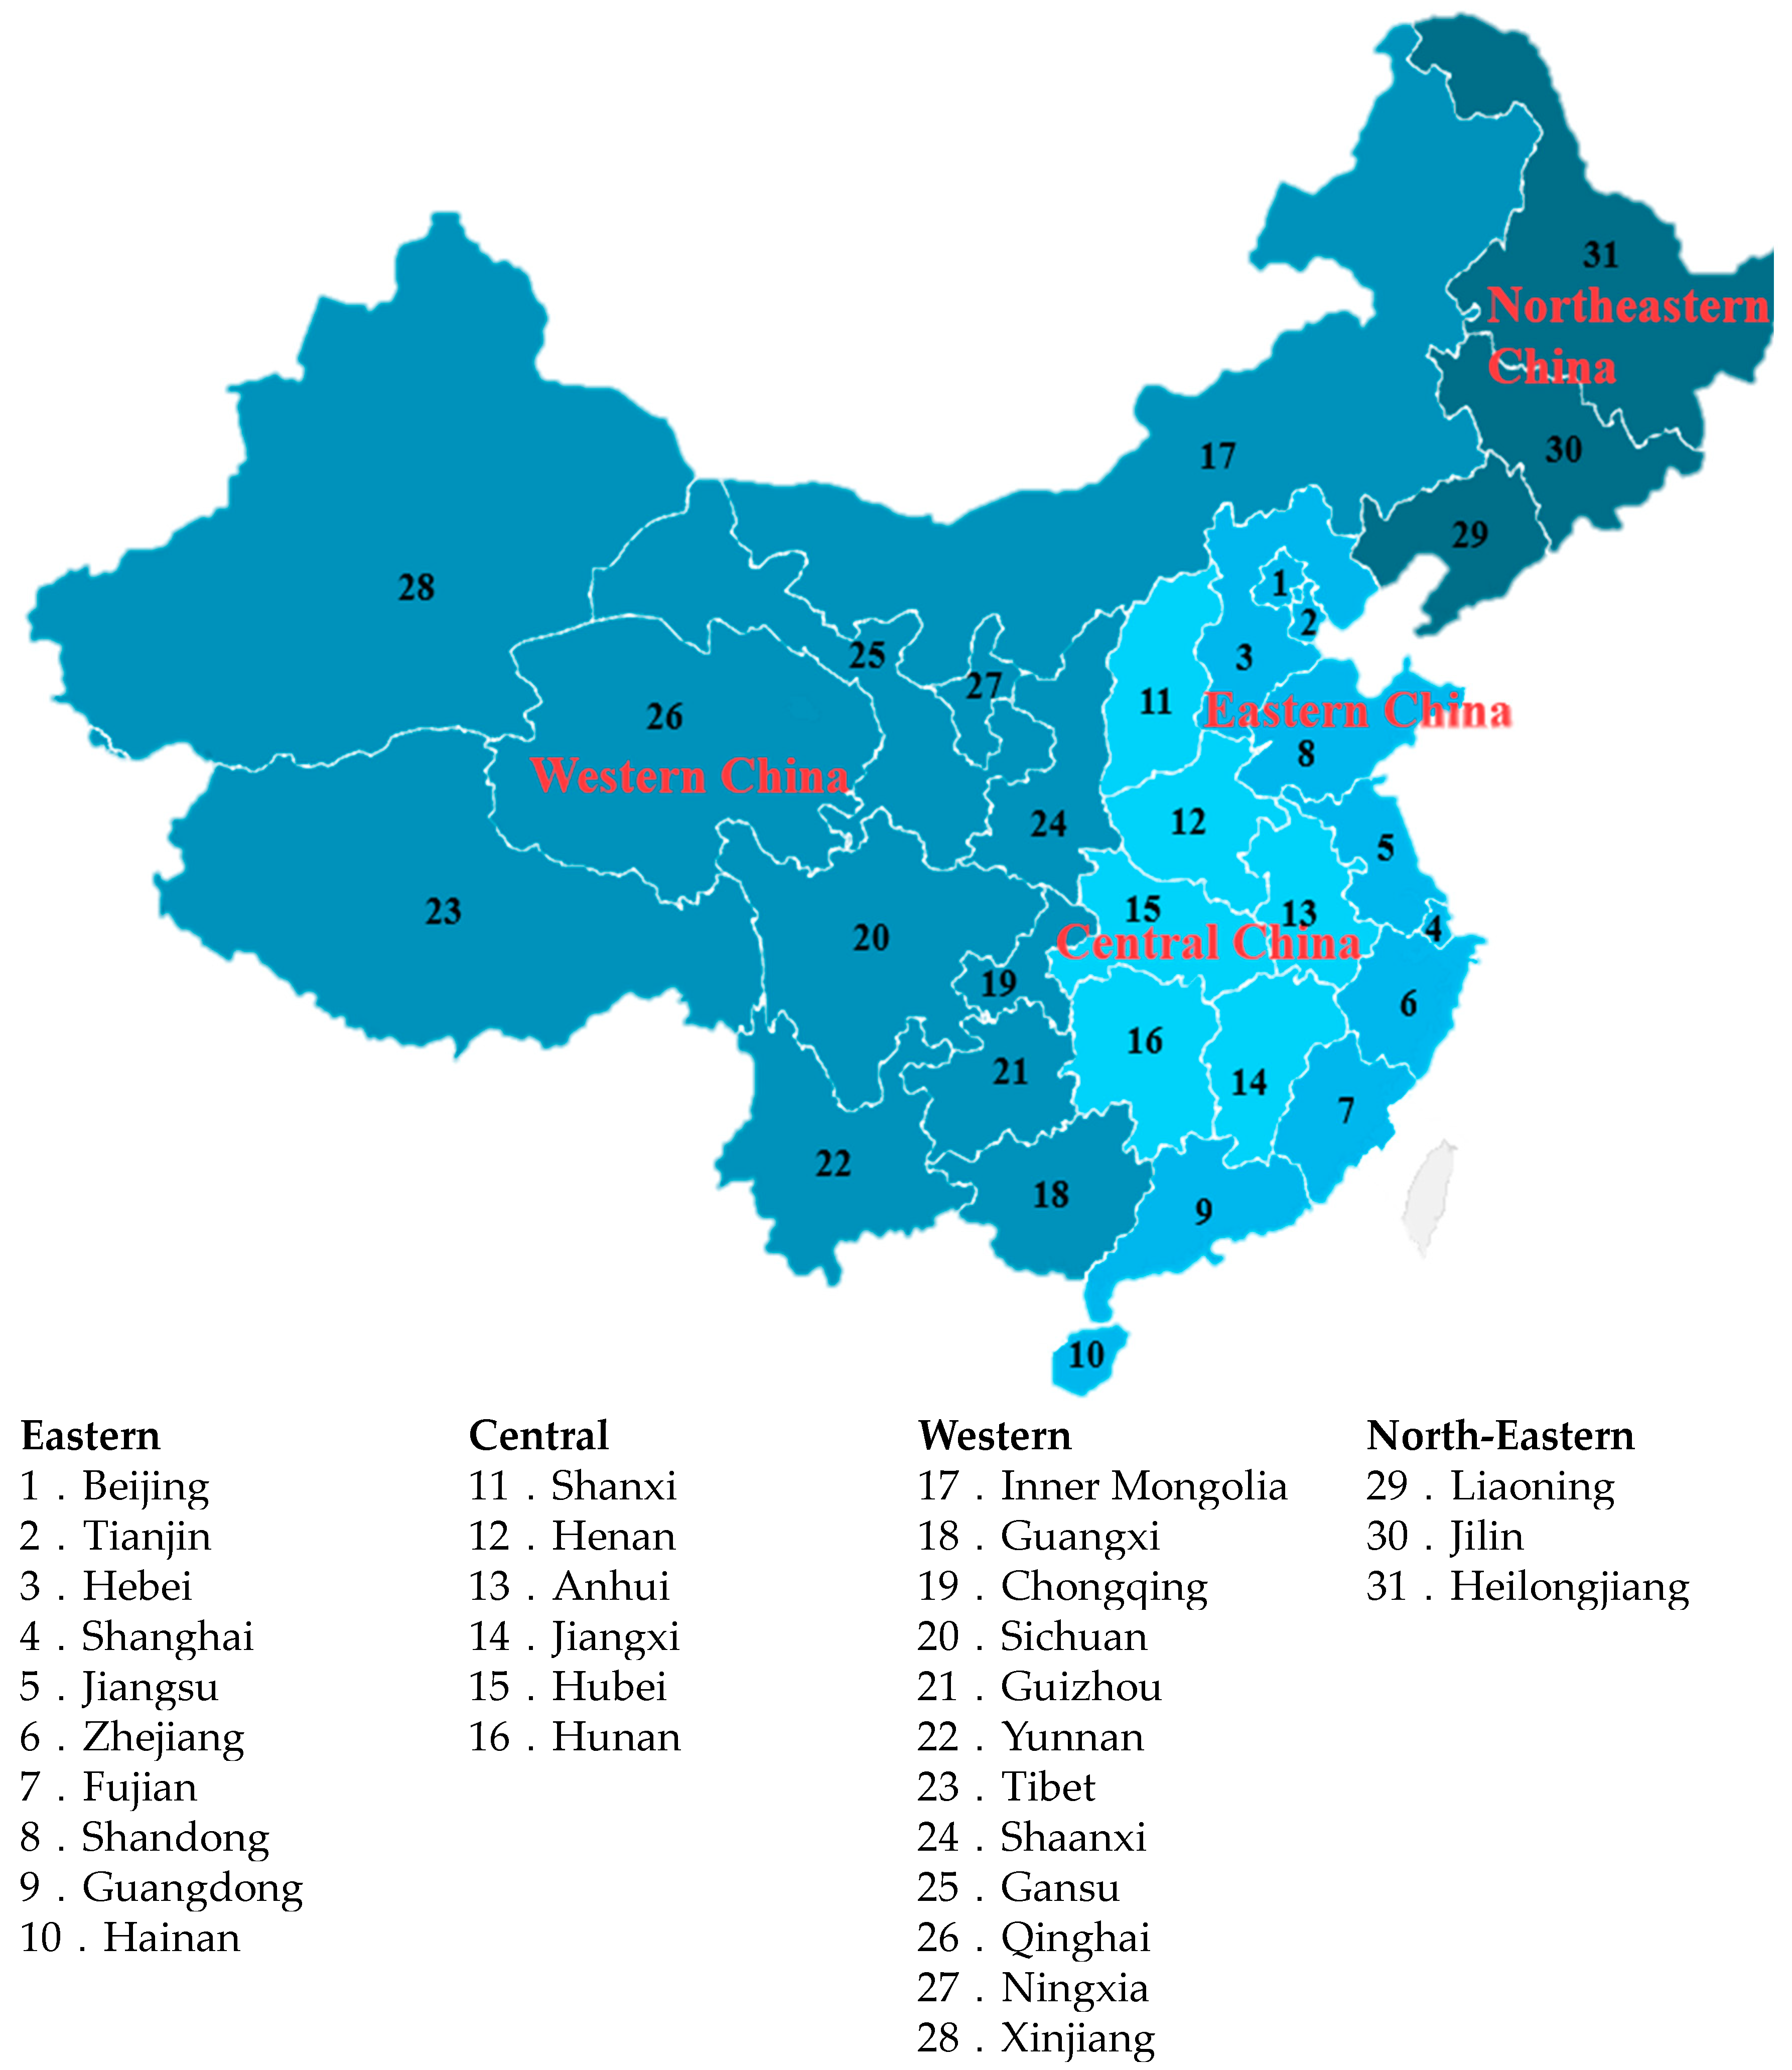
According to the report of the 16th National Congress of the Communist Party of China, mainland China is divided into eastern, central, western, and north-eastern regions, totaling four economic regions. Figure 1 shows the geographical units of these four economic regions in China. The eastern region includes 10 provinces and municipalities; the central region includes six provinces; the western region includes 12 provinces, municipalities, and autonomous regions; and the north-eastern region includes three provinces. In addition, 19 industries are categorized in China according to China Standard Industrial Classification Codes. According to the 2012 revised China Standard Industrial Classification Codes (GB/T 4754—2011), the industries are classified by National Bureau of Statistics of the People’s Republic of China [9]. However, they can be divided into three main sectors. The primary sector is agricultural industry (i.e., agriculture, forestry, husbandry, and fishing). The secondary sector contains the following four industries: manufacturing (i.e., light industry and heavy industry), power (i.e., production and supply of electricity, gas, and water), mining, and construction industries. The tertiary sector includes 14 industries such as information (i.e., information transmission, computer services, and software), financial (i.e., banking), wholesale (i.e., wholesale and retail industry), transportation (i.e., transport, storage, and postal service industries), accommodation (i.e., accommodation and catering industry), real estate, leasing (i.e., leasing and commercial service industry), scientific research (i.e., scientific research and technical service industries), water conservancy, environment and public facility management industries, residential service (i.e., residential service, repair and other services), education, health (i.e., health and social work), culture (i.e., culture, sports, and entertainment), and diversified industries. Notably, agricultural, manufacturing, and information are the industries with the greatest total number of firms within the above sectors. Moreover, the power and financial industries are strictly controlled in China, and they belong, respectively, to the above secondary and tertiary sectors. Hence, among the 19 industries, this study only focuses on the agricultural, manufacturing, power, information, and financial industries to explore regional industrial development policy in China.
China’s economic environment is still in the development stage [10], thus the Chinese government has implemented some regional industrial polices to encourage economic development. For example, as shown by the Chinese governmental report in 2005, Chinese development policy focused on developing the western region, revitalizing the north-east, increasing the rise of the central region, and ensuring the economy of the eastern region, according to the different features of the four economic regions. Thus, this study uses the above four regions to explore industrial development policy in China. Moreover, public policy sets the rules of the game. Public policy critically affects the ability of long-term investors to generate sustainable returns and create value [11], and therefore the implications of the state’s policy given the significant involvement of enterprise ownership must be seriously considered [12]. Furthermore, as reported in Naughton [13], investors should take into account the two following unique Chinese economic development characteristics: state-owned enterprises (SOEs) and government policy. The Chinese government plays an important role in the country’s economic development, and the role of corporate governance played by institutional investors in China may be different from that in the developed markets such as the U.S. [14], Sweden [15], and Japan [16]. Regional industrial development policy is a type of government policy [17]. It can attract hot money, and further can conduct investors to make investment decisions. Hot money is a type of capital that can move very quickly in and out of markets, and its investment horizon is short. Even if the regional industrial policy in a country is public information, believers in the efficient market hypothesis argue that it is impossible that institutional investors outperform their conventional peers. However, there are two arguments supporting the ‘outperformance’ hypothesis: first, sound social and environmental performance indicates good managerial quality, which is translated into favorable financial performance. Second, social and environmental screening reduces the possibility of incurring high costs during corporate social crises or environmental disasters, which financial markets tend to undervalue [18,19,20]. Moreover, different institutional investors may make diverse investment decisions since they have different specialized backgrounds and dissimilar ideas about business management.
Relevant literature has mostly focused on the relationship between the roles of institutional investors and corporate governance. The literature can be divided into two categories. (1) exploring the firm performance [7,15,16,21,22] and ownership structure [1,7,22] that affect the investment behavior of institutional investors; and (2) investigating the impact of institutional investors on board decisions [10,23,24,25,26,27], volatility of the firm’s stock return [14,28,29,30], and corporate governance [1,22,31,32,33]. Firm performance and ownership structure are the two firm-level characteristics used in this study. The aforementioned literature did not focus on the relationship between the roles of institutional investors and regional industrial development policy. Thus, this study uses the annual data from firms held by institutional investors and listed in China A-shares to run a panel regression model, which is a revised version of that presented by Ferreira and Matos [6]. Note, the Shanghai Stock Exchange and Shenzhen Stock Exchange are the two main stock exchanges in mainland China. Between these two stock exchanges, two types of stocks are issued: A-shares and B-shares. For example, the Shanghai Stock Exchange A-shares market has 1425 listed firms whereas the B-shares market has 51 listed firms. Conversely, in the Shenzhen Stock Exchange the A-shares market has 2105 listed firms whereas the B-shares market has 48 listed firms. Hence, this study focuses on A-shares, as have previous studies [7,10,30,31]. We then explore whether the firm-level characteristics and regional industrial development policy affect the investment behavior of institutional investors, and investigate whether the four types of institutional investors have different industrial favorites in the four economic regions in China under the regional industrial development policy. We further explore the types of institutional investor that support regional industrial development policy.
Empirical results show that both the firm-level characteristics and regional industrial development policy affect the investment behavior of institutional investors. Within China, regarding the firm-level characteristic selected by institutions, return on equity (ROE) is the most common condition selected by firms in the four types of institutions, whereas the dividend yield (DY) is considered only by QFIIs. Notably, both independent and domestic institutions use the same firm selection criteria. In terms of the favorite industries of institutions, only grey institutions prefer the power industry and only QFIIs prefer the manufacturing industry among the five major industries. Notably, all four types of institutional investors have different industry favorites in the four economic regions in China given the regional industrial development policy. For example, regarding the institutional investors’ industrial favorite, independent institutions prefer the information industry and grey institutions seemed to like every industry. Moreover, domestic institutions prefer the manufacturing and information industries, whereas QFIIs prefer the manufacturing industry. Regarding the regional participation of institutions, both domestic institutions and QFIIs do not focus on any particular region. Moreover, independent institutions focus on the eastern and western regions, whereas grey institutions only focus on the western region. Finally, domestic institutions receive the greatest level of support, followed by grey and independent institutions, whereas QFIIs receive the lowest level of support. In other words, except for the QFIIs, the other three types of institutions support the regional industrial development policy. Essentially, domestic institutions are deeply engaged in the industrial development of China, whereas the QFIIs are only slightly engaged.
The remainder of this paper is organized as follows. Section 2 describes the empirical models utilized in this study: a revised version of panel regression model introduced by Ferreira and Matos [6], and illustrates the definition and relative knowledge of three types of variables appearing in the above model: institutional ownership variables, firm-level variables, and China’s industrial development policy variables. Section 3 states the basic statistical characteristics of all the study data that corresponding to three types of variables, and provides the Pearson’s correlation coefficient test results for alternative pair-wise variables. In addition, we also perform the Chow test and the endogeneity test in this section. Section 4 analyses the empirical results of the panel regression model and further explores the issues addressed in this work. Finally, conclusions are drawn in the last section.
2. Methodology
In this study, we used the annual data from 2304 firms held by institutional investors that were listed as China A-shares during the period of 2004 to 2016, and then used the panel regression model to estimate the values of the firm-level variables and regional industrial development policy variables. We further used the estimated results to explore whether firm-level characteristics and regional industrial development policy affect the investment behavior of the institutional investors. We also investigated whether the four types of institutional investors have different industrial favorites in the four economic regions in China under the regional industrial development policy. We explored which types of institutional investor support the regional industrial development policy. The panel regression model is a revised version of the model introduced by Ferreira and Matos (hereafter, the abbreviation as RVFM model) [6], since the variables used in our model include firm-level characteristic variables and regional industrial development policy variables, whereas those used in Ferreira and Matos [6] included firm-level characteristic variables and country variables. Firm-level variables can depict firm performance and the ownership structure of a firm. Thus, this study first used the entire sample to perform the panel regression, and then we explored which firm-level characteristics attracted institutional investors. Next, we split our sample into four regions: eastern, central, western, and north-eastern China, and examined each institutional investors’ industrial favorite in each economic region. Notably, all institutional investors in China can be divided into two groups as previously reported in prior studies [6,10,32]. The first group includes independent institutional investors and grey institutional investors by identifying them based on whether the institutional investors have any business ties with the firm in which they invest. The second group includes domestic institutional investors and qualified foreign institutional investors based on the geographic origin of institutions. The panel regression model proposed in this study is as follows:
where IOit denotes the institutional ownership for firm at time , which can represent the total institutional ownership (TOTAL_IO) or the following four types of institutional ownerships: independent institutional ownership (Indep_IO), the grey institutional ownership (Grey_IO), domestic institutional ownership (Domes_IO), and qualified foreign institutional ownership (QFII_IO). The variables on the right-hand side denote the independent variables. They can be divided into the following two groups. The first group includes eight firm-level characteristic variables as reported by Ferreira and Matos [6]: the log value of market capitalization (SIZE), stock return (RET), turnover (TURN), dividend yield (DY), return on equity (ROE), Morgan Stanley Capital International index membership dummy (MSCI), insider owned enterprise (INSIDER), and state-owned-enterprise (SOE). Among them, INSIDER and SOE describe the ownership structure of a firm, whereas the other variables represent firm performance. They are used to measure what factors are determinant when the institutional investors invest in a firm. The second group includes six regional industrial development policy dummy variables defined in this study: economic region (Region) and agricultural, manufacturing, power, information, and financial industries. These variables are used to measure which industries are the favorites of institutional investors. Finally, yeardummy is a dummy variable for the period of 2004 to 2016, and denotes the error term of the panel regression. Subsequently, we discuss the relative theory or knowledge about firm-level characteristics, Chinese regional industrial development policy, and institutional ownership in the following three subsections.
2.1. Firm-Level Characteristics
Effective corporate governance protects against probable financial challenges and facilitates sustainable growth; therefore, corporate governance plays a key role in the growth of firm performance. However, the ownership structure of a firm affects the efficiency of corporate governance, which can be measured by firm performance. In this study, the ownership structure and firm performance are called the firm-level characteristics. Overall, an effective corporate governance should be highly correlated with abnormal stock returns, and thus a company with good firm-level characteristics can attract institutional investors. In this study, firm-level characteristics are described by the following eight variables: SIZE, RET, TURN, DY, ROE, MSCI, INSIDER, and SOE. These variables can be used to measure the factors that determine when institutional investors invest in a firm. Therefore, this study examines which firm-level characteristics are the determining factors that affect institutional investors. Thus, this expectation is our first hypothesis.
Hypothesis 1a.
Firm-level characteristics affect the investment behavior of the institutional investors.
The firm-level characteristic variables are defined as follows. SIZE is the logarithm of the annual market capitalization. RET is the annual (end-of-year) geometric stock rate of return. TURN is the annual share volume divided by adjusted shares outstanding. DY is the annual dividend yield. ROE is the annual return on equity. MSCI is MSCI member dummy, which equals one if a firm is a member of the MSCI China–A Index, and zero otherwise. INSIDER means the shares are held by individuals or insiders as a percentage of shares outstanding. SOE is a dummy variable that takes the value of one if a firm is a state-owned enterprise, and zero otherwise.
2.2. Regional Industrial Development Policy in China
This study used regional planning and industry classifications to investigate the industrial favorite of institutional investors under China’s regional industrial development policy. As reported in the introduction, mainland China is divided into the eastern, central, western, and north-eastern regions, for a total of four economic regions. Notably, only the agricultural, manufacturing, power, information, and financial industries were considered in this study. As for the regional industrial development policy in China, some industries are being developed in some specific regions. For example, agriculture and fishing are mainly promoted in the eastern region, whereas forestry and husbandry are mostly found in the north-eastern region, indicating that agriculture is performed in the eastern and north-eastern regions. Light industry is mainly found in the eastern and western regions, and heavy industry has been mostly developed in the north-east, indicating that manufacturing has been developed in the eastern, western, and north-eastern regions. The power industry is the main development industry in the central and western regions. The information as an innovation and high technology industry is mainly distributed in the eastern, central, and western regions. The financial industry is the main industry in the eastern region. To summarize, the agriculture, manufacturing, information, and financial industries are developed in the eastern region, whereas power and information industries are developed in the central region. Conversely, the manufacturing, power, and information industries have been developed in the western region, whereas agriculture and manufacturing have been developed in the north-eastern region.
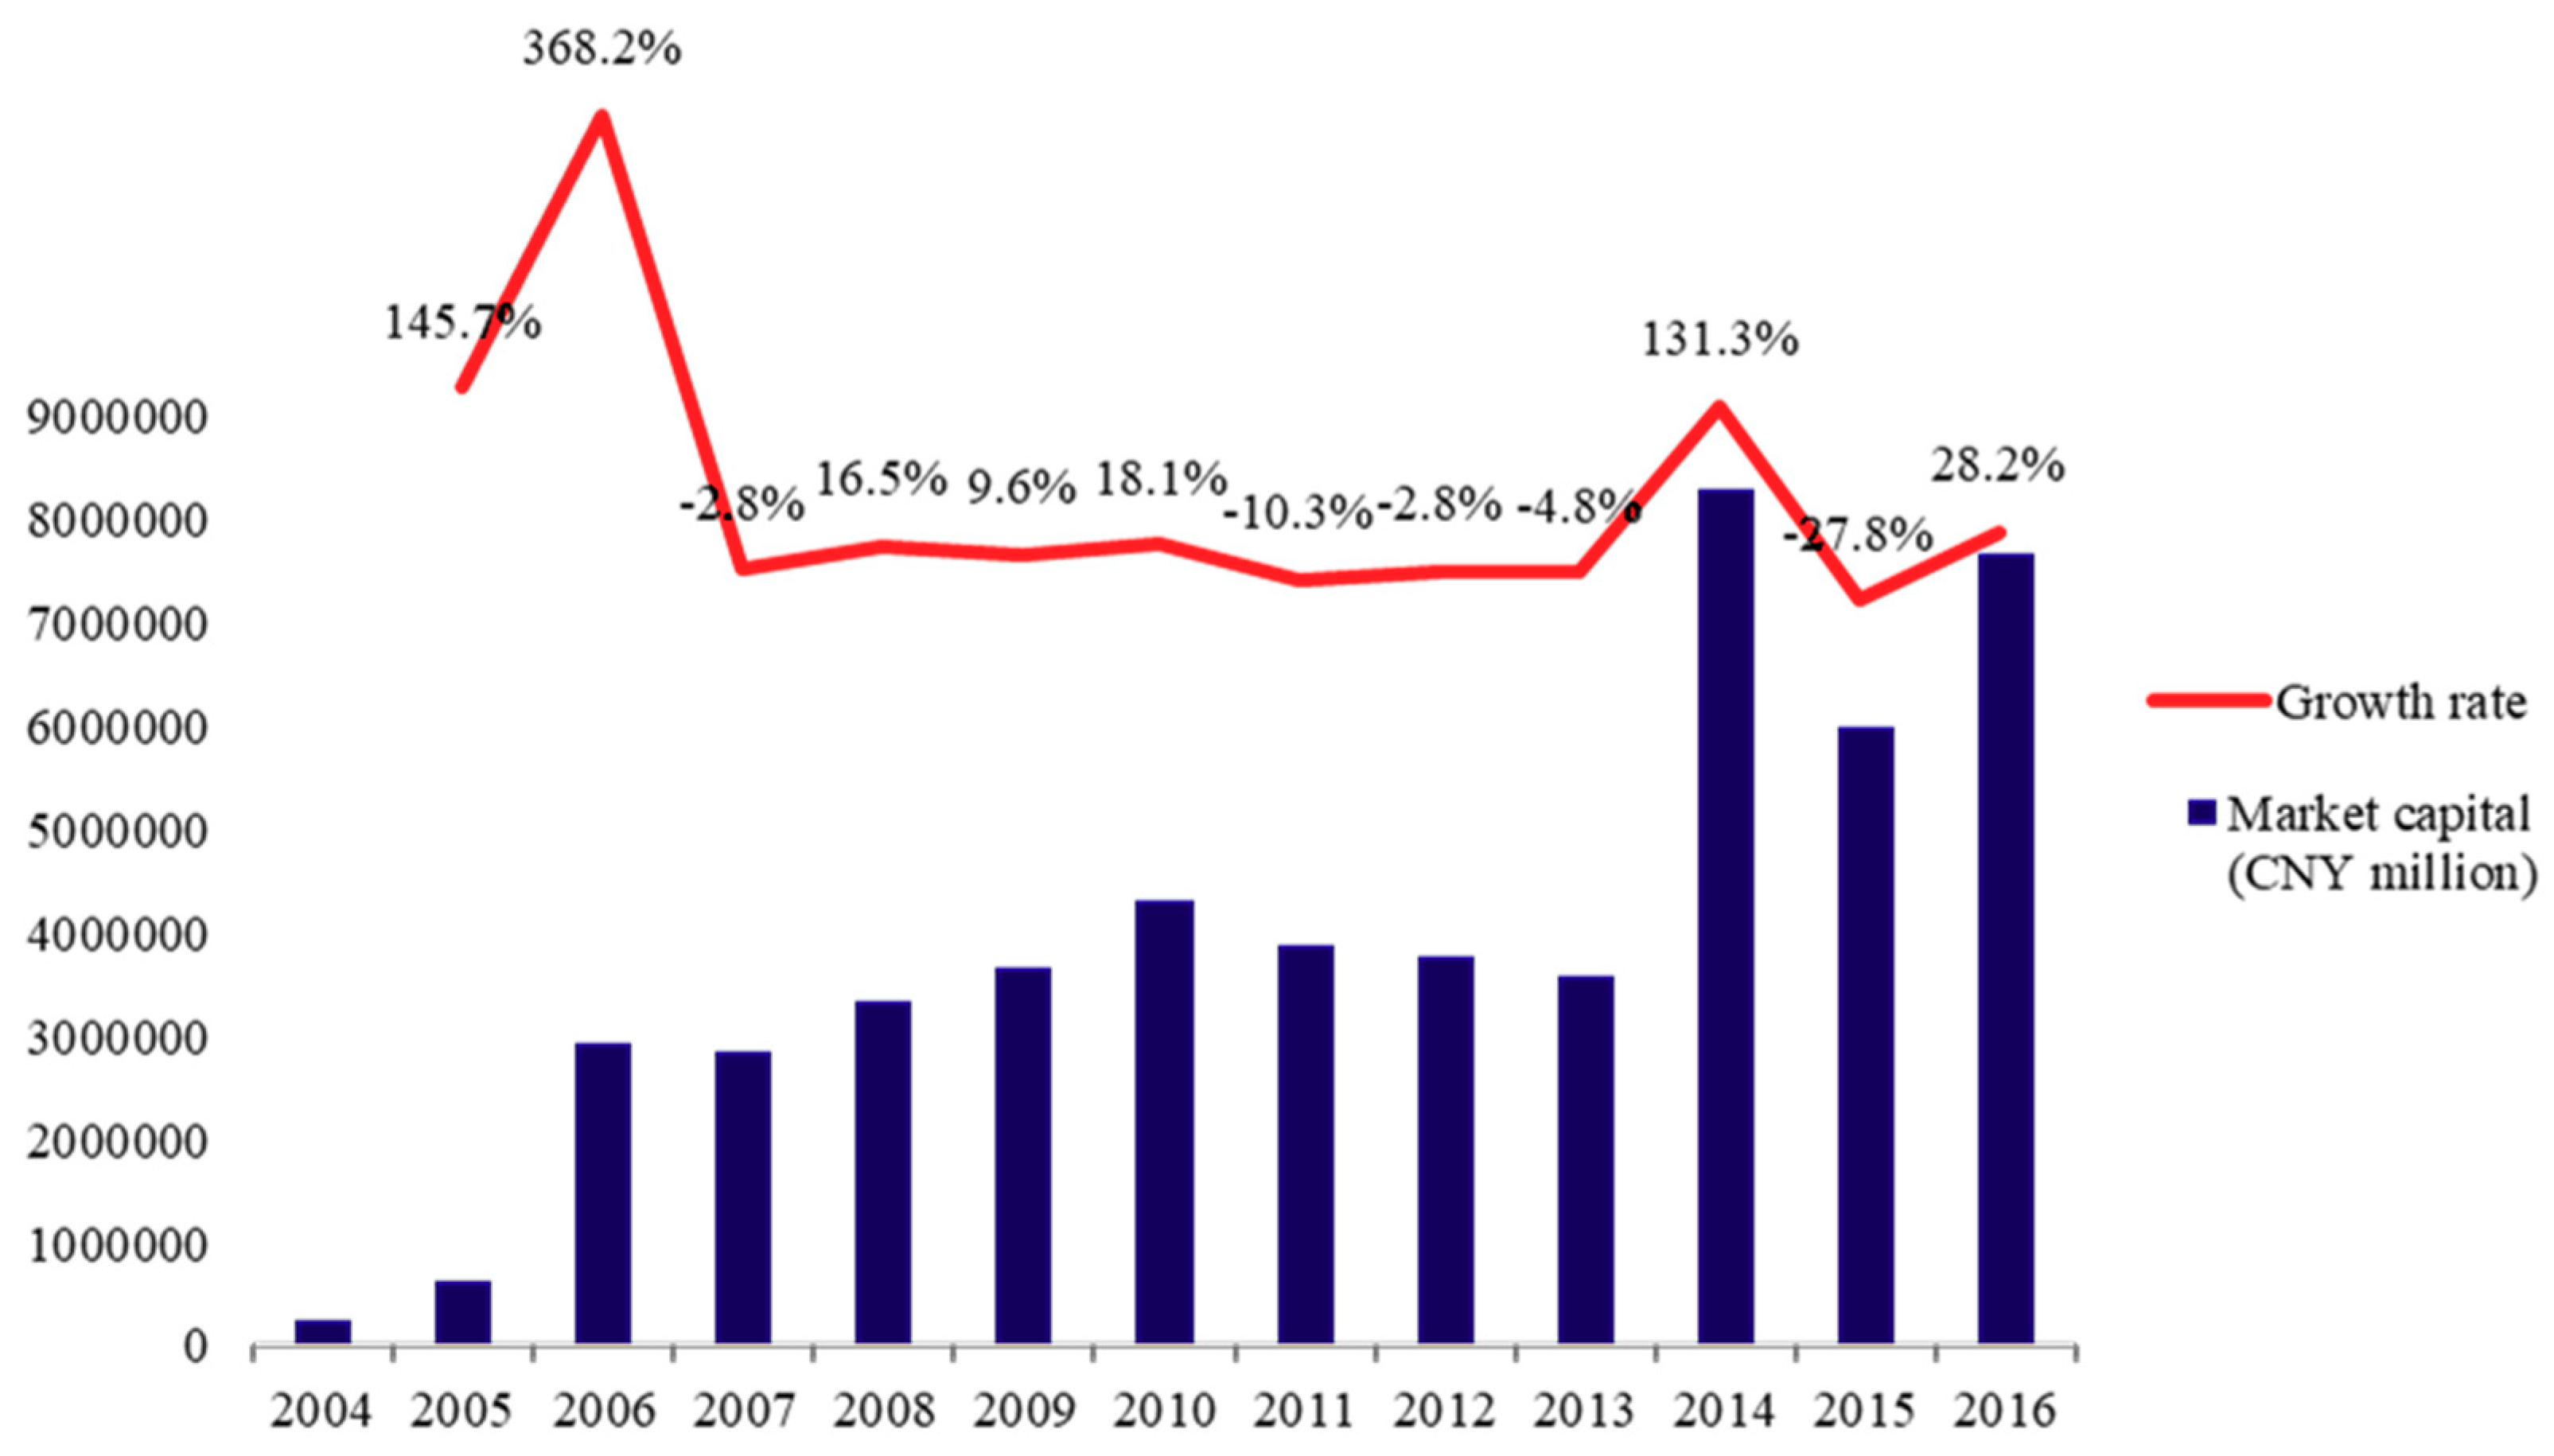
Figure 2 shows the growth rate of market capitalization for all institutions for the period of 2004 to 2016. The market capitalization of all institutions increased after China launched its national policy. For example, the growth rate of market capitalization for all institutions was 145.7% in 2005, and increased to 368.2% in 2006. Notably, the market capitalization growth rate for all institutions increased to 131.1% in 2014 after the Silk Road Economic Belt and the 21st Century Maritime Silk Road plans were launched in 2013. The above phenomenon indicates that the industrial development policy sets the rules of the game and thus can create value, and further critically affects the ability of firms to generate sustainable returns for long-term investors [11]. Given this information, we expected that institutional investors prefer firms whose business strategy is consistent with regional industrial development policy, or the regional industrial development policy can affect institutional investors, which is our second hypothesis.
Hypothesis 1b.
Regional industrial development policy can affect the investment behavior of institutional investors.
The industrial development policy dummy variables are defined based on Chinese standard industrial classification codes, as follows. Agricultural is a variable that takes a value of one if a firm belongs to agriculture, forestry, husbandry, and fishing industries, and zero otherwise. Manufacturing is an industry dummy variable that takes a value of one if a firm belongs to light industry and heavy industry, and zero otherwise. Power is a variable that takes the value of one if a firm belongs to production and supply of electricity, gas, and water industries, and zero otherwise. Information is an industry dummy variable that takes a value of one if a firm belongs to information transmission, computer services, and software industries, and zero otherwise. Finally, financial takes a value of one if a firm belongs to banking industry, and zero otherwise.
2.3. Institutional Ownership
As institutional owners may be businesses tied to the firm in which they invest, institutional investors in China can be divided into independent institutional investors and grey institutional investors. The relative theory and knowledge about these institutional investors are illustrated as below. Independent institutional investors include hedge fund managers, investment managers, sovereign wealth funds, and venture capital (VC) and private equity (PE) firms. Notably, fund managers are the major institutional investors in the Chinese stock market. Almazan et al. [26] regarded these types of institution as “active institutions” since more attention is paid to corporate governance and the managerial behavior of the firms in which that they invest. Independent institutions have the following characteristics: they like to collect information, have fewer restrictions on their investments [6], have fewer business relationships with the firms in which they invest, and their income and management costs mainly depend on performance. To summarize, we anticipated that independent institutional investors would have more of an incentive to monitor corporate management than grey institutional investors would, and thus they prefer firms and industries with good stock returns. Hence, we also expected that this type of institution would support the national industrial development policy. As such, our next hypothesis is:
Hypothesis 2a.
Independent institutions, as active institutions, support the regional industrial development policy.
Grey institutional investors include banks, insurance companies, family offices/trusts, real estate investment trust (REIT), corporate pensions, government pensions, union pension sponsors, charitable foundations, educational and cultural endowments, and unclassified investors. Almazan et al. [26] called these institutions “passive institutions”, since this they pay less attention to monitoring corporate governance, and hold shares without considering management actions. Moreover, they have more business relationships with the firms in which they invest [6]. Therefore, we anticipated that grey institutional ownership holds shares without monitoring corporate management actions, and further presume that this type of institution does not support the national industrial development strategies. Thus, our next hypothesis is:
Hypothesis 2b.
Grey institutions, as passive institutions, do not support the regional industrial development policy.
As mentioned above, institutional investors in China can be divided based on geographic origin into domestic institutional investors and QFIIs. Notably, QFIIs play a more important role than their domestic counterparts for motivating changes in corporate governance practices, and thus they are often considered active institutions [1]. Therefore, we attempted to determine whether these two types of institution engage in the national industrial development strategies. Thus, this expectation forms our next hypothesis:
Hypothesis 3a.
Domestic institutions support the regional industrial development policy; and Hypothesis 3b. Foreign institutions support the regional industrial development policy.
The institutional ownership variables are defined as follows. Total_IO is institutional ownership by all institutions as a percentage of shares outstanding. Indep_IO is institutional ownership by independent institutions (i.e., hedge fund managers, investment managers, sovereign wealth funds, and VC/PE Firms) as a percentage of shares outstanding. Grey_IO is institutional ownership by grey institutions (i.e., banks, insurance companies, family offices/trusts, REIT, corporate pensions, government pensions, union pension sponsors, charitable foundation, educational and cultural endowments, and unclassified) as a percentage of shares outstanding. Domes_IO is institutional ownership by domestic institutions as a percentage of shares outstanding. QFII_IO is institutional ownership by qualified foreign institutions as a percentage of shares outstanding.
3. Data and Preliminary Analysis
Before the empirical results are analysed, we first introduce the data source and descriptive statistics data, then we perform two main tests: the endogeneity test and the Chow test. The endogeneity test is used to check whether endogeneity exists in the regression model. If endogeneity does not exist, then the empirical results of this regression model in the subsequent sections are reliable. Conversely, the Chow test is used to check whether the parameters of one group of data are equal to those of other groups. If two groups have different slopes and intercepts, then the data cannot be pooled, and it would be reasonable to perform regression on the data for each region. That is, we split our data into four groups to estimate the panel regression model.
3.1. Data Source and Descriptive Statistics
The data included the annual data of 2304 firms held by institutional investors that were listed as China A-shares. The firms were distributed in the Shanghai Stock Exchange (SSE) and the Shenzhen Stock Exchange (SZSE), but special treatment companies were excluded. The above data were divided into the following three types: institutional ownership, firm-level characteristic, and regional industrial development policy. The data cover the period from 2004 to 2016, and most of were collected from the S&P capital IQ database except for QFII and TURN data. The QFII and TURN, data were downloaded from the China Stock Market and Accounting Research (CSMAR) database.
Table 1 reports the basic statistical characteristics of the above three types of data. Subsequently, we used the mean value of the alternative variables to illustrate the phenomena found in China. Regarding the institutional ownership variable, among all the institutions, the independent institutions formed the largest proportion at 75.42% (0.089/0.118), whereas grey institutions formed the remaining 24.58% (0.029/0.118). The mean value for all institutions was 0.118, denoting that firms held by institutional investors form 11.8% of all firms given the values of all variables considered in this study. Notably, the above firms were listed as China A-shares. Conversely, domestic institutions account for 99.15% (0.117/0.118), whereas QFIIs account for the remaining 0.847% (0.001/0.118) of the total number of institutions. These results indicate that independent and domestic institutions are the main types of institutional investors in China. As demonstrated by the firm-level characteristic variables, 34.4% of firms were members of the MSCI China-A index, and 40.8% were state-owned enterprises. The Chinese stock market has a high value of turnover (5.904), indicating that the Chinese firms almost have good corporate governance and are mainly controlled by the government. In addition, Chinese investors have a high trade frequency. In terms of the regional industrial development policy variables, we found that the manufacturing industry accounted for 63.2%, indicating that China focuses on the manufacturing industry.
Table 2 lists the results of the Pearson’s correlation coefficient (PCC) test for the alternative pair-wise variables. Analysing the results listed in this table was difficult, hence we illustrate the phenomena found in this table based on six groups of comparison. The first group of PCC tests was the relationship between two variables that are both classified as institutional ownership variables. It was reasonable to attain low PCC values between Grey_IO and Indep_IO (0.023), and between Demes_IO and QFII_IO (0.089), since the Grey_IO and Indep_IO are mutually exclusive sets and so are Demes_IO and QFII_IO. These results are consistent with the classification theory of institutions mentioned in the Methodology section. Notably, the high values of PCC between Demes_IO and Indep_IO (0.787), and between Demes_IO and Grey_IO (0.626), indicate that most independent institutions and grey institutions are domestic institutions. This phenomenon is induced by the QFII accounting for a small proportion in China.
The second group of PCC tests is the relation between two variables that are all the firm-level characteristic variables. In this group of tests, we were interested in the firm attributes that attract the INSIDER type of investors, the firm-level characteristics of SOE, and the properties of MSCI-type firms. In comparing the PCC values between INSIDER (or SOE) and the other firm-level characteristic variables, we found that the INSIDER investors were likely to invest in firms with a high TURN value, since the PCC value for INSIDER-TURN (0.206) was significantly positive, and was the greatest among the PCC values for the other related pair-wise variables for INSIDER. Moreover, the SOE firms had high DY values, since the PCC value for SOE-DY (0.114) was significantly positive, and was the greatest among the PCC values for the other related pair-wise variables related to SOE. In addition, the PCC values between MSCI and the other firm-level characteristic variables showed that the firms with high SIZE values would be classified as MSCI members, since the PCC value for MSCI-SIZE (0.465) was significantly positive, and was the greatest among the PCC values for the other related pair-wise variables associated with MSCI.
The third group of PCC tests examined the relationship between two variables in the industrial development policy variables group. In this group of tests, we found that the PCC values were almost significantly negative for the pair-wise variables from two different industries, indicating that the attributes of all five major industries are different. This result further supports our selection of agricultural, manufacturing, power, information, and financial industries to explore the issues under study.
The fourth group of PCC tests studied the relationship between two variables in the institutional ownership variables grouping and the firm-level characteristic variables. In this group of tests, we were interested in the firm attributes that attract the four types of institutional ownership. The PCC values between Grey_IO and all the firm performance variables demonstrated that firms with high ROE values attract grey institutions, since the PCC value for Grey_IO and ROE (0.024) was significantly positive, and was the greatest among the PCC values for the other related pair-wise variables for Grey_IO. Using the same inference process, the firm with large SIZE values attract the independent and domestic institutions, whereas the firms with high DY values attract qualified foreign institutions.
The fifth group of PCC tests examined the relation between two variables in the institutional ownership variables and industrial development policy variables groupings. In this group of tests, we were interested in which industry was favored by the four types of institutional investors. The PCC values between Indep_IO and all the industrial development policy variables showed that the information industry is favored by independent institutions, since the PCC value for Indep_IO and information (0.048) was significantly positive, and was the greatest among the PCC values for the other pair-wise variables related with Indep_IO. Using the same inference process, the agricultural industry was the industry favored by grey institutions, the financial industry was favored by domestic institutions, and manufacturing was favored by qualified foreign institutions.
The sixth group of PCC tests examined the relationship between two variables in the firm-level characteristic variables and industrial development policy variables groupings. In this group of tests, we were interested in the firm-level characteristics of the five types of industry. Of the PCC values between agricultural and all the firm-level characteristic variables, the agricultural industry had the highest TURN value, since the PCC value for agricultural-TURN (0.034) was significantly positive, and was the greatest among the PCC values for the other related pair-wise variables associated with agriculture. Using the same inference process, both the manufacturing and information industries attract the INSIDER type of investor or the INSIDER type of investor prefer to invest in the manufacturing and information industries. Moreover, the power industry attracted SOE, or the SOE that like to invest in the power industry. Furthermore, the financial industry had the highest SIZE value.
3.2. Endogeneity Test
In a regression model, if the independent variable is correlated with the error term, then the estimate of the regression coefficient in an ordinary least squares (OLS) regression is biased. In econometrics, we call this phenomenon endogeneity. For example, the panel regression model in this study can be expressed as the following vector form:
where is the dependent variable, i is the cross-sectional dimension for an individual firm, t is the time dimension of the data, denotes the vector of the coefficients to be estimated for the alternative individual region data, is the vector of explanatory variables (1, , , , , , , , , , , , , ), and is the error term. The above panel regression model can also be expressed in the following scalar form:
If and , then endogeneity does not exist in this panel regression model. However, if one explanatory variable is correlated with the error term , then endogeneity exists in this model, and the variable is calld an endogenous variable. That is, the condition of endogeneity is . Thus, we set the following simple regression to test whether the endogeneity exists:
where is a constant and is the error term of this simple regression; is the residue series obtained from Equation (3); and is one of the following 13 explanatory variables in this study: , , , , , , , , , , , , and . If the value of coefficient is significantly different from zero (i.e.,), then the error term can affect variable , indicating that the phenomenon of endogeneity exists in this model. Conversely, if the value of coefficient is not significantly different from zero, then the phenomenon of endogeneity does not exist in this model. Table 3 lists the empirical results for coefficient in Equation (4) for all 13 explanatory variables in this study, except for the region variable. From Table 3, all the values of coefficient were very small and not significant, indicating that all 13 explanatory variables are exogenous variables. In other words, endogeneity does not exist in this model. Hence, the empirical results of this study in the subsequent section are considered reliable.
Except for using a simple regression to test whether the endogeneity exists, we also use the instrumental variables (IV) model to obtain the estimators if the endogeneity exists in a model. Then we use the first stage F-statistic to check whether the estimators are not biased. Or if the endogeneity exists in panel regression model, we can use instrumental variable (IV) regression to obtain a consistent estimator when for example the regressor is correlated with the error term . Instrumental variable estimation uses an additional ‘instrumental’ variable to isolate that part of that is uncorrelated with . This in turn permits consistent estimation of the regression coefficients. However, a valid instrumental variable must satisfy two conditions: instrumental relevance (), and instrument exogeneity (i.e., ). If the instrument satisfies the conditions of instrument relevance and instrument exogeneity then the coefficient can be estimated using an IV estimator called two stage least squares (TSLS). The two stage least squares estimator is calculated in two stages. In this study, we assume only one endogenous regressor exists in this model, and we also use only one instrumental variable , hence the others’ explanatory variables in Equation (3) are exogenous variables. The panel regression model in Equation (3) can be re-expressed as follows:
The first stage regression of TSLS relates to the instrument () and the exogenous variables ():
where is an error term; the variables are in Equation(3), respectively; are unknown regression coefficients and are estimated by OLS. The predicted value from this regression is In the second stage of TSLS, Equation (5) is estimated by OLS except that is replaced by its predicted value from the first stage. That is, s regressed on , using OLS. The resulting estimator of is the TSLS estimator. Notably, if instruments explain little of the variation in , we call the instruments weak instruments. If instruments are weak, TSLS is no longer reliable. Therefore, it is vital that we assess whether these instruments are valid. Here, we use the first-stage F-statistic to check for weak instruments when there is a single endogenous regressor. The first-stage F-statistic is the F-statistic testing the hypothesis that the coefficients on the instruments equal zero in the first stage of two stage least squares. When there is a single endogenous regressor, a first stage F-statistic less than 10 indicates that the instruments are weak, in which case the TSLS estimator is biased [34,35].
Table 4 lists the empirical result of panel two-stage least squares (TSLS) model of one endogenous variable with one instrumental variable and control variables. In Table 4, we follow Anderson and Hsiao [36], and Arellano and Bond [37] to select the instrument being the supposed endogenous variable with one lag period. For example, suppose that is correlated with the error term then the variable is an endogenous variable. The is selected instrument, then we perform the first stage regression of TSLS. That is, s regressed on , in Equation (6) by using OLS. The coefficient value of instrument (i.e., ) is significant, and is equal to 0.7627 (i.e., ). It is listed at the column ‘SIZEt-1’ corresponding to the row ‘Instrumental variable Zi’ in Table 4. Moreover, the value of the first stage F-statistic is equal to 179.76, and it is far greater than 10, indicating that rejecting the null hypothesis . This result infers that the weak instrument does not exist. In other word, the TSLS estimator is not biased. Notably, in this table we do not list the others coefficient values in Equation (6). Subsequently, we execute the second stage regression of TSLS. That is, is regressed on , in Equation (5) by using OLS. is the predicted value, and it is obtained via substituting all the estimated coefficients (i.e., ) in Equation (6). The coefficient value of is significant, and is equal to 0.0235 (i.e., ). This value is almost the same as the coefficient value of (0.0231) in Model (2). In addition, the value of R2 for the second stage regression of TSLS is equal to 0.138, and it is almost the same as that for Model (2) (i.e., ). Turn to the others explanatory variables in Equation (3), we follow the above procedure, and we find that all the values of first stage F-statistic are greater than 10, indicating that the weak instrument does not exist, and all the TSLS estimator are consistent. In addition, all the value of R2 for the second stage regression of TSLS are almost the same as that for Model (2). Hence, we can get a conclusion that all the empirical results listed at the following sequential tables deserve to believe.
3.3. Chow Test
According to the report of the 16th National Congress of the Communist Party of China, mainland China is divided into four economic regions: eastern, central, western, and north-eastern. We then examined whether the four types of institutional investors different industrial favorites under the regional industrial development policy in the four economic regions in China. Hence, according to the above four regions in China, we split our data into four groups to estimate the panel regression model. However, we wanted to determine if it was reasonable to regression the data for each region. In this paper, we followed Kangasharju [38] when choosing to use the Chow test [39] to examine whether the parameters of one group of the data were equal to those of the other groups for six pair-wise regions composed of two alternative regions from the above four regions: eastern vs. central, eastern vs. western, eastern vs. north-eastern, central vs. western, central vs. northeastern, and western vs. northeastern. The Chow test determines whether the true coefficients in two linear regressions on different data sets are equal. It is often used to determine whether independent variables have different impacts on different subgroups of the population. Hence, for the pair-wise regions, we modeled our data as for all observations (i.e., two groups of data combined together). For each of group of data, we have for observations of group 1 and for observations of group 2, where , and are defined as in Equation (2). denote the above coefficient vectors for the data from group 1 and group 2, respectively. As mentioned above, the Chow test is used to examine whether parameters of one group of the data are equal to those of other groups, or it is used to test whether the data can be pooled. Hence, the null hypothesis of the Chow test is . If the null hypothesis is rejected, two groups have different slopes and intercepts, and the data cannot be pooled. The Chow test statistic follows the F distribution with and degrees of freedom and is expressed as:
where is the sum of squared residuals from the combined data; and denote the sum of squared residuals from the first and second groups, respectively; and denote the number of observations in the first and second groups, respectively; and is the total number of parameters, which equals 14 in this case. Table 5 lists the empirical results of the Chow test for the six pair-wise regions. From Table 5, all Chow tests were rejected, indicating that the four regions of data have different slopes and intercepts, and the data cannot be pooled. In other words, it is reasonable to regression the data for each region.
4. Empirical Results
A firm with good firm-level characteristics or engaging in regional industrial development policy should have excellent profit, so we proposed two hypotheses, H1a and H1b, to explore whether the firm-level characteristics or regional industrial development policy affect the investment behavior of institutional investors. Subsequently, different industries developed in the different regions in China according to regional industrial development policy. Notably, the four types of institutional investors in China depend on the geographic origin of the institutions or whether they have business ties with the firm in which they invested. Hence, this study proposed four hypotheses, H2a, H2b, H3a, and H3b, to investigate whether these four types of institutional investors have different industrial favorites under the regional industrial development policy in China. We further explored which type of institutional investor supports the regional industrial development policy.
4.1. Do Firm-Level Characteristics and Regional Industrial Development Policy Affect Investment Behavior of Institutional Investors?
Regarding the H1a and H1b hypotheses, we used the annual data of 2304 firms covering the period from 2004 to 2016 and used the panel regression model and the RVFM model [6] to estimate the values of two types of variables for five kinds of institutional investors. The two types of variables include the firm-level characteristic variables and the regional industrial development policy variables. The five kinds of institutional ownerships include total institutional ownership (Total_IO) and four types of institutional ownerships: independent institutional ownership (Indep_IO), grey institutional ownership (Grey_IO), domestic institutional ownership (Domes_IO), and qualified foreign institutional ownership (QFII_IO). Finally, the obtained empirical results were used to perform the tests associated with the above two hypotheses.
Table 6 lists the empirical results of the panel regression model and the RVFM model [6]. As shown in the results obtained from Model (1) in Table 6, we found that all the firm-level characteristic parameters were significant, indicating that the H1a is accepted. For example, parameters ROE (0.1642), SIZE (0.0209), RET (0.0130), and MSCI (0.0081) were all significantly positive, indicating that the institutional investors in China prefer firms with high values of ROE, SIZE, or RET, or they like the firms classified as MSCI. This result indicates that investors like to invest the firms with better financial performance [40]. This phenomenon seems to be consistent with those found in DelGuercio [41], Falkenstein [19], Dahlquist and Robertsson [15], and Chao and Chen [42], because when selecting a firm for institutional investors, the return [41] and the size of the firm [15,21] are crucial factors. Moreover, foreign investors prefer the firms that are collected in the MSCI [42]. Conversely, parameters DY (−0.6509), INSIDER (−0.0485), SOE (−0.0121), and TURN (−0.0029) were all significantly negative, indicating that institutional investors in China do not like firms with high values of DY and TURN, or they also do not like firms with high values of INSIDER or SOE. This phenomenon is consistent with that found in Ferreira and Matos [6], since the investors prefer firms with a smaller proportion of insider investors.
Hypothesis 1b was tested using the correlation coefficient (R*) values for Model (1) and Model (2), and the significance of regional industrial development policy variables in Table 6. Notably, the independent variables in Model (2) included firm-level characteristic variables and regional industrial development policy variables, whereas the independent variables in Model (1) only included firm-level characteristic variables. The R**value for Model (2) was greater than that of Model (1), and most of the regional industrial development policy variables were significant, indicating that it is necessary to add the regional industrial development policy variables into Model (1) when the total institutional ownership (Total_IO) was regressed only by the firm-level characteristic variables in Model (1). In other words, the higher R**value for Model (2) and the significance of regional industrial development policy variables support H1b.
To investigate which type of institutional investor supports the regional industrial development policy, we first wanted to understand the firm’s selection criteria and the industrial favorite for the four types of institutional investors within China. As shown by the results of Model (3) in Table 6, we found that firm-level characteristic parameters ROE (0.1363), SIZE (0.0257), RET (0.0113), and MSCI (0.0058) were all significantly positive, whereas industry policy parameters information (0.0298), agricultural (0.0212), and manufacturing (0.0176) were all significantly positive, indicating that the independent institutions chose firms with high ROE, SIZE, and RET values, or they like firms being collected into MSCI. Moreover, they prefer information, agricultural, and manufacturing industries. Using the same inference process, grey institutions selected firms with high ROE values and they preferred the agricultural and power industries. For domestic institutions, they chose firms with high values of ROE, SIZE, and RET, or they selected firms being collected into MSCI. Moreover, they preferred agricultural, information, and manufacturing industries. For the QFII institutions, they selected firms with high values of DY, ROE, and SIZE, and they preferred the manufacturing industry. The above results are almost consistent with the results of the PCC tests in Table 2, except for the industry favorite of domestic institutions. This finding is because those domestic institutions preferred the financial industry in the PCC test. In addition, from the above results we obtained the following conclusions for all of China. First, the ROE is the common firm selection condition for these four types of institutions when they select the firms for investment. Second, both independent and domestic institutions have the same firm selection criteria (ROE, SIZE, RET, and MSCI). Third, only QFII considers DY, whereas the other institutions do not. Finally, only grey institutions prefer the power industry among the four types of institutions, and QFII prefers manufacturing industry among the five major industries.
4.2. Which Type of Institutional Investor Supports the Regional Industrial Development Policy?
This subsection examines whether these four types of institutional investors have different industrial favorites under the regional industrial development policy in the four economic regions in China. We also explore the type of institutional investor that supports the regional industrial development policy. Hence, the above 2304 firms were divided into four categories according to the firm location, and then the four categories of firm data were used to estimate the panel regression model and the RVFM model [6]. The estimated results are listed in Table 7, Table 8, Table 9 and Table 10 for the eastern, central, western and north-eastern regions of China, respectively. This subsection only considers the significance of regional industrial development policy variables in Table 7, Table 8, Table 9 and Table 10 as we were only examining the type of institutional investor that supports the regional industrial development policy. However, directly examining the above issue by using the results listed in Table 7, Table 8, Table 9 and Table 10 was difficult. Thus, the results of Table 7, Table 8, Table 9 and Table 10 are summarized in Table 11.
For example, Table 7 lists the results of the four types of institutional investors’ industrial favorite in China’s eastern region. As shown in Model (3) of Table 7, the agricultural (0.0193), manufacturing (0.0194), and information (0.0282) parameters were all significantly positive, indicating that the independent institutional investors like to invest in the agricultural, manufacturing, and information industries. These results are respectively recorded as ‘+’ in the Eastern column, corresponding the rows of Agricultural, Manufacturing, and Information in Panel A of Table 11. Conversely, the power (−0.0307) and financial (−0.0260) parameters were significantly negative, indicating that the independent institutional investors do not like to invest in power or the financial industry. These results are recorded as ‘–’ in the eastern column corresponding to the rows of Power and Financial in Panel A of Table 11. With the same inference process, the results of Model (4) for grey institutional investors are all summarized in the eastern column in Panel B of Table 11, whereas those of Model (5) for domestic institutional investors are summarized in the eastern column in Panel C of Table 11. Finally, the results of Model (6) for qualified foreign institutional investors are summarized in the eastern column in Panel D of Table 11.
Table 8, Table 9 and Table 10 list the results of four types of institutional investors’ industrial favorites in the central, western, and north-eastern regions in China, respectively. Using the same inference process, the results for independent, grey, domestic, and qualified foreign institutional investors in Table 8, Table 9 and Table 10 are summarized for the central, western, and north-eastern regions, respectively, in Panels A, B, C, and D in Table 11.
For the four regions, we added up the total number of industries in which each of the four types of institutional investors likes to invest. For instance, as shown in Table 11, the independent institutional investors like to invest in the agricultural, manufacturing, and information industries in the eastern region. We also added up the total number of ‘+’ signs appearing in the eastern column in Panel A of Table 11. Hence, in the eastern region, the total number of industries in which the independent institutional investors like to invest was three. Then, the number three was recorded in the Support Level row and the Eastern column in panel A of Table 11. Using the same inference process, the total number of industries in which the grey and qualified foreign institutional investors like to invest are all equal to one, whereas this value was three for the domestic institutional investors in the eastern region. Hence, the numbers one, three, and one were recorded in the Support Level row and Eastern column in Panels B, C, and D, respectively. By repeating the above process, we completed all the summation work for the central, western, and north-eastern regions, and recorded the results in the Support Level row and central, western, and north-eastern columns in the four Panels in Table 11.
For the four types of institutional investors, we also summed the total number of regions in which each of five industries is liked by the specified institutional investors. For instance, as shown in Table 11, the agricultural industry is liked by independent investors in the eastern and western regions. We also summed the total number of the ‘+’ signs appearing in the Agriculture row in Panel A of Table 11. Hence, the total number of regions that like the agriculture industry based on independent investors was two. Then, the number two was recorded in the Sum column and Agriculture row in panel A of Table 11. Using the same inference process, the total number of regions that like the power or financial industry based on the independent investors was zero. Conversely, the total number of regions that like the manufacturing and information industries based on the independent investors were two and four. Hence, the numbers two, zero, four, and zero were respectively recorded into the Sum column and Manufacturing, Power, Information, and Financial rows in panel A of Table 11. By imitating the above process, we completed all the summation work for the grey, domestic, and qualified foreign institutional investors, and recorded the results in the Sum column and Agriculture, Manufacturing, Power, Information, and Financial rows in Panels B, C, and D in Table 11, respectively.
For the numbers in the Sum column in panel A, we found that independent institutions prefer the information industry (4), since they invest in this industry in four regions, and they invest in significantly more regions than the other industries. As shown in the numbers in the Support Level row in panel A, independent institutions focus on eastern (3) and western (3) regions, since they invest in three industries in the eastern and western regions. Independent institutions invest in significantly more industries than in the other regions. The above results indicate that independent institutions prefer the information industry and focus on the eastern and western regions. Using the same inference process, we obtained the following results. Grey institutions focus on the western region (4) and like every industry, since the total numbers of regions in which grey institutions invested were one, two, two, one, and one in the agricultural, manufacturing, power, information, and financial industries, respectively. These five numbers are almost the same. In other words, grey institutions uniformly distribute their capital in these five industries. Domestic institutions prefer the manufacturing (3) and information (3) industries, and appear to focus on every region since the total number of industries in which domestic institutions invested were three, two, three, and one in eastern, central, western, and north-eastern China, respectively. These four numbers are almost the same. QFIIs preferred the manufacturing industry (2), and appeared to focus on every region since the total number of industries in which QFIIs invested were one, one, one and zero in eastern, central, western, and north-eastern China, respectively; these four numbers are almost the same. Therefore, both domestic and QFII institutions uniformly distribute their capital in these four regions. Finally, the four numbers eight, seven, nine, and three in the Support Level row and Sum column in panels A−D. Domestic institutions (9) and QFIIs (3) deeply and slightly, respectively, engaged in industry development in China. From the above results, we conclude that these four types of institutional investors have different industry favorites in the four economic regions in China under the regional industrial development policies.
According to the Chinese regional industrial development policy described in Section 2.2, we summarize the industries that have been developed in the four regions in the Regional Industrial Development Policy row in Table 11. For instance, the agricultural (A), manufacturing (M), information (I), and financial (F) industries have been developed in the eastern region, so then “A, M, I, and F” are recorded in the eastern column and Regional Industrial Development Policy row in Table 11. Subsequently, for each institutional investor and for each region, we examined whether the industry the institution prefers is consistent with the industry the government develops. If the answer is yes then a + sign is marked in shaded font. Based on the above findings, we evaluated the support level for each institutional investor in each region. For example, the four agricultural, manufacturing, information, and financial industries are being developed by the Chinese government in the eastern region. Notably, independent institutions in the eastern region prefer three of these industries: agriculture, manufacturing, and information. Hence, the Support Level for independent institutions in the eastern region is 3/4, which is recorded in the bracket corresponding to the eastern column and Support Level row in Panel A of Table 11. Using the same inference process, the Support Level for independent institutions in central, western, and north-eastern regions are 1/2, 2/3, and 0/2, respectively. We also calculated the average support level for independent institutions as 23/48, which is recorded in the bracket corresponding to the Average column and Support Level row in Panel A of Table 11. As for the other three types of institutions, we also calculated the support level for each region and the average support level for all regions China. The Average Support Level for independent, grey, domestic, and qualified foreign institutions were 23/48, 27/48, 35/48, and 7/48, respectively (Table 11). Except for the average support level for qualified foreign institutions, the support levels for the other three types of institutions were almost greater than 50%. Hence, H2a and H3a are accepted because the average support levels were almost greater than 50%. Conversely, H2b is not accepted because of the average support level greater than 50%. In addition, H3b is not accepted because the average support level was less than 50%. From the above results, we obtained one conclusion. Except for the qualified foreign institutions, the other three types of institutions support the regional industrial development policy. Moreover, domestic institutions receive the greatest support level, followed by grey and independent institutions, whereas qualified foreign institutions receive the least support.
5. Conclusions
This study used annual data of firms held by institutional investors that are listed as China A-shares to run a panel regression model called the RVFM model [6]. We then explored the following three issues. First, whether the firm-level characteristics or regional industrial development policy affect the investment behavior of institutional investors. Second, we examined whether these four types of institutional investors have different industrial favorites in the four economic regions in China given the regional industrial development policy. Third, we analyzed which type of institutional investor supports the regional industrial development policy.
The empirical results show that, based on the basic statistical characteristics of the data, independent institutions and domestic institutions are the main types of institutional investors in China. Moreover, Chinese firms are attaining good corporate governance and are mainly controlled by the government. In addition, Chinese investors have a high trade frequency. China is focused on the manufacturing industry. Second, as reported from the Pearson’s correlation coefficient test results, most independent and grey institutions are domestic institutions. Moreover, firms with high SIZE values will be collected as MSCI members, whereas the INSIDER type of investors were more likely to invest in firms with high TURN values, and SOE firms have high DY values. Furthermore, regarding the firm-level characteristics for the five types of industry, the agricultural and financial industries have high TURN and SIZE values, respectively. Both the manufacturing and information industries attract the INSIDER type of investor, whereas the power industry attracts SOE. Third, both the firm-level characteristics and regional industrial development policy can affect the investment behavior of institutional investors. Within all of China, in terms of the firm-level characteristics selected by institutions, ROE was the most common factor selected by firms in four types of institutions, whereas DY was only considered by QFIIs. Notably, both independent and domestic institutions have the same firm selection criteria: ROE, SIZE, RET, and MSCI.
In terms of the industry favored by institutions for investment, only grey institutions preferred the power industry and only QFIIs preferred manufacturing industry. Fourth, these four types of institutional investors actually have different industry favorites depending on the economic regions in China under the regional industrial development policy. For example, independent institutions preferred the information industry and focused on eastern and western regions. Grey institutions appeared to like every industry with a focus on the western region. Domestic institutions preferred the manufacturing and information industries, with no particular focus on any region. QFIIs preferred the manufacturing industry, with no particular focus on any region. Regarding all of China, domestic institutions and QFIIs deeply and slightly engaged in industry development, respectively. Finally, domestic institutions received the greatest support level, followed by grey and independent institutions, whereas QFIIs received the least support. In other words, except for QFIIs, the other three types of institutions support the regional industrial development policy.
Therefore, institutional investors should consider the impact of this national policy under China’s unique economic development model when making investment decisions in order to outperform their counterparts in China’s prosperous market environment. However, the formulation of national policies requires the support of society in order to achieve sustainable development and produce good results. The results of this study demonstrate that independent institutional investors and QFIIs, as active owners, have lower support level for regional industrial development policies than domestic institutional investors and grey institutional investors. To improve corporate governance in industries that are in line with national development policies, the state must relax the supervision of these industries. Thus, independent institutional investors and QFIIs, which are active owners, can play the role of stewards in long-term investments in policy-supported industries and regions, enabling the sustainability of policies, and creating more value and social returns.
Author Contributions
The authors contributed equally to this work. Conceptualization, S.L.L. and J.L.; Data curation, J.L.; Formal analysis, S.L.L., J.L. and J.-B.S.; Investigation, J.L.; Methodology, J.L. and W.-P.C.; Project administration, S.L.L.; Resources, S.L.L.; Software, J.L.; Supervision, S.L.L.; Validation, J.L.; Visualization, J.L.; Writing-original draft, J.L.; Writing-review and editing, S.L.L., J.L. and J.-B.S.
Funding
This research received no external funding.
Conflicts of Interest
The authors declare no conflict of interest.
References
- Gillan, S.; Starks, L. Corporate governance, corporate ownership, and the role of institutional investors: A global perspective. J. Appl. Finance 2003, 13, 4–22. [Google Scholar] [CrossRef]
- Mehrani, S.; Moradi, M.; Eskandar, H. Institutional Ownership Type and Earnings Quality: Evidence from Iran. Emerg. Mark. Finance Trade 2017, 53, 54–73. [Google Scholar] [CrossRef]
- Mcnulty, T.; Nordberg, D. Ownership, activism and engagement: Institutional investors as active owners. Corp. Gov. Int. Rev. 2016, 24, 346–358. [Google Scholar] [CrossRef]
- Hernandez, M. Toward an understanding of the psychology of stewardship. Acad. Manag. Rev. 2012, 37, 172–193. [Google Scholar] [CrossRef]
- Lydenberg, S. Reason, rationality, and fiduciary duty. J. Bus. Ethics 2014, 119, 365–380. [Google Scholar] [CrossRef]
- Ferreira, M.A.; Matos, P. The colors of investors’ money: The role of institutional investors around the world. J. Financ. Econ. 2008, 88, 499–533. [Google Scholar] [CrossRef]
- Liu, N.; Bredin, D.; Wang, L.; Yi, Z. Domestic and foreign institutional investors’ behavior in China. Eur. J. Finance 2014, 20, 728–751. [Google Scholar] [CrossRef]
- Qualified Foreign Institutional Investors (QFIIs) with Investment Quotas Granted by State Administration of Foreign Exchange (SAFE). 2016. Available online: http://www.safe.gov.cn (accessed on 14 October 2016).
- China Standard Industrial Classification Codes (GB/T 4754-2011) 2012 Revised, National Bureau of Statistics of the People’s Republic of China. Available online: http://www.stats.gov.cn (accessed on 23 August 2017).
- Aggarwal, R.; Hu, M.; Yang, J. Fraud, market reaction, and the role of institutional investors in Chinese listed firms. J. Portf. Manag. 2015, 41, 92–109. [Google Scholar] [CrossRef]
- Sullivan, R.; Martindale, W.; Robins, N.; Winch, H. Policy Frameworks for Long-Term Responsible Investment: The Case for Investor Engagement Checklist Investor. Princ. Responsible Invest. 2014, pp. 5–6. Available online: https://www.unpri.org/download?ac=1420 (accessed on 2 August 2018).
- Clarke, D.C. Corporate Governance in China: An Overview. China Econ. Rev. 2003, 14, 494–507. [Google Scholar] [CrossRef]
- Naughton, B. Transitions and Growth; Massachusetts Institute of Technology Press: Cambridge, MA, USA, 2007; p. 528, ISBN 13: 978-0262640640. [Google Scholar]
- Gompers, P.A.; Metrick, A. Institutional investors and equity prices. Q. J. Econ. 2001, 116, 229–259. [Google Scholar] [CrossRef]
- Dahlquist, M.; Robertsson, G. Direct foreign ownership, institutional investors, and firm characteristics. J. Financ. Econ. 2001, 59, 413–440. [Google Scholar] [CrossRef]
- Kang, J.K.; Stulz, R.M. Why is there a home bias? An analysis of foreign portfolio equity ownership in Japan. J. Financ. Econ. 1997, 46, 3–28. [Google Scholar] [CrossRef] [Green Version]
- Kenderdine, T. China’s Industrial Policy, Strategic Emerging Industries and Space Law. Asia Pac. Policy Stud. 2017, 4, 325–342. [Google Scholar] [CrossRef]
- Renneboog, L.; Ter Horst, J.; Zhang, C. Socially responsible investments: Institutional aspects, performance, and investor behavior. J. Bank. Finance 2008, 32, 1723–1742. [Google Scholar] [CrossRef]
- Przychodzen, J.; Gómez-Bezares, F.; Przychodzen, W.; Larreina, M. ESG Issues among Fund Managers—Factors and Motives. Sustainability 2016, 8, 1078. [Google Scholar] [CrossRef]
- Miralles-Quirós, M.M.; Miralles-Quirós, J.L.; Valente Gonçalves, L.M. The Value Relevance of Environmental, Social, and Governance Performance: The Brazilian Case. Sustainability 2018, 10, 574. [Google Scholar] [CrossRef]
- Falkenstein, E.G. Preferences for stock characteristics as revealed by mutual fund portfolio holdings. J. Finance 1996, 51, 111–135. [Google Scholar] [CrossRef]
- Miyajima, H.; Hoda, T. Ownership Structure and Corporate Governance: Has an Increase in Institutional Investorsf Ownership Improved Business Performance? Public Policy Rev. 2015, 11, 361–394. [Google Scholar]
- Brickley, J.A.; Lease, R.C.; Smith, C.W., Jr. Ownership structure and voting on antitakeover amendments. J. Financ. Econ. 1988, 20, 267–291. [Google Scholar] [CrossRef]
- Bushee, B.J. The influence of institutional investors on myopic R&D investment behavior. Account. Rev. 1998, 73, 305–333. [Google Scholar]
- Parrino, R.; Sias, R.W.; Starks, L.T. Voting with their feet: Institutional ownership changes around forced CEO turnover. J. Financ. Econ. 2003, 68, 3–46. [Google Scholar] [CrossRef]
- Almazan, A.; Hartzell, J.C.; Starks, L.T. Active institutional shareholders and costs of monitoring: Evidence from executive compensation. Financ. Manag. 2005, 34, 5–34. [Google Scholar] [CrossRef]
- Park, J.; Chung, C.Y. CEO Overconfidence, Leadership Ethics, and Institutional Investors. Sustainability 2017, 9, 14. [Google Scholar] [CrossRef]
- Bohl, M.T.; Brzeszczyński, J. Do institutional investors destabilize stock prices? Evidence from an emerging market. J. Int. Financ. Mark. Inst. Money 2006, 16, 370–383. [Google Scholar] [CrossRef]
- Rubin, A.; Smith, D.R. Institutional ownership, volatility and dividends. J. Bank. Finance 2009, 33, 627–639. [Google Scholar] [CrossRef]
- Chen, Z.; Du, J.; Li, D.; Ouyang, R. Does foreign institutional ownership increase return volatility? Evidence from China. J. Bank. Finance 2013, 37, 660–669. [Google Scholar] [CrossRef]
- Ferguson, M.J.; McGuinness, P.B. Chinese securities reform: The role of QFIIs in the corporate governance process. Bus. Horiz. 2004, 47, 53–61. [Google Scholar] [CrossRef]
- Aggarwal, R.; Erel, I.; Ferreira, M.; Matos, P. Does governance travel around the world? Evidence from institutional investors. J. Financ. Econ. 2011, 100, 154–181. [Google Scholar] [CrossRef] [Green Version]
- Bricker, R.; Markarian, G. Institutional investors and insider trading profitability. Eur. Account. Rev. 2015, 24, 495–518. [Google Scholar] [CrossRef]
- Stock, J.H.; Wright, J.H.; Yogo, M. A Survey of Weak Instruments and Weak Identification in Generalized Method of Moments. J. Bus. Econ. Stat. 2002, 20, 518–529. [Google Scholar] [CrossRef] [Green Version]
- Stock, J.H.; Watson, M.W. Introduction to Econometrics, 3rd ed.; Pearson Education: Boston, MA, USA, 2011; pp. 420–467. ISBN 0-13-800900-7. [Google Scholar]
- Anderson, T.W.; Hsiao, C. Formulation and estimation of dynamic models using panel data. J. Econom. 1982, 18, 47–82. [Google Scholar] [CrossRef]
- Arellano, M.; Bond, S. Some tests of specification for panel data: Monte Carlo evidence and an application to employment equations. Rev. Econ. Stud. 1991, 58, 277–297. [Google Scholar] [CrossRef]
- Kangasharju, A. Regional variations in firm formation: Panel and cross-section data evidence from Finland. Reg. Sci. 2000, 79, 355–373. [Google Scholar] [CrossRef]
- Chow, G.C. Tests of Equality between Sets of Coefficients in Two Linear Regressions. Econometrica 1960, 28, 591–605. [Google Scholar] [CrossRef]
- Ni, Y.; Liao, Y.; Huang, P. Foreign Institutional Investors, Shareholding Change, and Corporate Governance. Emerg. Mark. Finance Trade 2017, 53, 764–775. [Google Scholar] [CrossRef]
- DelGuercio, D. The distorting effect of the prudent-man laws on institutional equity investments. J. Financ. Econ. 1996, 40, 31–62. [Google Scholar] [CrossRef]
- Chao, M.F.; Chen, S.Y. A study of factors influencing foreign share holdings in the Taiwan semiconductor industry. Emerg. Mark. Finance Trade 2012, 48, 153–170. [Google Scholar] [CrossRef]
Figure 1.
Geographical breakdown of the four economic regions in China.

Figure 2.
The market capitalization and growth rate of all institutions in China.


Table 1.
Descriptive statistics of all variables for all firms held by institutional investors that are listed as China A-shares between 2004 and 2016.
Table 1.
Descriptive statistics of all variables for all firms held by institutional investors that are listed as China A-shares between 2004 and 2016.
| Symbol | No. of Observations | Minimum | Maximum | Mean | SD | |
|---|---|---|---|---|---|---|
| Panel A. Institutional Ownership Variables | ||||||
| Total_IO | All institutions | 11,790 | 0.000 | 0.956 | 0.118 | 0.110 |
| Indep_IO | Independent institutions | 11,790 | 0.000 | 0.948 | 0.089 | 0.086 |
| Hedge fund managers | 11,790 | 0.000 | 0.063 | 0.000 | 0.003 | |
| Investment managers | 11,790 | 0.000 | 0.948 | 0.077 | 0.081 | |
| Sovereign wealth funds | 11,790 | 0.000 | 0.110 | 0.008 | 0.011 | |
| VC/PE Firms | 11,790 | 0.000 | 0.158 | 0.004 | 0.012 | |
| Grey_IO | Grey institutions | 11,790 | 0.000 | 0.759 | 0.029 | 0.067 |
| Banks | 11,790 | 0.000 | 0.596 | 0.003 | 0.013 | |
| Charitable foundation | 11,790 | 0.000 | 0.145 | 0.000 | 0.002 | |
| Corporate pension | 11,790 | 0.000 | 0.064 | 0.000 | 0.001 | |
| Educational/cultural endowments | 11,790 | 0.000 | 0.584 | 0.002 | 0.030 | |
| Family offices/Trusts | 11,790 | 0.000 | 0.072 | 0.000 | 0.001 | |
| Government pension | 11,790 | 0.000 | 0.029 | 0.000 | 0.002 | |
| Insurance companies | 11,790 | 0.000 | 0.300 | 0.002 | 0.010 | |
| Real estate investment trust (REIT) | 11,790 | 0.000 | 0.533 | 0.001 | 0.014 | |
| Unclassified | 11,790 | 0.000 | 0.759 | 0.021 | 0.057 | |
| Union pension sponsors | 11,790 | 0.000 | 0.009 | 0.000 | 0.000 | |
| Domes_IO | Domestic institutions | 11,790 | 0.000 | 0.956 | 0.117 | 0.109 |
| QFII_IO | Qualified foreign institutions | 11,790 | 0.000 | 0.170 | 0.001 | 0.006 |
| Panel B. Firm-Level Variables | ||||||
| SIZE | Market capitalization (log) | 11,790 | 19.647 | 28.510 | 22.580 | 1.017 |
| RET | Stock return | 11,790 | −0.869 | 11.947 | 0.296 | 0.795 |
| TURN | Turnover | 11,790 | 0.003 | 42.562 | 5.904 | 4.139 |
| DY | Dividend yield | 11,790 | 0.000 | 0.244 | 0.009 | 0.012 |
| ROE | Return on equity | 11,790 | −1.525 | 1.711 | 0.098 | 0.093 |
| MSCI | Morgan Stanley Capital International (MSCI) dummy | 11,790 | 0.000 | 1.000 | 0.344 | 0.475 |
| INSIDER | Insiders Owned | 11,790 | 0.000 | 2.625 | 0.168 | 0.227 |
| SOE | State-owned-enterprise dummy | 11,790 | 0.000 | 1.000 | 0.408 | 0.491 |
| Panel C. China’s Industrial Development Policy Variables | ||||||
| Region | Economic Region | 11,790 | 1.000 | 4.000 | 1.523 | 0.883 |
| Agricultural | Agriculture, forestry, husbandry, and fishing | 11,790 | 0.000 | 1.000 | 0.014 | 0.119 |
| Manufacturing | Manufacturing | 11,790 | 0.000 | 1.000 | 0.632 | 0.482 |
| Power | Production and supply of electricity, gas and water | 11,790 | 0.000 | 1.000 | 0.035 | 0.183 |
| Information | Information transmission, computer services and software | 11,790 | 0.000 | 1.000 | 0.058 | 0.235 |
| Financial | Banking | 11,790 | 0.000 | 1.000 | 0.012 | 0.109 |
Note: The above firms are distributed in the Shanghai Stock Exchange (SSE) and the Shenzhen Stock Exchange (SZSE), but exclude special treatment firms. Except for all the dummy variables, all the 0.000 values in the Minimum column do not represent that values are equal to zero, but denote that the corresponding vales are less than 0.0001.
Table 2.
Pearson’s correlation coefficient test for pair-wise variables.
| Total_IO | Indep_IO | Grey_IO | Domes_IO | QFII_IO | SIZE | RET | TURN | DY | ROE | MSCI | INSIDER | SOE | REGION | Agricultural | Manufacturing | Power | Information | Financial | |
|---|---|---|---|---|---|---|---|---|---|---|---|---|---|---|---|---|---|---|---|
| Total_IO | 1 | ||||||||||||||||||
| Indep_IO | 0.790 ** | 1 | |||||||||||||||||
| Grey_IO | 0.625 ** | 0.023 * | 1 | ||||||||||||||||
| Domes_IO | 0.998 ** | 0.787 ** | 0.626 ** | 1 | |||||||||||||||
| QFII_IO | 0.146 ** | 0.148 ** | 0.043 ** | 0.089 ** | 1 | ||||||||||||||
| SIZE | 0.223 ** | 0.288 ** | −0.007 | 0.220 ** | 0.081 ** | 1 | |||||||||||||
| RET | 0.036 ** | 0.056 ** | −0.011 | 0.035 ** | 0.025 ** | 0.079 ** | 1 | ||||||||||||
| TURN | −0.151 ** | −0.162 ** | −0.038 ** | −0.150 ** | −0.040 ** | −0.233 ** | 0.0343 ** | 1 | |||||||||||
| DY | 0.032 ** | 0.047 ** | −0.013 | 0.027 ** | 0.087 ** | 0.137 ** | −0.091 ** | −0.204 ** | 1 | ||||||||||
| ROE | 0.194 ** | 0.227 ** | 0.024 ** | 0.191 ** | 0.083 ** | 0.242 ** | −0.067 ** | −0.128 ** | 0.245 ** | 1 | |||||||||
| MSCI | 0.185 ** | 0.224 ** | 0.013 | 0.182 ** | 0.072 ** | 0.465 ** | 0.024 ** | −0.211 ** | 0.120 ** | 0.180 ** | 1 | ||||||||
| INSIDER | −0.121 ** | −0.082 ** | −0.092 ** | −0.119 ** | −0.042 ** | −0.114 ** | 0.012 | 0.206 ** | −0.134 ** | 0.026 ** | −0.176 ** | 1 | |||||||
| SOE | 0.028 ** | 0.037 ** | 0.002 | 0.027 ** | 0.022 * | 0.080 ** | −0.019 * | −0.133 ** | 0.114 ** | −0.055 ** | 0.068 ** | −0.529 ** | 1 | ||||||
| REGION | −0.002 | −0.004 | 0.004 | −0.001 | −0.019 * | −0.058 ** | −0.018 * | 0.017 | −0.041 ** | −0.055 ** | −0.061 ** | −0.114 ** | 0.176 ** | 1 | |||||
| Agricultural | 0.017 | −0.008 | 0.039 ** | 0.018 | −0.015 | −0.039 ** | −0.009 | 0.034 ** | −0.037 ** | −0.049 ** | −0.017 | −0.004 | −0.015 | 0.048 ** | 1 | ||||
| Manufacturing | 0.005 | 0.027 ** | −0.025 ** | 0.004 | 0.033 ** | −0.116 ** | −0.004 | 0.060 ** | −0.049 ** | −0.050 ** | −.060 ** | 0.159 ** | −0.228 ** | 0.003 | −0.158 ** | 1 | |||
| Power | −0.028 ** | −0.057 ** | 0.029 ** | −0.027 ** | −0.026 ** | 0.048 ** | −0.011 | −0.056 ** | 0.090 ** | 0.000 | 0.028 ** | −0.121 ** | 0.176 ** | 0.106 ** | −0.023 * | −0.249 ** | 1 | ||
| Information | 0.034 ** | 0.048 ** | −0.007 | 0.034 ** | −0.007 | 0.021 * | 0.041 ** | 0.078 ** | −0.086 ** | 0.018 | 0.032 ** | 0.162 ** | −0.096 ** | −0.046 ** | −0.030 ** | −0.326 ** | −0.047 ** | 1 | |
| Financial | 0.037 ** | 0.038 ** | 0.012 | 0.036 ** | 0.018 * | 0.260 ** | −0.012 | −0.059 ** | 0.078 ** | 0.060 ** | 0.144 ** | −0.074 ** | 0.041 ** | 0.007 | −0.013 | −0.144 ** | −0.021 * | −0.027 ** | 1 |
Note: **, * indicate significance at the 1% and 5% levels (2-tailed), respectively.
Table 3.
The empirical result of coefficient for alternative explanatory variables.
| □ | Whole | Eastern | Central | Western | Northeastern |
|---|---|---|---|---|---|
| SIZE | 2.45 × 10 −13 | –3.94 × 10 −12 | 2.36 × 10 −13 | 8.58 × 10 −14 | 3.68 × 10 −13 |
| (0.288) | (0.301) | (0.284) | (0.322) | (0.247) | |
| [1.000] | [1.000] | [1.000] | [1.000] | [1.000] | |
| RET | 2.51 × 10 −14 | –6.71 × 10 −14 | 6.23 × 10 −15 | 1.81 × 10 −14 | –7.63 × 10 −15 |
| (0.155) | (0.159) | (0.214) | (0.127) | (0.243) | |
| [1.000] | [1.000] | [1.000] | [1.000] | [1.000] | |
| TURN | 5.40 × 10 −13 | –6.71 × 10 −13 | 8.91 × 10 −14 | 3.73 × 10 −13 | 2.44 × 10 −13 |
| (0.906) | (1.041) | (0.832) | (1.014) | (1.068) | |
| [1.000] | [1.000] | [1.000] | [1.000] | [1.000] | |
| DY | 5.97 × 10 −17 | –1.51 × 10 −15 | 2.95 × 10 −16 | 6.93 × 10 −16 | 9.02 × 10 −17 |
| (0.001) | (0.001) | (0.002) | (0.002) | (0.003) | |
| [1.000] | [1.000] | [1.000] | [1.000] | [1.000] | |
| ROE | 8.14 × 10 -15 | –1.38 × 10 −14 | 3.36 × 10 −15 | 2.21 × 10 −15 | 5.52 × 10 −16 |
| (0.026) | (0.031) | (0.022) | (0.061) | (0.047) | |
| [1.000] | [1.000] | [1.000] | [1.000] | [1.000] | |
| MSCI | –1.77 × 10 −13 | –1.51 × 10 −14 | –1.96 × 10 −15 | –2.39 × 10 −15 | –1.02 × 10 −14 |
| (0.103) | (0.115) | (0.135) | (0.089) | (0.097) | |
| [1.000] | [1.000] | [1.000] | [1.000] | [1.000] | |
| INSIDER | 1.73 × 10 −15 | –3.21 × 10 −14 | 5.94 × 10 −15 | 3.50 × 10 −15 | 2.61 × 10 −15 |
| (0.016) | (0.024) | (0.036) | (0.028) | (0.042) | |
| [1.000] | [1.000] | [1.000] | [1.000] | [1.000] | |
| SOE | 1.34 × 10 −14 | –1.74 × 10 −13 | 1.82 × 10 −14 | 1.67 × 10 −14 | 9.46 × 10 −15 |
| (0.032) | (0.044) | (0.077) | (0.084) | (0.135) | |
| [1.000] | [1.000] | [1.000] | [1.000] | [1.000] | |
| Agricultural | –5.30 × 10 −15 | –6.14 × 10 −15 | 4.01 × 10 −16 | 1.35 × 10 −15 | –1.80 × 10 −16 |
| (0.010) | (0.010) | (0.033) | (0.022) | (0.049) | |
| [1.000] | [1.000] | [1.000] | [1.000] | [1.000] | |
| Manufacturing | 2.20 × 10 −13 | –2.75 × 10 −13 | –2.75 × 10 −14 | 8.13 × 10 −14 | 2.35 × 10 −14 |
| (0.042) | (0.050) | (0.101) | (0.077) | (0.120) | |
| [1.000] | [1.000] | [1.000] | [1.000] | [1.000] | |
| Power | –8.80 × 10 −15 | 9.85 × 10 −16 | 9.23 × 10 −15 | 1.24 × 10 −15 | 9.68 × 10 −16 |
| (0.009) | (0.011) | (0.042) | (0.026) | (0.051) | |
| [1.000] | [1.000] | [1.000] | [1.000] | [1.000] | |
| Information | –1.60 × 10 −14 | –3.66 × 10 −15 | 1.21 × 10 −15 | 5.31 × 10 −15 | –1.72 × 10 −15 |
| (0.030) | (0.031) | (0.048) | (0.037) | (0.060) | |
| [1.000] | [1.000] | [1.000] | [1.000] | [1.000] | |
| Financial | –4.03 × 10 −15 | –2.59 × 10 −15 | 5.50 × 10 −16 | 6.08 × 10 −16 | 3.75 × 10 −16 |
| (0.008) | (0.008) | (0.011) | (0.038) | (0.036) | |
| [1.000] | [1.000] | [1.000] | [1.000] | [1.000] |
Note: The numbers in the parentheses ( ) denote the standard errors, and the numbers in the square brackets [ ] are the p-value.
Table 4.
The empirical result of two-stage least squares model with one endogenous variable and one instrumental variable.
Table 4.
The empirical result of two-stage least squares model with one endogenous variable and one instrumental variable.
| Model (2) | SIZEt−1 | RETt−1 | TURNt−1 | DYt−1 | ROEt−1 | INSIDERt−1 | |
|---|---|---|---|---|---|---|---|
| C | −0.4045 *** | −0.4256 *** | −0.5065 *** | −0.3629 *** | −0.4895 *** | −0.3537 *** | −0.4302 *** |
| (−0.033) | (0.044) | (0.061) | (0.041) | (0.038) | (0.041) | (0.037) | |
| SIZE | 0.0231 *** | 0.0235 *** | 0.0274 *** | 0.0213 *** | 0.0268 *** | 0.0198 *** | 0.0236 *** |
| (−0.001) | (0.002) | (0.003) | (0.002) | (0.002) | (0.002) | (0.002) | |
| RET | 0.0125 *** | 0.0170 *** | −0.0119 | 0.0190 *** | 0.0146 *** | 0.0186 *** | 0.0168 *** |
| (−0.002) | (0.002) | (0.018) | (0.002) | (0.002) | (0.002) | (0.002) | |
| TURN | −0.0031 *** | −0.0025 *** | −0.0020 *** | −0.0049 *** | −0.0028 *** | −0.0023 *** | −0.0025 *** |
| (0.000) | (0.000) | (0.000) | (0.001) | (0.000) | (0.000) | (0.000) | |
| DY | −0.5728 *** | −0.5524 *** | −0.6603 *** | −0.6120 *** | −1.7684 *** | −0.7226 *** | −0.5491 *** |
| (−0.088) | (0.097) | (0.117) | (0.098) | (0.209) | (0.103) | (0.096) | |
| ROE | 0.1654 *** | 0.2047 *** | 0.1900 *** | 0.1991 *** | 0.2366 *** | 0.3245 *** | 0.2037 *** |
| (−0.011) | (0.013) | (0.016) | (0.013) | (0.014) | (0.029) | (0.013) | |
| MSCI | 0.0065 ** | 0.0066 * | 0.0051 | 0.0056 * | 0.0048 | 0.0062 * | 0.0067 * |
| (−0.002) | (0.003) | (0.003) | (0.003) | (0.003) | (0.003) | (0.003) | |
| INSIDER | −0.0547 *** | −0.0563 *** | −0.0528 *** | −0.0495 *** | −0.0602 *** | −0.0590 *** | −0.0503 *** |
| (−0.005) | (0.006) | (0.006) | (0.006) | (0.006) | (0.006) | (0.006) | |
| SOE | −0.0085 *** | −0.0087 *** | −0.0110 *** | −0.0090 *** | −0.0078 ** | −0.0063 * | −0.0076 ** |
| (−0.002) | (0.003) | (0.003) | (0.003) | (0.003) | (0.003) | (0.003) | |
| Region | 0.0021 | 0.0028 * | 0.0023 | 0.0030 * | 0.0021 | 0.0028 * | 0.0029 * |
| (−0.001) | (0.001) | (0.001) | (0.001) | (0.001) | (0.001) | (0.001) | |
| Agricultural | 0.0427 *** | 0.0533 *** | 0.0505 *** | 0.0554 *** | 0.0513 *** | 0.0568 *** | 0.0533 *** |
| (−0.008) | (0.009) | (0.009) | (0.009) | (0.009) | (0.009) | (0.009) | |
| Manufacturing | 0.0168 *** | 0.0186 *** | 0.0187 *** | 0.0191 *** | 0.0183 *** | 0.0200 *** | 0.0184 *** |
| (−0.002) | (0.003) | (0.003) | (0.003) | (0.003) | (0.003) | (0.003) | |
| Power | −0.0171 ** | −0.0141 * | −0.0153 * | −0.0151 * | −0.0091 | −0.0123 * | −0.0142 * |
| (−0.005) | (0.006) | (0.006) | (0.006) | (0.006) | (0.006) | (0.006) | |
| Information | 0.0318 *** | 0.0315 *** | 0.0339 *** | 0.0346 *** | 0.0273 *** | 0.0316 *** | 0.0308 *** |
| (−0.005) | (0.005) | (0.005) | (0.005) | (0.005) | (0.005) | (0.005) | |
| Financial | −0.0282 ** | −0.0281 ** | −0.0352 ** | −0.0249 * | −0.0264 * | −0.0230 * | −0.0282 ** |
| (−0.009) | (0.011) | (0.011) | (0.010) | (0.011) | (0.011) | (0.010) | |
| Year dummies | YES | YES | YES | YES | YES | YES | YES |
| Number of firms | 2304 | 2021 | 2021 | 2021 | 2021 | 2021 | 2021 |
| Number of observations | 11,790 | 9486 | 9486 | 9486 | 9486 | 9486 | 9486 |
| Instrumental variable Zi | 0.7627 *** | −0.0954 ** | 0.4206 *** | 0.4569 *** | 0.4448 *** | 0.9023 *** | |
| (0.057) | (0.030) | (0.027) | (0.058) | (0.048) | (0.019) | ||
| First stage F | 179.76 | 10.33 | 249.79 | 61.75 | 85.56 | 2311.26 | |
| R* | 0.126 | 0.138 | 0.123 | 0.133 | 0.124 | 0.131 | 0.138 |
Note: All the coefficient values of Model (2) in Table 4 are obtained from those of Model (2) in Table 6. First stage F denotes the first stage F-statistic, and its degree of freedom is (1, 9461) for all cases in this table. The selected Instrumental variable are the supposed endogenous variable with one lag period. The Instrumental variables Zi in this table are SIZEt−1, RETt−1, TURNt−1, DYt−1, ROEt−1, and INSIDERt−1. The superscripts ***, **, and * indicate the coefficient is significant at the 0.1%, 1%, and 5% levels, respectively.
Table 5.
Chow test of the panel regression model for alternative pair-wise regions.
| Pair-Wise Regions | Chow Test | |
|---|---|---|
| Eastern vs. central | 5.577 *** | F(14, 9741) |
| Eastern vs. western | 4.718 *** | F(14, 9634) |
| Eastern vs. northeastern | 3.469 *** | F(14, 8716) |
| Central vs. western | 5.304 *** | F(14, 3016) |
| Central vs. northeastern | 4.080 *** | F(14, 2098) |
| Western vs. northeastern | 3.265 *** | F(14, 1991) |
Note: The superscripts *** indicate the values of Chow test statistic are significant at the 0.1% levels, respectively. The Chow test statistic follows the F distribution with and degrees of freedom
Table 6.
Determinants of institutional investors’ investment behavior in China.
| Total_IO | Indep_IO | Grey_IO | Domes_IO | QFII_IO | ||
|---|---|---|---|---|---|---|
| Model (1) | Model (2) | Model (3) | Model (4) | Model (5) | Model (6) | |
| C | −0.3397 *** | −0.4045 *** | −0.5040 *** | 0.0978 *** | −0.3911 *** | −0.0133 *** |
| (0.032) | (0.033) | (0.025) | (0.021) | (0.033) | (0.002) | |
| SIZE | 0.0209 *** | 0.0231 *** | 0.0257 *** | −0.0026 ** | 0.0225 *** | 0.0006 *** |
| (0.001) | (0.001) | (0.001) | (0.001) | (0.001) | (0.000) | |
| RET | 0.0130 *** | 0.0125 *** | 0.0113 *** | 0.0013 | 0.0124 *** | 0.0001 |
| (0.002) | (0.002) | (0.001) | (0.001) | (0.002) | (0.000) | |
| TURN | −0.0029 *** | −0.0031 *** | −0.0026 *** | −0.0005 * | −0.0031 *** | 0.0000 |
| (0.000) | (0.000) | (0.000) | (0.000) | (0.000) | (0.000) | |
| DY | −0.6509 *** | −0.5728 *** | −0.4152 *** | −0.1868 *** | −0.5998 *** | 0.0269 *** |
| (0.088) | (0.088) | (0.067) | (0.057) | (0.087) | (0.005) | |
| ROE | 0.1642 *** | 0.1654 *** | 0.1363 *** | 0.0294 *** | 0.1623 *** | 0.0031 *** |
| (0.011) | (0.011) | (0.009) | (0.007) | (0.011) | (0.001) | |
| MSCI | 0.0081 *** | 0.0065 ** | 0.0058 ** | 0.0002 | 0.0065 ** | 0.0000 |
| (0.002) | (0.002) | (0.002) | (0.002) | (0.002) | (0.000) | |
| INSIDER | −0.0485 *** | −0.0547 *** | −0.0156 *** | −0.0383 *** | −0.0540 *** | −0.0007 ** |
| (0.005) | (0.005) | (0.004) | (0.003) | (0.005) | (0.000) | |
| SOE | −0.0121 *** | −0.0085 *** | 0.0008 | −0.0084 *** | −0.0085 *** | 0.0000 |
| (0.002) | (0.002) | (0.002) | (0.002) | (0.002) | (0.000) | |
| Region | 0.0021 | 0.0024 ** | −0.0003 | 0.0021 | −0.0001 | |
| (0.001) | (0.001) | (0.001) | (0.001) | (0.000) | ||
| Agricultural | 0.0427 *** | 0.0212 *** | 0.0215 *** | 0.0426 *** | 0.0001 | |
| (0.008) | (0.006) | (0.005) | (0.008) | (0.001) | ||
| Manufacturing | 0.0168 *** | 0.0176 *** | −0.0005 | 0.0161 *** | 0.0007 *** | |
| (0.002) | (0.002) | (0.002) | (0.002) | (0.000) | ||
| Power | −0.0171 ** | −0.0276 *** | 0.0106 ** | −0.0162 ** | −0.0009 ** | |
| (0.005) | (0.004) | (0.004) | (0.005) | (0.000) | ||
| Information | 0.0318 *** | 0.0298 *** | 0.0020 | 0.0313 *** | 0.0005 | |
| (0.005) | (0.003) | (0.003) | (0.004) | (0.000) | ||
| Financial | −0.0282 ** | −0.0369 *** | 0.0090 | −0.0276 ** | −0.0006 | |
| (0.009) | (0.007) | (0.006) | (0.009) | (0.001) | ||
| Year dummies | YES | YES | YES | YES | YES | YES |
| Number of firms | 2304 | 2304 | 2304 | 2304 | 2304 | 2304 |
| Number of observations | 11,790 | 11,790 | 11,790 | 11,790 | 11,790 | 11,790 |
| R* | 0.116 | 0.126 | 0.179 | 0.017 | 0.123 | 0.027 |
Note: This table presents the results of panel regression for alternative institutional ownerships. Total_IO, Indep_IO, Grey_IO, Domes_IO, and QFII_IO denote the total institutional ownership, independent institutional ownership, grey institutional ownership, domestic institutional ownership and qualified foreign institutional ownership, respectively. The superscripts ***, **, and * indicate the coefficient is significant at the 0.1%, 1%, and 5% levels, respectively. The value of standard errors corresponding to each coefficient is listed in the parentheses below that coefficient.
Table 7.
The institutional investors’ industrial investment behavior in the eastern region in China based on the results of panel regression for different institutional ownership for 2004 to 2016.
Table 7.
The institutional investors’ industrial investment behavior in the eastern region in China based on the results of panel regression for different institutional ownership for 2004 to 2016.
| Total_IO | Indep_IO | Grey_IO | Domes_IO | QFII_IO | ||
|---|---|---|---|---|---|---|
| Model (1) | Model (2) | Model (3) | Model (4) | Model (5) | Model (6) | |
| C | –0.3318 *** | –0.4082 *** | –0.5064 *** | 0.0948 *** | –0.3949 *** | –0.0133 *** |
| (0.036) | (0.039) | (0.029) | (0.025) | (0.038) | (0.002) | |
| SIZE | 0.0204 *** | 0.0232 *** | 0.0258 *** | –0.0024 * | 0.0226 *** | 0.0006 *** |
| (0.002) | (0.002) | (0.001) | (0.001) | (0.002) | (0.000) | |
| RET | 0.0131 *** | 0.0123 *** | 0.0128 *** | –0.0005 | 0.0123 *** | 0.0001 |
| (0.002) | (0.002) | (0.002) | (0.001) | (0.002) | (0.000) | |
| TURN | –0.0028 *** | –0.0029 *** | –0.0027 *** | –0.0002 | –0.0029 *** | 0.0000 |
| (0.000) | (0.000) | (0.000) | (0.000) | (0.000) | (0.000) | |
| DY | –0.6690 *** | –0.5535 *** | –0.4375 *** | –0.1582 * | –0.5829 *** | 0.0294 *** |
| (0.106) | (0.106) | (0.080) | (0.068) | (0.106) | (0.007) | |
| ROE | 0.1790 *** | 0.1781 *** | 0.1380 *** | 0.0389 *** | 0.1753 *** | 0.0029 *** |
| (0.013) | (0.013) | (0.010) | (0.008) | (0.013) | (0.001) | |
| MSCI | 0.0107 *** | 0.0094 ** | 0.0082 *** | 0.0007 | 0.0090 ** | 0.0003 |
| (0.003) | (0.003) | (0.002) | (0.002) | (0.003) | (0.000) | |
| INSIDER | –0.0463 *** | –0.0514 *** | –0.0079 | –0.0428 *** | –0.0510 *** | –0.0004 |
| (0.006) | (0.006) | (0.005) | (0.004) | (0.006) | (0.000) | |
| SOE | –0.0176 *** | –0.0119 *** | –0.0022 | –0.0091 *** | –0.0118 *** | –0.0001 |
| (0.003) | (0.003) | (0.002) | (0.002) | (0.003) | (0.000) | |
| Agricultural | 0.0712 *** | 0.0193 * | 0.0518 *** | 0.0707 *** | 0.0005 | |
| (0.011) | (0.009) | (0.007) | (0.011) | (0.001) | ||
| Manufacturing | 0.0172 *** | 0.0194 *** | –0.0022 | 0.0165 *** | 0.0007 *** | |
| (0.003) | (0.002) | (0.002) | (0.003) | (0.000) | ||
| Power | –0.0471 *** | –0.0307 *** | –0.0155 ** | –0.0456 *** | –0.0015 ** | |
| (0.008) | (0.006) | (0.005) | (0.008) | (0.001) | ||
| Information | 0.0265 *** | 0.0282 *** | –0.0020 | 0.0261 *** | 0.0003 | |
| (0.005) | (0.004) | (0.003) | (0.005) | (0.000) | ||
| Financial | –0.0272 * | –0.0260 ** | –0.0008 | –0.0267 * | –0.0005 | |
| (0.011) | (0.009) | (0.007) | (0.011) | (0.001) | ||
| Year dummies | YES | YES | YES | YES | YES | YES |
| Number of firms | 1601 | 1601 | 1601 | 1601 | 1601 | 1601 |
| Number of observations | 8194 | 8194 | 8194 | 8194 | 8194 | 8194 |
| R* | 0.126 | 0.140 | 0.195 | 0.028 | 0.137 | 0.030 |
Note: Total_IO, Indep_IO, Grey_IO, Domes_IO, and QFII_IO denote the total institutional ownership, independent institutional ownership, grey institutional ownership, domestic institutional ownership, and qualified foreign institutional ownership, respectively. The superscripts ***, **, and * indicate the coefficient is significant at the 0.1%, 1%, and 5% levels, respectively. The value of standard errors corresponding to each coefficient is listed in the parentheses below that coefficient.
Table 8.
Panel regression results for different institutional investors’ industrial investment behavior in central China for alternative institutional ownerships from 2004 to 2016.
Table 8.
Panel regression results for different institutional investors’ industrial investment behavior in central China for alternative institutional ownerships from 2004 to 2016.
| Total_IO | Indep_IO | Grey_IO | Domes_IO | QFII_IO | ||
|---|---|---|---|---|---|---|
| Model (1) | Model (2) | Model (3) | Model (4) | Model (5) | Model (6) | |
| C | −0.4155 *** | −0.4148 *** | −0.5849 *** | 0.1698 * | −0.3844 *** | −0.0304 *** |
| (0.103) | (0.103) | (0.074) | (0.075) | (0.103) | (0.006) | |
| SIZE | 0.0246 *** | 0.0250 *** | 0.0305 *** | −0.0056 | 0.0236 *** | 0.0014 *** |
| (0.005) | (0.005) | (0.003) | (0.003) | (0.005) | (0.000) | |
| RET | 0.0163 *** | 0.0162 *** | 0.0080 * | 0.0081 * | 0.0164 *** | −0.0002 |
| (0.005) | (0.005) | (0.003) | (0.003) | (0.005) | (0.000) | |
| TURN | −0.0034 *** | −0.0033 *** | −0.0028 *** | −0.0005 | −0.0032 *** | −0.0001 |
| (0.001) | (0.001) | (0.001) | (0.001) | (0.001) | (0.000) | |
| DY | −0.4636 * | −0.4985 * | −0.4032 ** | −0.0955 | −0.5317 ** | 0.0331 ** |
| (0.197) | (0.197) | (0.141) | (0.143) | (0.196) | (0.012) | |
| ROE | 0.2379 *** | 0.2309 *** | 0.1972 *** | 0.0327 | 0.2210 *** | 0.0099 *** |
| (0.036) | (0.036) | (0.026) | (0.026) | (0.036) | (0.002) | |
| MSCI | −0.0038 | −0.0062 | −0.0046 | −0.0016 | −0.0048 | −0.0014 ** |
| (0.007) | (0.007) | (0.005) | (0.005) | (0.007) | (0.000) | |
| INSIDER | −0.0666 *** | −0.0695 *** | −0.0383 *** | −0.0312 ** | −0.0668 *** | −0.0027 ** |
| (0.015) | (0.015) | (0.011) | (0.011) | (0.015) | (0.001) | |
| SOE | −0.0192 ** | −0.0234 *** | −0.0089 * | −0.0146 ** | −0.0227 *** | −0.0007 |
| (0.006) | (0.006) | (0.004) | (0.005) | (0.006) | (0.000) | |
| Agricultural | −0.0037 | 0.0206 | −0.0242* | −0.0041 | 0.0004 | |
| (0.017) | (0.012) | (0.012) | (0.017) | (0.001) | ||
| Manufacturing | −0.0087 | 0.0016 | −0.0103 ** | −0.0101 | 0.0014 *** | |
| (0.006) | (0.005) | (0.005) | (0.006) | (0.000) | ||
| Power | 0.0314 * | −0.0351 *** | 0.0666 *** | 0.0319 * | −0.0005 | |
| (0.013) | (0.009) | (0.009) | (0.013) | (0.001) | ||
| Information | 0.0384 * | 0.0279 * | 0.0107 | 0.0378 * | 0.0006 | |
| (0.018) | (0.013) | (0.013) | (0.018) | (0.001) | ||
| Financial | −0.0935 ** | −0.0803 *** | −0.0133 | −0.0939 ** | 0.0003 | |
| (0.034) | (0.024) | (0.025) | (0.034) | (0.002) | ||
| Year dummies | YES | YES | YES | YES | YES | YES |
| Number of firms | 302 | 302 | 302 | 302 | 302 | 302 |
| Number of observations | 1576 | 1576 | 1576 | 1576 | 1576 | 1576 |
| R* | 0.128 | 0.142 | 0.217 | 0.063 | 0.136 | 0.084 |
Note: Total_IO, Indep_IO, Grey_IO, Domes_IO, and QFII_IO denote the total institutional ownership, independent institutional ownership, grey institutional ownership, domestic institutional ownership and qualified foreign institutional ownership, respectively. The superscripts ***, **, and * indicate the coefficient is significant at the 0.1%, 1%, and 5% levels, respectively. The value of standard errors corresponding to each coefficient is listed in the parentheses below that coefficient.
Table 9.
Panel regression results for different institutional investors’ industrial investment behavior in western China for alternative institutional ownership from 2004 to 2016.
Table 9.
Panel regression results for different institutional investors’ industrial investment behavior in western China for alternative institutional ownership from 2004 to 2016.
| □ | Total_IO | Indep_IO | Grey_IO | Domes_IO | QFII_IO | |
|---|---|---|---|---|---|---|
| Model (1) | Model (2) | Model (3) | Model (4) | Model (5) | Model (6) | |
| C | −0.4692 *** | −0.4916 *** | −0.4310 *** | −0.0497 | −0.4843 *** | −0.0073 |
| (0.100) | (0.099) | (0.085) | (0.062) | (0.099) | (0.005) | |
| SIZE | 0.0272 *** | 0.0272 *** | 0.0226 *** | 0.0040 | 0.0268 *** | 0.0003 |
| (0.005) | (0.004) | (0.004) | (0.003) | (0.004) | (0.000) | |
| RET | 0.0114 * | 0.0107 | 0.0106 * | 0.0007 | 0.0104 | 0.0003 |
| (0.006) | (0.006) | (0.005) | (0.003) | (0.005) | (0.000) | |
| TURN | −0.0031 *** | −0.0031 *** | −0.0021 ** | −0.0011 * | −0.0031 *** | 0.0000 |
| (0.001) | (0.001) | (0.001) | (0.001) | (0.001) | (0.000) | |
| DY | −0.7503 * | −0.6923 * | −0.2572 | −0.4520 * | −0.6985 * | 0.0062 |
| (0.312) | (0.310) | (0.266) | (0.193) | (0.309) | (0.016) | |
| ROE | 0.0206 | 0.0291 | 0.0777 ** | −0.0392 * | 0.0279 | 0.0012 |
| (0.030) | (0.030) | (0.026) | (0.018) | (0.030) | (0.002) | |
| MSCI | 0.0051 | 0.0030 | 0.0000 | 0.0012 | 0.0034 | −0.0004 |
| (0.007) | (0.007) | (0.006) | (0.005) | (0.007) | (0.000) | |
| INSIDER | −0.0554 *** | −0.0686 *** | −0.0407 ** | −0.0287 ** | −0.0686 *** | 0.0000 |
| (0.016) | (0.016) | (0.014) | (0.010) | (0.016) | (0.001) | |
| SOE | 0.0012 | 0.0038 | 0.0183 ** | −0.0120 ** | 0.0033 | 0.0005 |
| (0.007) | (0.007) | (0.006) | (0.004) | (0.007) | (0.000) | |
| Agricultural | 0.0636 ** | 0.0391 * | 0.0250 | 0.0639 ** | −0.0003 | |
| (0.021) | (0.018) | (0.013) | (0.021) | (0.001) | ||
| Manufacturing | 0.0280 *** | 0.0212 *** | 0.0090 * | 0.0274 *** | 0.0006 | |
| (0.007) | (0.006) | (0.004) | (0.007) | (0.000) | ||
| Power | −0.0003 | −0.0266 ** | 0.0256 *** | 0.0002 | −0.0005 | |
| (0.011) | (0.010) | (0.007) | (0.011) | (0.001) | ||
| Information | 0.0783 *** | 0.0441 *** | 0.0350 *** | 0.0762 *** | 0.0021 ** | |
| (0.014) | (0.012) | (0.009) | (0.014) | (0.001) | ||
| Financial | 0.0011 | −0.0498 ** | 0.0523 *** | 0.0015 | −0.0003 | |
| (0.022) | (0.019) | (0.014) | (0.022) | (0.001) | ||
| Year dummies | YES | YES | YES | YES | YES | YES |
| Number of firms | 293 | 293 | 293 | 293 | 293 | 293 |
| Number of observations | 1469 | 1469 | 1469 | 1469 | 1469 | 1469 |
| R* | 0.098 | 0.125 | 0.130 | 0.049 | 0.123 | 0.038 |
Note: Total_IO, Indep_IO, Grey_IO, Domes_IO, and QFII_IO denote the total institutional ownership, independent institutional ownership, grey institutional ownership, domestic institutional ownership and qualified foreign institutional ownership, respectively. The superscripts ***, **, and * indicate the coefficient is significant at the 0.1%, 1%, and 5% levels, respectively. The value of standard errors corresponding each coefficient is listed in the parentheses below that coefficient.
Table 10.
The institutional investors’ industrial investment behavior in the north-eastern region of China.
Table 10.
The institutional investors’ industrial investment behavior in the north-eastern region of China.
| Total_IO | Indep_IO | Grey_IO | Domes_IO | QFII_IO | ||
|---|---|---|---|---|---|---|
| Model (1) | Model (2) | Model (3) | Model (4) | Model (5) | Model (6) | |
| C | −0.3236 | −0.3419 | −0.3358 * | −0.0160 | −0.3455 | 0.0036 |
| (0.190) | (0.188) | (0.132) | (0.120) | (0.187) | (0.008) | |
| SIZE | 0.0187 * | 0.0181 * | 0.0177 ** | 0.0008 | 0.0182 * | −0.0001 |
| (0.009) | (0.009) | (0.006) | (0.005) | (0.009) | (0.000) | |
| RET | 0.0088 | 0.0089 | 0.0027 | 0.0067 | 0.0092 | −0.0003 |
| (0.010) | (0.010) | (0.007) | (0.006) | (0.010) | (0.000) | |
| TURN | −0.0028 * | −0.0035 * | −0.0012 | −0.0026 ** | −0.0035 ** | 0.0001 |
| (0.001) | (0.001) | (0.001) | (0.001) | (0.001) | (0.000) | |
| DY | −0.7722 | −0.8042 | −0.4333 | −0.3122 | −0.7830 | −0.0212 |
| (0.431) | (0.423) | (0.298) | (0.269) | (0.420) | (0.018) | |
| ROE | 0.3085 *** | 0.3493 *** | 0.2159 *** | 0.1330 *** | 0.3464 *** | 0.0030 |
| (0.057) | (0.057) | (0.040) | (0.036) | (0.056) | (0.002) | |
| MSCI | 0.0066 | 0.0069 | 0.0240 * | −0.0166 | 0.0060 | 0.0009 |
| (0.014) | (0.014) | (0.010) | (0.009) | (0.014) | (0.001) | |
| INSIDER | −0.0291 | −0.0447 | −0.0343 | −0.0002 | −0.0440 | −0.0007 |
| (0.028) | (0.028) | (0.020) | (0.018) | (0.028) | (0.001) | |
| SOE | 0.0276 * | 0.0381 *** | 0.0080 | 0.0328 *** | 0.0371 *** | 0.0010 * |
| (0.011) | (0.011) | (0.008) | (0.007) | (0.011) | (0.000) | |
| Agricultural | −0.0043 | −0.0122 | 0.0080 | −0.0036 | −0.0007 | |
| (0.026) | (0.019) | (0.017) | (0.026) | (0.001) | ||
| Manufacturing | 0.0474 *** | 0.0139 | 0.0325 *** | 0.0483 *** | −0.0009 | |
| (0.011) | (0.008) | (0.007) | (0.011) | (0.000) | ||
| Power | −0.0205 | −0.0288 * | 0.0086 | −0.0188 | −0.0017 | |
| (0.021) | (0.015) | (0.013) | (0.021) | (0.001) | ||
| Information | 0.0326 | 0.0342 * | −0.0017 | 0.0335 | −0.0008 | |
| (0.022) | (0.015) | (0.014) | (0.021) | (0.001) | ||
| Financial | −0.0726 | −0.0660 * | −0.0079 | −0.0704 | −0.0022 | |
| (0.041) | (0.029) | (0.026) | (0.041) | (0.002) | ||
| Year dummies | YES | YES | YES | YES | YES | YES |
| Number of firms | 108 | 108 | 108 | 108 | 108 | 108 |
| Number of observations | 551 | 551 | 551 | 551 | 551 | 551 |
| R* | 0.160 | 0.210 | 0.243 | 0.120 | 0.210 | 0.068 |
Note: Total_IO, Indep_IO, Grey_IO, Domes_IO, and QFII_IO denote the total institutional ownership, independent institutional ownership, grey institutional ownership, domestic institutional ownership and qualified foreign institutional ownership, respectively. The superscripts ***, **, and * indicate the coefficient is significant at the 0.1%, 1%, and 5% levels, respectively. The value of standard errors corresponding each coefficient is listed in the parentheses below that coefficient.
Table 11.
Summary of institutional investors’ industrial investment behavior by region.
| Eastern | Central | Western | North-Eastern | Sum (Average) | |
|---|---|---|---|---|---|
| Panel A. Independent Institutional Ownership | |||||
| Agricultural | + | × | + | × | 2 |
| Manufacturing | + | × | + | × | 2 |
| Power | − | − | − | − | 0 |
| Information | + | + | + | + | 4 |
| Financial | − | − | − | − | 0 |
| Support Level | 3 (3/4) | 1 (1/2) | 3 (2/3) | 1 (0/2) | 8 (23/48) |
| Panel B. Grey Institutional Ownership | |||||
| Agricultural | + | − | × | × | 1 |
| Manufacturing | × | − | + | + | 2 |
| Power | − | + | + | × | 2 |
| Information | × | × | + | × | 1 |
| Financial | × | × | + | × | 1 |
| Support Level | 1 (1/4) | 1 (1/2) | 4 (3/3) | 1 (1/2) | 7 (27/48) |
| Panel C. Domestic Institutional Ownership | |||||
| Agricultural | + | × | + | × | 2 |
| Manufacturing | + | × | + | + | 3 |
| Power | − | + | × | × | 1 |
| Information | + | + | + | × | 3 |
| Financial | − | − | × | × | 0 |
| Support Level | 3 (3/4) | 2 (2/2) | 3 (2/3) | 1 (1/2) | 9 (35/48) |
| Panel D. Qualified Foreign Institutional Ownership | |||||
| Agricultural | × | × | × | × | 0 |
| Manufacturing | + | + | × | × | 2 |
| Power | − | × | × | × | 0 |
| Information | × | × | + | × | 1 |
| Financial | × | × | × | × | 0 |
| Support Level | 1 (1/4) | 1 (0/2) | 1 (1/3) | 0 (0/2) | 3 (7/48) |
| Regional industry development policy | A, M, I, F | P, I | M, P, I | A, M | |
Note: 1. This table presents the summary results of the preferences for four types of institutional investors at eastern, central, western and north-eastern regions in China. 2. The above results are summarized from those in Table 7, Table 8, Table 9 and Table 10. 3. The symbol + (respectively −) denotes that the specific industry is (respectively is not) preferred significantly by the specific institutional ownership. Conversely, the symbol × represents the fact that we cannot determine whether the specific industry is or is not preferred by the specific institutional ownership. 4. The number in the row ‘support level’ and a specific region column for a specific institution panel denotes the totaling number of industries the above specific institution prefers in that region. 5. The number in the column ‘Sum’ and a specific industry row for a specific institution panel denotes the totaling number of regions in which the above specific institution prefers that industry. 6. The shade font denotes the specific industry is preferred significantly by the specific institutional ownership, and this industry is consistent with the industries the government develop in that region. 7. A, M, P, I, and F at the row ‘Regional industry development policy’ denote the Agricultural, Manufacturing, Power, Information, Financial industries, respectively. 8. The numbers in the bracket at the row ‘Support Level’ and a specific region column at the specific panel denote the support level in a region for the above specific institution. The support level denotes the participation degree of a specific institutional ownership for China’s regional industrial development policy, and is obtained by the total number of industries that the specific institutional ownership prefer, and are consistent with the industry the government develops divided by the total number of industries that are developed by China’s government in that region. 9. The bold font in row Support Level (respectively column Sum) denotes the greater number at that row (respectively column).
© 2018 by the authors. Licensee MDPI, Basel, Switzerland. This article is an open access article distributed under the terms and conditions of the Creative Commons Attribution (CC BY) license (http://creativecommons.org/licenses/by/4.0/).
Share and Cite
MDPI and ACS Style
Lin, S.L.; Lu, J.; Su, J.-B.; Chen, W.-P. Sustainable Returns: The Effect of Regional Industrial Development Policy on Institutional Investors’ Behavior in China. Sustainability 2018, 10, 2769. https://doi.org/10.3390/su10082769
AMA Style
Lin SL, Lu J, Su J-B, Chen W-P. Sustainable Returns: The Effect of Regional Industrial Development Policy on Institutional Investors’ Behavior in China. Sustainability. 2018; 10(8):2769. https://doi.org/10.3390/su10082769
Chicago/Turabian StyleLin, Shu Ling, Jun Lu, Jung-Bin Su, and Wei-Peng Chen. 2018. "Sustainable Returns: The Effect of Regional Industrial Development Policy on Institutional Investors’ Behavior in China" Sustainability 10, no. 8: 2769. https://doi.org/10.3390/su10082769
Note that from the first issue of 2016, this journal uses article numbers instead of page numbers. See further details here.