Pathways for Sustainable Supply Chain Performance—Evidence from a Developing Country, Malaysia


1
Graduate School of Business, Universiti Sains Malaysia , Penang 11800, Malaysia
2
School of Management, Universiti Sains Malaysia, USM, Penang 11800, Malaysia
*
Author to whom correspondence should be addressed.
Sustainability 2018, 10(8), 2781; https://doi.org/10.3390/su10082781
Submission received: 28 May 2018
/
Revised: 26 July 2018
/
Accepted: 26 July 2018
/
Published: 6 August 2018
(This article belongs to the Section Economic and Business Aspects of Sustainability)
Abstract
:Malaysia has recently started to adopt sustainable business best practices to benefit companies, environment and stakeholders. Therefore, this study demonstrates pathways to sustainable supply chain triple bottom line performance derived from linkages of institutional pressures (IP) and organizational identity (OI) to environment and social sustainable practices. It shows that the superordinate goal of sustainable supply chain management is met in spite of unyielding external pressures and desirable OI driving the unequivocal environmental and responsible social practices of firms. A survey approach was adopted to gather the data required for this study. A total of 118 completed questionnaires were received from respondents, who were managers and senior executives in supply chain management (SCM) in Malaysia. The data were analyzed using structural equation modeling with partial least squares (PLS-SEM) version 3.0. Our findings showed that all hypothesized relationships are significant except both process- and market-based social practices could not directly impact economic performance. This is in sharp contrast to environmental practices. However, the significant linkage between social practices and social performance is a pathway for the former to economic performance. Therefore, the economic benefits derived from social practices are salvaged through its performance outcomes. The novel and useful impact of institutional pressures on sustainable supply chain practices are also unearthed.
1. Introduction
Companies profiting from sustainability are likely to be leaders in both external and internal sustainability [1]. This research set out to identify drivers of sustainable triple bottom lines (TBL) of supply chains. It investigates whether institutional pressures, OI, environmental and social sustainable supply chain practices could sustain the TBL of firms. Could these internal and external factors help or hinder a sustainable supply chain? These issues are addressed in this article.
As far back as 1997, Waddock and Graves [2] found empirical linkages between financial and social performance. They suggested only slack resources could support sustainability initiatives as strategic managers struggle to allocate scare resources caused by environmental pressures. This research extends the study of external pressures to include institutional pressures, internal desire of OI, and sustainable environmental and social practices to ascertain if they could collectively create pathways to sustainable TBL. Nidumolu, Prahalad and Rangaswami (2009) [3] cited suppliers could not compete with rival companies as green initiatives and transparency measures would bite into profits. They explained that these supply chain initiatives and measures necessitate new equipment and processes and would erode competitiveness, relegating sustainability to a secondary role in corporate social responsibility instead of being made a component of integrated business objectives. Against this dismal backdrop, they found that smart companies treat sustainability as innovation’s new frontier. This position is strengthened by Zhu, Geng, Fujita and Hashimoto [4], who consider environmentally inclined supply chain management as innovative.
Rao and Holt [5] went further to claim that inclusive environmental measures would lead to competitiveness and economic performance. Burke and Logsdon [6] found that social responsibility programs of centrality, specificity, proactivity, voluntarism and visibility could create strategic benefits for firms, an organization’s stakeholders and society at large. Aggregating these claims, a sustainable supply chain should be the goal and would necessitate collaboration with chain partners [7]. Connecting competitiveness and economic performance to an all-inclusive TBL would be the superordinate goal of the supply chain partners.
The superordinate goal is only achievable through the collaboration of all supply chain actors based on the stakeholder theory [7,8]. However, even prominent companies infringe on environmental and social requirements, bringing ill repute that could affect supply chain partners. For example, in southern India, beverage companies extracting underground water dried up wells, and dirtied and contaminated others [9]. This apparently destroyed and disrupted communities, capturing attention and attracting protests the world over. This incident directly affected corporate image and business. Poeter [10] described the unconducive working conditions of factories in China and cites watch groups planning to initiate a worldwide boycott of the affected products. Dangerous chemicals were allegedly used in some products, leading to workers’ hospitalization [11]. Similarly, allegations of worker rights violations in shoe manufacturing caused a furor in Malaysia [12]. This is indicative of slack environmental and social responsibility of manufacturers in developing countries. The infringement of even these minimal environmental and social standards or acceptable practices is an affront to institutions and exercise of self-degradation of OI. They invariably affect the economic performance and reputation of supply chain partners testifying to the frailty of the supply chain, which is only as strong as its weakest link [13]. In Malaysia, numerous pressure groups such as Environmental Protection Society of Malaysia, ECO-Knights, Free Tree Society, Sabah Wetlands Conservation Society and other Non-Governmental Organization (NGOs) were found to monitor environmental issues. Therefore, both issues of institutional pressures and OI along with environmental and social sustainable supply chain practices are incorporated into the conceptual framework to help supply chain partners identify and follow pathways to sustainable TBL in Malaysia. This is to refrain from infringing environmental and social standards. The two major research questions are:
RQ1: Could institutional pressures and organizational identity initiate pathways to a sustainable TBL of supply chain in Malaysia?
RQ2: Could environmental and social sustainable practices bring sustainable TBL supply chain performance outcomes in Malaysia?
The answers to these research questions will help introduce the concept of institutional pressures and organizational identity along with environmental and social sustainable practices impacting TBL supply chain performance outcomes in Malaysia. Currently, no study has yet decomposed sustainable practices into market-oriented and process-oriented practices in sustainability supply chain management. Second, the literature contributes to the theoretical framework portraying how organizations manage their supply chains in the midst of institutional pressures (external factors) and organizational identity (internal factors), which are typical factors and yet ignored in research when the mission is to create sustainable TBL supply chain performance outcome. Hence, the following Section 2 contains the conceptual framework and hypotheses. Methodology is found in Section 3, and statistical analysis and results in Section 4. Section 5 contains the discussion and implications and finally Section 6 gives our conclusions.
2. Conceptual Framework and Hypotheses
The following describes the extant literature in the areas of sustainable supply chain practices and performance, along with the theoretical foundations to develop the conceptual framework and hypotheses for this study.
2.1. Outcome in Triple Bottom Line Aspects
Outcome refers to performance and has become an integral part of the competitive advantages of a company in increasing number of industries in view of intensive international competition [14]. According to Elkington [15] and Carter and Rogers [16], outcomes of sustainable supply chain management refer to performance from supply chain activities or practices of companies and include all three sustainable factors of the triple bottom line (TBL)—economic, environmental and social. Li et al. [17] relates economic outcome to how well the organization could realize its market-driven or market-oriented goals and its financial or monetary goals.
Zhu, Sarkis, and Geng [18] highlighted inter-company relationships could improve environmental performance. Effective interactions between supply chain members, in partnership agreements and joint researches could lead to improved environmental performance (outcome). Bowen et al. [19] opine that companies that are engaged in green supply chain activities (environmental practices) will achieve superior long-term economic performance. De Giovanni and Zaccour [20], on the other hand, stress that environmental performance treated as a short-term target would eventually equate to economic performance or profits. Gotschol, De Giovanni, and Vinzi [21] stress that environmental performance positively impacts economic performance and competitiveness. For social outcome, Brown et al. [22] highlighted social aspects such as better worker safety programs in a company could be linked to an improved economy. Similarly, Thach [23] found social sustainability practices such as focusing on employees’ well-being results in economic outcome by reducing production costs.
2.2. Sustainable Supply Chain Management Practices
The resource-based view states that organizations can sustain a competitive advantage if they have resources and capabilities that are unique to their organizations. According to sustainability theory, sustaining competitive advantage and economic progress are the sustainability foundations, and combined with social and environmental outcomes they constitute the triple bottom line [15,16]. Sustainable supply chain practices are difficult to imitate and could become a unique source of competitive advantage [24], especially where the supply chain sustainability practices could solve problems, sense opportunities and threats, make market-oriented decisions and change a firm’s resource base [25]. Additionally, studies have shown that supply chain management practices, in particular relational supply management practices, are strongly related to competitive advantage, even more pronounced than research and development, and human capital [26]. This underscores the importance of supply chain management relational practices and their impact on firm performance.
Several studies unify environmental and social sustainability into a single concept, i.e., sustainability [16,27,28]. However, this does not happen in practice. For instance, some companies could have the most stringent and advanced environmental sustainability supply chain practices but could be criticized for their treatment of people in the supply chain [29,30]. Evidence has shown that environmental and social sustainability are separate concepts and have their respective antecedents, processes and outcomes [31]. Conceptually, there are fundamental and distinctive differences between environmental and social supply chain sustainability practices. Environmental practices focus on resource use and impacts on the physical environment; social practices focus on the health and well-being of people in the supply chain and impacts on society. It has also been suggested that all environmental benefits are social benefits since preventing harm to the environment ultimately benefits the Earth’s population [2]. In exploring the differences, this research follows Marshall’s (2014) suggestion that we break sustainability practices down into social and environmental components to refine predictions of the effects of sustainability practices on the triple bottom line outcomes. Therefore, this study decomposes practices into market-oriented [25] and process-oriented practices [27,32].
2.2.1. Environmental Process Practices
The practices in this category comprise Environmental Monitoring and Environmental Management Systems. Environmental process practices generally concern supervising and monitoring the suppliers’ behaviors, and policies of their environmental systems requirements [24,32]. These practices are process-based with fewer variables and they are rare, irreproducible and non-replaceable features due to the longevity and widely established nature of these resources [26,27]. Most supply chain sustainability activities are related to supervising and monitoring suppliers to ensure they are observing and practicing environmental sustainability to meet the demands of current regulations or expectations of the focal firms [33]. Monitoring could be in the form of questionnaires sent directly to the suppliers to ensure they comply with requirements or through site visits to assess and audit their environmental practices. There is ample evidence that most companies are willing to help their suppliers in ensuring compliance and success in their implementation [34].
Implementing environmental management systems is also called practicing a “green purchasing” system and could be evidenced from the certification of suppliers [35] and the effective application of environmental management systems [36]. Environmental supply chain management systems are implemented with scheduled monitoring activities. This involves assessing and evaluating suppliers’ environmental performance and also ensures practices are consistently observed and updated through certification and auditing. A pertinent example of this is ISO14001 certification or the implementation of the total quality environmental management systems [34,37,38,39].
2.2.2. Environmental Market Practices
The practices here refer to Environmental Supply Chain New Product and Process Development, and Environment Supply Chain Redefinition. New products, process innovations, and supply chain redefinition are considered higher value practices [40]. These practices pay more attention to modifications of the basic characteristics of supply chain products and the business models [3,41] and they are comparatively more strategic and unique, making them more difficult for rivals to identify, differentiate, disentangle and copy [26].
New products and process development practices refer to practices that would be beneficial to the environment, either through redesigning the production system or redesigning the product. The practices primarily include producing products that could be recycled to make other products [36,40,42]. Another market practice is to emphasize changing the strategy of the supply chain to focus on environmental sustainability [43]. A way to review and redefine their supply chain strategy is to create closed-loop supply chains to reuse waste products as a new resource [32,43]. This is close to the idea of industry ecosystems [40]. Another redefinition strategy is the de-commoditized supply chain [43,44]. This is a drastic supply chain strategy to reduce resource usage but would bring additional economic value to the chain.
2.2.3. Social Process Practices
There are two social sustainable process practices. The first is to monitor the suppliers’ social sustainability procedures and practices. The second is to implement social management systems such as the wellness system of employees and social management systems of suppliers [37,39]. One approach to monitor the suppliers’ social sustainability procedures and practices is to ensure suppliers comply with the audits and meet health and safety requirements [37]. Regulations on child labor, forced labor or working practices should be monitored closely. For focal companies, the demands or expectations could exceed statutory requirements. These demands could include a diverse workforce, voluntary overtime and equitable wages [34].
The implementation of the socially sustainable management system involves introducing management systems for suppliers comprising fair policies and procedures for reasonable wages, fair working hours, more employee-friendly work practices and effective job scope design to reduce stress in different ways [29]. The social supply chain management systems include two items, namely the OHSAS18001, a recognized health, and safety management system; and SA8000 meant for the betterment of workplace practices [34,45]. These systems go beyond conventional certification requirements to include work ethics [39] and wellness programs for employees and first-tier suppliers, with GlaxoSmithKline as one such company [29,46].
2.2.4. Social Market Practices
Social market practices are defined as creative innovations through social supply chain sustainability such as creating new products or procedures to enhance the safety and general health conditions of the workers and simultaneously ensure fair margins for suppliers [47]. New product and process development also means redesigning or creating new products and processes supporting the well-being of employees and serving the interests of the customers. It could be achieved by providing fair treatment or adequate welfare to employees [45].
Another supply chain social redefinition incorporates NGOs and community groups into the strategic decision-making process to achieve social welfare rather than optimal financial performance [48]. Indirect stakeholders of the company would be brought into the organization as direct stakeholders strengthening legitimacy and authority of the company [45]. This safeguards community interest [40]. It also ensures the supply chain pays fair wages and margins to sustain business [43,49]. For instance, fair trade ensures that suppliers in the coffee and cocoa bean supply chain offer reasonably fair wages and provide safe and healthy working conditions for employees [34].
2.3. Factors Affecting Adoption of Sustainable Supply Chain Management Practices
Factors affecting the adoption of sustainable supply chain practices could be grouped into external and internal. For external, Jennings and Zandbergen [50], Min and Galle [51] and Zhu and Sarkis [35] share their views on environmental practices adoption, while Othman, Darus, and Arshad [52] and Adams and Zutshi [53] stress social practices. External factors normally refer to regulatory and market pressure. Jennings and Zandbergen [50] discuss the company’s attitude towards the adoption of environmental management practices. They infer that most companies adopt and implement similar environmental management practices because of coercive forces like regulatory enforcement by the government. In the context of a green supply chain, Min and Galle [51] acknowledged that state and federal environmental regulations are two important factors guiding buyer firms’ decision in green purchasing practice. Zhu and Sarkis [35] noted that companies with wide international experience face greater pressures especially from foreign competitors to improve their environmental practices. Othman et al. [52] pointed out that regulatory efforts are important mechanisms in promoting corporate social responsibility (CSR) reputation. Adams and Zutshi [53] stress that companies in developed countries view CSR as vital for the sustainability of their businesses.
Internal factors refer to the organization culture and identity. According to Chang and Chen [54], OI could encourage creative and innovative sustainable performance through the sustainable activities and practices of the company. OI or culture influences sustainability outcomes through two factors, namely the organizational legitimacy and commitment. Chen [55] further reiterated that culture or OI is the internal factor that influences a company’s sustainable competitive advantage. This internal factor plays a vital role linking leadership and competitive advantage.
The next section describes the theoretical background and hypothesis development.
2.4. Theoretical Background and Hypothesis Development
The above discussion of TBL outcomes, SSCM practices, and factors affecting the adoption of these practices is closely related to resources and capabilities in the supply chain. Since the resource-based view (RBV) theory has been effectively applied to examine inter-firm activities, this study postulates that SSCM practices are a form of resources enabled by internal and external pressures, are not imitable, develop into capabilities through the passage of time and would display considerable influence on TBL outcomes. RBV is a theory suggesting that a firm has a unique bundle of assets and resources, which, if not easily purchased, stolen, imitated, or substituted, could create a huge competitive advantage [56,57,58]. Firms striving to undertake SSCM practices are virtually impossible to imitate [24], especially in strategic decisions, which are based on environmental and social insights to solve problems, sense opportunities and threats, make market-oriented decisions and reconfigure its resource base and capabilities [25]. Hence, this theory has gained considerable popularity to explain how SSCM practices could help a firm attain a differential advantage and lead to a successful business model [24,31,59,60,61].
In parallel to the justification for RBV for firm’s SSCM practices outlined above, the influence of external enablers/factors on firms’ practices is supported by institutional theory, which states that regulatory pressures from an institution will force organizations to adhere to changes required in the market to reduce uncertainty. Institutional theory has been used to examine the influence of external pressures, e.g., social, political and economic, on the firm [62], because it could legitimize its practices within their institutional field [63]. External pressures force firms to implement appropriate strategies based on industry norms, firm tradition, and management fads [64,65]. The Institutional theory is useful to explain how external pressures force firms to develop the legitimacy of SSCM practices across the supply chains. Previous studies indicate that Institutional theory being applied to sustainable practices across the supply chain could positively affect performance outcomes [59,66,67].
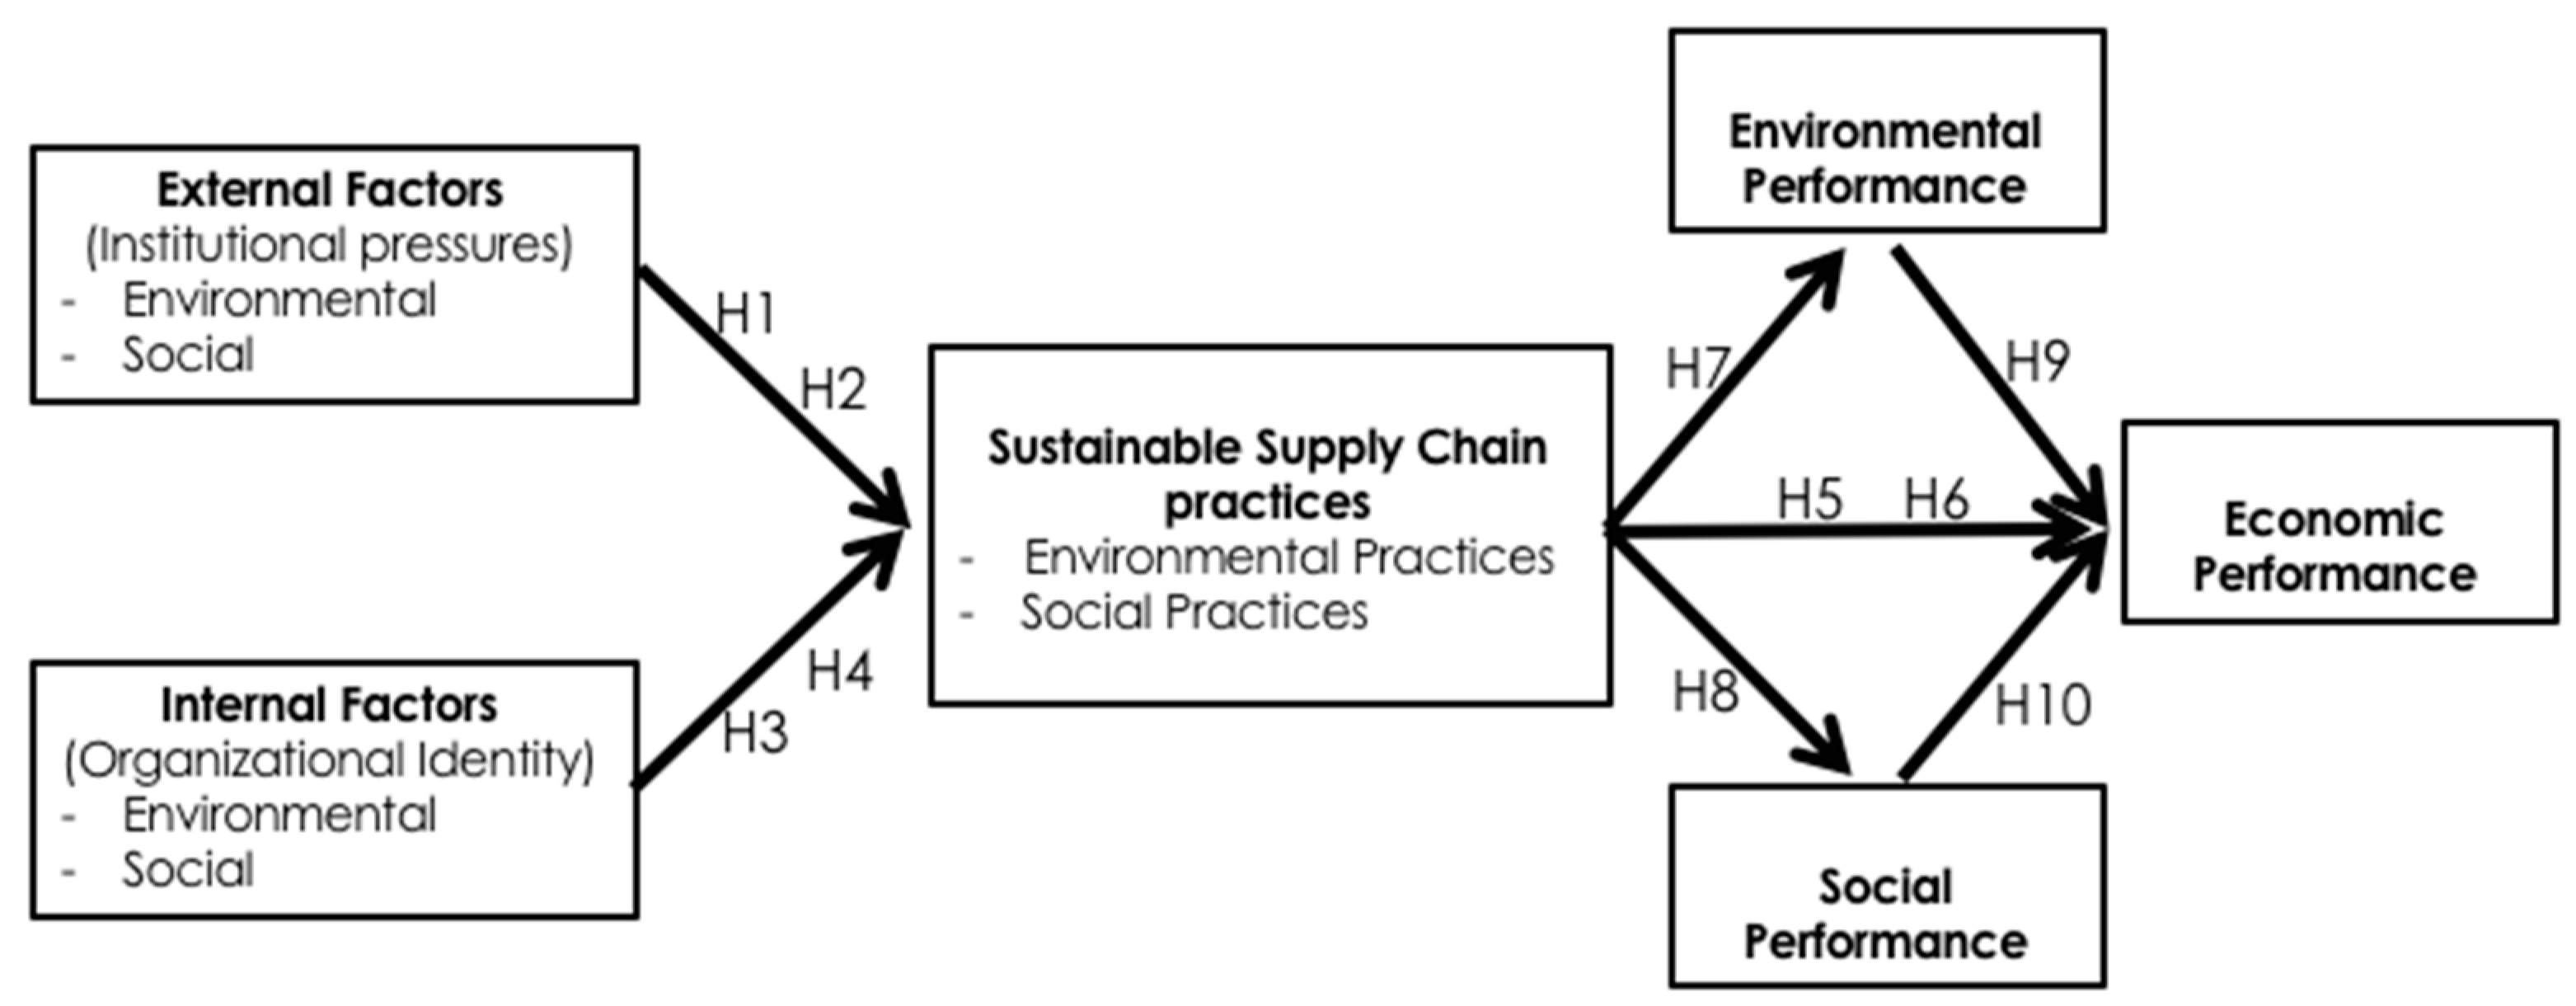
Based on the underlying theory of RBV and coupled with institutional theory, the framework explains the effects of internal and external enablers on sustainable supply chain practices leading to sustainable performance outcomes. Figure 1 is a theoretical model that captures the relationships among these variables. As noted earlier, sustainable supply chain practices will be decomposed into environmental and social practices. Thus, for coherency, the enablers/factors organized as internal and external are further refined into environmental and social categories. As such, the preceding first four main hypotheses (to test the relationship between enablers and practices) and their corresponding sub-hypotheses are tested.
Hypothesis 1 (H1).
Environmental institutional pressures are positively associated with environmental sustainable supply chain practices.
Hypothesis 1a (H1a).
Environmental institutional pressures are positively associated with environmental process-based practices.
Hypothesis 1b (H1b).
Environmental institutional pressures are positively associated with environmental market-based practices.
Hypothesis 2 (H2).
Social institutional pressures are positively associated with socially sustainable supply chain practices.
Hypothesis 2a (H2a).
Social institutional pressures are positively associated with social process-based practices.
Hypothesis 2b (H2b).
Social institutional pressures are positively associated with social market-based practices.
Hypothesis 3 (H3).
Environmental organizational identity is positively associated with environmental sustainable supply chain management practices.
Hypothesis 3a (H3a).
Environmental organizational identity is positively associated with environmental process-based practices.
Hypothesis 3b (H3b).
Environmental organizational identity is positively associated with environmental market-based practices.
Hypothesis 4 (H4).
Social organizational identity is positively associated with socially sustainable supply chain practices.
Hypothesis 4a (H4a).
Social organizational identity is positively associated with social process-based practices.
Hypothesis 4b (H4b).
Social organizational identity is positively associated with social market-based practices.
The rest of the hypotheses to test the framework are discussed in the following section.
2.5. Relationship between Sustainable Practices and Outcomes (The Triple Bottom Line)
In relation to the first triple bottom line outcome, i.e., economic, numerous researchers have acknowledged environmental practices always lead to better economic performance [68,69,70,71,72] and economic competitiveness [73]. Zhu et al. [74] specifically argued that companies improve income, profit, tax, employees’ welfare, and economic performance through sustainable design practices. In a similar vein, Chien and Shish [75] also pointed out that environmental practices significantly affect financial performance of the companies. Brown et al. [22] found that by adopting social practices, such as worker safety programs, the company could achieve improved economic outcome. Moreover, Carter and Rogers [16], Kirchoff, Omar, and Fugate [76], and Wolf [77] emphasized that social and environmental sustainable practices can improve economic performance. On the other hand, Thach [23] shows that social sustainability practices eventually lead to cost reduction in production and operations. The preceding arguments lead to the third and fourth main hypotheses and their sub-hypotheses.
Hypothesis 5 (H5).
Environmental supply chain practices are positively associated with economic performance.
Hypothesis 5a (H5a).
Environmental process-based practices are positively associated with economic performance.
Hypothesis 5b (H5b).
Environmental market-based practices are positively associated with economic performance.
Hypothesis 6 (H6).
Social supply chain practices are positively associated with economic performance.
Hypothesis 6a (H6a).
Social process-based practices are positively associated with economic performance.
Hypothesis 6b (H6b).
Social market-based practices are positively associated with economic performance.
In relation to the second triple bottom line outcome, i.e., environmental, researchers have shown eco-friendly supply chain positively improve organizational performance and simultaneously improve business environmental efficiency and effectiveness by reducing exposure to environmental risks [78]. Environmental performance drives organizations to reduce their overall environmental risks. According to Mazzi et al. [79], environmental practices are more conducive to better policy-making and could improve external communications. For enterprises that implement environmental practices, gains will be made from solids, waste water, and air emission reduction. Environmental practices reduces consumption of hazardous substances and the number of environmental accidents, improving the overall environment [74]. Chien and Shih [75] discovered enterprises that incorporate environmental practices in organizations through environmental policies and measures. The authors also show that reduction of emissions during energy/resources usage positively reinforces environmental performance. The seventh hypothesis and its sub-hypotheses are as follows.
Hypothesis 7 (H7).
Environmental supply chain practices are positively associated with environmental performance.
Hypothesis 7a (H7a).
Environmental process-based practices are positively associated with environmental performance.
Hypothesis 7b (H7b).
Environmental market-based practices are positively associated with environmental performance.
In relation to the third triple bottom line of social outcome, social performance is usually viewed as and assessed by the breakdown of several separate domains namely, human rights, human resources, environment, consumers, suppliers, communities and corporate governance [80]. As consumer awareness of the need for social performance increases, management increasingly recognizes their responsibility for implementing ethical programs to enhance social welfare [81]. According to Chien [82], the Lite-On technology corporation projects its image by displaying its commitment to social performance in business ethics, labor relations, safety and health in environmental protection; and management systems such as corporate governance and community participation. Perez and Sanchez [83] suggest that social performance assessment cover human rights policy in organizations, child labor rights and abuses, company involvement in community projects, administration and management of land rights, grievance mechanisms, impact of social performance practices on the community, rate of women employment, initiatives on stakeholders’ development, and the number of employees given work safety and security training. In this study, social performance includes social commitment and participation, education and training and human resource development. The following hypothesis and its sub-hypotheses are tested.
Hypothesis 8 (H8).
Social supply chain practices are positively associated with social performance.
Hypothesis 8a (H8a).
Social process-based practices are positively associated with social performance.
Hypothesis 8b (H8b).
Social market-based practices are positively associated with social performance.
Lastly, Bowen et al. [19] stated that a positive impact of environmental performance on economic performance could not be attained within a short period of time. Instead, those companies that are engaged in the green supply chain would achieve superior performance in the long term. Also, De Giovanni and Zaccour [20] stress that while environmental performance is a short-term target, its economic performance (profits) would eventually be realized. Gotschol et al. [21] show the positive impact of environmental performance on economic performance and economic competitiveness. This study has added social performance to positively impact economic performance with the following hypotheses.
Hypothesis 9 (H9).
Environmental performance is positively associated with economic performance.
Hypothesis 10 (H10).
Social performance is positively associated with economic performance.
3. Methodology
This study explores the factors influencing sustainable performance. It analyzes the linkages of IP and OI antecedents, SSCM practices and sustainable TBL performance through empirical tests. The antecedents of SSCM practices comprise IP and OI. SSCM practices are decomposed into environmental process- and market-based practices; and social process- and market-based practices. The data required for this study were gathered using the survey research method. This is described and examined in more detail in the following sections.
3.1. Research Design
In this study, quantitative research is used to prove or disprove a predetermined hypothesis. The cross-sectional survey design implies that the data will be collected at one point in time. Moreover, this study applied a completely self-administered and electronically administered questionnaire survey in collecting the data from the manufacturing sector in Malaysia using single respondents.
Although recent studies in the supply chain emphasized abandoning single-source surveys due to the inherent limitations of common method bias [84,85], choosing the single-source survey is more appropriate because of less time and cost incurred, capacity to abstract view of the unit of analysis, and provision of data about concepts experienced by one party. The resulting larger sample size could provide stronger statistical power [85,86].
Some initial tests were done before the data analysis proceeded to the next stage. This is to determine if the responses received from the respondents in this study are free from bias; otherwise, the results are invalid. Hence, common method bias and the nonresponse bias between the early and late response groups were tested to ensure the survey data are valid and reliable.
3.2. Sampling
As a developing country, Malaysia was chosen as our research setting because of its position as the supplier for many western or developed countries. The World Bank ranked Malaysia as the 18th easiest place to do business out of 189 economies in 2015 [87]. In addition, Malaysia was placed 9th in the world (the only emerging market in the top 10) by the World Economic Forum, Global Competitiveness Ranking 2015–2016. Being a favorite among foreign investors, Malaysia is clearly an ideal place to conduct an investigation into sustainable supply chain performance.
Manufacturing is the path to development and it is central to the economy due to its significant contribution to economic growth and job creation. In Malaysia, manufacturing is the highest contributing sector (37.6%) in foreign direct investment (FDI) in 2013 [88]. It is also the largest contributor to the gross domestic product (GDP) in Q4/2014 (RM 66,540 million) [89]. The manufacturing sector in Malaysia has the highest employment, with 2,357,400 people in Q4/2013 [90]. Hence, the list of samples was generated from [91] the Federation of Malaysian Manufactures (FMM) directory (2015). The directory is an official authoritative publication in the country.
The sampling technique for this study is based on proportionate stratified random sampling. The manufacturing firms in Malaysia are classified into 16 different manufacturing sectors. The recipient companies of this survey consist of 26% large enterprises that have more than 200 employees with the remaining 74% SME (Small and Medium Enterprise). Through stratified random sampling, we divided the population into strata based on the manufacturing sector and size, and focused on the six most significant sectors covering 64% of the total number of manufacturers in Malaysia. They come from “Food Beverage and Tobacco” (18%), “Chemicals, including Petroleum” (12%), “Fabricated Metal” (17%), Electrical and Electronics” (28%), “Machinery” (12%) and “Plastic” (12%).
3.3. Measures
All the items for the variables were developed based on the literature review of conceptual and empirical studies related to SSCM research. All items are anchored on a five-point Likert scale that ranges from 1 (strongly disagree) to 5 (strongly agree), except for the sustainable performance measure, where the items are anchored on a seven-point Likert scale ranging from 1 (strongly disagree) to 7 (strongly agree).
For external factors of IP, the environmental and social measurement items were adapted from Son and Benbasat [92] and Hoejmose et al. [93]. For internal factors of OI, the measurement items for environment and social were adapted from Chang and Chen [54]. For sustainable SSCM practices, all the environmental and social market- and process-based measurement items were adopted from Marshall et al. [94]. Economic performance measurement items were adopted from Zailani et al. [95] and Gotschol et al. [21]. Environmental performance measurement items were adopted from Zhu et al. [96], Chien [82] and Zailani et al. [95]. Social performance measurement items were adapted from Zailani et al. [95] and Chien [82]. All the items for each variable are shown in the tables in Appendix A.
3.4. Data Analyses
To test whether a specified set of constructs impact the responses in a predictable way, confirmatory factor analysis (CFA) was run using structural equation modeling with partial least squares (PLS-SEM) version 3.0 [97]. The path coefficients and other model parameters were evaluated by the procedures of the PLS-SEM algorithm, which maximizes the explained variance of the dependent construct(s). To determine individual item reliabilities, the loading of the items was analyzed; it is recommended that standardized loadings should be greater than 0.707 [98]. The average variance extracted (AVE) is a summary indicator of convergent validity of constructs. AVE for all constructs should be greater than 0.50. An AVE value of 0.50 or greater indicates that latent constructs can account for at least half of the variance in items and the measurement scale has adequate convergent validity [98]. Discriminant validity referring to the degree of specific construct being distinctive from other constructs is demonstrated by the square root of the AVE being greater than any of the inter-construct correlations [98,99]. The bootstrapping method was applied to obtain the coefficient for its significance of the path modeling.
4. Statistical Analysis and Results
4.1. Common Method Variance (CMV)
In the first place, the potential problem of common method bias (CMB) must be safely excluded because a single respondent was deployed in this survey research as the unit of analysis [84]. One of the most widely used techniques to test CMB is Harman’s one-factor (or single-factor) test. Harman’s single-factor test is also a straightforward statistical control technique for CMB [100]. The result shows 78.23% of total variance, while the variance for the first factor is 39.05% [101]. Hence, CMB is not a problem in this study.
4.2. Nonresponse Bias Test
Sixty-seven respondents were grouped as early response, while the remaining 126 were grouped under the late-response category. The two groups were subjected to a t-test to ascertain the significance of the relationship between them. The t-test results are shown in Table 1.
4.3. Validity, Reliability and Hypotheses Testing—Structural Path Analysis
Table 2 shows that all the indicator loadings are higher than 0.70 and all AVE values are above 0.50, indicating convergent validity at the construct level. In addition, the CRs are greater than 0.70, suggesting acceptable reliability.
The traditional methodology complementary to convergent validity is discriminant validity [102]. Discriminant validity represents the extent to which the measure of a given construct differs from measures of other constructs in the same model [102]. A comparison of the square root of AVE for each construct with its correlation to another construct is presented in Table 3. These results indicate the acceptable discriminant validity of the measurement model.
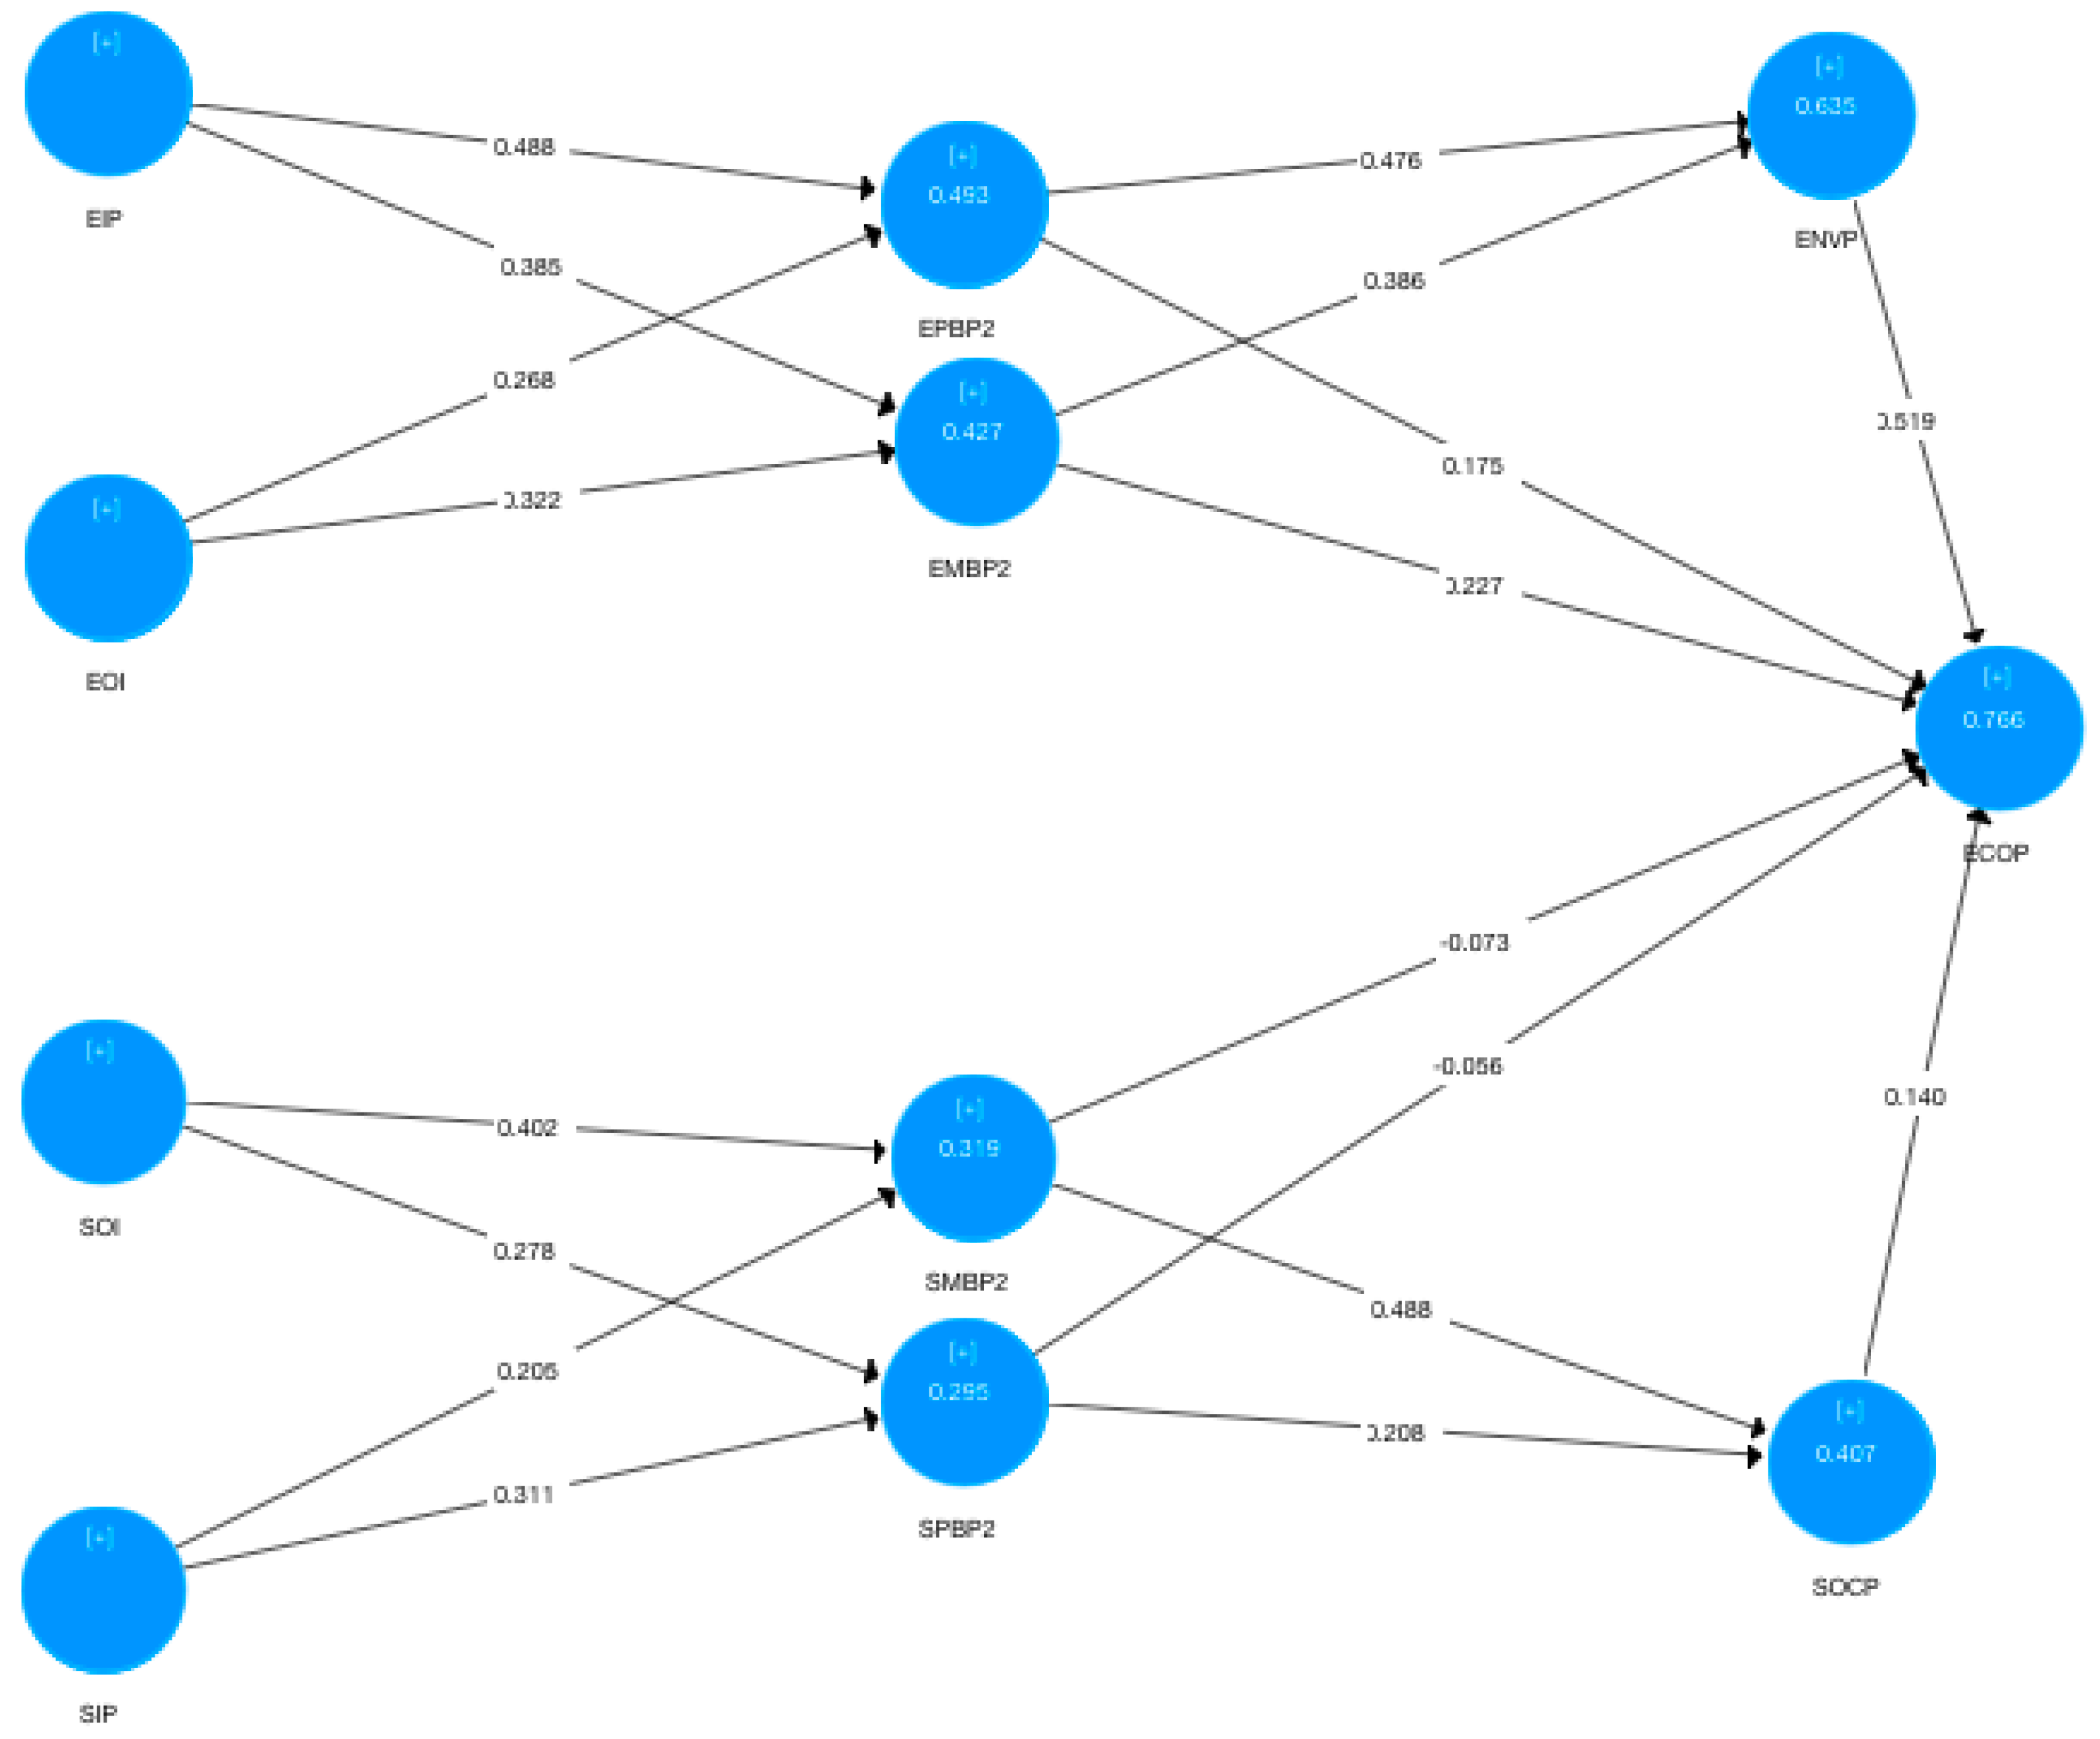
Table 4 and Figure 2 reveal the second-order factor hypotheses results. The R2 value of economic performance is 0.766, which suggests that 76.60% of the variance could be explained by environmental performance, environmental market-based practices, environmental process-based practices, social performance, social market-based practices and social process-based practices. Since the R2 value of economic performance is 0.766, the explanatory power of the variables is substantial. Cohen [103] is of the opinion that an R2 = 0.02 is considered weak, R2 = 0.13 is moderate and R2 = 0.26 is substantial. Since the R2 value of economic performance is 0.766, the explanatory power of the variables is considered substantial. The four variables that have a significant correlation with economic performance are environmental performance (β = 0.519, p < 0.01), environmental process-based practices (β = 0.175, p < 0.01), environmental market-based practices (β = 0.227, p < 0.01) and social performance (β = 0.140, p < 0.05). However, two variables (social market-based practices, social process-based practices) are not significant predictors of economic performance. Thus, H5a, H5b, H9, and H10 are supported in this study, whereas H6a and H6b are rejected.
The R2 value of environmental performance is 0.635, which suggests that 63.5% of the variance could be explained by environmental process-based practices and environmental market-based practices. Since the R2 value of environmental performance is 0.635, the explanatory power of the variables is substantial. The two variables that have a significant correlation with environmental performance are environmental process-based practices β value is 0.406 (p < 0.01) and environmental market-based practices with β value is 0.375 (p < 0.01). These results concur with Yu and Ramanathan’s findings of operations and marketing capabilities significantly affecting environmental management performance [104]. Thus, H7a and H7b are supported in this study.
The R2 value of social performance is 0.407, which suggests that 40.7% of the variance can be explained by social process-based practices and social market-based practices. Since the R2 value of social performance is 0.407, the explanatory power of the variable is considered substantial. The two variables that have a significant correlation with social performance are social process-based practices (β = 0.196, p < 0.01) and social market-based practices (β = 0.483, p < 0.01). Thus, H8a and H8b are supported in this study.
The R2 values of the environmental sustainable supply chain practices variables are 0.493 (environmental process-based practices) and 0.427 (environmental market-based practices). All the R2 values are above 0.26 as the explanatory powers of these variables are substantial. Of the environmental antecedent variables, environmental institutional pressure has a significant correlation with environmental process-based practices (β = 0.488, p < 0.01), environmental market-based practices (β = 0.385, p < 0.01). The environmental OI also has a significant correlation with the environmental process-based practices β value of 0.268 (p < 0.01) and environmental market-based practices β value of 0.322 (p < 0.01). Thus H1a, H1b, H3a and H3b are supported in this study.
The R2 values of the social sustainable SSCM practices variables are 0.295 (social process-based practices) and 0.319 (social market-based practices). According to [103] Cohen (1988), an R2 = 0.02 is considered weak, R2 = 0.13 is moderate and R2 = 0.26 is substantial. All the R2 values are above 0.26 as the explanatory powers of these variables are substantial. As for social antecedent variables, the social institutional pressure has a significant correlation with social process-based practices with a β value of 0.311 (p < 0.01) and a social market-based practices β value of 0.385 (p < 0.05). The social organizational identity has a significant correlation with social process-based practices with β value of 0.278 (p < 0.01) and social market-based practices β value of 0.402 (p < 0.01). Thus H2a, H2b, H4a, and H4b are supported.
5. Discussion and Implications
To recapitulate, the main aim of this sustainable supply chain study is to find pathways from IP and OI through E-SSCM and S-SSCM practices to TBL performance in the context of environmental and social dimensions. The RBV and Institutional theory are the anchors of this conceptual framework. Findings show all relationships or linkages are significant except for the S-SSCM practices to economic performance. This study has produced some theoretical and practical implications for scholars and practitioners in SSCM refined with market- and process-based dimensions. They are discussed as follows.
Theoretically, IP and OI are proven antecedents for SSCM practices [59]. Though institutions are frequently seen as constraints [105] or regulated opportunity incurring compliance costs [106], the yet-to-be proven IP-SSCM practices have shown their significant usefulness for further research. IP could influence SSCM practices and are reflective of interactions between institutions and people with the intent of “profit” or benefit maximizing of the TBL of supply chain [105]. Since a literature review has not yielded the use of IP in SSCM studies, this research contributes new theories and knowledge by introducing the concept of institutional pressure into its framework. As expected, the desired OI (comprising a sense of pride in organizational history, goals and missions, environmental and social practices, and traditions and culture) could influence SSCM practices. OI are bundled resources and could transform SSCM practices into capabilities to influence sustainable TBL performance. This is the operationalization of RBV. Therefore, this study introduces Institutional theory into SSCM and extends the useful application of RBV.
Secondly, this study reveals the usefulness of each dimension in SSCM practices. Earlier studies on SSCM practices involved the collected use of resources and deployment of capabilities to achieve a competitive economic advantage along with environmental and social benefits [15,24,31,59,60,61]. However, this study has SSCM practices with social and environmental practices refined into two dimensions of process- and market-based practices. Each SSCM practice shows a strong impact on the respective performance outcomes. This shows that market- and process-based sustainable practices are important organizational resource-capabilities and should be properly managed. Surprisingly, the results do not show S-SSCM practices directly impacting economic performance but E-SSCM practices do. A previous study shows that firms could develop strong capabilities on social and environmental sustainability to improve economic performance [16,75,76,107]. The results of S-SSCM practices on economic performance in this study are different from previous studies [22]. These contrasting findings could help in the resource allocation of market and process skills. However, the results of E-SSCM always lead to better economic performance and are in line with previous studies [68,69,70,71,72].
Thirdly, since this study shows that environmental and social performance could directly impact economic performance, similar to Gotschol [21], we confirm that economic benefits could also be derived from environmental and social performance. This finding should continue to refute detractors marginalizing corporate social responsibility. Meeting customers’ environmental and social requirements could mean cost savings in producing “lean” products and services for a growing discerning market. Firms engaging in sustainable supply chain initiatives might combine overall strategic orientations with respect for the natural environment and ensure sustainability by staying competitive and profitable [72].
Practical implications are also derived from this research. This research demonstrates a statistically significant association between IP and OI with SSCM practices; the latter impacts on sustainable performance with the exception of S-SSCM to economic performance. Therefore, IP, OI and SSCM practices are now considered useful supply chain initiatives in developing countries [102,108].
With the public becoming more aware of environmental and social issues, the latter have become immediate concerns for business and public organizations. Public awareness stems from advocacy by interest groups and friends circulating messages in print and social media. These issues must be resolved before they become unmanageable and bring ill repute to firms. Business and public organizations should utilize IP and develop their OI to leverage their resource capabilities. For IP, organizations could mimic or benchmark the performances of superior organizations and be opportunistic to participate in newly introduced normative institutional measures. Firms could take initiatives to comply with suggestions by advocacy groups or government to seize first-mover advantage before regulations are enforced. They could also benchmark the market- and process-based practices of other organizations. In all these, firms should collaborate with key suppliers when responding to institutional demands so that the supply chain partners are synchronously sustainable. Sustainability is a key driver for innovation, making it a key business objective.
Similarly, OI, with its market-based and process-based dimensions, is equally important. Organizational history, goals and missions, environmental and social practices, and traditions and culture should continually and corporately be owned with a sense of great pride. They must be built and defended with good products and services and not “greenwashing”. Improving internal corporate social responsibility could be a way to instill ownership and pride. Dimensions of internal corporate social responsibility that are significantly and positively related to affective commitment include training and education, human rights, health and safety, work life balance and workplace diversity are categorized under the higher-order needs of esteem and self-actualization [109]. With affective commitment, employees along the supply chain should devote their time and effort to building OI.
Since SSCM practices could affect sustainable TBL performance except for S-SSCM practice to economic performance, measures such as environmental and social monitoring, management system implementation, and new product and process development for key suppliers; and supply chain redefinition for buyer firms are recommended. Regular audits with pre-notification to suppliers, the acquisition of global certification such as ISO14001 and relevant product and process industrial standards, new sustainable product and process development, and advocacy of the circular economy are examples that could sustain the TBL performance of supply chains [110].
In order to sustain TBL performance, firms and suppliers alike should continue to pay heed to both market- and process-based practices since these are the proximal linkages to performance outcomes. Listening to customers and meeting market demands should sustain market share. Environmental practices could be expanded to include both air and sound quality, which are usually ignored in the workplace. Likewise, continual work and method study could promote healthier and safer lifestyles in the workplace. Both these environmental and social measures could leverage TBL performance outcomes.
The preceding suggestions should be continually improved, much like the Plan-Do-Check-Action of the Deming improvement cycle. Champions must be identified from among employees in all supply partners to sustain such efforts. Annual environmental and social improvement competition could foster closer supply chain partnerships and generate ideas for similar improvements along the supply chain. Translating environmental and social benefits into economic terms should help sell these two non-economic ideas. This would put environmental and social issues, along with the usual economic issues, onto the company’s agenda. It would add to the increasing awareness and importance of sustainability practices to benefit firms and extend these benefits to families and the community at large since they are also direct stakeholders of missions and visions of companies. This research has contributed to revealing the concept of IP (Institutional Pressure) and OI (Organization Identity), positively impacting sustainable supply chain management practices. This shows that IP and OI are important in SSCM. The pathway for achieving the outcomes of SSCM, i.e., the TBL performance, needs to take into account the external and internal factors that could influence the environmental and social responsibilities of the organizations.
Last but not least, this research is not without limitations. The current study involved samples from Malaysian manufacturing companies and the results may differ for other countries. The business environment in Malaysia could be different from other countries as the business environment is shaped by various factors such as the political landscape, economic policy and country regulations. For future research, it would be valuable to test this conceptual research framework in Asian Pacific countries. Future research could also focus on how formal certification moderates the relationship between practices and the TBL performances.
6. Conclusions
The research model has been justified by empirical evidence of all significant linkages, except for that of S-SSCM practices to economic performance. This answers both research questions and fulfills the purpose of this study. The empirical evidence is statistically supported by the R2 value of 0.766 of economic performance. This suggests that 76.60% of the variance could be explained by IP, OI, environmental market- and process-based practices, environmental performance, social market- and process-based practices, and social performance. Since the R2 value of economic performance is 0.766, the explanatory power of the variables is considered substantial. Therefore, the research model is theoretically and empirically valid and robust. The strong linkages propose several valid pathways to attain sustainable TBL performance.
This research is about what could affect sustainable TBL performance. With 50% of the questionnaires directed to a firm’s key suppliers, the embedded objective is to determine the synchronous sustainability of supply chain partners. The results confirm this embedded objective. However, the authors are mindful that the strength of the supply chain is only as strong as its weakest link.
IP in this study is now viewed favorably for motivating organizations to adopt sustainable supply chain management practices. This study has turned a “foe” to a “friend” in a market enterprise because IP could leverage SSCM practices, much like the institutional support rendered to product and process innovation and firm performance [111]. The unsurprising OI has remained a “loyal friend” to firm SSCM practices. Surprisingly, IP to SSCM practices linkage appears to be stronger than OI to SSCM. This could reflect a more aggressive IP, noting the ever-changing business landscape compared to OI, which could encounter more resistance. Of the SSCM practices, the significant E-SSCM practices could affect the economic performance but not the S-SSCM practices. This could be attributed to the uncompromising enforcement of environmental regulations for trade purpose. Could similar benefits be derived if global trade enforces social standards such as SA8001 against the growing application of GRI?
This research has extended the frontiers of SSCM knowledge by incorporating the now-proven IP. The empirics have helped validate the theoretical anchors of the research model. The pathways to sustainable TBL performance are established, making the conceptual framework useful for practical applications. It shows the superordinate goal of sustainable supply chains performance is met by unyielding external pressures and desirable OI driving the unequivocal environmental requirements and responsible social practices of firms.
Moreover, this study also provides insights that are related to an Environmental Management Policy and Sustainability Policy that form the sustainability agenda in all business decisions and pre-empt environmental and social issues. Firms are required to implement sustainable policies for their supply chain because of increased external pressures (IP). Such policies could increase the efficiency of a supply chain and help it differentiate itself from the competition. Moreover, firms with higher levels of internal integration processes (OI) tend to have the ability to implement SSCM practices so can effectively handle environmental regulations.
The sustainable supply chain practices and the drivers (IP and OI) give business benefits to Malaysian companies in our study. Thus, the firms need to work together to share the benefits and ‘success stories’ of sustainable supply chain management practices with other firms to spread and create interest in the concepts (i.e., sustainable supply chain practices and the drivers IP and OI) across the industry. More importantly, SSCM needs to be conveyed as a route for a firm’s commercial success rather than as a moral obligation and compliance.
Finally, the contributions of this study are twofold. First, discovering that the concept of IP (external factors) and OI (internal factors) positively impacts SSCM practices, which appears to be fundamentally distinct from previous similar studies. Second, this study has mainly focused on ways to achieve sustainable TBL performance outcomes when dealing with the environmental and social responsibility of Malaysian manufacturers. Hence, a useful theoretical framework is now provided to help manufacturers in developing countries profit from the integration of social and environmental sustainable practices as a business strategy.
Author Contributions
Conceptualization, K.-C.T. and W.-P.W.; Methodology, K.-C.T. and W.-P.W; Software, K.-C.T.; Validation, K.-C.T.; Formal Analysis, K.-C.T.; Investigation, K.-C.T.; Resources, K.-C.T. and W.-P.W; Data Curation, K.-C.T.; Writing-Original Draft Preparation, K.-C.T. and W.-P.W; Writing-Review & Editing, K.-C.T. and W.-P.W; Visualization, K.-C.T. and W.-P.W; Supervision, W.-P.W; Project Administration, K.-C.T.; Funding Acquisition, K.-C.T..
Funding
This research received no external funding.
Acknowledgments
We would like to express our greatest gratitude to Dr.Krishnaswamy Jayaraman for his guidance, support and encouragement especialy in this research framework. His priceless suggestions and advice on my research are greatly appreciated. We would like to extend our special thanks to the assistance and support of academicians, administrationi staffs and colllegues in Graduate School of Business Universiti Sains Malaysia.
Conflicts of Interest
The authors declare no conflict of interest.
Appendix A. Questionnaire Items

Table A1.
Institutional pressures.
| Environmental | |
| 1. | Competitors with well-developed environmental supply chain management programs are perceived favorably in our industry. |
| 2. | Our competitors are using environmental supply chain management to their advantage. |
| 3. | We actively participate in industry/trade/professional associations that promote environmental supply chain management. |
| 4. | Significant pressure to engage in environmental supply chain management is placed on us by industry and professional sources that support environmental supply chain management. |
| 5. | Our firm’s success depends significantly on our participation in environmental supply chain management. |
| 6. | Environmental supply chain management is something we feel we must do. |
| Social | |
| 7. | Competitors with well-developed social supply chain management programs are perceived favorably in our industry. |
| 8. | Our competitors are using social supply chain management to their advantage. |
| 9. | We actively participate in industry/trade/professional associations that promote social supply chain management. |
| 10. | Significant pressure to engage in social supply chain management is placed on us from industry and professional sources that support social supply chain management. |
| 11. | Our firm’s success depends significantly upon our participation in social supply chain management. |
| 12. | Social supply chain management is something we feel we must do. |
Table A2.
Organizational identity.
| Environmental | |
| 1. | The company’s employees are proud of the company history about environmental management and protection |
| 2. | The company has a sense of pride about the company’s environmental goals and missions |
| 3. | The company has carved out a significant position with respect to environmental management and protection |
| 4. | The company has formulated a well-defined set of environmental goals and missions |
| 5. | The company’s employees are knowledgeable about the company’s environmental traditions and cultures |
| 6. | The company pays very close attention to environmental management and protection |
| Social | |
| 7. | The company’s employees are proud of the company history about social management and protection |
| 8. | The company has a sense of pride about the company’s social goals and missions |
| 9. | The company has carved out a significant position with respect to social management and protection |
| 10. | The company has formulated a well-defined set of social goals and missions |
| 11. | The company’s employees are knowledgeable about the company’s social traditions and cultures |
| 12. | The company pays very close attention to social management and protection |
Table A3.
Environmental SSCM practices.
| 1. | Your company has monitored the compliance with your environmental requirements. |
| 2. | Your company has sent environmental questionnaires in order to monitor compliance. |
| 3. | Your company has monitored the commitment to environmental improvement goals. |
| 4. | Your company has conducted environmental audits of the operations. |
| 5. | Your company has designed a system to measure environmental performance with your key supplier. |
| 6. | Your company has implemented a total quality environmental management system with your key supplier. |
| 7. | Your company has introduced an environmental compliance and auditing system with your key supplier. |
| 8. | Your company has helped your key supplier obtained environmental management system certification (e.g., ISO14001). |
| 9. | Reduce consumption of resources. |
| 10. | Reuse, recycle, or recover resources. |
| 11. | Used recycle or reclaim resources. |
| 12. | Reduce the release of pollutants. |
| 13. | Make your supply chain a closed loop supply chain (so all your used products re-enter the supply chain for re-use, recycling or remanufacturing). |
| 14. | Use waste in the supply chain as a resource. |
| 15. | Minimize waste throughout the supply chain. |
| 16. | Focus on minimizing resource use in the supply chain. |
Table A4.
Social SSCM practices.
| 1. | Your company has monitored the compliance with your health and safety requirements. |
| 2. | Your company has sent health and safety questionnaires to them in order to monitor their compliance. |
| 3. | Your company has monitored their commitment to health and safety improvement goals. |
| 4. | Your company has audited the health and safety of their employees. |
| 5. | Your company has designed systems for work/family balance across the supply chain with your key supplier. |
| 6. | Your company has introduced employee health and safety compliance and auditing systems with your key supplier. |
| 7. | Your company has helped your key supplier obtained health and safety management system certification (OHSAS 18001, SA8000, etc.). |
| 8. | Your company has developed an ethical code of conduct with your key supplier. |
| 9. | Reduced health risks for consumers. |
| 10. | Benefitted workers throughout the supply chain. |
| 11. | Reduced health and safety hazards for employees. |
| 12. | Provided fair margins to all your suppliers. |
| 13. | Bring non-governmental organizations (NGOs) and community groups into the supply chain. |
| 14. | Minimize negative impacts on communities around your supply chain operations. |
| 15. | Make your social sustainability data (ethical code of conduct/impact on communities) throughout your supply chain available to the public. |
| 16. | Focus on fair trade throughout the supply chain. |
Table A5.
Sustainable performance.
| Economic | |
| 1. | Significant reduction in terms of waste and its disposal costs. |
| 2. | Significant improvement in terms of resource management efficiency. |
| 3. | Significant improvement in terms ROE (Return on Equity). |
| 4. | Significant improvement in terms of ROA (Return on Assets). |
| Environmental | |
| 1. | Significant improvement in its compliance to environmental standards. |
| 2. | Significant reduction in consumption for hazardous/harmful/toxic materials. |
| 3. | Significant improvement in efficient energy/resource use. |
| 4. | Significant improvement in company’s environmental situation. |
| Social Performance | |
| 1. | Significant improvement in product/service image. |
| 2. | Significant improvement in its image in the eyes of its customers. |
| 3. | Significant improvement in relations with community stakeholders, e.g., Non-governmental organizations (NGO) and community activists. |
| 4. | Significant improvement towards a healthier work environment. |
| 5. | Significant improvement in training and human resource development. |
References
- Kiron, D.; Kruschwitz, N.; Haanaes, K.; Velken, I.V.S. Sustainability nears a tipping point. MIT Sloan Manag. Rev. 2012, 53, 69–74. [Google Scholar] [CrossRef]
- Waddock, S.A.; Graves, S.B. The corporate social performance-financial performance link. Strateg. Manag. J. 1997, 18, 303–319. [Google Scholar] [CrossRef]
- Nidumolu, R.; Prahalad, C.K.; Rangaswami, M.R. Why sustainability is now the key driver of innovation. IEEE Eng. Manag. Rev. 2015, 43, 85–91. [Google Scholar] [CrossRef]
- Zhu, Q.; Geng, Y.; Fujita, T.; Hashimoto, S. Green supply chain management in leading manufacturers: Case studies in Japanese large companies. Manag. Res. Rev. 2010, 33, 380–392. [Google Scholar] [CrossRef]
- Rao, P.; Holt, D. Do green supply chains lead to competitiveness and economic performance? Int. J. Oper. Prod. Manag. 2005, 25, 898–916. [Google Scholar] [CrossRef]
- Burke, L.; Logsdon, J.M. How corporate social responsibility pays off. Long Range Plan. 1996, 29, 495–502. [Google Scholar] [CrossRef]
- Ketchen, D.J., Jr.; Hult, G.T.M. Toward greater integration of insights from organization theory and supply chain management. J. Oper. Manag. 2007, 25, 455–458. [Google Scholar] [CrossRef]
- Freeman, R.E. Strategic Management: A Stakeholder Approach; Pitman: Boston, MA, USA, 1984; Available online: https://en.wikipedia.org/wiki/Stakeholdertheory (accessed on 10 January 2016).
- Jayaraman, N. Coca Cola Parches Agricultural Land in India. Global Policy Forum, 2002. Available online: https://www.globalpolicy.org/component/content/article/162/28046.html (accessed on 17 March 2015).
- Poeter, D. NGOs Call for Boycott of Apple Products over Worker Safety. PC Magaizine, 2014. Available online: http://www.pcmag.com/article2/0,2817,2454796,00.asp (accessed on 17 March 2015).
- Branigan, T. Chinese Workers Link Sickness to N-Hexane and Apple iPhone Screens. Available online: https://www.theguardian.com/world/2010/may/07/chinese-workers-sickness-hexane-apple-iphone (accessed on 9 April 2017).
- Skidmore, S. Nike Finds Major Violations at Malaysia Factory. USA Today, 2008. Available online: http://usatoday30.usatoday.com/money/industries/retail/2008-08-01-nike-malaysia-labor-violations_N.htm (accessed on 17 March 2015).
- Arvis, J.F.; Saslavsky, D.; Ojala, L.; Shepherd, B.; Busch, C.; Raj, A. Connecting to Compete 2014, Trade Logistics in the Global Economy: The Logistics Performance Index and Its Indicators; The World Bank: Washington, DC, USA, 2014; Available online: http://siteresources.worldbank.org/TRADE/Resources/2390701336654966193/LPI_2012_final.pdf (accessed on 17 September 2014).
- Hoole, R. Five ways to simplify your supply chain. Supply Chain Manag. Int. J. 2005, 10, 3–6. [Google Scholar] [CrossRef]
- Elkington, J. Partnerships from cannibals with forks: The triple bottom line of 21st-century business. Environ. Qual. Manag. 1998, 8, 37–51. [Google Scholar] [CrossRef]
- Carter, C.R.; Rogers, D.S. A framework of sustainable supply chain management: Moving toward new theory. Int. J. Phys. Distrib. Logist. Manag. 2008, 38, 360–387. [Google Scholar] [CrossRef]
- Li, S.; Ragu-Nathan, B.; Ragu-Nathan, T.S.; Rao, S.S. The impact of supply chain management practices on competitive advantage and organizational performance. Omega 2006, 34, 107–124. [Google Scholar] [CrossRef]
- Zhu, Q.; Sarkis, J.; Geng, Y. Green supply chain management in China: Pressures, practices and performance. Int. J. Oper. Prod. Manag. 2005, 25, 449–468. [Google Scholar] [CrossRef]
- Bowen, F.E.; Cousins, P.D.; Lamming, R.C.; Farukt, A.C. The role of supply management capabilities in green supply. Prod. Oper. Manag. 2001, 10, 174–189. [Google Scholar] [CrossRef]
- De Giovanni, P.; Zaccour, G. A two-period game of a closed-loop supply chain. Eur. J. Oper. Res. 2014, 232, 22–40. [Google Scholar] [CrossRef]
- Gotschol, A.; De Giovanni, P.; Vinzi, V.E. Is environmental management an economically sustainable business? J. Environ. Manag. 2014, 144, 73–82. [Google Scholar] [CrossRef] [PubMed]
- Brown, B.A.; Sellen, A.J.; O’hara, K.P. A diary study of information capture in working life. In Proceedings of the SIGCHI Conference on Human Factors in Computing Systems, The Hague, The Netherlands, 1–6 April 2000; pp. 438–445. [Google Scholar]
- Thach, L. Social sustainability in the wine community: Managing for employee productivity and satisfaction. Wine Bus. Mon. 2002, 9, 7–10. [Google Scholar]
- Reuter, C.; Foerstl, K.A.I.; Hartmann, E.V.I.; Blome, C. Sustainable global supplier management: The role of dynamic capabilities in achieving competitive advantage. J. Supply Chain Manag. 2010, 46, 45–63. [Google Scholar] [CrossRef]
- Barreto, I. Dynamic capabilities: A review of past research and an agenda for the future. J. Manag. 2010, 36, 256–280. [Google Scholar] [CrossRef]
- Zimmermann, F.; Foerstl, K. A Meta-Analysis of the “Purchasing and Supply Management Practice–Performance Link”. J. Supply Chain Manag. 2014, 50, 37–54. [Google Scholar] [CrossRef]
- Busse, C. Doing well by doing good? The self-interest of buying firms and sustainable supply chain management. J. Supply Chain Manag. 2016, 52, 28–47. [Google Scholar] [CrossRef]
- Pagell, M.; Shevchenko, A. Why research in sustainable supply chain management should have no future. J. Supply Chain Manag. 2014, 50, 44–55. [Google Scholar] [CrossRef]
- Pfeffer, J. Building sustainable organizations: The human factor. Acad. Manag. Perspect. 2010, 24, 34–45. [Google Scholar]
- Rosenbloom, S.; Barbarojan, M. Green-Light Specials, Now at Wal-Mart. 2009. Available online: http://www.nytimes.com/2009/01/25/business/25walmart.html (accessed on 1 April 2017).
- Pullman, M.E.; Maloni, M.J.; Carter, C.R. Food for thought: Social versus environmental sustainability practices and performance outcomes. J. Supply Chain Manag. 2009, 45, 38–54. [Google Scholar] [CrossRef]
- Kleindorfer, P.R.; Singhal, K.; Wassenhove, L.N. Sustainable operations management. Prod. Oper. Manag. 2005, 14, 482–492. [Google Scholar] [CrossRef]
- Wiengarten, F.; Pagell, M.; Fynes, B. Supply chain environmental investments in dynamic industries: Comparing investment and performance differences with static industries. Int. J. Prod. Econ. 2012, 135, 541–551. [Google Scholar] [CrossRef]
- Awaysheh, A.; Klassen, R.D. The impact of supply chain structure on the use of supplier socially responsible practices. Int. J. Oper. Prod. Manag. 2010, 30, 1246–1268. [Google Scholar] [CrossRef]
- Zhu, Q.; Sarkis, J. The moderating effects of institutional pressures on emergent green supply chain practices and performance. Int. J. Prod. Res. 2007, 45, 4333–4355. [Google Scholar] [CrossRef]
- Sarkis, J.; Gonzalez-Torre, P.; Adenso-Diaz, B. Stakeholder pressure and the adoption of environmental practices: The mediating effect of training. J. Oper. Manag. 2010, 28, 163–176. [Google Scholar] [CrossRef]
- Baden, D.A.; Harwood, I.A.; Woodward, D.G. The effect of buyer pressure on suppliers in SMEs to demonstrate CSR practices: An added incentive or counter productive? Eur. Manag. J. 2009, 27, 429–441. [Google Scholar] [CrossRef]
- Zhu, Q.; Sarkis, J.; Lai, K.H. Confirmation of a measurement model for green supply chain management practices implementation. Int. J. Prod. Econ. 2008, 111, 261–273. [Google Scholar] [CrossRef]
- Weaver, G.R.; Trevino, L.K.; Cochran, P.L. Integrated and decoupled corporate social performance: Management commitments, external pressures, and corporate ethics practices. Acad. Manag. J. 1999, 42, 539–552. [Google Scholar]
- Sharma, S.; Henriques, I. Stakeholder influences on sustainability practices in the Canadian forest products industry. Strateg. Manag. J. 2005, 26, 159–180. [Google Scholar] [CrossRef]
- Büyüközkan, G.; Arsenyan, J. Collaborative product development: A literature overview. Prod. Plan. Control 2012, 23, 47–66. [Google Scholar] [CrossRef]
- Waage, S.A. Re-considering product design: A practical “road-map” for integration of sustainability issues. J. Clean. Prod. 2007, 15, 638–649. [Google Scholar] [CrossRef]
- Pagell, M.; Wu, Z. Building a more complete theory of sustainable supply chain management using case studies of 10 exemplars. J. Supply Chain Manag. 2009, 45, 37–56. [Google Scholar] [CrossRef]
- Parmigiani, A.; Klassen, R.D.; Russo, M.V. Efficiency meets accountability: Performance implications of supply chain configuration, control, and capabilities. J. Oper. Manag. 2011, 29, 212–223. [Google Scholar] [CrossRef]
- Klassen, R.D.; Vereecke, A. Social issues in supply chains: Capabilities link responsibility, risk (opportunity), and performance. Int. J. Prod. Econ. 2012, 140, 103–115. [Google Scholar] [CrossRef]
- Stave, G.M.; Muchmore, L.; Gardner, H. Quantifiable impact of the contract for health and wellness: Health behaviors, health care costs, disability, and workers’ compensation. J. Occup. Environ. Med. 2003, 45, 109–117. [Google Scholar] [CrossRef] [PubMed]
- Tate, W.L.; Dooley, K.J.; Ellram, L.M. Transaction cost and institutional drivers of supplier adoption of environmental practices. J. Bus. Logist. 2011, 32, 6–16. [Google Scholar] [CrossRef]
- Pullman, M.; Longoni, A.; Luzzini, D. Emerging discourse incubator: The Roles of Institutional Complexity and Hybridity in Social Impact Supply Chain Management. J. Supply Chain Manag. 2018, 54, 3–20. [Google Scholar] [CrossRef]
- Levi, M.; Linton, A. Fair trade: A cup at a time? Polit. Soc. 2003, 31, 407–432. [Google Scholar] [CrossRef]
- Jennings, P.D.; Zandbergen, P.A. Ecologically sustainable organizations: An institutional approach. Acad. Manag. Rev. 1995, 20, 1015–1052. [Google Scholar] [CrossRef]
- Min, H.; Galle, W.P. Green purchasing strategies: Trends and implications. J. Supply Chain Manag. 1997, 33, 10–17. [Google Scholar] [CrossRef]
- Othman, S.; Darus, F.; Arshad, R. The influence of coercive isomorphism on corporate social responsibility reporting and reputation. Soc. Responsib. J. 2011, 7, 119–135. [Google Scholar] [CrossRef]
- Adams, C.; Zutshi, A. Corporate social responsibility: Why business should act responsibly and be accountable. Aust. Account. Rev. 2004, 14, 31–39. [Google Scholar] [CrossRef]
- Chang, C.H.; Chen, Y.S. Green organizational identity and green innovation. Manag. Decis. 2013, 51, 1056–1070. [Google Scholar] [CrossRef]
- Chen, Y.S. Green organizational identity: Sources and consequence. Manag. Decis. 2011, 49, 384–404. [Google Scholar] [CrossRef]
- Barney, J. Firm resources and sustained competitive advantage. J. Manag. 1991, 17, 99–120. [Google Scholar] [CrossRef]
- Dierickx, I.; Cool, K. Asset stock accumulation and sustainability of competitive advantage. Manag. Sci. 1989, 35, 1504–1511. [Google Scholar] [CrossRef]
- Peteraf, M.A. The cornerstones of competitive advantage: A resource-based view. Strateg. Manag. J. 1993, 14, 179–191. [Google Scholar] [CrossRef]
- Lee, S.; Sung Rha, J.; Choi, D.; Noh, Y. Pressures affecting green supply chain performance. Manag. Decis. 2013, 51, 1753–1768. [Google Scholar] [CrossRef]
- Guang Shi, V.; Lenny Koh, S.C.; Baldwin, J.; Cucchiella, F. Natural resource based green supply chain management. Supply Chain Manag. Int. J. 2012, 17, 54–67. [Google Scholar] [CrossRef]
- Shibin, K.T.; Dubey, R.; Gunasekaran, A.; Hazen, B.; Roubaud, D.; Gupta, S.; Foropon, C. Examining sustainable supply chain management of SMEs using resource based view and institutional theory. Ann. Oper. Res. 2017, 1–26. [Google Scholar] [CrossRef]
- Hirsch, P.M. Organizational effectiveness and the institutional environment. Adm. Sci. Q. 1975, 20, 327–344. [Google Scholar] [CrossRef]
- DiMaggio, P.; Powell, W.W. The iron cage revisited: Institutional isomorphism and collective rationality in organizational fields’. Am. Sociol. Rev. 1983, 48, 147–160. [Google Scholar] [CrossRef]
- Meyer, J.W.; Rowan, B. Institutionalized organizations: Formal structure as myth and ceremony. Am. J. Social. 1977, 83, 340–363. [Google Scholar] [CrossRef]
- Zucker, L.G. Institutional theories of organization. Annu. Rev. Sociol. 1987, 13, 443–464. [Google Scholar] [CrossRef]
- Dubey, R.; Gunasekaran, A.; Ali, S.S. Exploring the relationship between leadership, operational practices, institutional pressures and environmental performance: A framework for green supply chain. Int. J. Prod. Econ. 2015, 160, 120–132. [Google Scholar] [CrossRef]
- Glover, J.L.; Champion, D.; Daniels, K.J.; Dainty, A.J.D. An Institutional Theory perspective on sustainable practices across the dairy supply chain. Int. J. Prod. Econ. 2014, 152, 102–111. [Google Scholar] [CrossRef] [Green Version]
- Choi, D.; Hwang, T. The impact of green supply chain management practices on firm performance: The role of collaborative capability. Oper. Manag. Res. 2015, 8, 69–83. [Google Scholar] [CrossRef]
- Green, K.W., Jr.; Zelbst, P.J.; Meacham, J.; Bhadauria, V.S. Green supply chain management practices: Impact on performance. Supply Chain Manag. Int. J. 2012, 17, 290–305. [Google Scholar] [CrossRef]
- Liu, X.; Yang, J.; Qu, S.; Wang, L.; Shishime, T.; Bao, C. Sustainable production: Practices and determinant factors of green supply chain management of Chinese companies. Bus. Strategy Environ. 2012, 21, 1–16. [Google Scholar] [CrossRef]
- Eltayeb, T.K.; Zailani, S.; Ramayah, T. Green supply chain initiatives among certified companies in Malaysia and environmental sustainability: Investigating the outcomes. Resour. Conserv. Recycl. 2011, 55, 495–506. [Google Scholar] [CrossRef]
- Hsu, C.C.; Tan, K.C.; Mohamad Zailani, S.H. Strategic orientations, sustainable supply chain initiatives, and reverse logistics: Empirical evidence from an emerging market. Int. J. Oper. Prod. Manag. 2016, 36, 86–110. [Google Scholar] [CrossRef]
- Perramon, J.; del Mar Alonso-Almeida, M.; Llach, J.; Bagur-Femenías, L. Green practices in restaurants: Impact on firm performance. Oper. Manag. Res. 2014, 7, 2–12. [Google Scholar] [CrossRef]
- Zhu, Q.; Sarkis, J.; Lai, K.H. Green supply chain management innovation diffusion and its relationship to organizational improvement: An ecological modernization perspective. J. Eng. Technol. Manag. 2012, 29, 168–185. [Google Scholar] [CrossRef]
- Chien, M.K.; Shih, L.H. An empirical study of the implementation of green supply chain management practices in the electrical and electronic industry and their relation to organizational performances. Int. J. Environ. Sci. Technol. (IJEST) 2007, 4, 383–394. [Google Scholar]
- Kirchoff, J.F.; Omar, A.; Fugate, B.S. A Behavioral Theory of Sustainable Supply Chain Management Decision Making in Non-exemplar Firms. J. Supply Chain Manag. 2016, 52, 41–65. [Google Scholar] [CrossRef]
- Wolf, J. The relationship between sustainable supply chain management, stakeholder pressure and corporate sustainability performance. J. Bus. Ethics 2014, 119, 317–328. [Google Scholar] [CrossRef]
- Junquera, B.; del Brío, J.Á.; Fernández, E. Clients’ involvement in environmental issues and organizational performance in businesses: An empirical analysis. J. Clean. Prod. 2012, 37, 288–298. [Google Scholar] [CrossRef]
- Mazzi, A.; Mason, C.; Mason, M.; Scipioni, A. Is it possible to compare environmental performance indicators reported by public administrations? Results from an Italian survey. Ecol. Indic. 2012, 23, 653–659. [Google Scholar] [CrossRef]
- Bessire, D.; Onnée, S. Assessing corporate social performance: Strategies of legitimation and conflicting ideologies. Crit. Perspect. Account. 2010, 21, 445–467. [Google Scholar] [CrossRef]
- Teraji, S. A model of corporate social performance: Social satisfaction and moral conduct. J. Socio-Econ. 2009, 38, 926–934. [Google Scholar] [CrossRef]
- Chien, M.K. Influences of green supply chain management practices on organizational sustainable performance. Int. J. Environ. Monit. Prot. 2014, 1, 12–23. [Google Scholar]
- Perez, F.; Sanchez, L.E. Assessing the evolution of sustainability reporting in the mining sector. Environ. Manag. 2009, 43, 949–961. [Google Scholar] [CrossRef] [PubMed]
- Flynn, B.; Pagell, M.; Fugate, B. Survey Research Design in Supply Chain Management: The Need for Evolution in Our Expectations. J. Supply Chain Manag. 2018, 54, 1–15. [Google Scholar] [CrossRef]
- Ketchen, D.J.; Craighead, C.W.; Cheng, L. Achieving research design excellence through the pursuit of perfection: Toward strong theoretical calibration. J. Supply Chain Manag. 2018, 54, 16–22. [Google Scholar] [CrossRef]
- Krause, D.; Luzzini, D.; Lawson, B. Building the Case for a Single Key Informant in Supply Chain Management Survey Research. J. Supply Chain Manag. 2018, 54, 42–50. [Google Scholar] [CrossRef]
- World Bank. Foreign Direct Investment, Net Inflows (% of GDP); World Bank: Washington, DC, USA, 2016; Available online: http://data.worldbank.org/indicator/BX.KLT.DINV.WD.GD.ZS (accessed on 18 March 2016).
- MITI. Malaysia Attracted FDI of 38.774 BIL in 2013. 2014. Available online: http://www.miti.gov.my/cms/content.jsp?id=com.tms.cms.article.Article_2e1c1e4f-c0a8156f-4b8f2f00-e6a77239&curpage=tt (accessed on 20 November 2015).
- BNM. Bank Negara Malaysia Annual Report. 2015. Available online: http://www.bnm.gov.my/files/publication/ar/en/2015/ar2015_book.pdf (accessed on 12 April 2016).
- MITI. MITI Weekly Bulletin. 2014. Available online: http://www.miti.gov.my/cms/documentstorage/com.tms.cms.document.Document_8fe91317-c0a8156f-4b8f2f00-b41b196b/ (accessed on 20 November 2015).
- Federation of Malaysian Manufacturers (FMM) Directory. Malaysian Industries, 45th ed.; Federation of Malaysian Manufacturers: Kuala Lumpur, Malaysia, 2015. [Google Scholar]
- Son, J.Y.; Benbasat, I. Organizational buyers’ adoption and use of B2B electronic marketplaces: Efficiency-and legitimacy-oriented perspectives. J. Manag. Inf. Syst. 2007, 24, 55–99. [Google Scholar] [CrossRef]
- Hoejmose, S.U.; Grosvold, J.; Millington, A. The effect of institutional pressure on cooperative and coercive ‘green’supply chain practices. J. Purch. Supply Manag. 2014, 20, 215–224. [Google Scholar] [CrossRef]
- Marshall, D.; McCarthy, L.; Heavey, C.; McGrath, P. Environmental and social supply chain management sustainability practices: Construct development and measurement. Prod. Plan. Control 2015, 26, 673–690. [Google Scholar] [CrossRef]
- Zailani, S.; Jeyaraman, K.; Vengadasan, G.; Premkumar, R. Sustainable supply chain management (SSCM) in Malaysia: A survey. Int. J. Prod. Econ. 2012, 140, 330–340. [Google Scholar] [CrossRef]
- Zhu, Q.; Cordeiro, J.; Sarkis, J. Institutional pressures, dynamic capabilities and environmental management systems: Investigating the ISO 9000–Environmental management system implementation linkage. J. Environ. Manag. 2013, 114, 232–242. [Google Scholar] [CrossRef] [PubMed]
- Ringle, C.M.; Wende, S.; Becker, J.M. SmartPLS 3; SmartPLS: Hamburg, Germany, 2014. [Google Scholar]
- Hair, J.F.; Hult, G.T.M.; Ringle, C.M.; Sarstedt, M. A Primer on Partial Least Squares Structural Equation Modeling; Sage: Thousand Oaks, CA, USA, 2014. [Google Scholar]
- Fornell, C.; Larcker, D.F. Evaluating structural equation models with unobservable variables and measurement error. J. Mark. Res. 1981, 18, 39–50. [Google Scholar] [CrossRef]
- Podsakoff, P.M.; MacKenzie, S.B.; Lee, J.Y.; Podsakoff, N.P. Common method biases in behavioral research: A critical review of the literature and recommended remedies. J. Appl. Psychol. 2003, 88, 879–903. [Google Scholar] [CrossRef] [PubMed]
- Podsakoff, P.M.; Organ, D.W. Self-reports in organizational research: Problems and prospects. J. Manag. 1986, 12, 531–544. [Google Scholar] [CrossRef]
- Hulland, J. Use of partial least squares (PLS) in strategic management research: A review of four recent studies. Strateg. Manag. J. 1999, 20, 195–204. [Google Scholar] [CrossRef]
- Cohen, J. Statistical Power Analysis for the Behavioral Sciences, 2nd ed.; Elsevier: New York, NY, USA, 1977. [Google Scholar]
- Yu, W.; Ramanathan, R. Environmental management practices and environmental performance: The roles of operations and marketing capabilities. Ind. Manag. Data Syst. 2016, 116, 1201–1222. [Google Scholar] [CrossRef]
- Davis, L.; North, D. Institutional change and American economic growth: A first step towards a theory of institutional innovation. J. Econ. Hist. 1988, 30, 131–149. [Google Scholar] [CrossRef]
- Esfahbodi, A.; Zhang, Y.; Watson, G. Sustainable supply chain management in emerging economies: Trade-offs between environmental and cost performance. Int. J. Prod. Econ. 2016, 181, 350–366. [Google Scholar] [CrossRef]
- Longoni, A.; Cagliano, R. Environmental and social sustainability priorities: Their integration in operations strategies. Int. J. Oper. Prod. Manag. 2015, 35, 216–245. [Google Scholar] [CrossRef]
- Silvestre, B.S. Sustainable supply chain management in emerging economies: Environmental turbulence, institutional voids and sustainability trajectories. Int. J. Prod. Econ. 2015, 167, 156–169. [Google Scholar] [CrossRef]
- Al-bdour, A.A.; Nasruddin, E.; Lin, S.K. The relationship between internal corporate social responsibility and organizational commitment within the banking sector in Jordan. Int. J. Hum. Soc. Sci. 2010, 5, 932–951. [Google Scholar]
- Tseng, M.L.; Wu, W.W.; Lin, Y.H.; Liao, C.H. An exploration of relationships between environmental practice and manufacturing performance using the PLS path modeling. WSEAS Trans. Environ. Dev. 2008, 4, 487–502. [Google Scholar]
- Zhang, S.; Wang, Z.; Zhao, X.; Zhang, M. Effects of institutional support on innovation and performance: Roles of dysfunctional competition. Ind. Manag. Data Syst. 2017, 117, 50–67. [Google Scholar] [CrossRef]
Figure 1.
Conceptual model.

Figure 2.
Result of second-order factor t-value (PLS diagram).

Table 1.
Result of t-test for nonresponse bias (n = 193).
| Variable | Respondent | Mean | Std. Division | t-Value | Sig. |
|---|---|---|---|---|---|
| Environmental Institutional Pressures | Early | 3.545 | 0.755 | 1.122 | 0.263 |
| Late | 3.435 | 0.580 | |||
| Social Institutional Pressures | Early | 3.274 | 0.744 | −0.188 | 0.851 |
| Late | 3.294 | 0.681 | |||
| Environmental Organizational Identity | Early | 3.587 | 0.705 | −0.200 | 0.841 |
| Late | 3.607 | 0.640 | |||
| Social Organizational Identity | Early | 3.219 | 0.774 | −0.699 | 0.485 |
| Late | 3.299 | 0.748 | |||
| Environmental Monitoring | Early | 3.526 | 0.734 | 1.238 | 0.217 |
| Late | 3.403 | 0.616 | |||
| Environmental Management Systems | Early | 3.187 | 0.786 | −1.440 | 0.151 |
| Late | 3.323 | 0.526 | |||
| Environmental New Product & Process Development | Early | 3.511 | 0.661 | −0.399 | 0.691 |
| Late | 3.550 | 0.625 | |||
| Environmental Redefinition | Early | 3.444 | 0.691 | −1.018 | 0.310 |
| Late | 3.544 | 0.623 | |||
| Social Monitoring | Early | 3.571 | 0.816 | −0.737 | 0.462 |
| Late | 3.659 | 0.774 | |||
| Social Management Systems | Early | 3.015 | 0.808 | −1.514 | 0.132 |
| Late | 3.191 | 0.744 | |||
| Social New Product & Process Development | Early | 3.310 | 0.786 | 0.434 | 0.665 |
| Late | 3.260 | 0.745 | |||
| Social Redefinition | Early | 3.105 | 0.638 | −0.317 | 0.752 |
| Late | 3.135 | 0.635 | |||
| Economic Performance | Early | 4.940 | 1.004 | 0.240 | 0.811 |
| Late | 4.903 | 1.052 | |||
| Environmental Performance | Early | 5.034 | 1.179 | 1.364 | 0.174 |
| Late | 4.788 | 1.200 | |||
| Social Performance | Early | 5.081 | 0.979 | 0.852 | 0.395 |
| Late | 4.954 | 0.985 |
Note. Early refers to the 67 on-time respondents; late refers to the remaining 126 late respondents. The t-value is non-significant (p > 0.05).
Table 2.
Results of measurement model evaluation.
| Construct | Item | Loadings | CR a | AVE b |
|---|---|---|---|---|
| Economic Performance | ECOP1 | 0.887 | 0.951 | 0.831 |
| ECOP2 | 0.920 | |||
| ECOP3 | 0.937 | |||
| ECOP4 | 0.901 | |||
| Environmental Institutional Pressures | EIP1 | 0.706 | 0.900 | 0.602 |
| EIP2 | 0.706 | |||
| EIP3 | 0.827 | |||
| EIP4 | 0.853 | |||
| EIP5 | 0.771 | |||
| EIP6 | 0.781 | |||
| Environmental Monitoring | EM1 | 0.831 | 0.900 | 0.692 |
| EM2 | 0.754 | |||
| EM3 | 0.878 | |||
| EM4 | 0.860 | |||
| Environmental Management Systems | EMS1 | 0.847 | 0.884 | 0.656 |
| EMS2 | 0.865 | |||
| EMS3 | 0.822 | |||
| EMS4 | 0.696 | |||
| Environmental New Product & Process Development | ENPPD1 | 0.883 | 0.916 | 0.732 |
| ENPPD2 | 0.881 | |||
| ENPPD3 | 0.801 | |||
| ENPPD4 | 0.856 | |||
| Environmental Performance | ENVP1 | 0.962 | 0.973 | 0.898 |
| ENVP2 | 0.941 | |||
| ENVP3 | 0.923 | |||
| ENVP4 | 0.964 | |||
| Environmental Organizational Identity | EOI1 | 0.794 | 0.940 | 0.722 |
| EOI2 | 0.857 | |||
| EOI3 | 0.859 | |||
| EOI4 | 0.892 | |||
| EOI5 | 0.829 | |||
| EOI6 | 0.862 | |||
| Environmental Redefinition | ESR1 | 0.782 | 0.895 | 0.682 |
| ESR2 | 0.773 | |||
| ESR3 | 0.878 | |||
| ESR4 | 0.864 | |||
| Social Institutional Pressures | SIP1 | 0.725 | 0.928 | 0.685 |
| SIP2 | 0.817 | |||
| SIP3 | 0.840 | |||
| SIP4 | 0.924 | |||
| SIP5 | 0.845 | |||
| SIP6 | 0.802 | |||
| Social Monitoring | SM1 | 0.856 | 0.929 | 0.767 |
| SM2 | 0.852 | |||
| SM3 | 0.926 | |||
| SM4 | 0.866 | |||
| Social Management Systems | SMS1 | 0.816 | 0.918 | 0.738 |
| SMS2 | 0.907 | |||
| SMS3 | 0.889 | |||
| SMS4 | 0.822 | |||
| Social New Product & Process Development | SNPPD1 | 0.946 | 0.965 | 0.875 |
| SNPPD2 | 0.934 | |||
| SNPPD3 | 0.960 | |||
| SNPPD4 | 0.899 | |||
| Social Performance | SOCP1 | 0.903 | 0.948 | 0.784 |
| SOCP2 | 0.905 | |||
| SOCP3 | 0.839 | |||
| SOCP4 | 0.926 | |||
| SOCP5 | 0.851 | |||
| Social Organizational Identity | SOI1 | 0.847 | 0.960 | 0.799 |
| SOI2 | 0.909 | |||
| SOI3 | 0.906 | |||
| SOI4 | 0.895 | |||
| SOI5 | 0.921 | |||
| SOI6 | 0.883 | |||
| Social Redefinition | SSR1 | 0.736 | 0.880 | 0.649 |
| SSR2 | 0.781 | |||
| SSR3 | 0.848 | |||
| SSR4 | 0.851 |
a Composite reliability (CR) = (square of the summation of the factor loadings)/{(square of the summation of the factor loadings) + (square of the summation of the error variances)}. b Average variance extracted (AVE) = (summation of the square of the factor loadings)/{(summation of the square of the factor loadings) + (summation of the error variances)}.
Table 3.
Discriminant validity.
| ECOP | EIP | EM | EMS | ENPPD | ENVP | EOI | ESR | SIP | SM | SMS | SNPPD | SOCP | SOI | SSR | |
|---|---|---|---|---|---|---|---|---|---|---|---|---|---|---|---|
| ECOP | 0.912 | ||||||||||||||
| EIP | 0.614 | 0.776 | |||||||||||||
| EM | 0.643 | 0.713 | 0.835 | ||||||||||||
| EMS | 0.587 | 0.551 | 0.699 | 0.823 | |||||||||||
| ENPPD | 0.628 | 0.573 | 0.613 | 0.550 | 0.850 | ||||||||||
| ENVP | 0.847 | 0.630 | 0.701 | 0.618 | 0.629 | 0.947 | |||||||||
| EOI | 0.509 | 0.702 | 0.647 | 0.521 | 0.561 | 0.606 | 0.850 | ||||||||
| ESR | 0.672 | 0.535 | 0.621 | 0.593 | 0.714 | 0.687 | 0.550 | 0.824 | |||||||
| SIP | 0.357 | 0.418 | 0.298 | 0.296 | 0.384 | 0.392 | 0.392 | 0.405 | 0.832 | ||||||
| SM | 0.413 | 0.237 | 0.394 | 0.481 | 0.532 | 0.422 | 0.258 | 0.463 | 0.399 | 0.883 | |||||
| SMS | 0.333 | 0.320 | 0.383 | 0.527 | 0.466 | 0.350 | 0.294 | 0.518 | 0.506 | 0.691 | 0.859 | ||||
| SNPPD | 0.417 | 0.439 | 0.417 | 0.451 | 0.537 | 0.486 | 0.334 | 0.480 | 0.507 | 0.585 | 0.620 | 0.936 | |||
| SOCP | 0.673 | 0.502 | 0.483 | 0.480 | 0.509 | 0.724 | 0.378 | 0.550 | 0.521 | 0.451 | 0.450 | 0.522 | 0.885 | ||
| SOI | 0.318 | 0.286 | 0.324 | 0.353 | 0.396 | 0.381 | 0.443 | 0.341 | 0.710 | 0.416 | 0.423 | 0.545 | 0.380 | 0.895 | |
| SSR | 0.383 | 0.316 | 0.405 | 0.401 | 0.471 | 0.430 | 0.254 | 0.496 | 0.449 | 0.445 | 0.525 | 0.721 | 0.499 | 0.566 | 0.802 |
Note 1: Diagonals (in bold) represent the square root of average variance extracted (AVE) while the off-diagonals represent the correlations. Note 2: ECOP: economic performance; EIP: environmental institutional pressures; EM: environmental monitoring; EMS: environmental management system, ENPPD: environmental new product & process development; ENVP: environmental performance; EOI: environmental organizational Identity; ESR: environmental redefinition; SIP: social institutional pressures; SM: social monitoring; SMS: social management system, SNPPD: social supply chain new product & process development; SNVP: social performance; SOI: social organizational identity; SSR: Social redefinition.
Table 4.
Hypotheses testing.
| Relationship | Coefficient | t-Value | Decision |
|---|---|---|---|
| EIP -> EMBP2 | 0.336 | 3.655 ** | Supported |
| EIP -> EPBP2 | 0.426 | 5.061 ** | Supported |
| EMBP2 -> ECOP | 0.119 | 1.564** | Not Supported |
| EMBP2 -> ENVP | 0.449 | 8.084 ** | Supported |
| ENVP -> ECOP | 0.611 | 9.524 ** | Supported |
| EOI -> EMBP2 | 0.416 | 5.081 ** | Supported |
| EOI -> EPBP2 | 0.378 | 5.083 ** | Supported |
| EPBP2 -> ECOP | 0.131 | 2.108 ** | Supported |
| EPBP2 -> ENVP | 0.418 | 6.841 ** | Supported |
| SIP -> SMBP2 | 0.189 | 1.935 ** | Supported |
| SIP -> SPBP2 | 0.249 | 2.305 ** | Supported |
| SMBP2 -> ECOP | −0.058 | 1.159** | Not Supported |
| SMBP2 -> SOCP | 0.464 | 6.940 ** | Supported |
| SOCP -> ECOP | 0.145 | 2.148 ** | Supported |
| SOI -> SMBP2 | 0.339 | 3.910 ** | Supported |
| SOI -> SPBP2 | 0.125 | 1.083** | Not Supported |
| SPBP2 -> ECOP | −0.020 | 0.405** | Not Supported |
| SPBP2 -> SOCP | 0.210 | 2.646 ** | Supported |
Note 1: ** p < 0.01 (2.33), * p < 0.05 (1.645). Note 2: ECOP: Economic Performance; EIP: Environmental Institutional Pressures; EOI: Environmental Organizational Identity; ENVP: Environmental Performance, EPBP2: Environmental Process-based Practices; EMBP2: Environmental Market-based Practices; SIP: Social Institutional Pressures; SOI: Social Organizational Identity; SNVP: Social Performance; SOI: Social Organizational Identity; SPBP2: Social Process-based Practices; SMBP2: Social Market-based Practices.
© 2018 by the authors. Licensee MDPI, Basel, Switzerland. This article is an open access article distributed under the terms and conditions of the Creative Commons Attribution (CC BY) license (http://creativecommons.org/licenses/by/4.0/).
Share and Cite
MDPI and ACS Style
Thong, K.-C.; Wong, W.-P. Pathways for Sustainable Supply Chain Performance—Evidence from a Developing Country, Malaysia. Sustainability 2018, 10, 2781. https://doi.org/10.3390/su10082781
AMA Style
Thong K-C, Wong W-P. Pathways for Sustainable Supply Chain Performance—Evidence from a Developing Country, Malaysia. Sustainability. 2018; 10(8):2781. https://doi.org/10.3390/su10082781
Chicago/Turabian StyleThong, Kai-Chong, and Wai-Peng Wong. 2018. "Pathways for Sustainable Supply Chain Performance—Evidence from a Developing Country, Malaysia" Sustainability 10, no. 8: 2781. https://doi.org/10.3390/su10082781
Note that from the first issue of 2016, this journal uses article numbers instead of page numbers. See further details here.