1. Introduction
Photovoltaics (PV) are increasingly common in modern electrical power system around the world, with 74 GW of PV installations world-wide in 2016. For example, UK Government statistics show that at least 12.6 GW of PV has been installed by November 2017 [
1]. Although PV helps contribute to a decarbonised energy supply, they change the operation of electricity networks, particularly for domestic installations since they are widely installed in random locations in the system [
2]. One specific impact of reverse power flow from PV is overvoltage, which can lead to generation curtailment during times of low demand [
3]. This means that existing grids may need to be upgraded to accommodate increasing amounts of PV [
4]. This can be a particular issue in low voltage (LV) networks due to the expansion of residential PV systems and is a challenge for distribution network operators (DNOs). Energy storage is recognised as one technology which can prevent overvoltage by reducing PV export into the grid [
5,
6,
7].
From a DNOs perspective, it is important to anticipate how widespread voltage problems will be and how expensive they will be to overcome. This can be achieved by assessing a large number of LV networks under differing PV integration scenarios. LV models can be automatically generated using a statistical approach [
8] or using cluster analysis to develop prototypical feeders [
9]. This can develop a large number of network models, but there is no guarantee that these are entirely representative of a particular DNO area. Scottish and Southern Energy (SSE) trialled a computational procedure to extract representative network models from GIS (geographic information system) data. This was performed over a small section of network to investigate the impact of PV, electric vehicles and heat pumps [
10]. Despite the availability of such techniques for network model extraction from GIS, there are few examples of using a large number of such models to assess PV or storage across a wide number of LV networks. Storage is becoming increasingly common due to the advent of new home storage products and has a number of benefits to homeowners such as bill reduction and increased PV self-consumption as part of a home energy management system [
11,
12]. Batteries can reduce grid consumption by more than 70% in some cases [
13]. Energy storage offers benefits to DNOs and domestic storage has the potential to provide other roles in a “smart” electricity system [
14]. These include network support, infrastructure upgrade deferral and ancillary services. Aggregating these provides the most benefits [
15].
Although beneficial to homeowners, consideration of the benefits of storage for both homes with PV and the wider power system is important. If batteries are sized for home use, they may be fully charged by midday, and therefore not contributing to reduce reverse power flow into the grid and consequent voltage rise [
12,
16]. To address this, battery charging/discharging control needs to reflect both the needs of the customer and network and/or system operators.
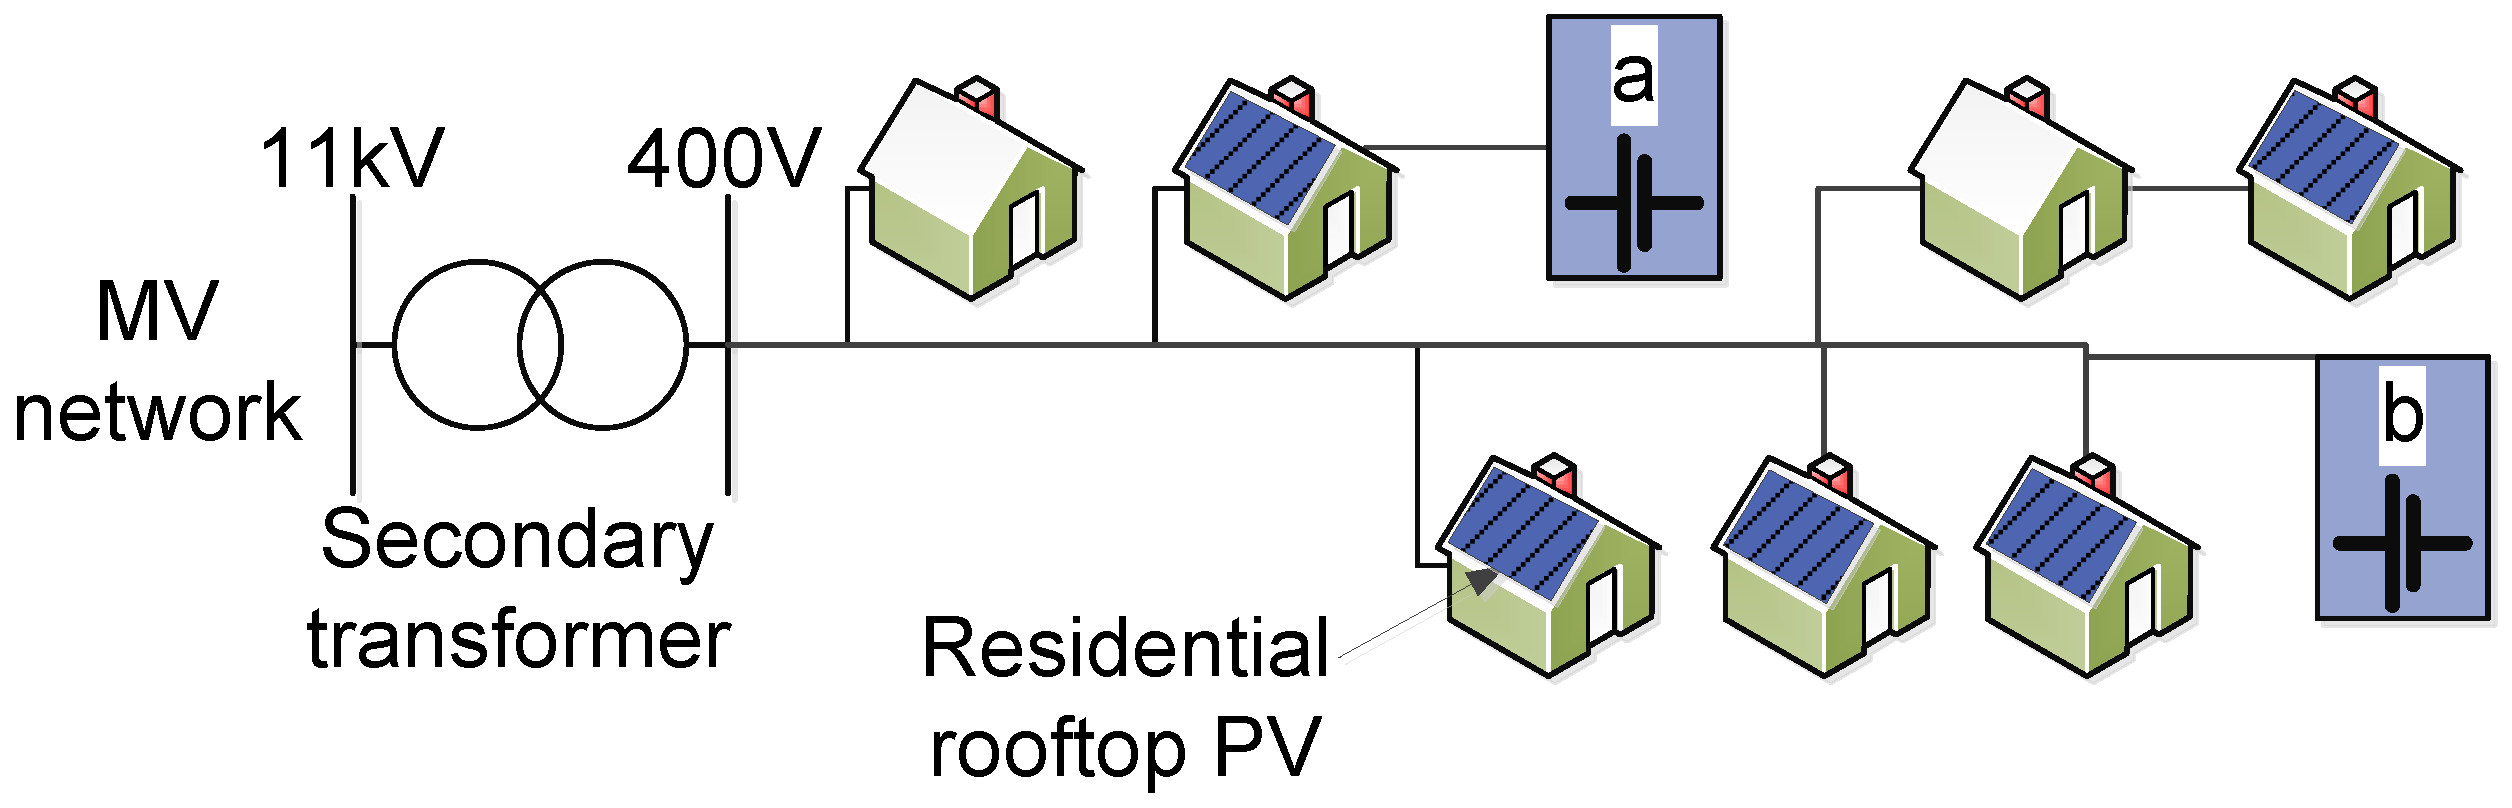
There are two distinct propositions for storage in LV networks investigated: (1) installation by homeowners and commercial customers for increased self-consumption and (2) installation directly onto the grid by electricity network operators to manage network power flow (
Figure 1). These propositions have previously been studied by the authors and others on a small number of networks [
17,
18] and in this paper we show the propositions over a large number of networks and draw deeper insights by doing so.
For network operators, there is a specific problem in modelling the cost impact of solar PV and energy storage across a wide number of their networks. This is because much work in the study of PV has focused on specific planning tools on a small number of “typical” networks. In this paper we assess whether a new planning framework can perform a techno–economic comparison of battery energy storage propositions across an entire fleet of LV networks in one study. Specifically, we apply the framework to 9163 LV networks derived from a UK DNO’s GIS network map. By doing so this paper addresses two challenges:
Comparison of storage in homes to energy storage directly on the network (referred to here as “on the street”) as a means of regulating LV network voltages.
Examination of a financial case for storage in LV networks.
2. Theory
LV networks in the UK are made up of one or more secondary transformers and one or more LV feeders. The LV feeders can split into different branches. Loads are connected to the feeders along their length. In urban-residential LV networks, the feeders are usually three phase, four core cables and loads are usually single phase at 230 V nominal. In the UK, the voltage must not fall below 217 V for 95% of the weekly 10 min rms values, and must be within the range 195.5–253 V at all times. Overvoltage, even for a short time, is specifically banned under British and European standards [
19].
One of the impacts that PV has on networks is overvoltage. This is as a result of the PV injecting power into the network and creating voltage rise,
The headroom for voltage rise in an LV network is the total allowable voltage deviation in a network minus the total voltage deviation at the secondary transformer,
and the highest voltage drop across the LV network,
, as in:
where
n is the index of
N networks and
Vs is a safety margin.
A network is considered to have overvoltage if equality (1) is exceeded. In this paper, it is assumed that the voltage at the secondary transformer has its highest and lowest values when the LV voltages are highest and lowest (to avoid needing MV network modelling). Consequently, a safety margin, VS, of 0.01 p.u. is applied in (1). The maximum voltage drop occurs when there is maximum demand and minimum generation. Similarly, voltage rise is highest when PV is exporting maximum power and demand is lowest. This approach means that two loading conditions (high and low voltage) need to be modelled to determine if a network always operates within voltage limits. Accordingly, it allows many networks to be assessed using reasonable computational effort.
3. Method
In this paper, we propose a new method for comparative analysis of energy storage integration across a wide number of networks. The results of applying this to a wide variety of networks presents a novel contribution to the scale of overvoltage issues and the present and future ability of energy storage to mitigate these issues.
A number of tools have been combined to examine the following factors for LV networks.
The impact of output from randomly located residential PV on LV voltage, and quantification of the number of networks with overvoltage.
The reduction in overvoltage if storage is randomly located in homes with PV systems.
The minimum amount of storage needed on the street to prevent overvoltage.
An algorithm is proposed to compare strategies, from the perspective of a network operator, for deploying energy storage in low voltage networks to mitigate the overvoltage issues associated with domestic solar PV installations. The algorithm performs simulation and evaluation to determine the strategy with the lowest reinforcement cost for the DNO across all of their networks, thus providing a view of their whole system. In the following section this method is explained in detail including the formulae used to establish and evaluate the alternative storage scenarios.
3.1. Network Models
The method outlined in
Figure 2 is designed to assess a number,
N, of LV networks in a loop. Firstly, a model is built of each network,
n. Loads are set at their maximum value with no PV installed and the voltage drop,
, is determined using a load flow.
In order to provide comparative analysis, the method first stochastically locates solar PV within the network. Critically, the location of the PV is kept constant whilst an assessment of DNO located storage is performed (box 1). The storage from this algorithm is removed from the model and then a second tool is used (box 2) to assess storage randomly installed in domestic properties. This means that both location methods are compared to the same underlying solar PV distribution.
3.2. Assessment of PV on Voltage
To examine the impact of randomly located PV on residential LV networks, a stochastic procedure is used. This is similar to approaches used in [
20,
21] but applied specifically to assess overvoltage due to residential PV. Each home in
n, has a fixed probability,
pn, of installing PV of rating
PPV. To determine the voltage rise,
, all loads are set to their minimum daytime value and all PV is set to export rated power. A load flow then calculates voltages. If overvoltage is found, then a storage assessment is performed.
3.3. Energy Storage Assessments
3.3.1. DNO Owned Energy Storage
If DNOs are to use storage in networks to provide voltage support, the storage needs to be correctly located to provide the voltage support for the lowest cost [
22]. Procedures for locating storage include genetic algorithms [
23]. In this paper, a genetic algorithm is used as this has been shown to be able to determine storage locations in LV networks in a short time [
24]. This attempts to minimise the total installation cost of storage within the network, but with a fixed penalty if that network exceeds voltage limits. Each population member in the algorithm is a binary number which defines whether storage is installed at each of the nodes of the network and the algorithm returns the combination of storage locations in network,
n, which eliminates overvoltage for the lowest cost. As opposed to the work in [
24] the genetic algorithm is implemented using a genetic algorithm in the Matlab Global Optimisation Toolbox (see
Figure 2, box 1) and the fitness function has been simplified to just contain the cost of energy storage. The genetic algorithm converges to a solution that prevents overvoltage with fewest storage units in the network. A fitness function is developed to attribute a cost to each set of storage locations. The fitness function,
f is the number of storage units,
NES, multiplied by the cost of each,
CES, plus a penalty if it does not prevent overvoltage:
The penalty,
ρ is multiplied by the total overvoltage
Vdev. In [
25], a
ρ of 150,000 is found to be an appropriate penalty to allow the optimisation to converge to a minimal cost solution. Storage is assumed to be of the same rating,
PES, is 3-phase and can be located at any network node.
3.3.2. Energy Storage Owned by Customers
Once the case for DNO storage is completed, an assessment is performed to determine if storage randomly purchased by homeowners can reduce the number of networks which experience overvoltage, and how much re-conductoring will be required by DNOs to prevent overvoltage in each case. To do so, for each network, a proportion
qn of the homes with PV purchase and install an energy storage system. As shown in
Figure 2, box 2, this is assessed using a loop.
All storage is first taken out of the network and then reinstalled in each home with PV with probability qn. A load flow is then used to calculate the voltage rise, . If there is over-voltage, this is recorded. This process is repeated for all storage dispersion levels qn. Storage is represented as a load charging to absorb excess PV with rating PES.
3.4. Description of Case Study
An outline of the case study is now given. It is implemented in Matlab using OpenDSS network models for load flows.
3.4.1. Extracting LV Networks
In this study, 9163 LV networks have been extracted from a DNOs GIS. The GIS details the location of all of the LV cables, secondary transformers and homes and is a mandatory requirement for network operators in Britain [
26]. A customised procedure for extracting the LV networks has been developed for this paper as described in [
24,
25]. This is a similar approach to [
10]. A DNO from the North West of England (ENWL) provided the GIS. They operate a distribution network serving around 5 million people.
To ensure the reliability of the GIS extraction process, only networks that conform to the criteria in
Table 1 are used. The criteria describe typical characteristics of networks serving predominantly residential loads. All are radial and comprise underground cables as is common on this ENWL system (and typical for many other urban locations in the UK).
Table 2 summarises the network properties and gives the re-conductoring cost, based on the DNO’s figure of £80/m.
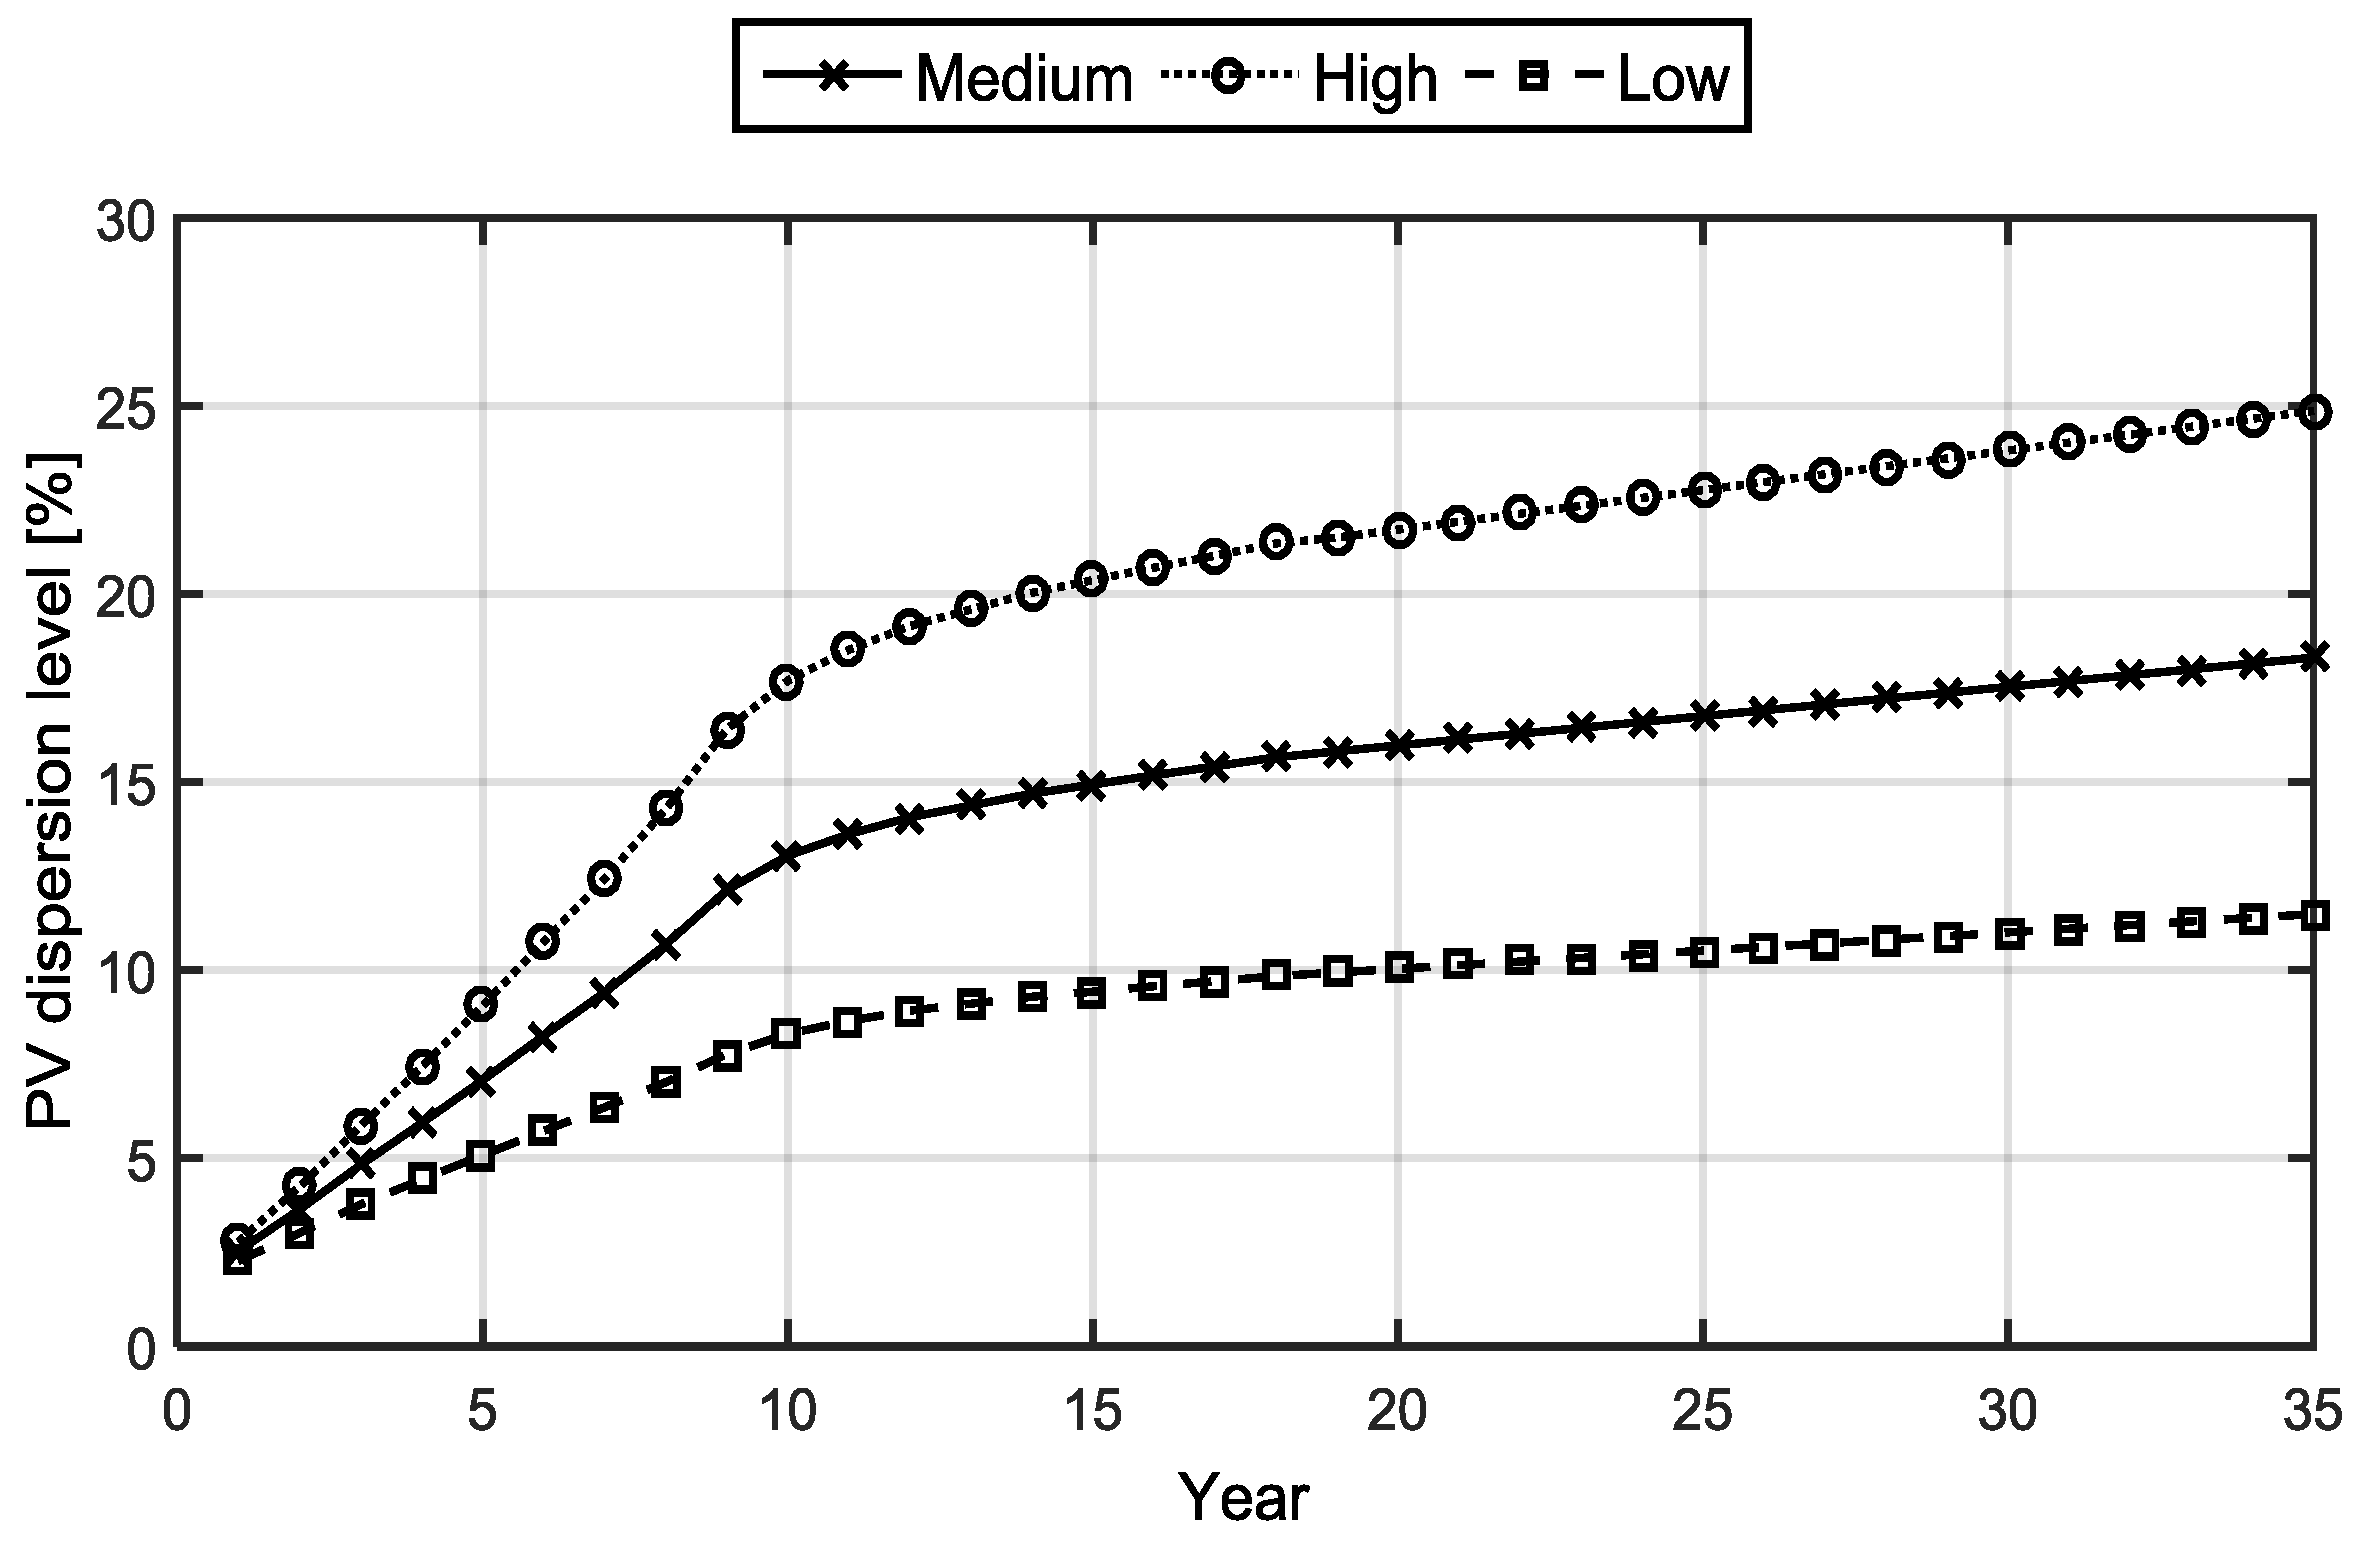
3.4.2. PV Scenarios
A forecast of how PV is expected to be installed has been provided by ENWL (
Figure 3). This has been combined with GIS data showing the number of homes with roofs facing ±50° of due south (
Table 2) to give projected PV dispersion levels,
pn in each network
n. Each PV installation is assumed to have a capacity of
PPV = 3.6 kWp as this is the average size in the ENWL network.
3.4.3. Energy Storage Scenarios
Two energy storage scenarios are considered:
Storage is located in homes by PV owners who want to maximise their self-consumption. These are purchased in a free market so, like PV, the DNO cannot determine where they will be located. It is assumed storage will absorb peak generation i.e., it has a rating of PES = 3.6 kW and is single phase.
Storage is located in the street by the DNO to alleviate overvoltage. Three phase 25 kW units are selected based upon a survey of similar systems [
27,
28]. Locations are determined using the genetic algorithm described previously.
3.4.4. Loads
To determine the voltage ranges on the network, we perform two load flows to determine the maximum and minimum voltage. This avoids the computational effort of a high resolution load flow analysis and allows the model to determine the performance limits of the networks. In accordance with ENWL design policy, the after diversity maximum demand (ADMD) of domestic customers is 1.4 kW or 1 kW. To identify which is appropriate for each LV network,
n, a maximum demand of 1.4 kW is applied to each load in the network. If this causes under-voltage, a 1 kW ADMD is instead applied. The minimum daytime demand is assumed to be 0.142 kW [
29]. The minimum and maximum demands are based on measurements of secondary transformers in real LV networks by the DNO.
3.4.5. MV Network Voltage Deviation
Since the GIS model has not been used to generate MV network models, assumed MV network voltage ranges,
, need to be applied. Here, the MV voltage deviation is calculated using two voltage sensitivity factors from network nodes on a typical ENWL urban MV feeder. These are shown below (3) and (4). Each network is randomly assigned to one of these two factors to determine the voltage headroom. The parameter
X is defined by (5) and varies depending on whether the scenario is without storage, with domestic storage, or with storage connected directly onto the network.
3.4.6. Financial Model
At the time of writing, lithium ion batteries represent the most widely deployed battery type in residential power networks. Lithium battery prices have fallen 45% in the period 2016–2017, so the costs used here must be understood as those valid at the time of writing and therefore are likely an underestimate as battery costs fall. Representative battery costs have been sourced through an industrial survey as well as literature search [
30].
The model in [
31] is adapted to calculate the storage cost. Here, the discounted storage cost,
CES, is the sum of capital,
CCAP, discounted maintenance,
CM, losses,
CL, and replacement,
CRP, Equations (7)–(10).
CP is the cost of power, and
CC is the discounted cost of energy. Storage parameters and costs are shown in
Table 3.
3.4.7. Reinforcement Costs
For all LV feeders, the reinforcement cost is the product of the length of a feeder and the unit cost of reinforcement. The budgetary unit cost used by the DNO is £80/m as described in
Section 3.4.1.
4. Results
4.1. Base Case
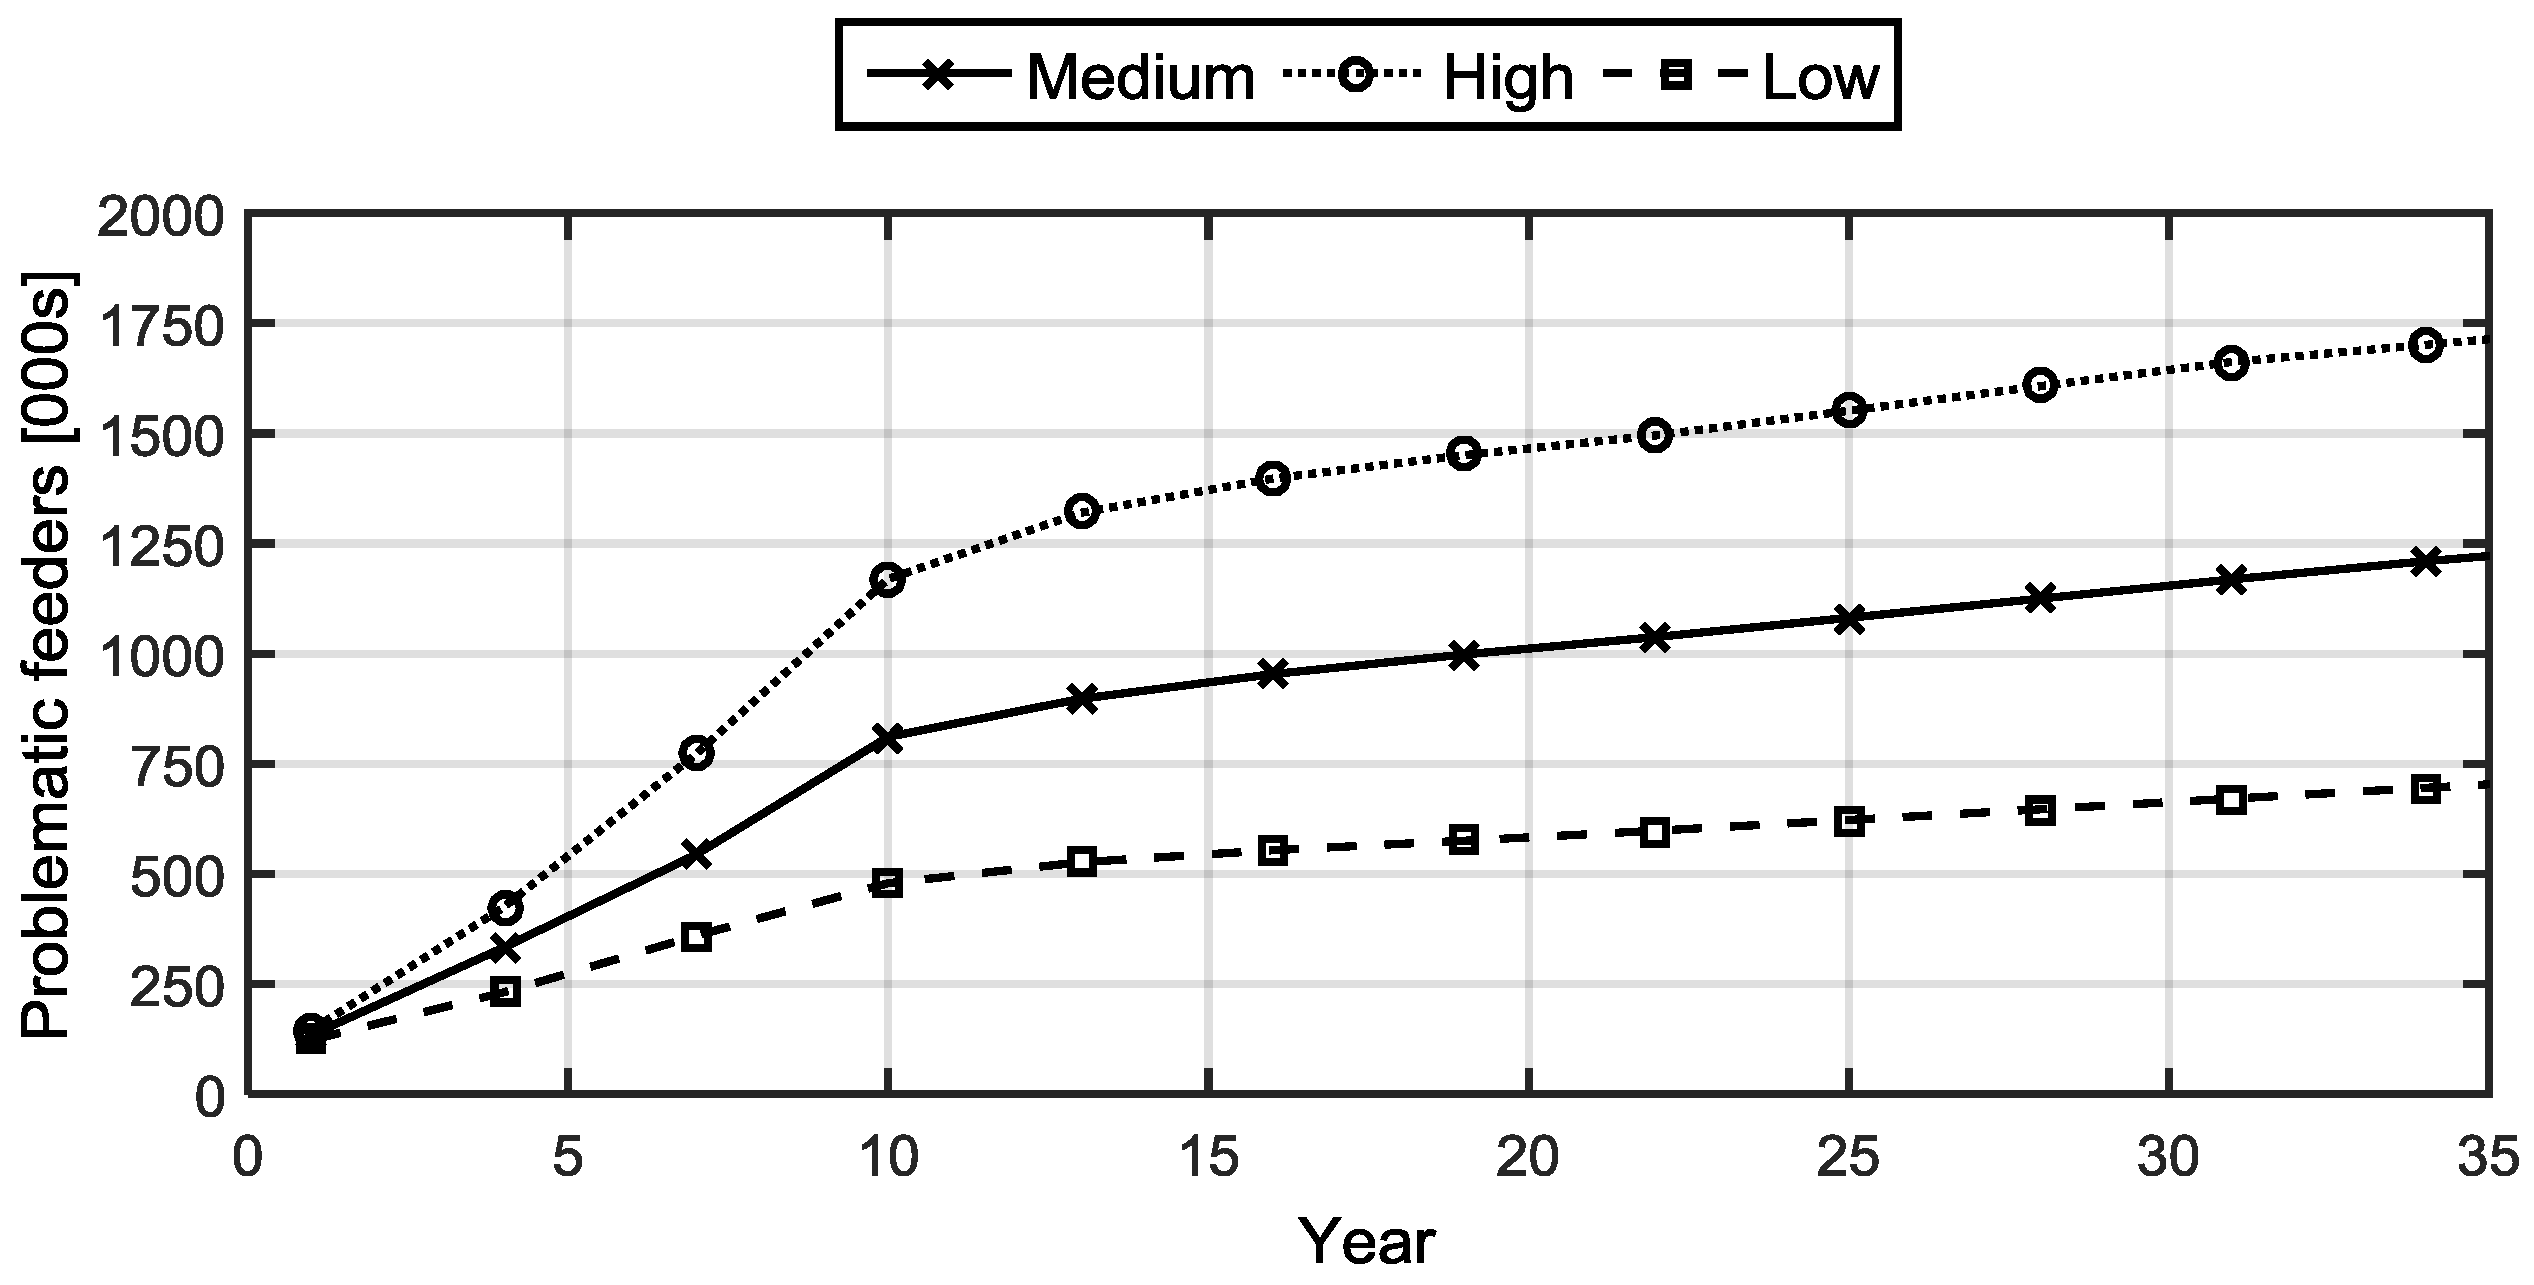
The method is first used to study the effect of PV on the LV network.
Figure 4 shows the number of feeders from the GIS data which are forecast to experience overvoltage. It can be seen that the number of problematic feeders follows the same trend as the PV growth scenarios. The number of problematic feeders is different between the scenarios however. Of the 43,816 feeders assessed, only a small fraction is found to experience voltage issues due to PV integration. This is important, as it shows that most of the LV networks will be able to withstand the projected PV growth. DNOs need to identify the specific problematic feeders in their networks and provide mitigation solutions. This cannot be achieved by studies on generic networks, the actual networks on the ground need to be assessed.
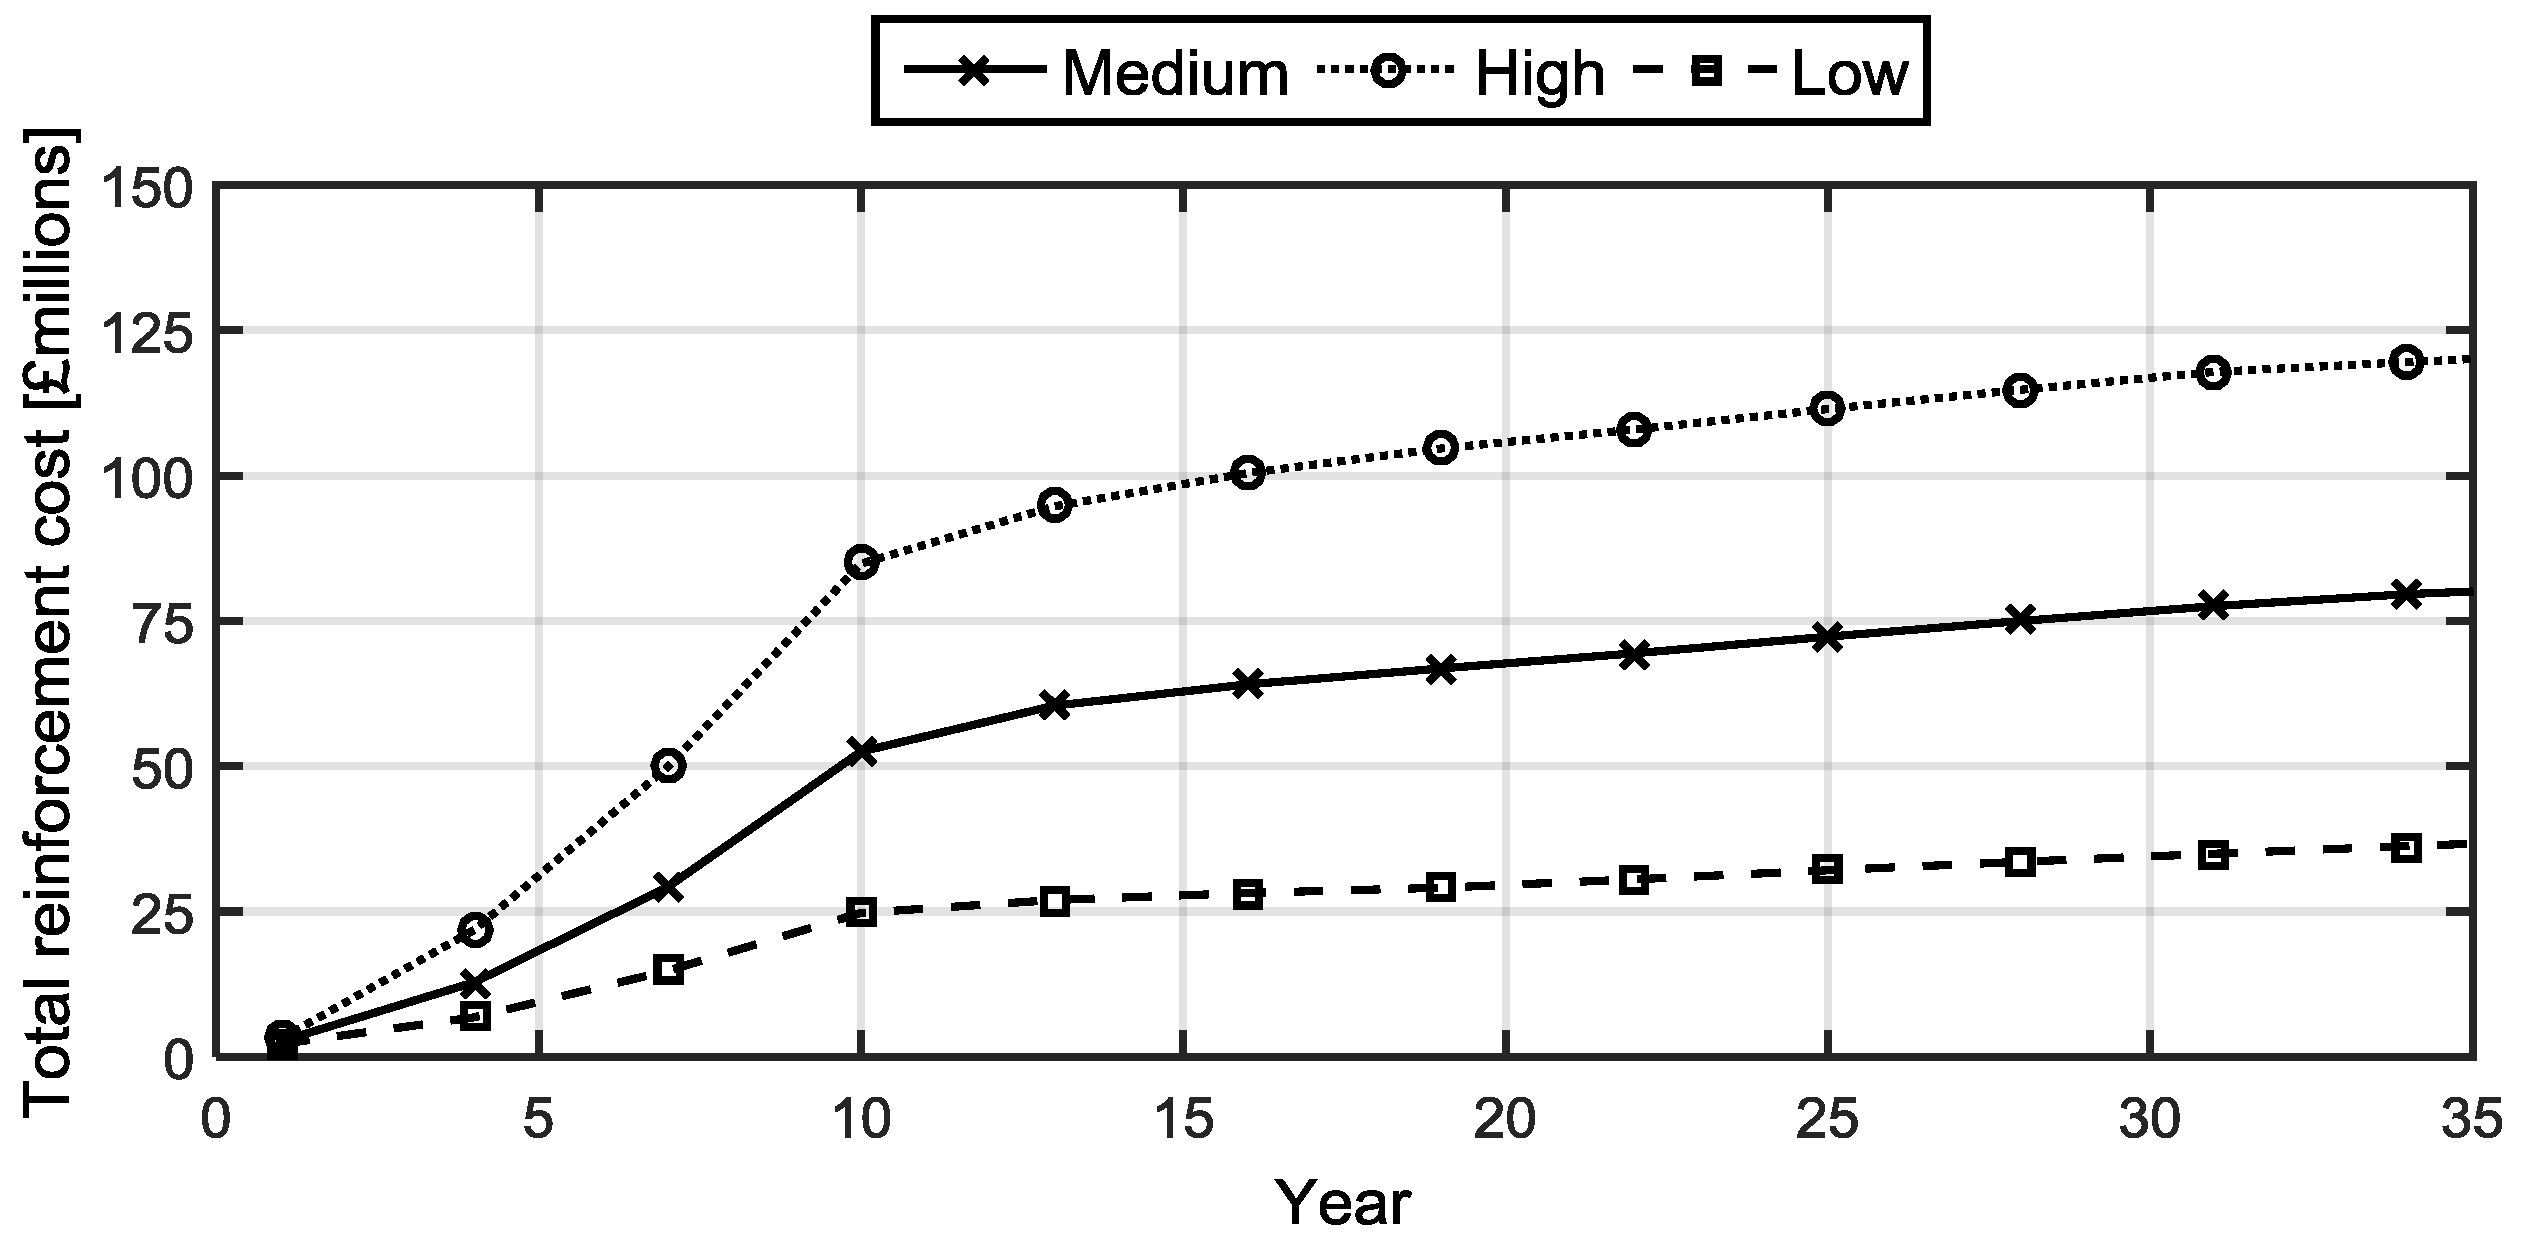
By multiplying the length of each problematic feeder by a re-conductoring cost (£80/m), the method assesses the default cost to the DNO (
Figure 5). Results show that the DNO will see increasing re-conductoring costs which closely mirror the shape of the underlying PV forecasts (
Figure 5). Although the number of problematic feeders is relatively small, there is still a sizable financial cost for the DNO to maintain voltage limits.
4.2. Comparison of Storage Scenarios on One Network
The method for comparing storage is first applied to one network to illustrate the storage scenarios.
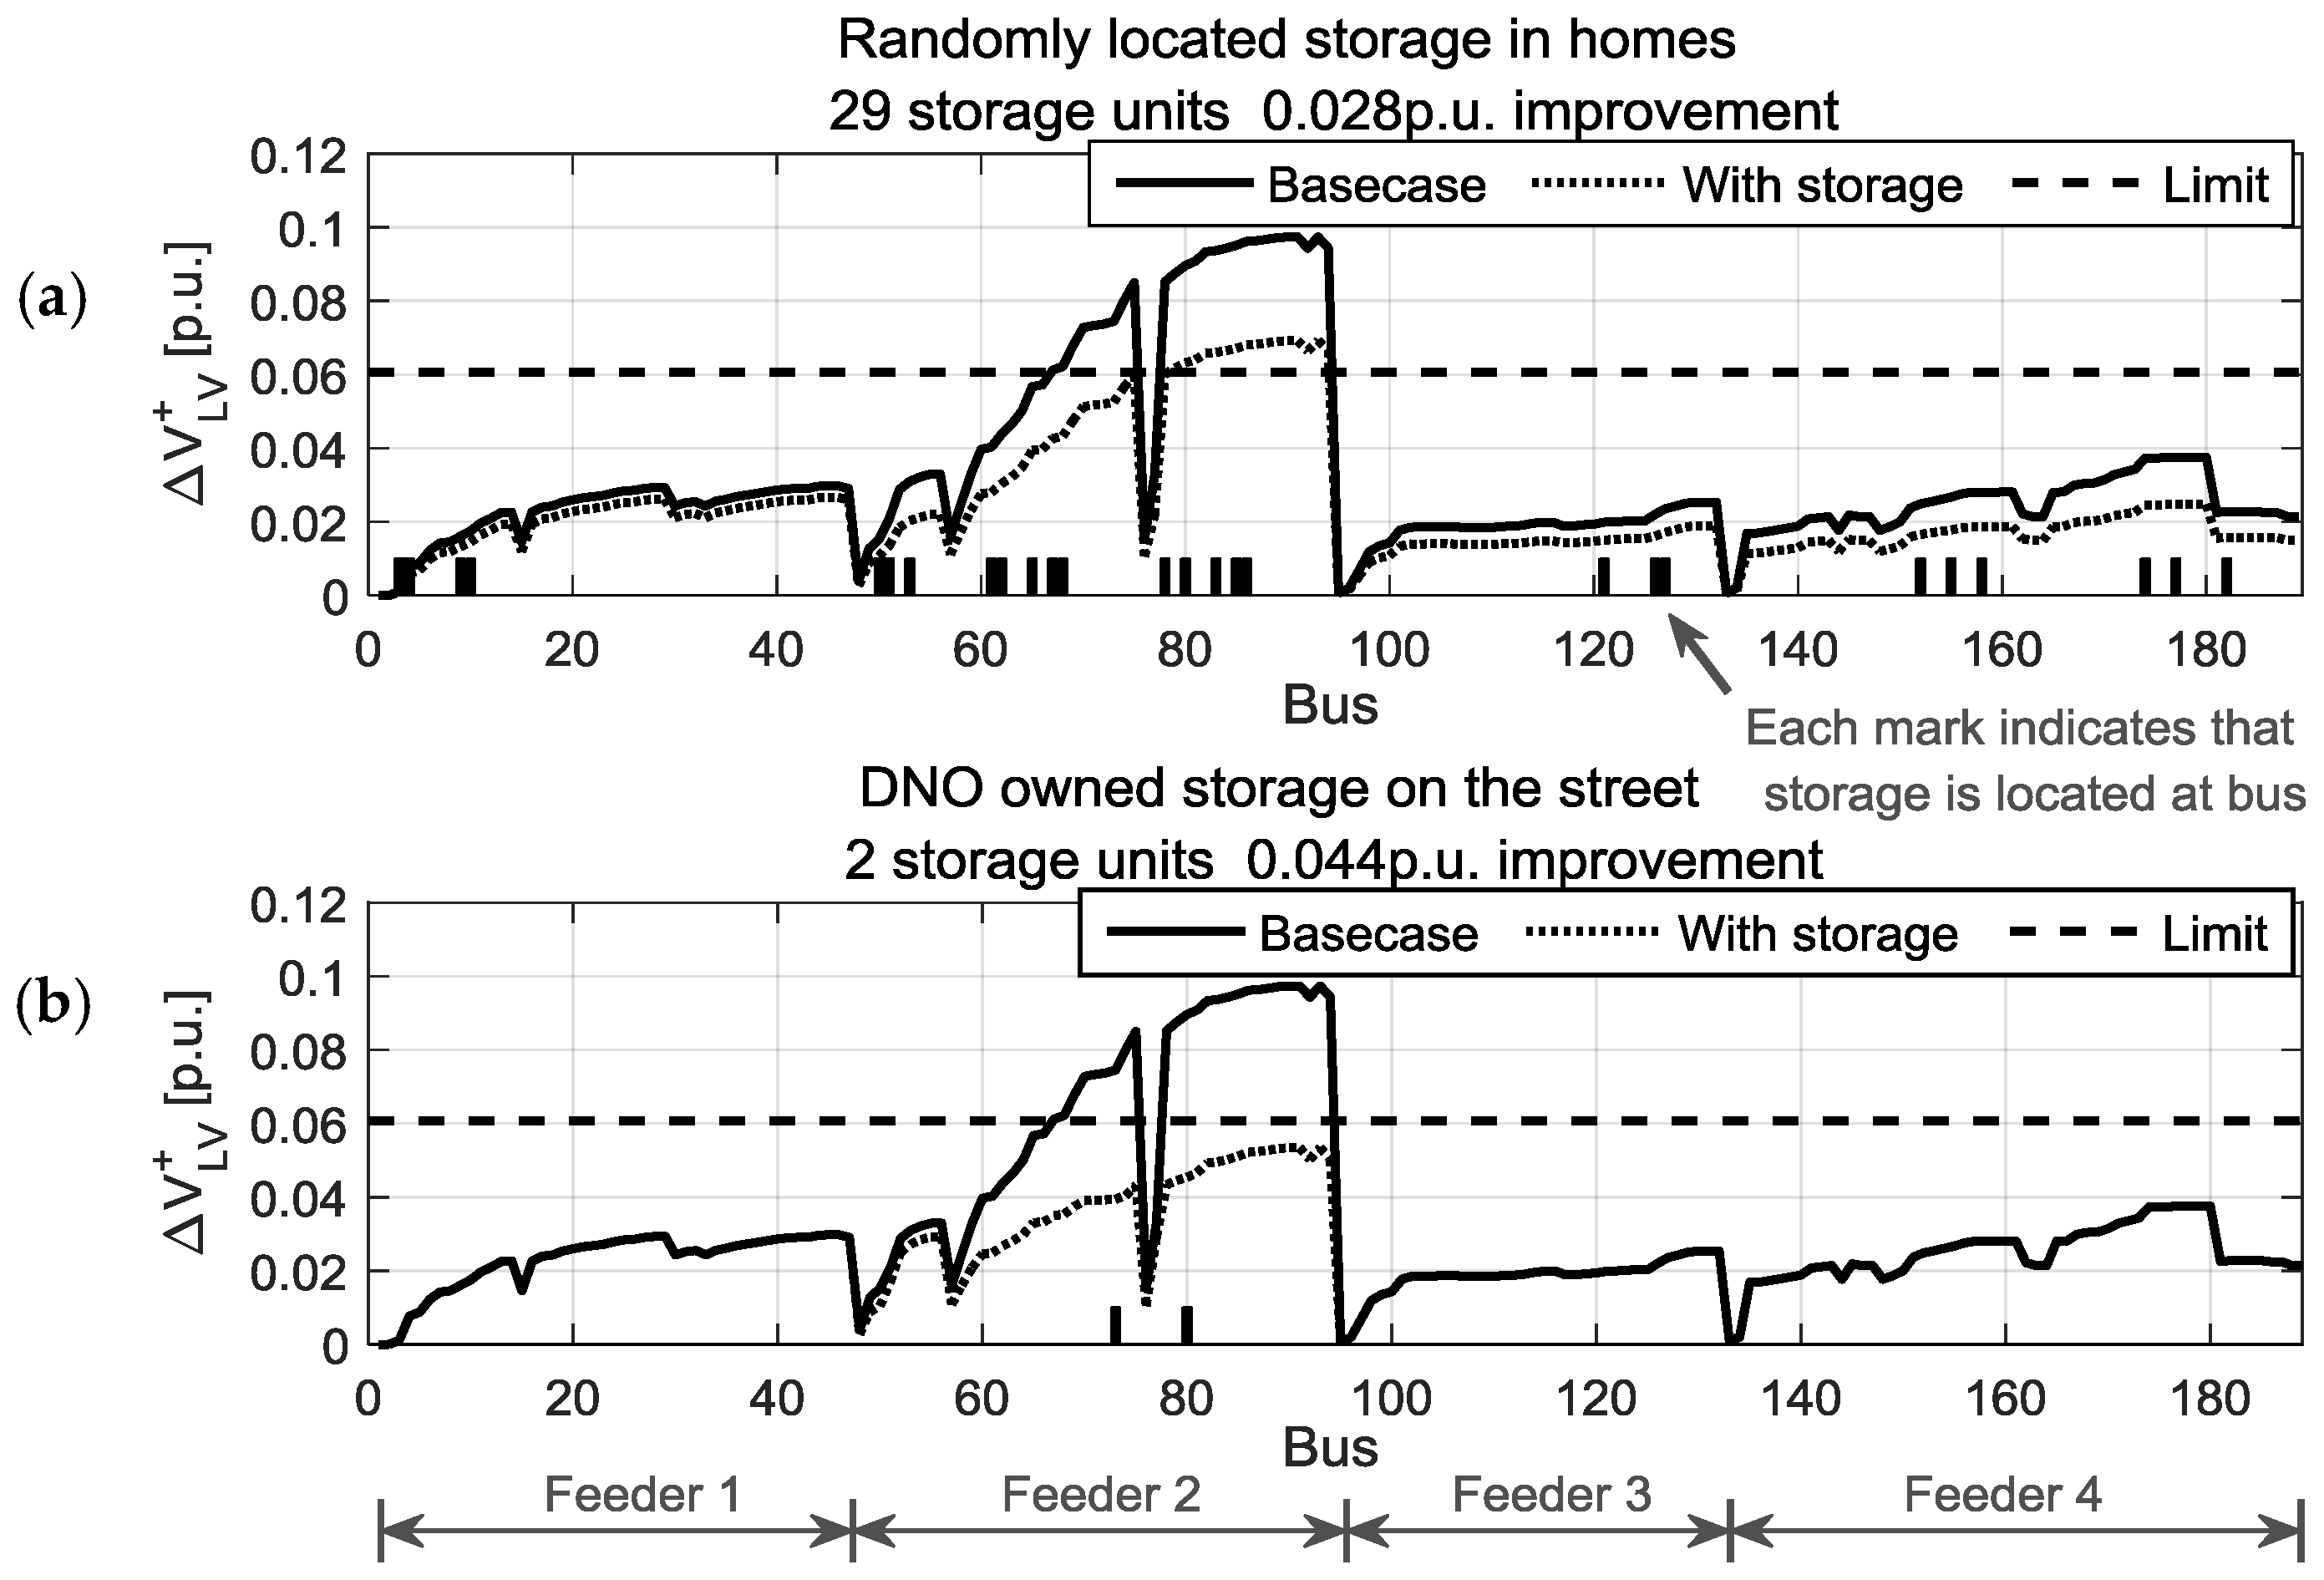
Figure 6 shows the network voltages with PV on 100% of suitable homes and no storage (base case). It can be seen that feeder 2, between bus 48 and 98, has overvoltage.
Storage is then assessed. In
Figure 6a a random selection (25%) of homeowners with PV install storage at locations denoted by the bars on the x-axis. The 29 storage systems reduce the voltage rise as shown by the change to the voltage profiles in the figure. Not all overvoltage conditions are removed, and so the DNO would still need to reinforce the network.
Figure 6b shows the same PV scenario, however in this case the DNO has installed two three-phase 25 kW storage units at locations determined by the genetic algorithm. The load flow shows that the network operation is within voltage limits in this scenario as expected by applying this algorithm.
In this network, 50 kW of DNO owned storage is used to manage voltage, compared to 104.4 kW of customer owned storage: and the latter does not solve the overvoltage. In feeder 2, which is the section of the network experiencing overvoltage in the base case, there is a comparable amount of home or DNO storage, but the DNO owned assets are located in such a way to have the capability to manage the overvoltage.
4.3. Assessment of LV Networks across DNO License Area
The previous result is only applicable to one network, so a study of all 9163 networks (43,816 feeders) was then undertaken to compare the impact of storage (under the two installation scenarios) across this large population of networks.
The number of feeders in the entire set of 9163 networks which will experience overvoltage under a number of storage adoption scenarios and the medium PV integration scenario are shown in
Figure 7. It can be seen that randomly located storage does reduce the number of feeders with overvoltage. However, even with storage in 15% of homes with PV, 78% of the problematic LV networks still need reinforcement. DNO sited storage is, by nature of the algorithm, able to solve overvoltage unconditionally.
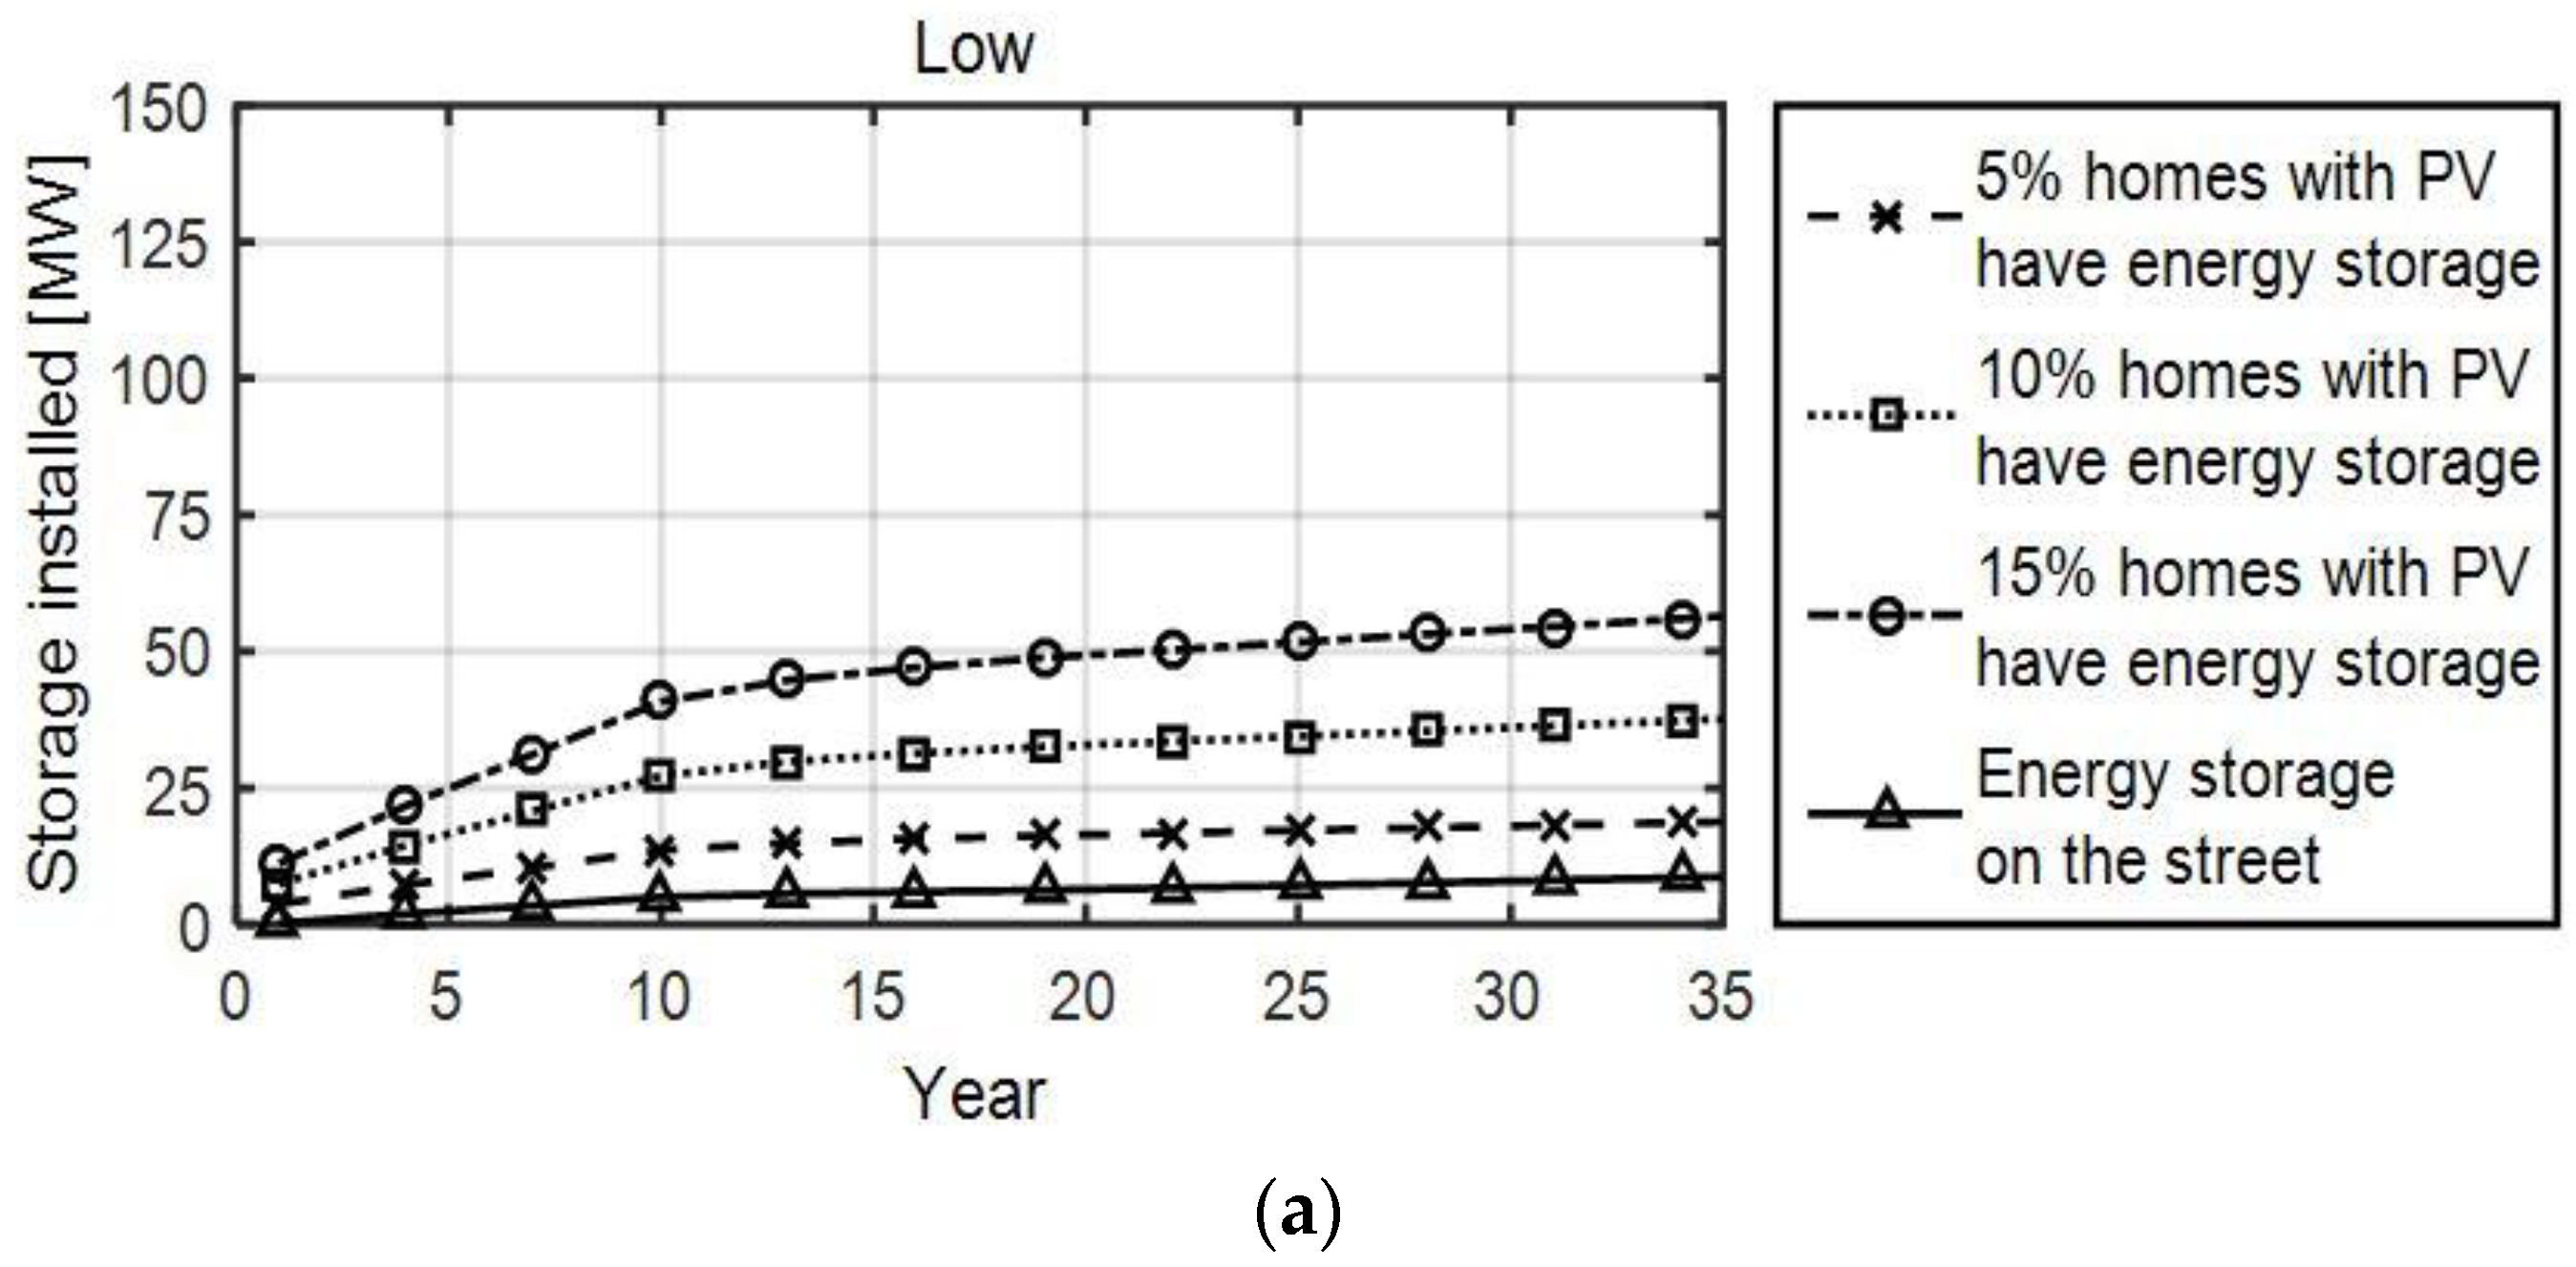
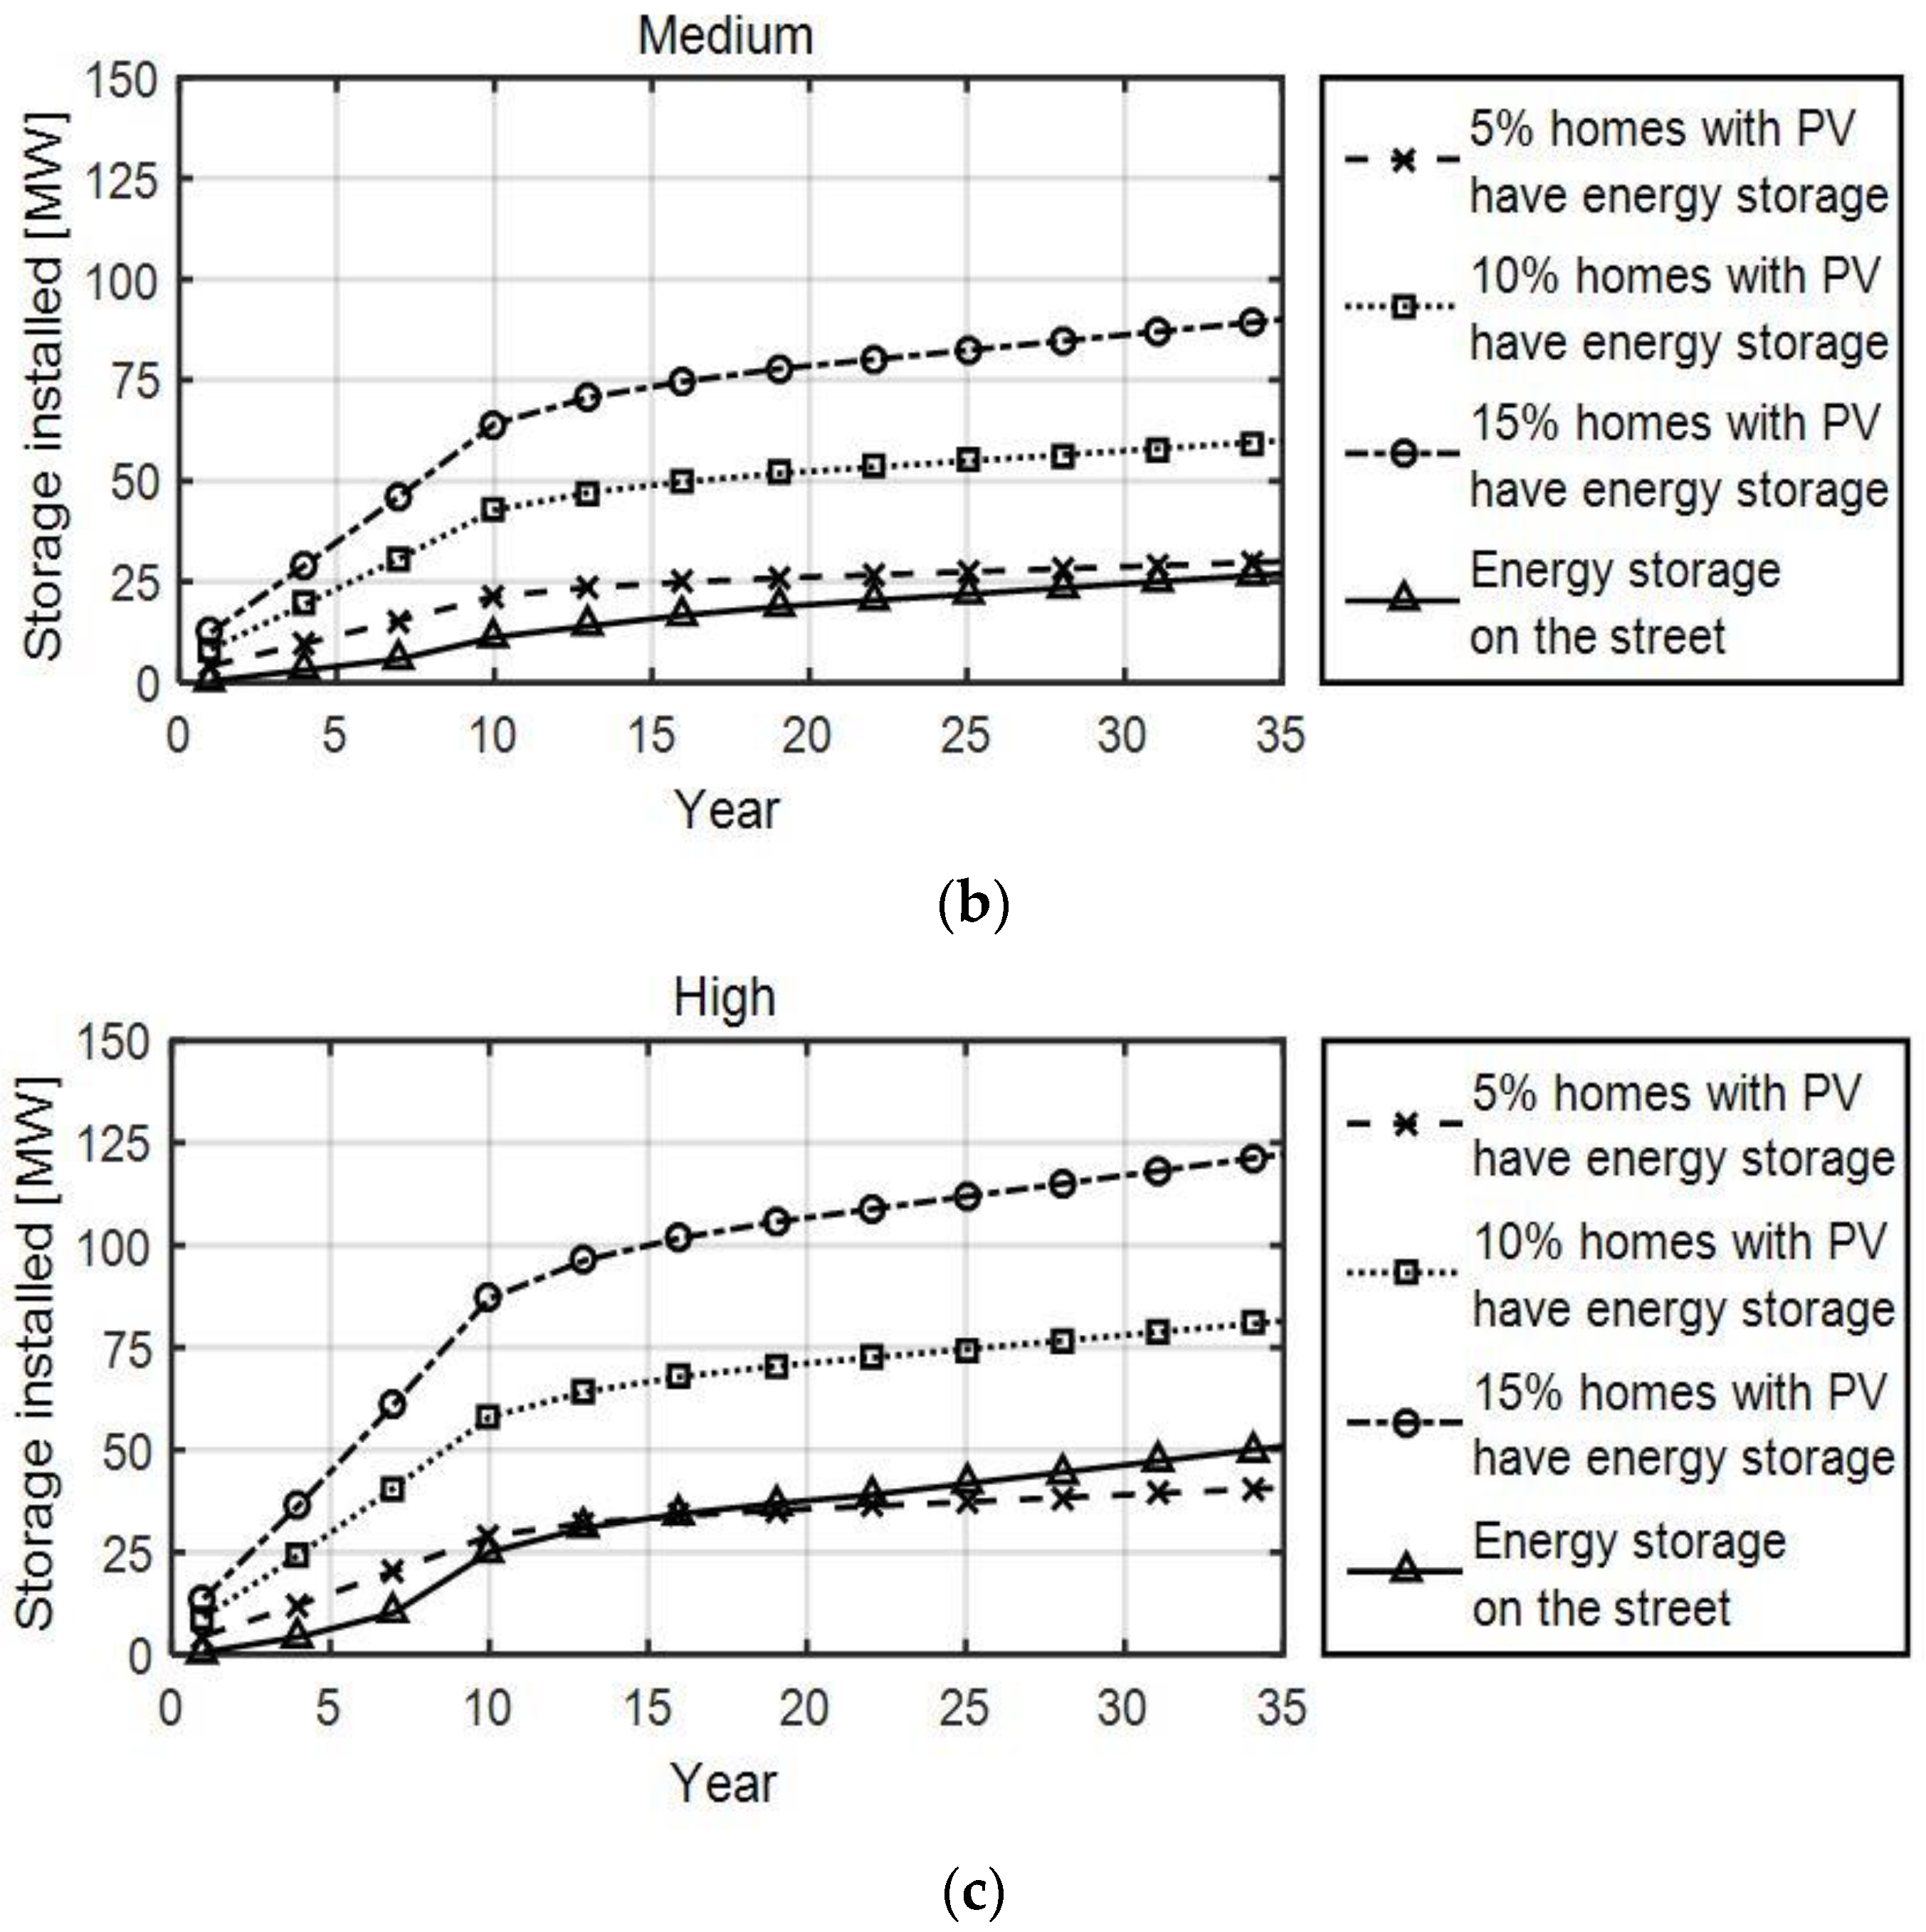
The amount of storage installed under all PV scenarios is shown in
Figure 8. The volume of DNO sited storage is comparable to installing storage in approximately 5% of homes in the network. It can also be seen that the potential market for such storage is uncertain (10 MW for low PV scenario, up to 50 MW for high PV scenario, over 35 years). This uncertainty is important for manufacturers as well as DNOs.
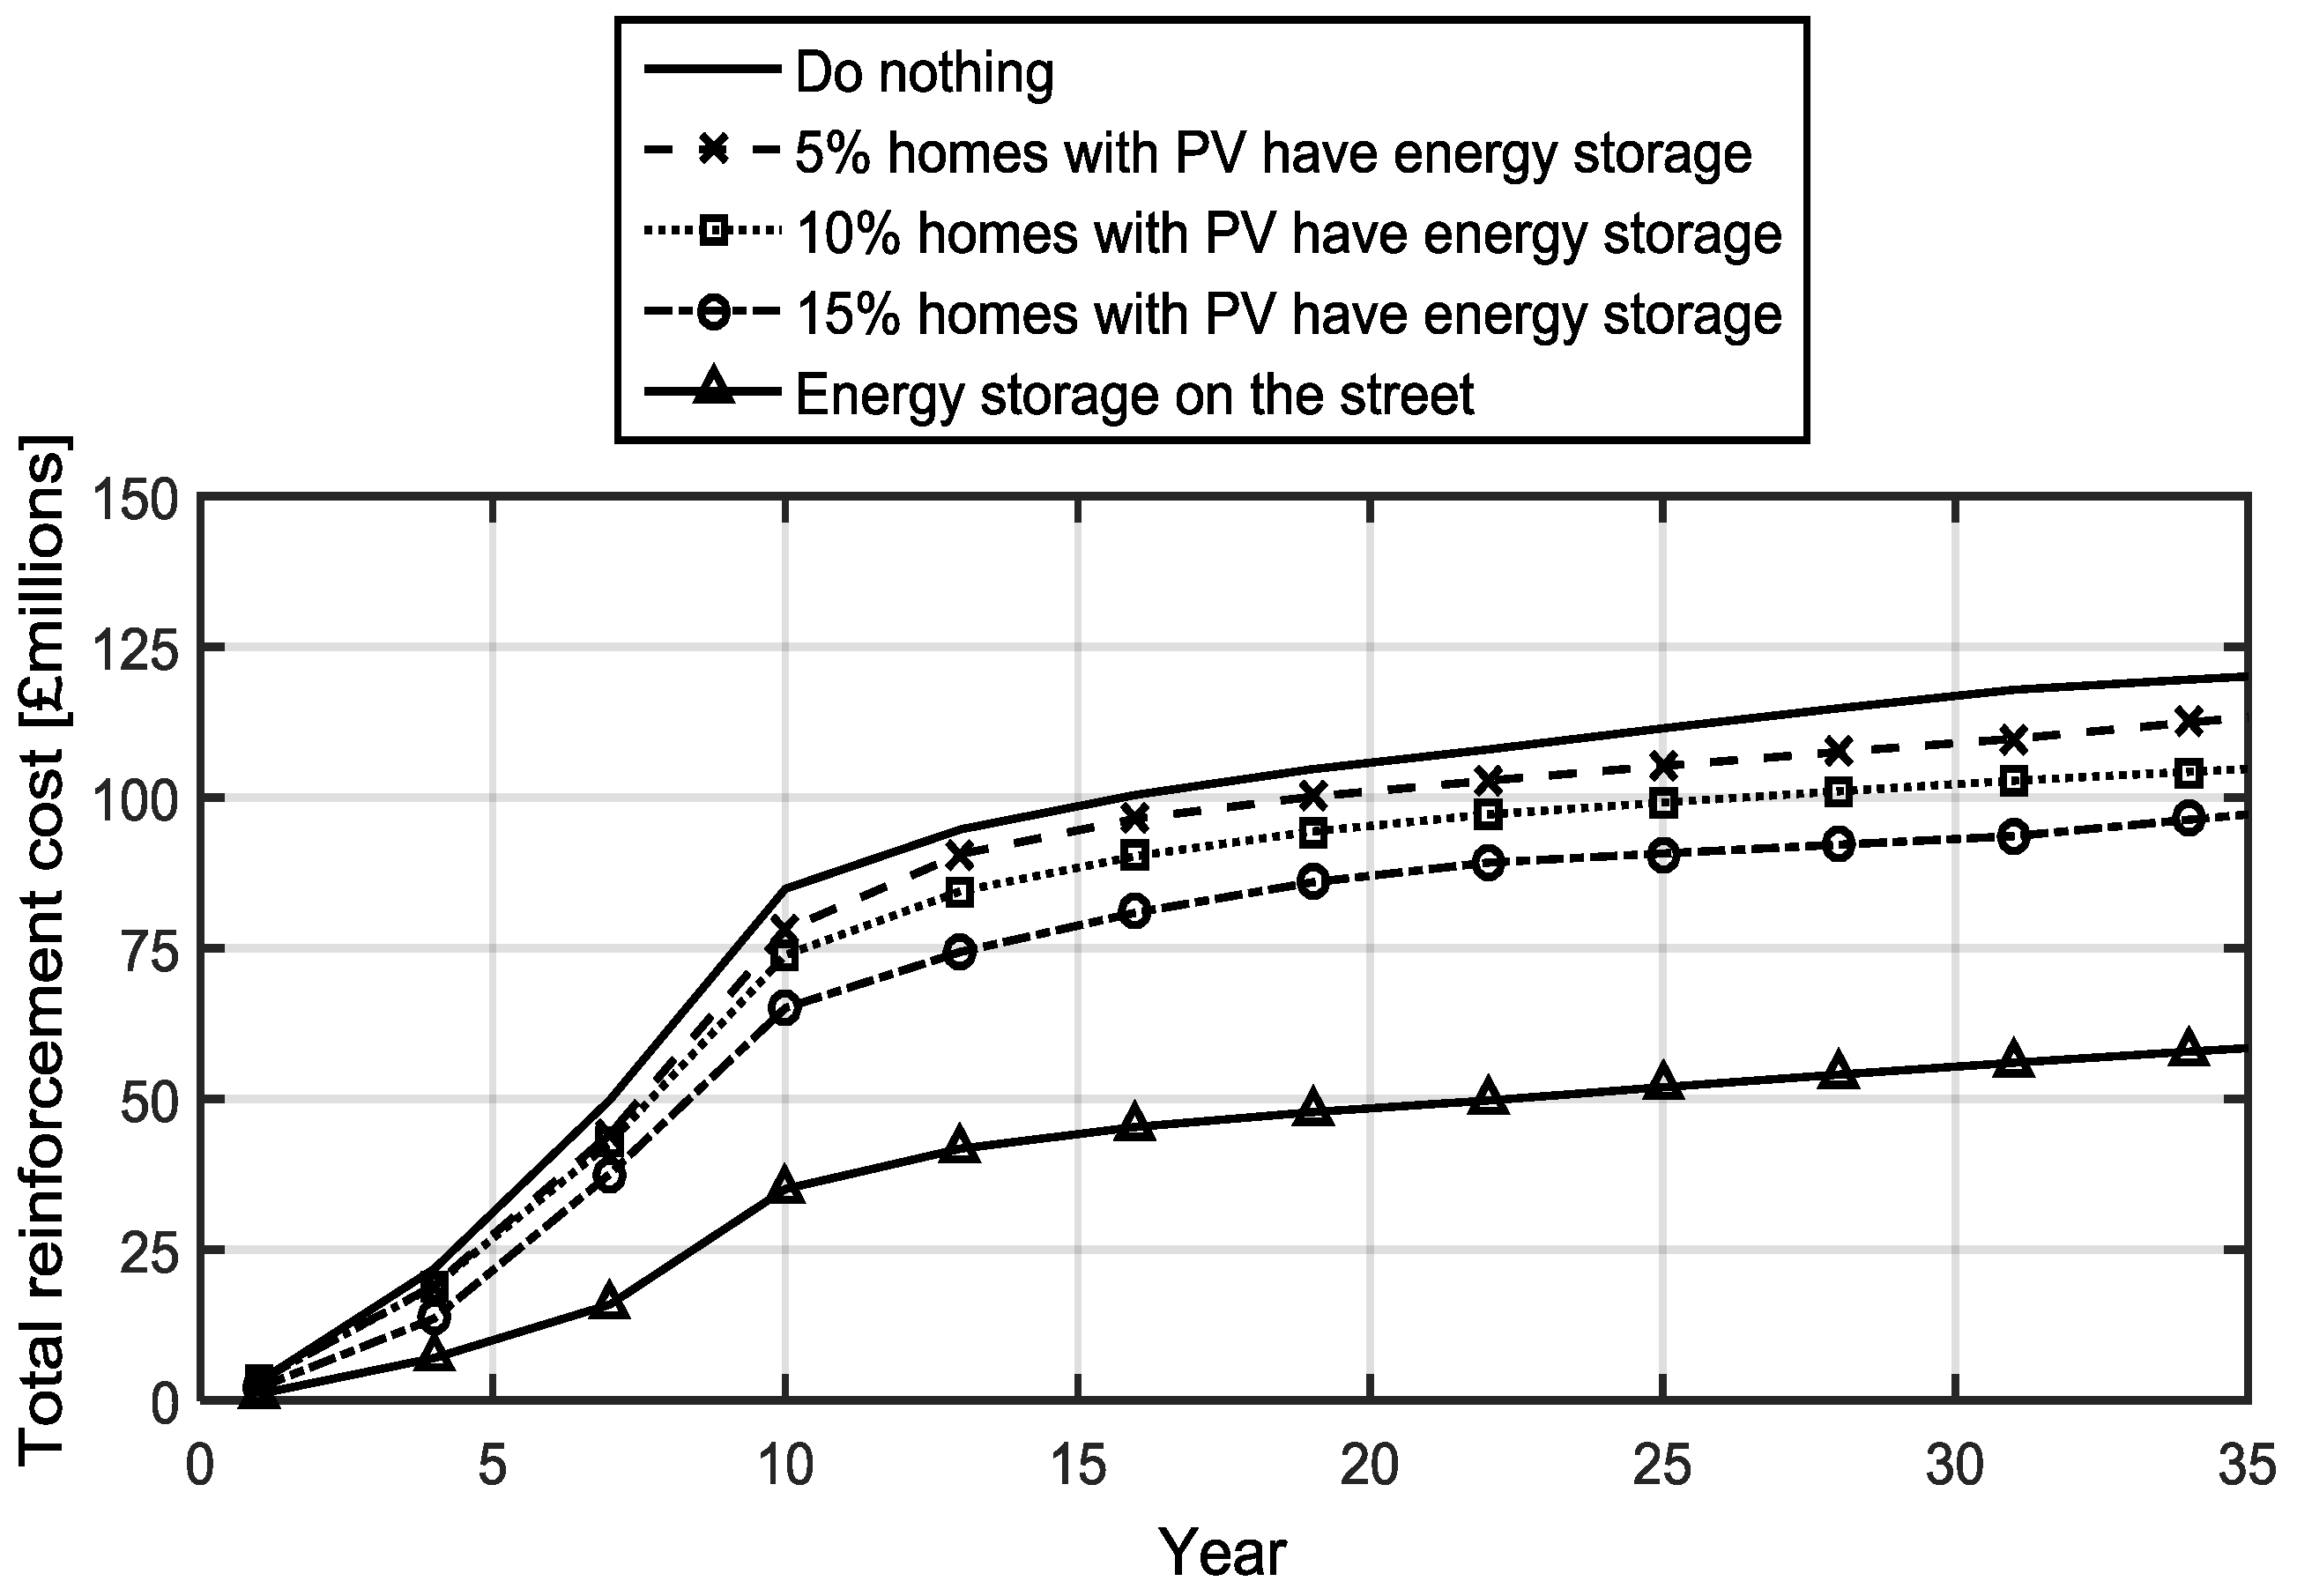
The total reinforcement cost that the DNO will experience under all storage scenarios is shown in
Figure 9. Randomly located storage does reduce the reinforcement costs, but this reduction is only a small fraction of the base case “do nothing” cost. It is observed that such storage has an alternative revenue stream from providing benefits to customers through bill reduction and self-consumption. This is addressed in the discussion.
4.4. Sensitivity Analysis
A sensitivity analysis with respect to the cost of a complete energy storage system was performed. The number of networks where the DNO choses to re-conductor or choses to install energy storage is found to be dependent on the unit cost of storage as is demonstrated in
Figure 10. In 94% of the problematic networks, energy storage is found to be economically favourable to traditional network reinforcement for managing overvoltage when the energy storage cost is £200/kWh. Note that the installation costs
CI are kept constant and so only savings in energy storage are included in the energy storage price scenarios.
With a low PV dispersion level across the entire DNO network, the economic case for energy storage is found to be favourable in comparison with re-conductoring. In the base case, storage is selected in 100% of the networks where the storage cost is less than £600/kWh. As the PV dispersion level increases, the severity of voltage problems increases. Consequently, the capacity of energy storage required to manage voltage problems increases. The incremental cost of adding energy storage systems in problematic networks is found to decrease such that storage is selected in less than 50% of the problematic networks with a storage cost of £800/kWh.
4.5. Comparison with Existing UK Power System Storage
The scale of the distributed storage, for one network area in the UK, can be compared with existing storage in the UK power system, which in this instance takes the form of pumped hydro. As shown in
Table 4, LV energy storage located by a DNO is small compared to existing pumped storage plant capacity. Wide adoption of energy storage by customers may provide comparable power but this would not necessarily be as available as pumped storage. Should the DNO storage scenario be repeated across all UK mainland areas, the energy capacity would be of a similar order to Ffestiniog pumped hydro station.
5. Discussion
The results of this work show that storage should be carefully located within an LV network using a heuristic method to minimise a DNO’s overall cost. Storage may still offer benefits to homeowners and that does have a benefit to DNOs in reducing reinforcement costs. However, it is found that storage in homes will not prevent all overvoltage, because the location of the storage in networks is not optimised for overvoltage reduction in this case.
Social factors will also be important to consider, such as engagement with specific customers by DNOs to target installation of residential storage. For example, it could be suggested that storage is targeted by DNOs at homes with PV who are experiencing voltage problems. This would mean storage is installed in homes on problematic networks with the objective of reducing overall costs. In this case, there would be a benefit both for the DNO and to homeowners in reduced curtailment and lower network costs. The DNO might pass financial benefits of avoided re-conductoring to customers with storage as a local subsidy as presented in [
25]. Battery and PV/battery hybrid inverters commonly contain the control logic required for export limitation or non-greedy self-consumption as would be required to maintain network voltage limits. The inverter might also call upon demand side loads such as storage heaters, electric vehicles or smart appliances—which would improve the chances of a load/store being available to maintain voltage limits.
Storage located by the network operator could be built with control algorithms which are targeted towards a DNO objective of voltage control [
34,
35]. Street storage itself might be favourable for DNOs as it does not need to be located in customer homes. This avoids issues such as the need to fundamentally change the relationship between the DNO and homeowners. However, it may be difficult to install such storage where there is limited space on the street or concerns of theft or damage.
Technical and financial parameters have been used for this study which have been accepted by DNOs for works previously published by the authors [
24]. In the future, DNOs will need to recalculate results if parameters change. For example, DNOs might also model an increase in peak demand if there is widespread adoption of electric vehicles and heat pumps in the future. This is easily achieved in the tool through adjusting the parameters described in
Section 3.4.4. As the economics of energy storage improve, such as through reduced battery costs, increased variable electricity prices or through smart tariffs then their dispersion level will be much higher. Further study should evaluate the dispersion level for storage in homes which achieves comparable economic results for the DNO.
This work was completed as an electrical energy storage study. Other technologies such as electric vehicles, flexible heat pumps, thermal storage, occupancy patterns [
36], or measured data can be included in the model by adjusting the maximum or minimum demand in the networks. Adaptation of the model in this paper would therefore allow assessment of integration of a number of network changes. Hot water storage is very common in the UK, for example, and the DNO might consider that adoption of thermal storage linked to PV will be more widespread than adoption of batteries in customers’ homes.
Curtailment of PV is one of the primary practical implications of overvoltage in LV networks. The amount of curtailment could be calculated by extending the model to include annual demand and generation forecasts. Such modelling would allow the DNO to select networks with the worst voltage problems and those where the most curtailment will occur. This is important to allow the DNO to determine networks where curtailment is most extreme and where mitigating actions should be prioritised. Furthermore, if the overvoltage and curtailment is small, then there is an important case to be made to regulators to allow some PV curtailment in connection agreements if this reduces the overall reinforcement cost. For example, the connection agreement could ensure that the PV is not curtailed for more than a set number of hours in a year with the length of time of each curtailment also limited.
It should be noted that calculation of problematic feeder is based on an assumption that minimum load and maximum output coincide, and that maximum output is at the rated power PPV. This is a common approach, taking a worst case scenario. In reality, for the UK the amount of time for which output power is at rated is very small, and therefore UK DNOs may wish to consider a probabilistic approach to the combination of low load and high PV output.
6. Conclusions
This paper has presented a method for assessing the impact of residential PV and energy storage on overvoltage in a large number of LV networks. This has been applied to 9163 LV networks, comprising 43,816 feeders, in the North West of the UK. It has shown that storage should be carefully located within an LV network using a heuristic method to reduce the cost of storage and the overall reinforcement cost to prevent overvoltage. Widespread adoption of stochastically located storage in homes is unlikely to prevent all overvoltage since the location is critical. Even so, storage in homes may have additional benefits where voltage problems are present. As shown in the economic sensitivity analysis, the need for storage increases with the PV dispersion levels but so does the requirement for reduced costs of storage.


