A Framework for Regional Ecological Risk Warning Based on Ecosystem Service Approach: A Case Study in Ganzi, China


1
State Key Laboratory of Urban and Regional Ecology, Research Center for Eco-Environmental Sciences, Chinese Academy of Sciences, Beijing 100085, China
2
University of Chinese Academy of Sciences, Beijing 100049, China
*
Author to whom correspondence should be addressed.
Sustainability 2018, 10(8), 2699; https://doi.org/10.3390/su10082699
Submission received: 23 June 2018
/
Revised: 25 July 2018
/
Accepted: 27 July 2018
/
Published: 1 August 2018
Abstract
:Worldwide, most ecosystem services have declined. However, the theoretical and analytical frameworks for the ecological risk assessment of ecosystem services are still lacking. Here a framework for the risk assessment of ecosystem services was developed based on the formation, changes, risk, and management of ecosystem services. The framework was tested in Ganzi, the upstream area of the Yangtze River Basin, for the regional ecological warning of ecosystem services. Ecosystem services in the form of soil retention and sandstorm prevention and ecological risks including soil and wind erosion were modelled. The results showed that with the increase in area and quality of natural vegetation (forest and grassland), the soil retention service and sandstorm prevention service increased by 66.92% and 8.59% between 2000 and 2015, respectively. Correspondingly, the ecological risk of soil erosion decreased by 8.8%, and wind erosion remained stable. Despite the negative impacts from agricultural development on sandstorm prevention, the increase in vegetation and improvement in ecological quality led to a decrease in the ecological risks of soil erosion and sandstorm erosion by improvement of ecosystem services. This research provides a new perspective for ecological risk assessment, as well as direct management information on ecological risks, by incorporating ecosystem services.
1. Introduction
Ecosystem services, the benefits that people receive from nature, have been degraded or are being used in an unsustainable way [1]. Furthermore, it is projected that ecosystem services will face greater degradation risks over the first half of this century due to land-use change, invasive species, over-exploitation, pollution, and climate changes [2]. One of the greatest challenges is assessing and understanding the ecological risks of ecosystem services [3] in order to determine a viable way in which to manage human interactions with ecosystems and maintain the sustainable supply of ecosystem services [4].
Degradation of ecosystem services cause or aggravate ecological problems such as soil erosion and desertification, which further increase ecological risks. Ecological risk assessment is a process that estimates the potential adverse effects and risks that human activities and human-induced stressors pose on ecosystems or their components [5]. Traditional ecological risk assessment focuses on the assessment of adverse effects by toxic chemicals [3]. A series of methods of ecological risk assessment have been developed and are widely used throughout the world, such as the ‘three-step method’ [6], PETAR (procedure for ecological tiered assessment of risk) [7], and RRM model (relative risk assessment model) [8]. Great progress has been made on the classification, evaluation, and mapping techniques of ecosystem services. However, the theoretical and analytical frameworks for the ecological risk assessment of ecosystem services are still lacking [3]. Furthermore, the linkage between ecological mechanisms and the ecosystem services that create the end products (i.e., final ecosystem services) remains understudied [9,10,11]. It is necessary to quantify the ecosystem service provision (i.e., empirical ecosystem service measurements) [11] and the possible adverse effects from human activities [12,13].
Ecosystem services are the bridge that link nature and society and, as such, are suitable objectives for ecological risk assessment. On the one hand, ecosystems provide diverse products and services to improve human well-being [14]. For instance, marine ecosystems produce secure and adequate fishery products to support our everyday lives, and the service of soil and water retention from terrestrial ecosystems can decrease the risk of drinking water being polluted. Researchers have tried to understand the economic value of nature to global stakeholders through the approach of ecosystem services [15]. By assessing the economic value of ecosystem services, it is beneficial for policymakers to weigh the advantages and disadvantages (i.e., tradeoffs) of economic development and environmental protection. Economic value assessment can provide useful information about the importance of different types of ecosystem services, benefits to multiple stakeholders involved, and program costs of economic development and environmental protection. This is important for determining ways of increasing investment in natural resources protection for enhanced human welfare [14,16]. On the other hand, the degradation of ecosystem services can cause a series of adverse effects or ecological problems, such as sandstorms [17] and soil erosion [18]. Therefore, the ecosystem services approach may provide important insights to strengthen the utility of ecological risk assessment. In particular ecological models have a great deal of potential to address the problems that are limiting ecological risk assessment [3]. Ecological thresholds are a key issue in developing an ecosystem services approach. Climate change and human activities (including ecological conservation) have greatly altered ecosystem composition, pattern, and quality. Ecosystem changes have influenced the delivery of ecosystem services, which has led to a series of environmental problems, such as soil erosion [19], sandstorms [17], water pollution, flooding, etc. When environmental problems exceed ecological thresholds, meaning ecological tipping points, a relatively small disturbance or change in external conditions may cause a rapid change in an ecosystem [20]. When an ecological threshold has been passed, the ecosystem will probably not return to its previous state (often the “desirable state” for human welfare), thereby impacting its resilience to disturbances. Crossing an ecological threshold often leads to rapid changes in ecosystem health. Ecological thresholds represent the non-linear nature of the responses in ecological or biological systems to pressures caused by human activities or natural processes [21]. Therefore, detecting the ecological threshold and reducing ecosystem changes are critical to sustaining ecosystem health and enhancing the sustainable delivery of ecosystem services.
Generating a warning system on ecological risks is important in order to limit ecosystem changes within ecological thresholds. Such a system should integrate internal connections among ecosystem changes, ecosystem service changes, ecological problems, and ecological risks. In this study, a framework for regional ecological risk warming was proposed, and the framework was used on a case study in Ganzi, which is located in the upstream of the Yangtze River. Ganzi provides valuable ecosystem services of soil retention and sandstorm prevention. The specific aims of this study are (i) establishing a new assessment framework for ecological risk assessment using the ecosystem services approach; (ii) testing the framework by assessing the regional ecological risks and their changes between 2000 and 2015 in Ganzi; (iii) understanding the effect of ecosystem change on ecosystem services and ecological risks. The new framework can help in devising useful methods for regional ecosystem management to control ecosystem changes within ecological thresholds.
2. Study Area and Methods
2.1. Study Area
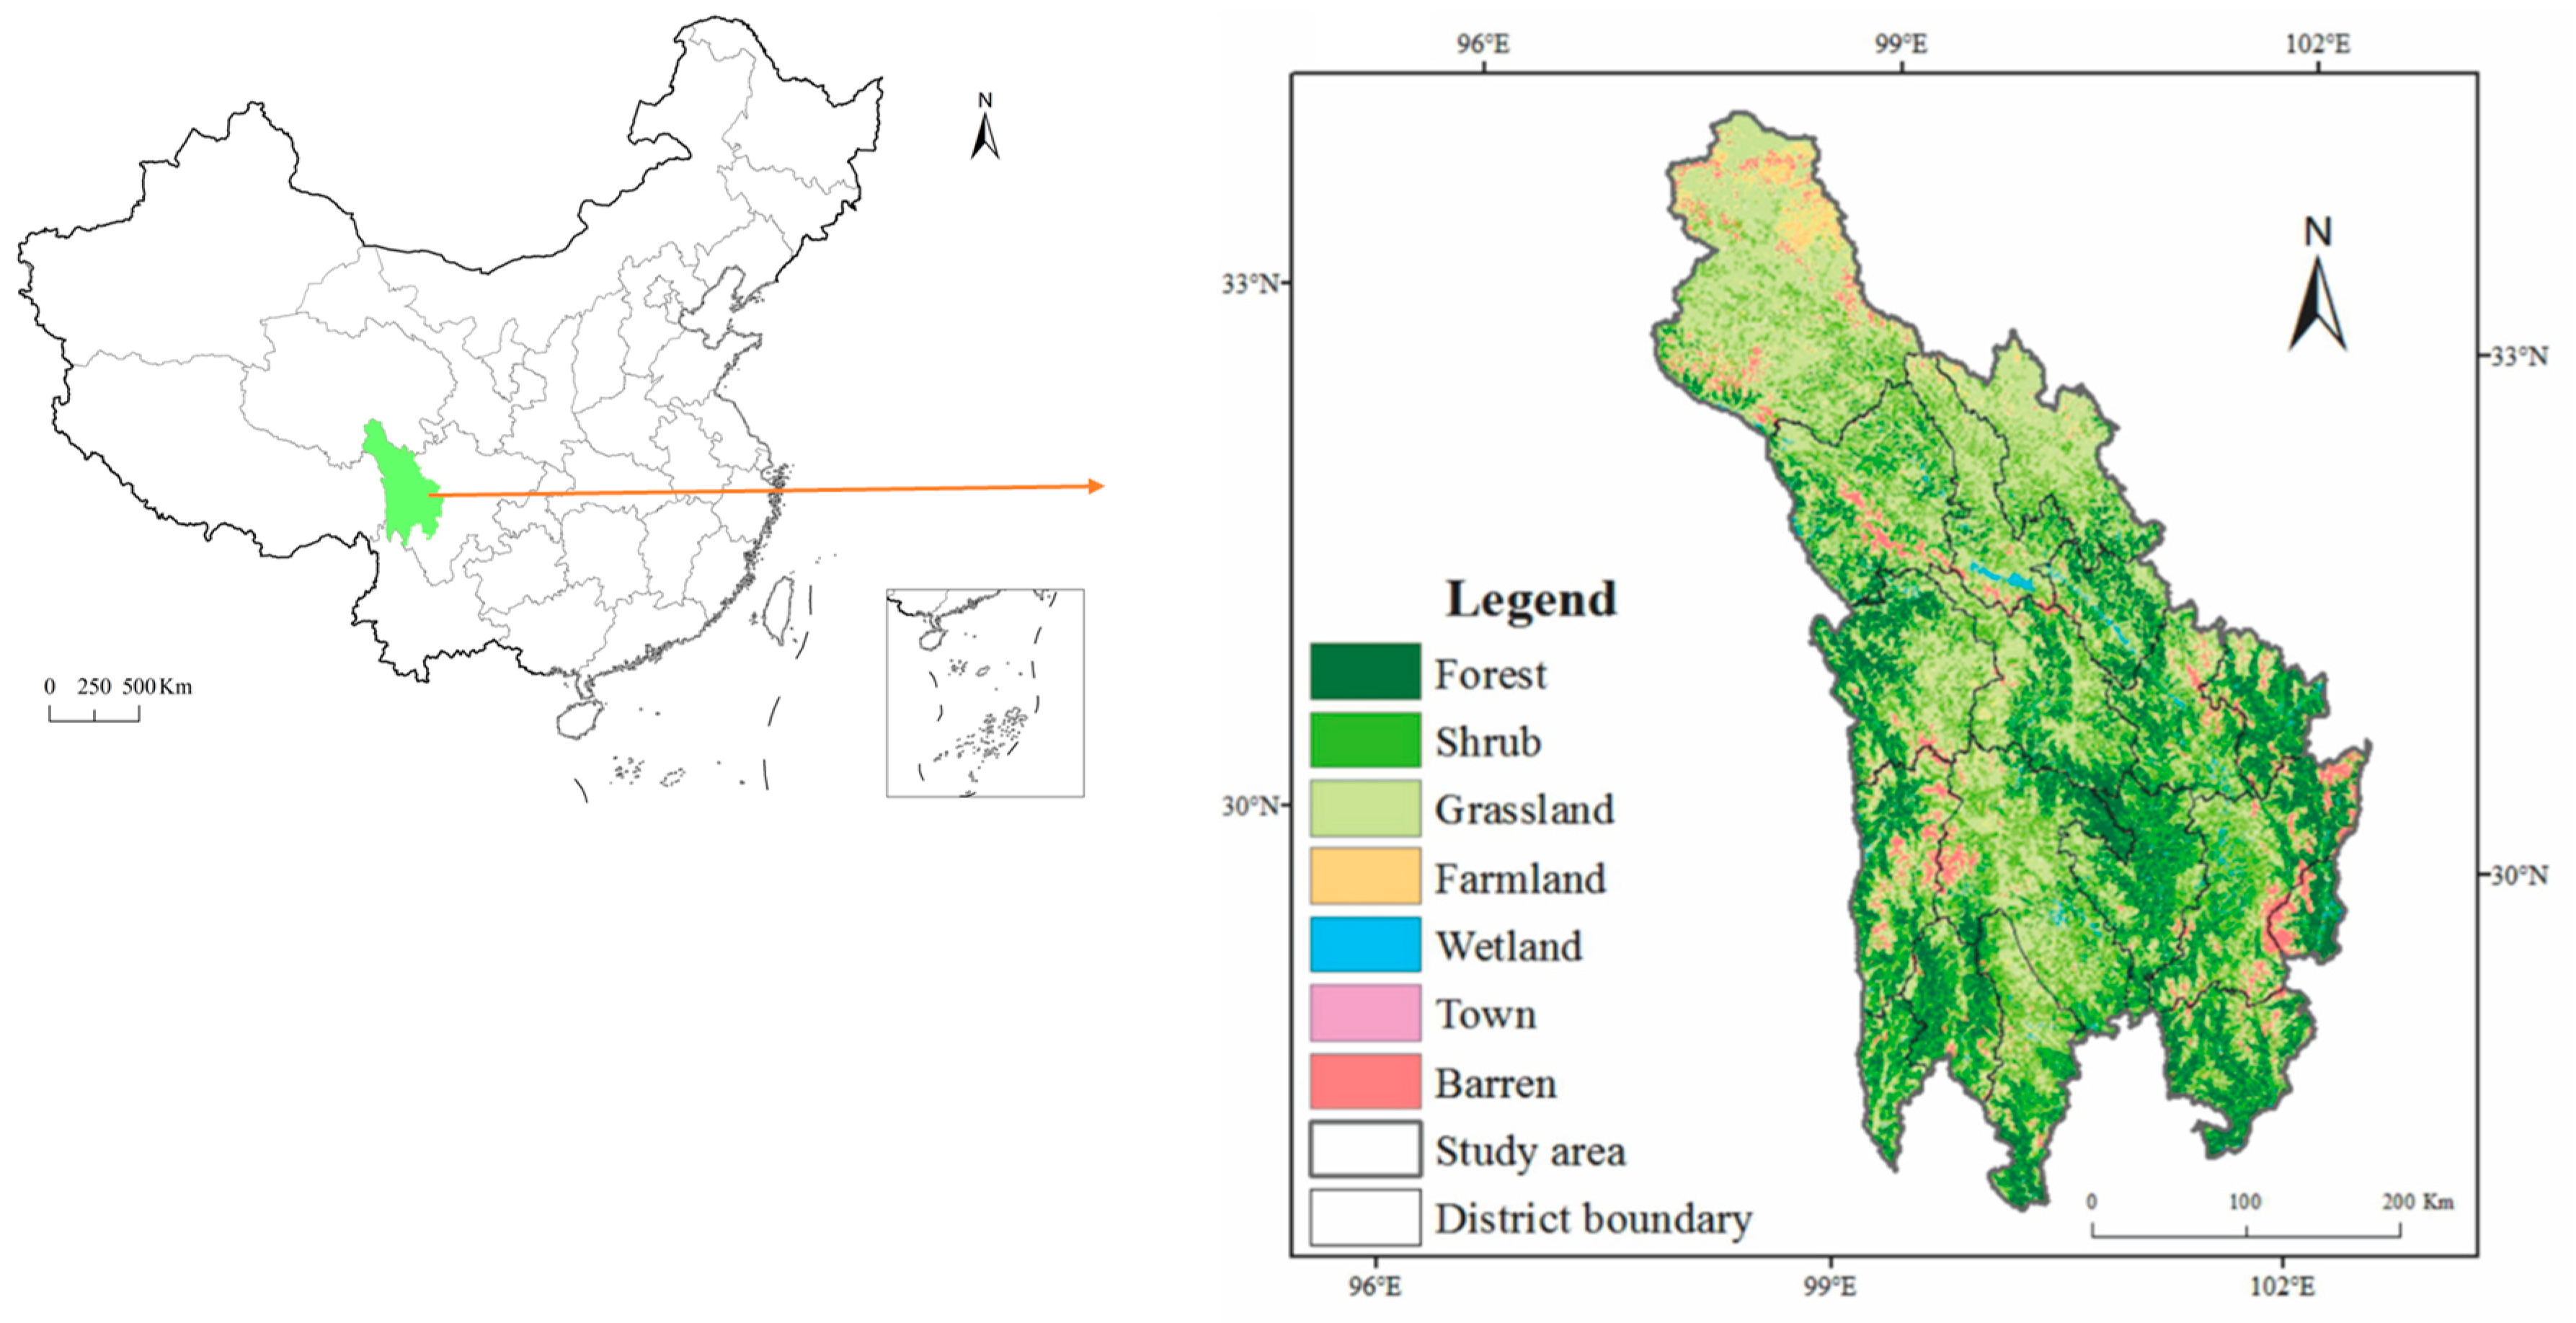
In this study, the Ganzi Tibetan Autonomous Prefecture was selected as the study area. Ganzi is located in the east of the Qinghai-Tibet Plateau; it covers about 150,000 km2 (Figure 1). The main landform types of Ganzi include hilly plateau, mountain plain, and alpine valley. The average elevation is over 3.50 km, and the relative elevation difference between the highest elevation and the lowest elevation is 6.56 km. Ganzi is located in the upper reaches of the Yangtze River and is considered a global biodiversity hotspot region [22]. Ganzi contains a huge number of rare and indigenous species, consisting of more than 5223 higher plants, 652 terrestrial vertebrates, 436 birds, 31 reptiles, and 30 amphibians [23].
Forest, shrub, grassland, farmland, and wetland are major landcover types in Ganzi. However, Ganzi’s natural ecosystems are sensitive and vulnerable, and are presently suffering from land desertification [19] and soil erosion [24]. Furthermore, increased intensity of human activities [19,25] has led to greater ecological risk. Furthermore, in 2015, 25.5% of Ganzi’s GDP (i.e., gross domestic product) came from agriculture and 85% of Ganzi’s population engaged in agriculture; thus, there exists a significant contradiction between agricultural development and ecosystem conservation.
Since 2000, the Ganzi government has implemented a series of ecological projects, including a natural forest protection program, sloping cropland conversion program, desertification prevention program, comprehensive management of soil erosion program, natural grassland restoration and protection programs, and grazing land restoration program. The goals of these policies and ecological projects are to improve ecosystem services and control ecological risks.
2.2. Methods
2.2.1. Framework for a Regional Warning System on Ecological Risks
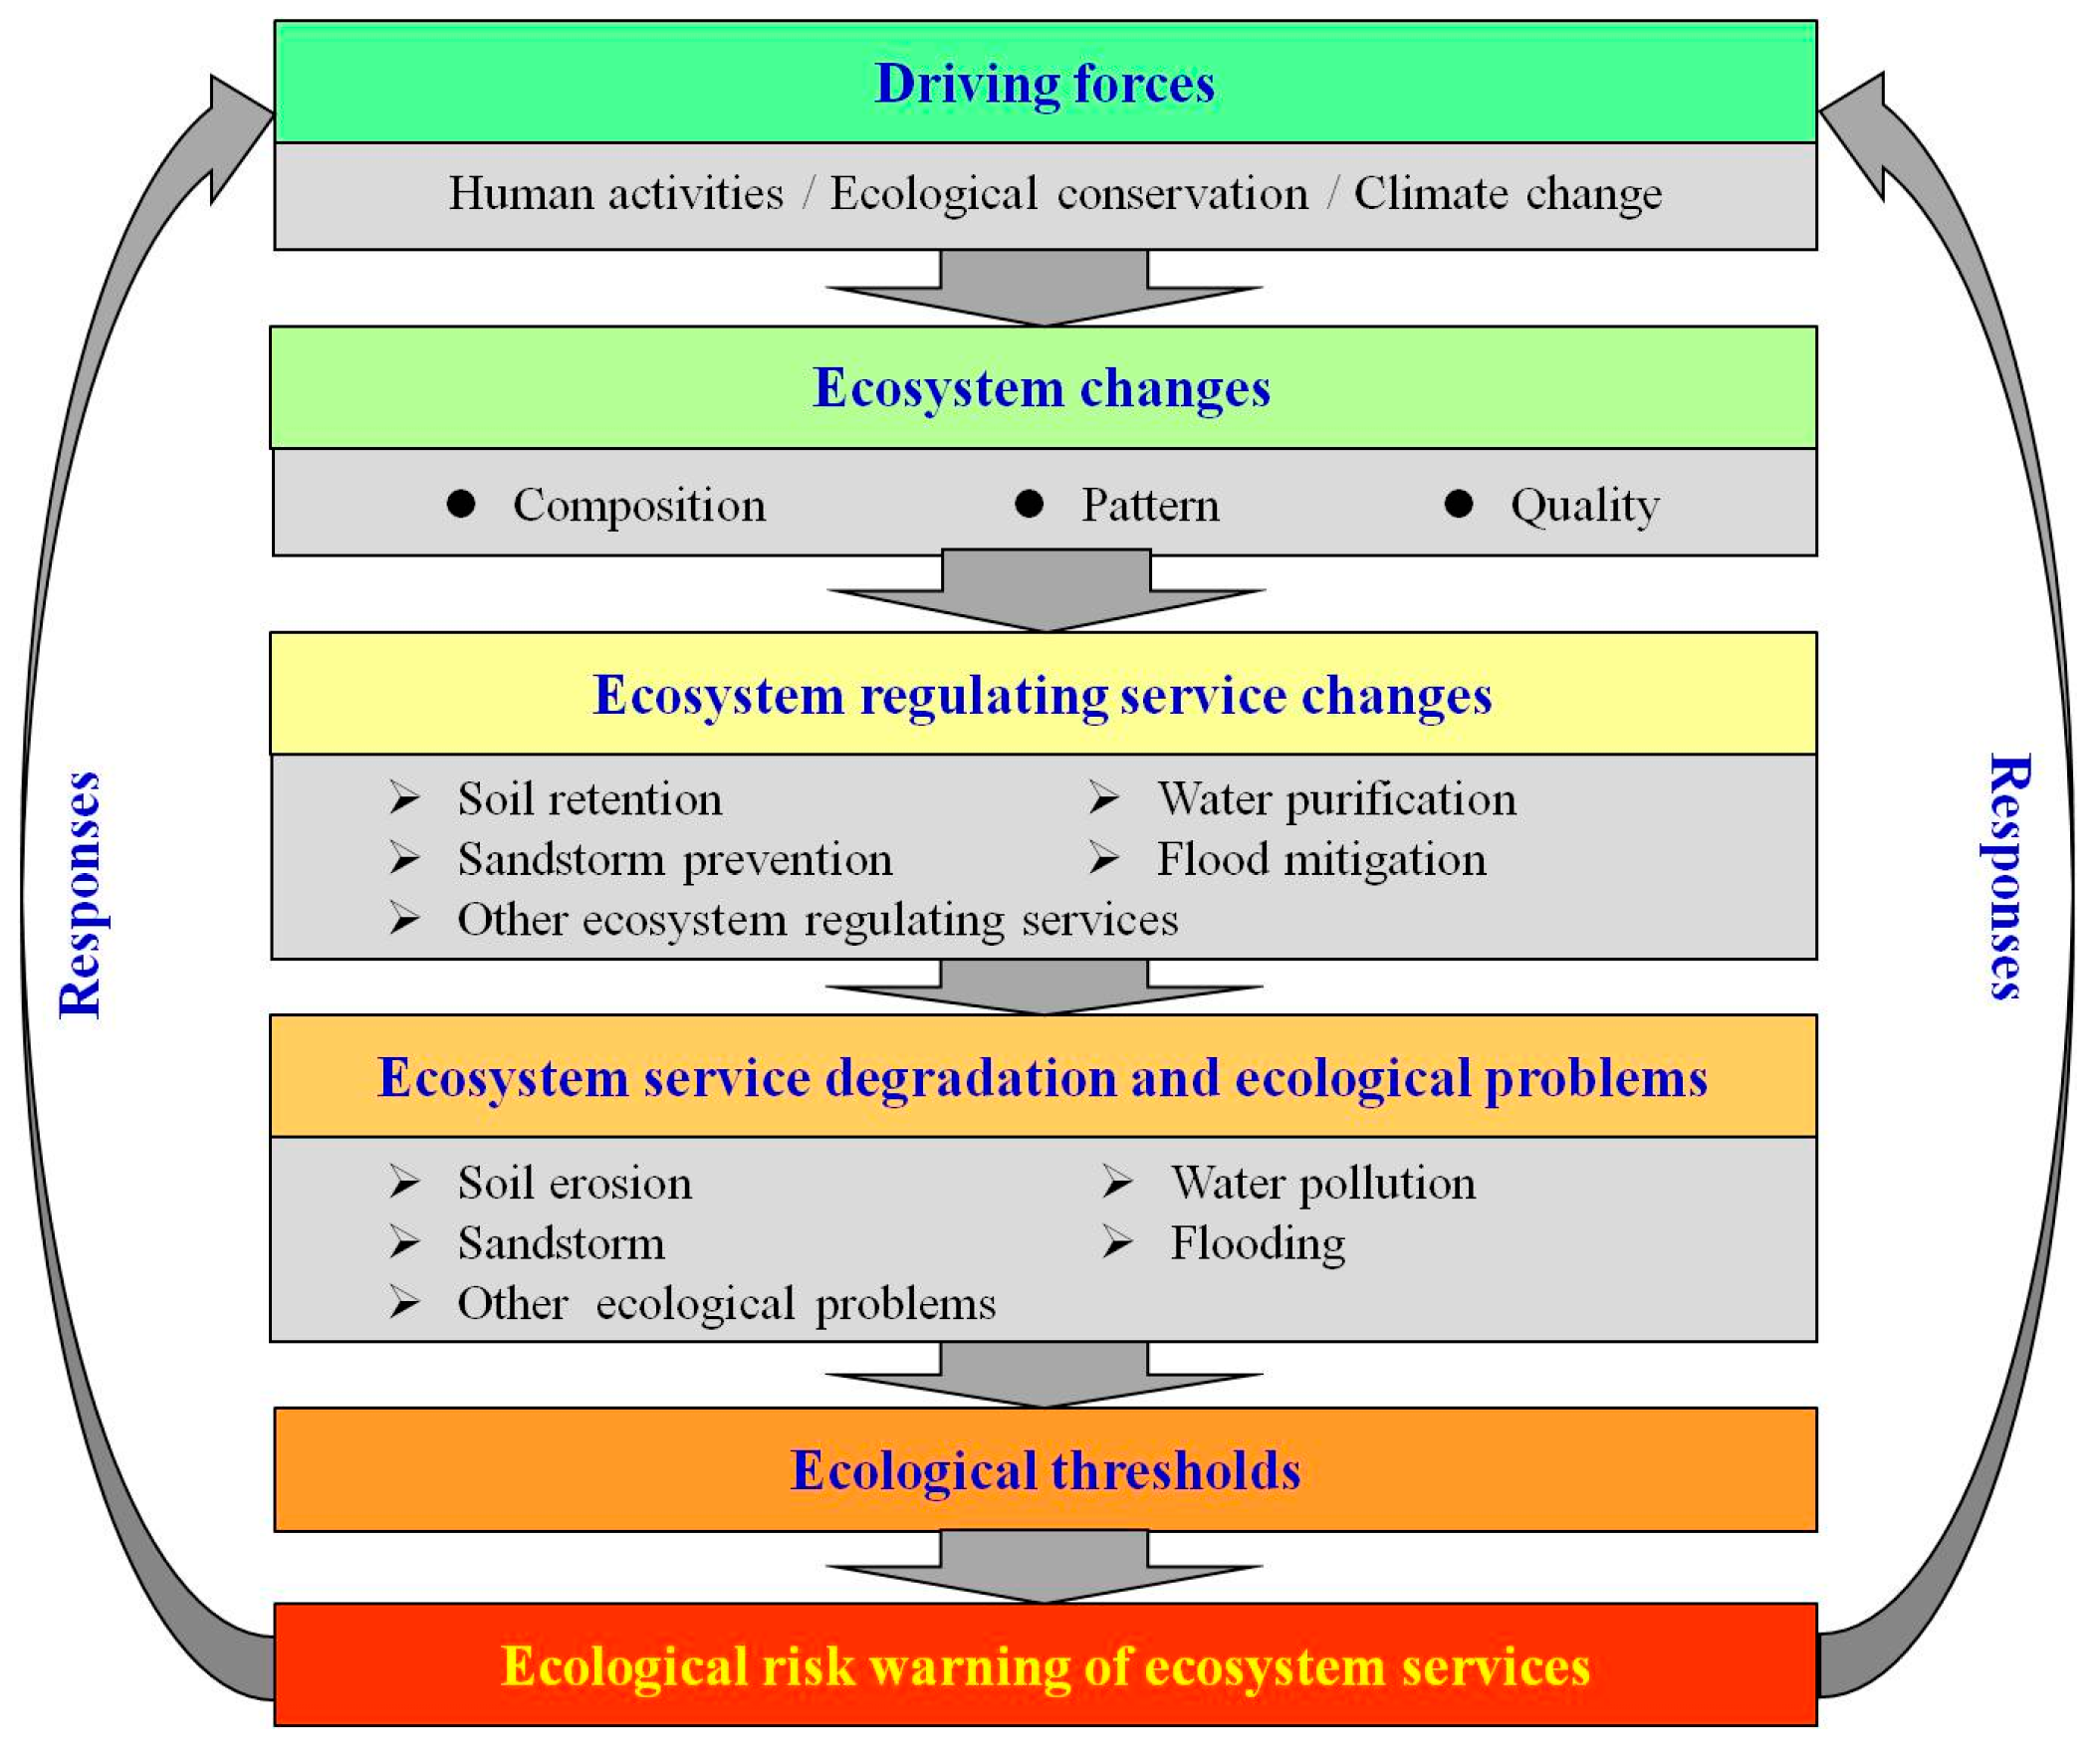
The framework on establishing a regional warning system on ecological risks includes several steps focused on integrating internal connections among ecosystem changes, ecosystem service changes, ecological problems, and ecological risks together (Figure 2). First, the changes of ecosystem types and quality are analyzed. Second, the changes of important ecosystem services due to ecosystem changes are assessed. Third, from the changes of ecosystem services, the changes in the types of ecological problems are evaluated. Based on the thresholds for specific ecological problems, the state of the ecological risks is determined in order to provide information on ecological vulnerability. Finally, the driving forces that impact ecological risks are analyzed, and the information on the relationships among the changes of the ecosystem, ecosystem services, ecological problems, and ecological risks are provided to decisionmakers.
2.2.2. Ecosystem Classification and Quality Assessment
Based on the climate, topography, and other bio-geographic parameters in Ganzi [26], Ganzi’s ecosystems were classified into seven types: forest, shrub, grassland, wetland, farmland, urban, and barren land. According to the first step of the framework, ecosystem changes were first estimated, and in this study the ecosystem types and their associated changes were also analyzed between 2000 and 2015 in Ganzi in terms of area and quality.
Analysis of the changes in forests, shrubs, and grasslands were carried out, since the area of these three ecosystem types account for 90.5% of the total area of Ganzi. The relative biomass density (RBD) is used as the ecosystem quality indicator of forest, shrub, and grassland ecosystems. First, the pixel binary model was used to obtain the vegetation coverage data of Ganzi’s forest and shrubs by MODIS (i.e., Moderate Resolution Imaging Spectroradiometer) image inversion. Second, the aboveground biomass of the forests and shrubs in Ganzi was obtained [27,28]. Third, Ganzi’s grassland ecosystem quality was evaluated by using the cumulative Net Primary Production (NPP) method [29] to calculate the aboveground biomass of the grasslands within the grass-growing period [30].
Forest, shrub, and grassland ecosystem quality index (Equation (1)) was calculated as follows:
where RBD means relative biomass density; Bi means the biomass of ecosystems (forest, shrub, or grassland) in pixel i; and Bcc means the biomass of ecosystems (forest, shrub, or grassland) in one pixel in the climax community. The ecosystem quality was classified into excellent, good, medium, low, and poor, in terms of RBD ≥ 80%, 60 ≤ RBD < 80, 40 ≤ RBD <60, 20 ≤ RBD < 40, and RBD < 20, respectively [29].
2.2.3. Soil Retention and Soil Erosion Assessment
Two ecosystem services, soil retention and sandstorm prevention, were estimated. Soil retention, in quantitative terms, is the difference between potential soil erosion and actual soil erosion [31]. The Universal Soil Loss Equation (USLE) was used to calculate soil retention (SR) and actual soil erosion (SEa), which is strongly influenced by rainfall, soil, topography, and vegetation. The model can be expressed as follows [31]:
Potential soil erosion:
Actual soil erosion:
Soil retention:
where is the potential soil erosion; is the actual soil erosion; SR is soil retention capacity (expressed in tons per hectare per year); R is the rainfall erosivity factor (MJ·mm·ha−1·h−1·yr−1), which is determined in terms of the kinetic energy (megajoules) of raindrops and the intensity of rainfall (in hectare-millimeters per hour) over one year; K is the erodibility of soil, or the amount of soil lost through erosion from unit area following rainfall of a given intensity (t·ha·h·ha−1·MJ−1·mm−1); LS is the topographic factor and represents the effect of the length of slope; and C is the vegetation cover factor. The model was described and validated by Kong et al. [32].
2.2.4. Sandstorm Prevention and Wind Erosion Assessment
The second ecosystem service estimated is sand storm prevention, which refers to the amount of sand retained in an ecosystem within a certain period (one year for this study). The Revised Wind Erosion Equation (RWEQ) model was used [33,34] to estimate the sand storm prevention service and wind erosion.
The RWEQ combines empirical and process-based modeling and has been extensively tested under broad field conditions. To simulate sand/soil loss at a regional scale over varying vegetation cover and patterns, the RWEQ in PC Raster [35] was modified. PC Raster is an environmental modeling language embedded in ArcGIS, providing spatial and temporal functions that can be used to construct regional models.
The RWEQ model estimates sand/soil loss at a specific point (SL; kg m−2) as a function of several factors: weather (WF); soil erodibility (EF); soil crust (SCF); surface roughness (K’); and vegetation cover (C), which permit estimation of the maximum transport capacity by wind (Qmax) as follows (Equations (5)–(7)):
where (kg m−1) is the maximum transport capacity, S (m) is the critical field length, z (m) is the distance from the upwind edge of the field, and SL (kg m−2) is the soil loss caused by wind erosion. The identification of above parameters was described in detail by Ouyang et al. [26].
2.2.5. Ecological Problem Assessment and Ecological Risk Warning
Based on the estimation of soil erosion and wind erosion intensity from the USLE and RWEQ, the ecological problems were classified into different levels of soil erosion and wind erosion according to the ‘Classification Criteria for Soil Erosion’ [36]. In this study, the soil erosion can be classified into four levels (slight, low, medium, high), while the wind erosion can be classified into three levels (slight, low, medium).
When conducting the ecological risk assessment, the ecological thresholds were first identified. According to the soil erosion level criteria in the ‘Classification Criteria for Soil Erosion’ [36], Ganzi’s allowable soil loss amount per unit area from wind erosion is 200 (t·km−2·yr−1), and the threshold is 500 (t·km−2·yr−1) for water erosion. The two values are the estimated threshold levels for ecological risk warning. The ecological risk can be further classified into four levels (i.e., low, medium, high, and extremely high) according to different threshold values (Table 1).
2.2.6. Statistical Analysis and Data Source
Changes in the provision of ecosystem services from 2000 to 2015 are the result of changes in biophysical factors and socioeconomic development. Here, a broad set of biophysical and socioeconomic variables were considered. The main biophysical variables are the initial level of ecosystem composition and quality, and the changes of ecosystem composition and quality. The main socioeconomic variables are total human population, agricultural population, agricultural output value, grain yield, and livestock inventories, which can reflect the human activity influences on land-use changes or grassland degradation.
A correlation analysis and multiple general linear model (GLM) regression were performed in order to identify the relationships between four types of ecosystem services and the above socioeconomic impact factors. All the statistical analyses were conducted using the software Stata (version 13.0; StataCorp, College Station, TX, USA).
The data for this study were obtained from the different sources listed below.
- (1)
- Ecosystem classification images for the years of 2000 and 2015 were obtained from the Institute of Remote Sensing and Digital Earth, Chinese Academy of Sciences. The images are environmental and disaster monitoring and forecasting of small satellite constellation (HJ-1A/B) and Landsat OLI (resolution 90 m) images. The images were classified using object-oriented multi-scale segmentation and decision tree procedures [32]. The ecosystems were categorized into forest, shrub, grassland, wetland, farmland, urban, and barren land.
- (2)
- Data on vegetation cover for the years of 2000 and 2015, in the form of moderate resolution imaging spectroradiometer (MODIS) data (250 m resolution), were also obtained from the Institute of Remote Sensing and Digital Earth, Chinese Academy of Sciences.
- (3)
- The Digital Elevation Model (DEM) was from the U.S. Geological Survey (USGS) with the resolution of 90 m [37].
- (4)
- Soil maps (1:1,000,000) and data on associated soil attributes (e.g., the mass percentages of clay, silt, sand, and soil organic matter) were from the Second National Soil Survey of China [38].
- (5)
- Average annual rainfall erosivity data were obtained from Beijing Normal University. Monthly average rainfall, wind speed, and temperature data were obtained from the Chinese Ecosystem Research Network (CERN) (http://www.cnern.org.cn/) and the Institute of Geographical Sciences and Natural Resource Research in China. Spatial interpolation was conducted on the meteorological station data to get weather raster data.
- (6)
- County-level socio-economic and agriculture data were from the Agricultural Information Institute of the Chinese Academy of Agricultural Sciences. They contained crop yield (e.g., annual grain yield of rice, wheat, maize, and oil from oilseed crops) and the total population in each county in the years of 2000 and 2015 [38].
3. Results
3.1. Ecosystem Type and Quality Changes
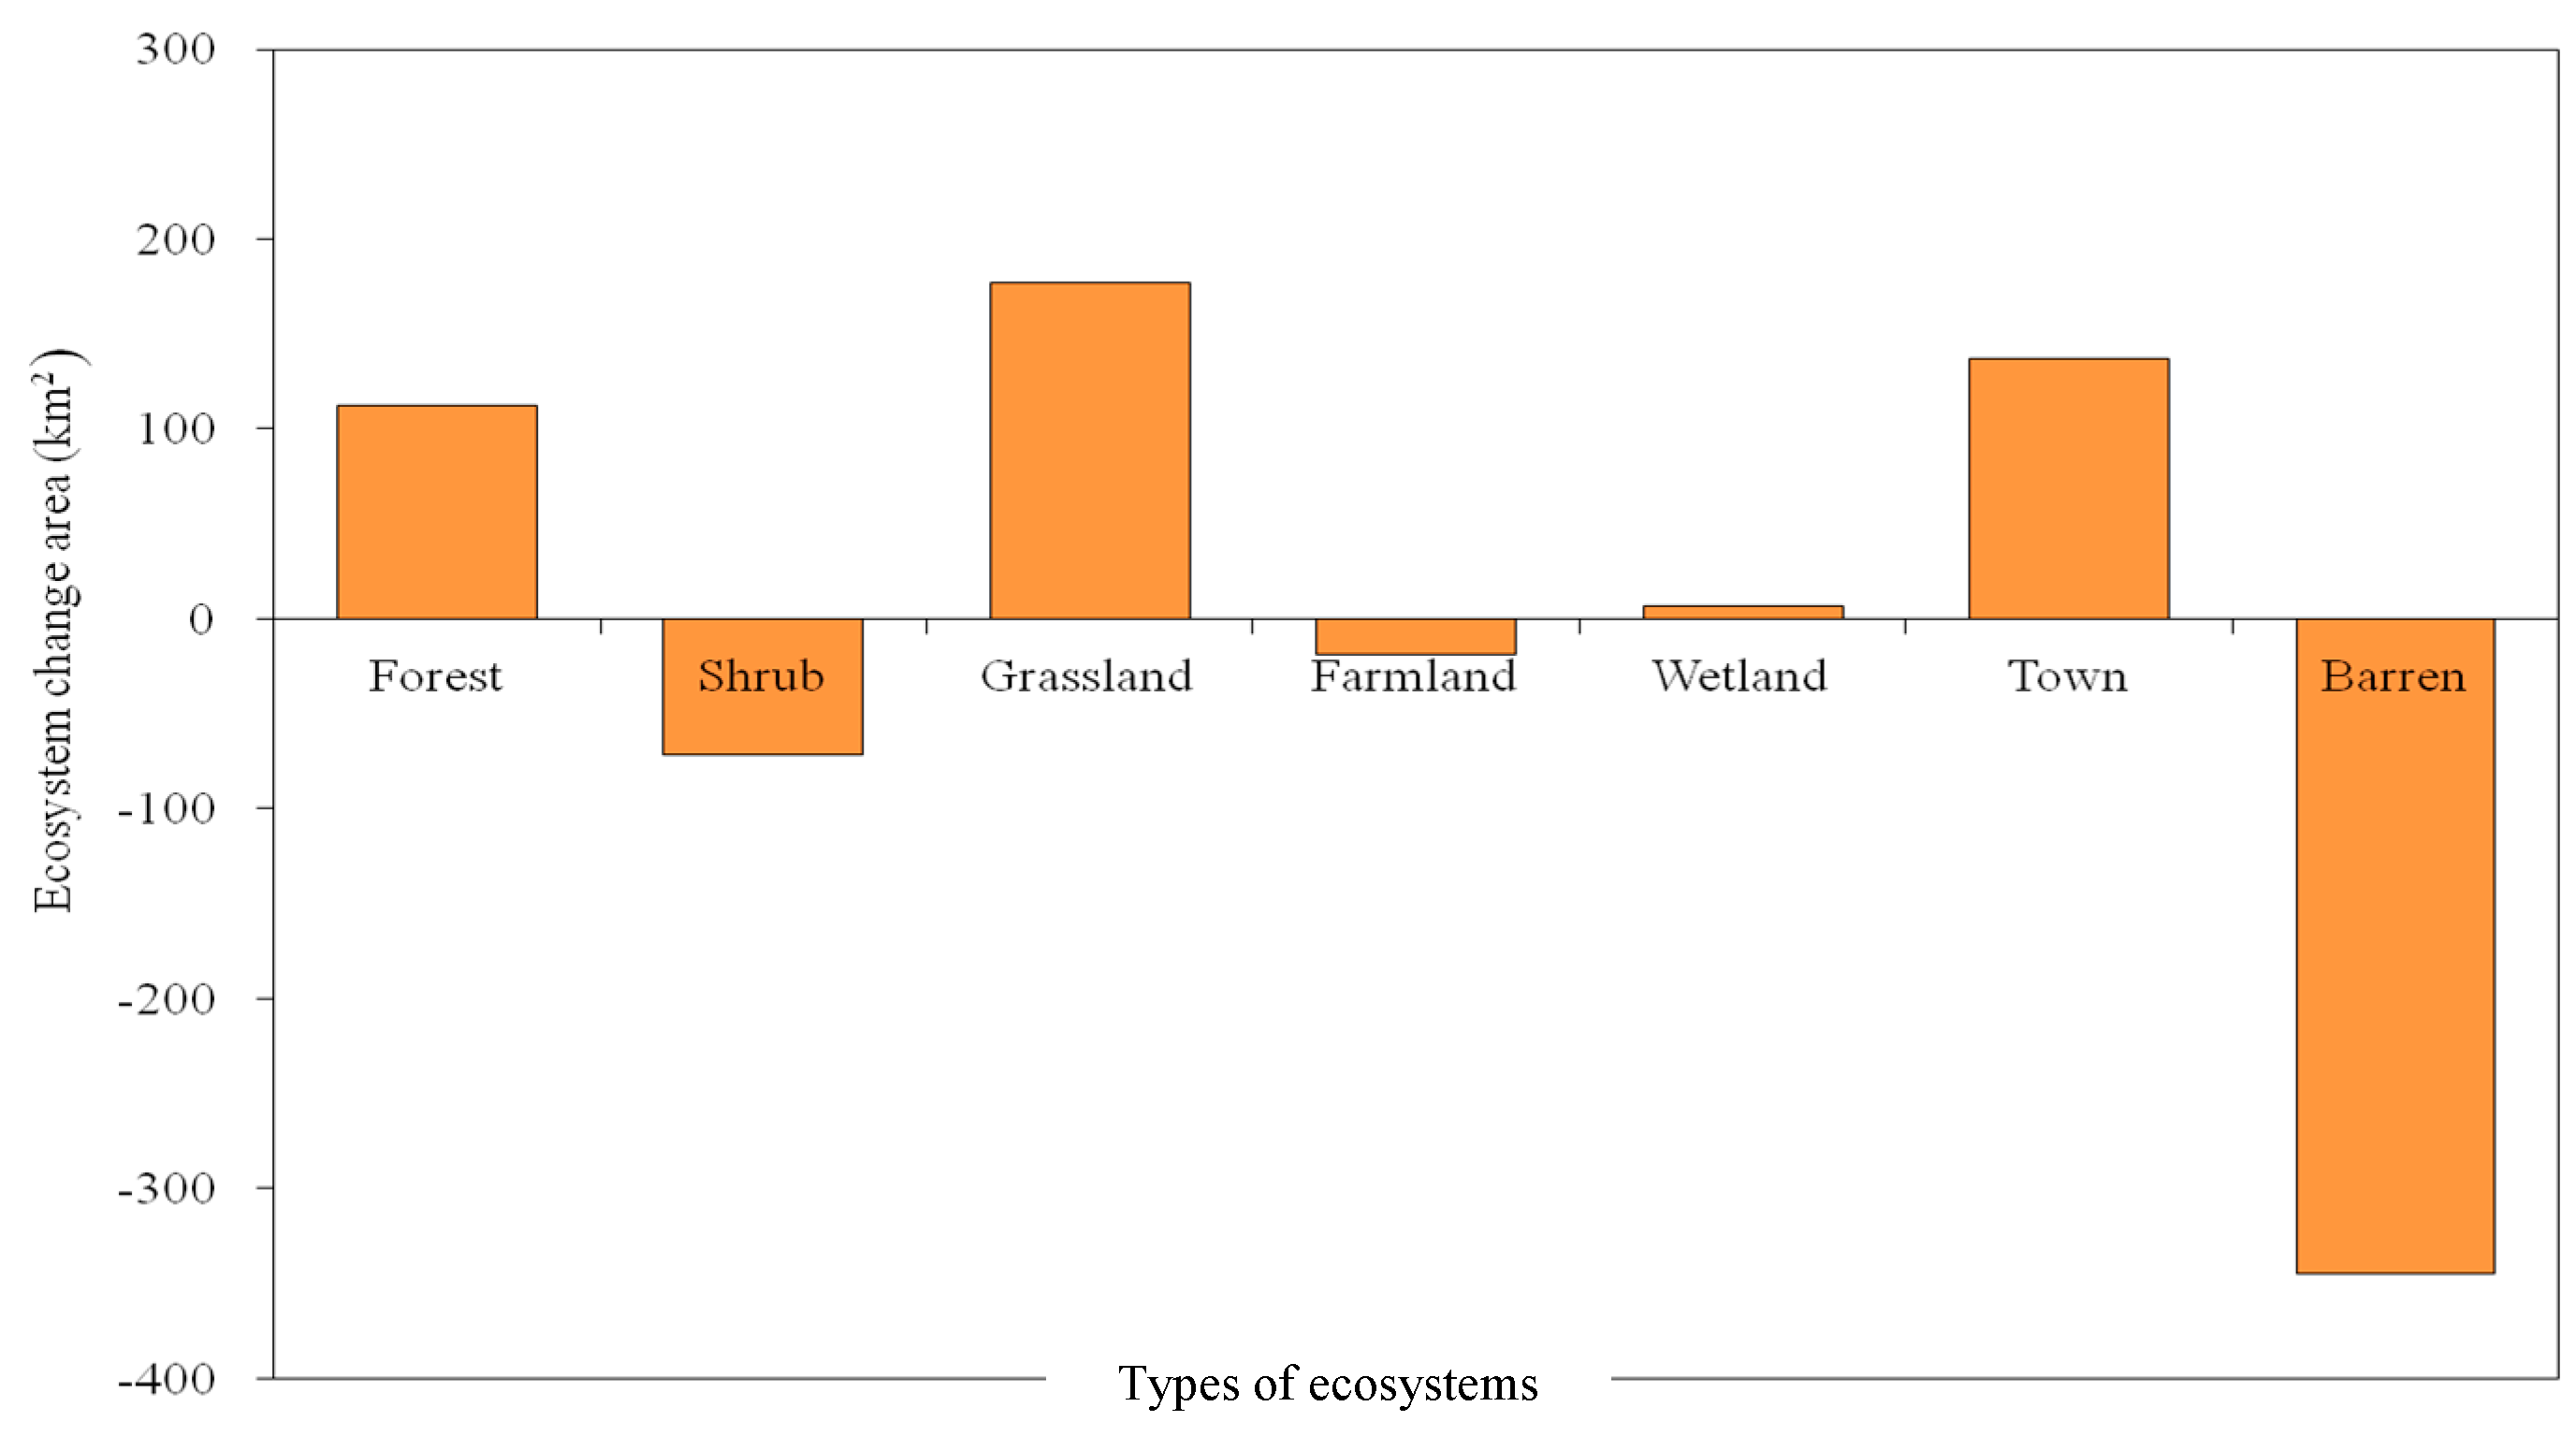
The main ecosystem types in Ganzi are grassland, shrub, and forest, which account for 47.6%, 21.5%, and 21.4% of the total area in Ganzi in 2015, respectively. The ecosystem types changed greatly, where the areas of farmland and barren lands decreased by 1.1% and 3.5%, respectively. The areas of forest and grassland increased by 0.4% and 0.3%, respectively, whereas shrub area decreased by 0.2%. Areas classified as town had the greatest increase rate (202.9%) during the past 15 years (Figure 3).
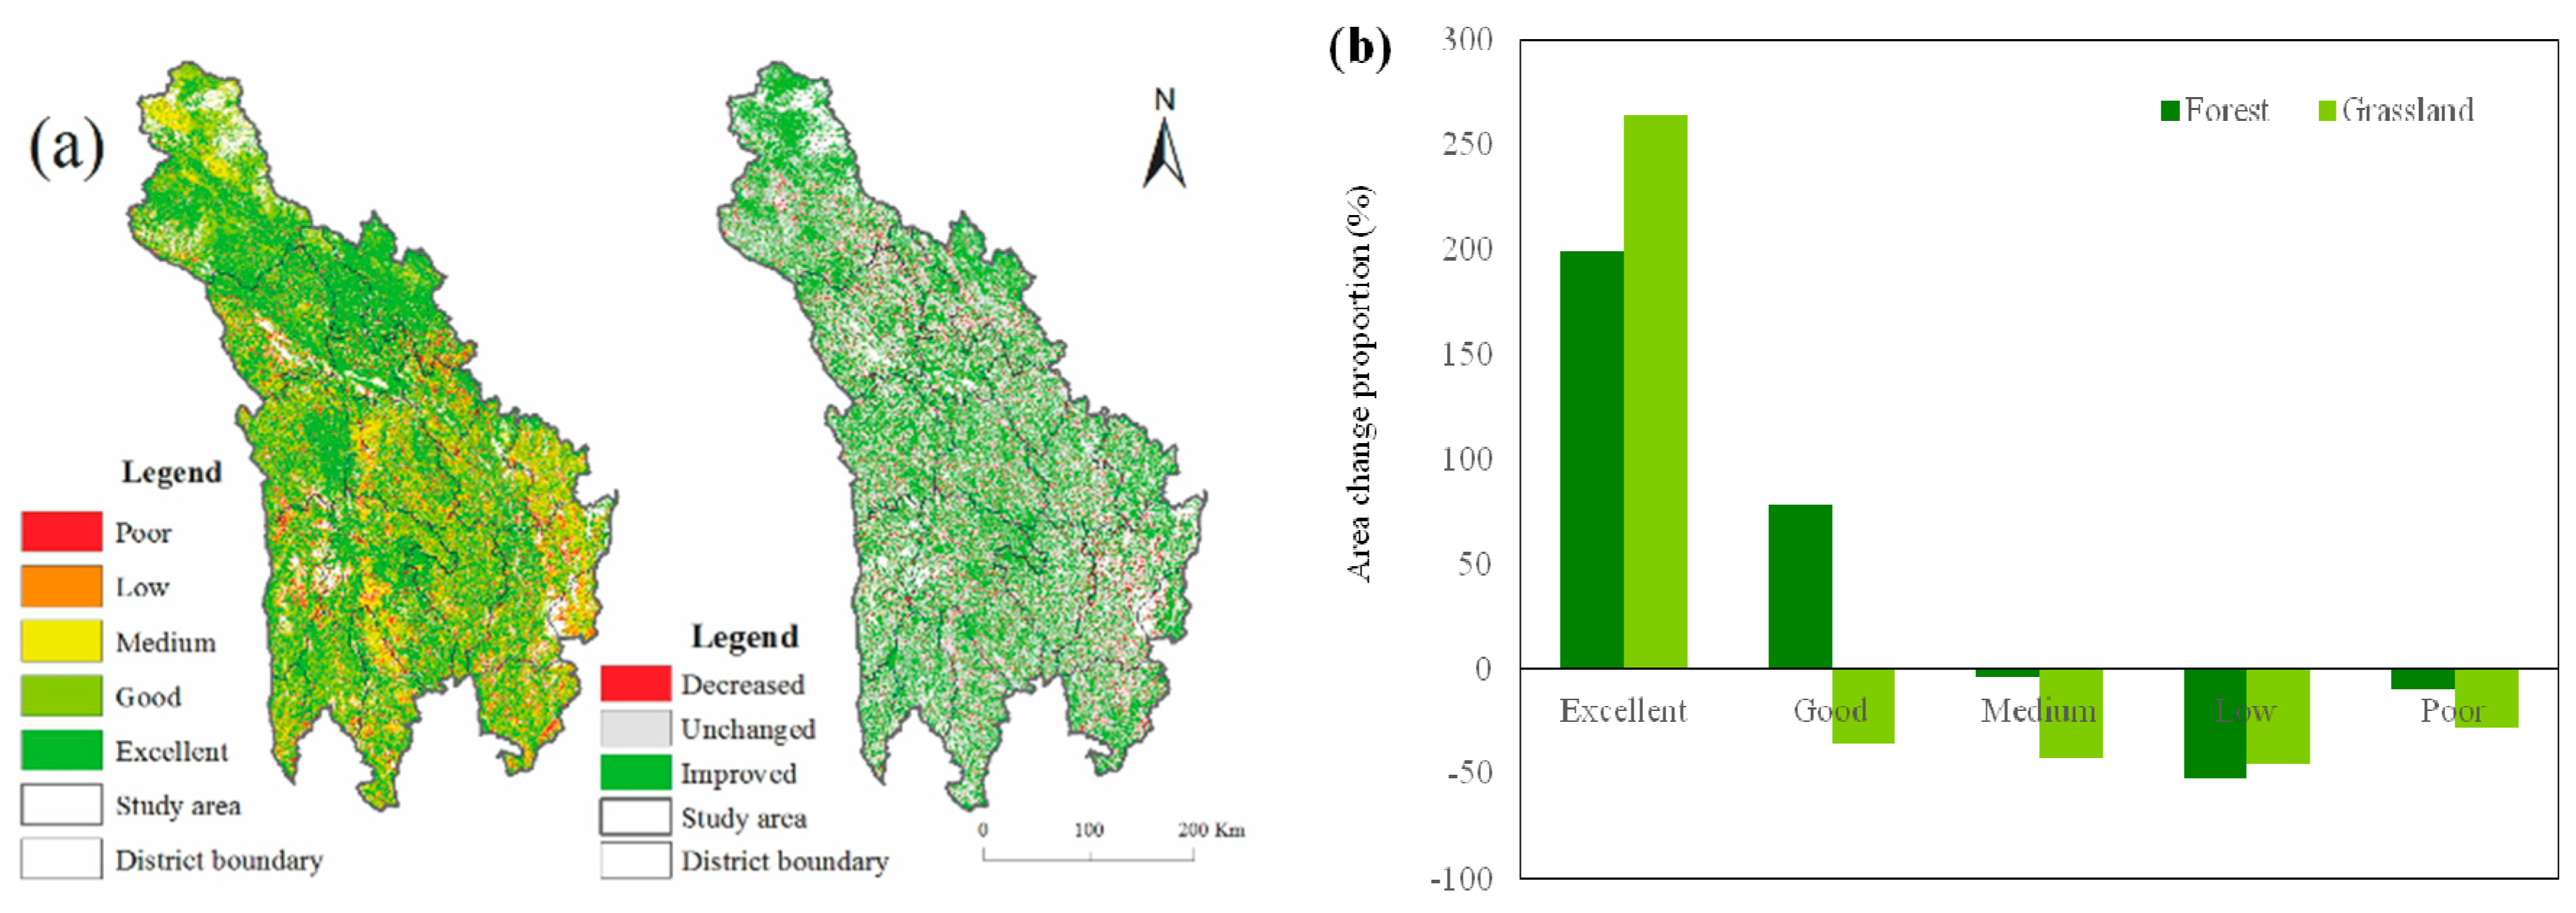
The quality of natural vegetation increased gradually between 2000 and 2015 (Figure 4a). The areas of forest with excellent and good grades increased by 199.21% and 78.26%, respectively, while the areas of forest with medium, low, and poor grades decreased by 3.57%, 51.71%, and 9.87% respectively. The area of grassland with an excellent grade increased by 263.77%, while the area of grassland with other quality grades decreased (Figure 4b).
3.2. Ecosystem Service and Ecological Problems Assessment
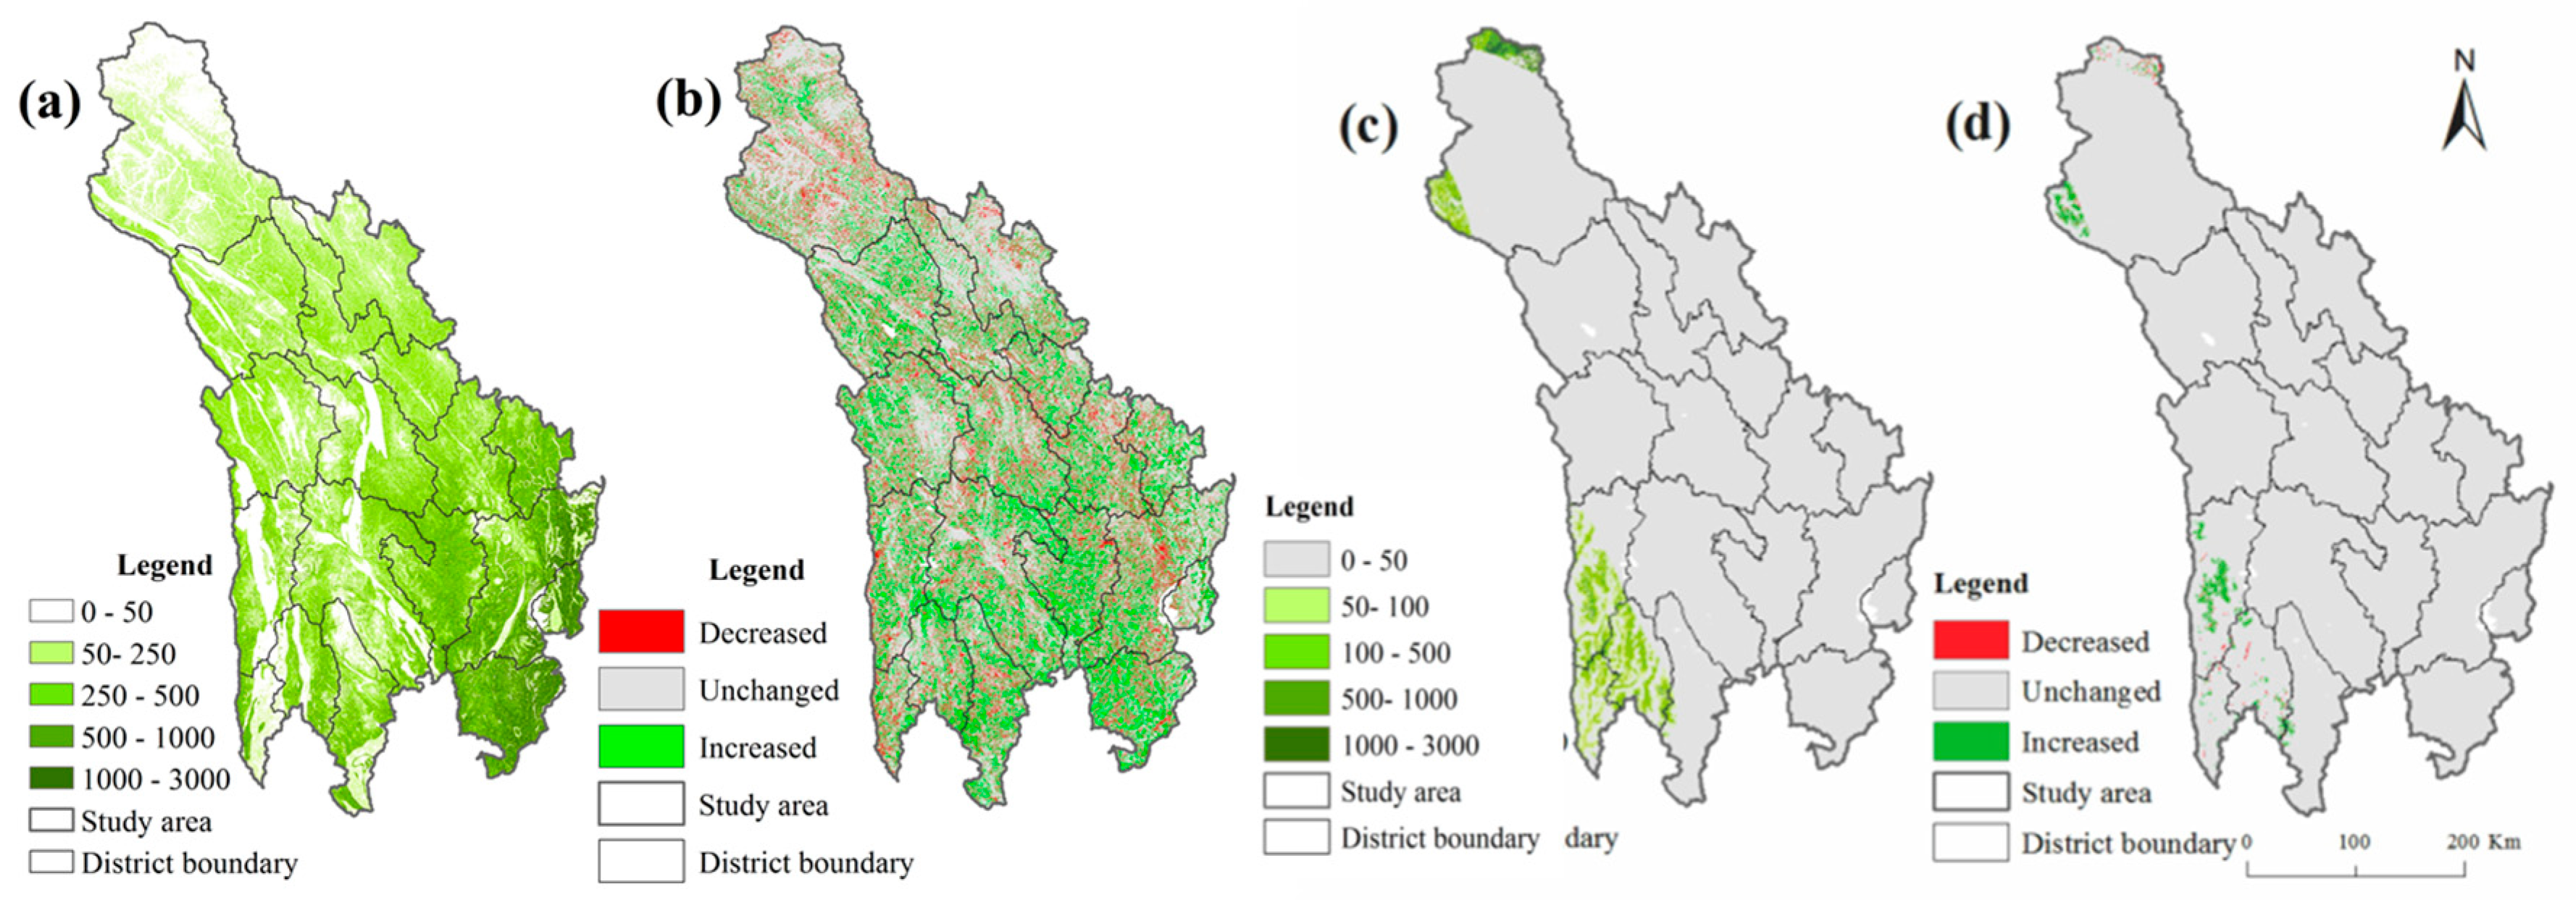
The region with higher soil retention was mainly located in central and southeastern Ganzi. Between 2000 and 2015, the soil retention service increased by 66.9%. The sandstorm prevention region is mainly in northern and southwestern Ganzi. The sandstorm prevention service increased by 8.6% (Figure 5).
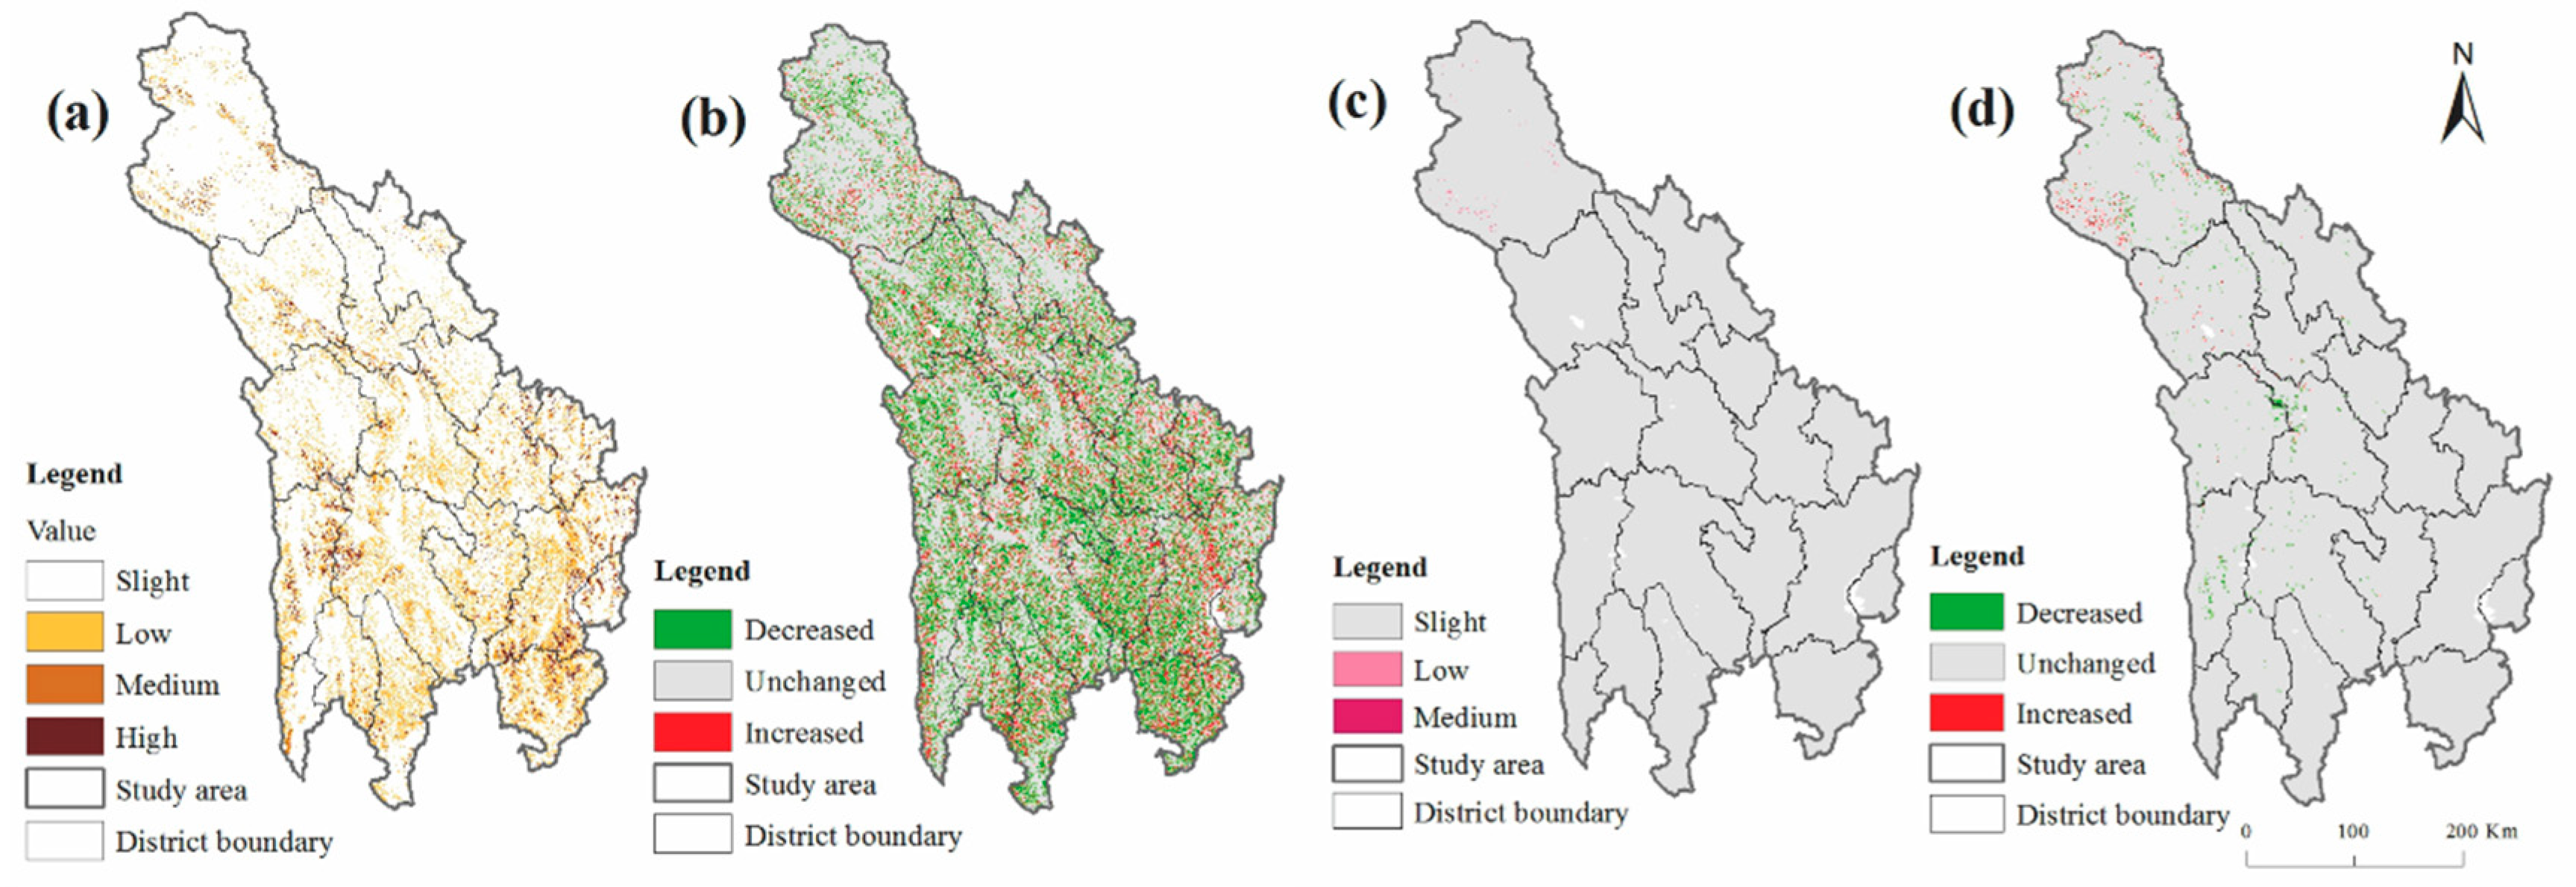
In 2015, only 1.9% of the area in Ganzi was identified as having a high grade of soil erosion. The slight, low, and medium grades were 80.3%, 16.1%, and 1.7%, respectively (Figure 6a). From 2000 to 2015, the area with decreasing soil erosion accounted for 24.2% of Ganzi’s total area. However, 8.1% of the area represented an increase in soil erosion (Figure 6b).
In Ganzi, 0.1% of the total area was identified as being representational of low and medium desertification in 2015, and the desertification degree of other areas was slight (Figure 6c). From 2000 to 2015, 0.8% the area had decreased desertification, however, 1.3% of the area had increased desertification (Figure 6d).
3.3. Ecological Risk Assessment
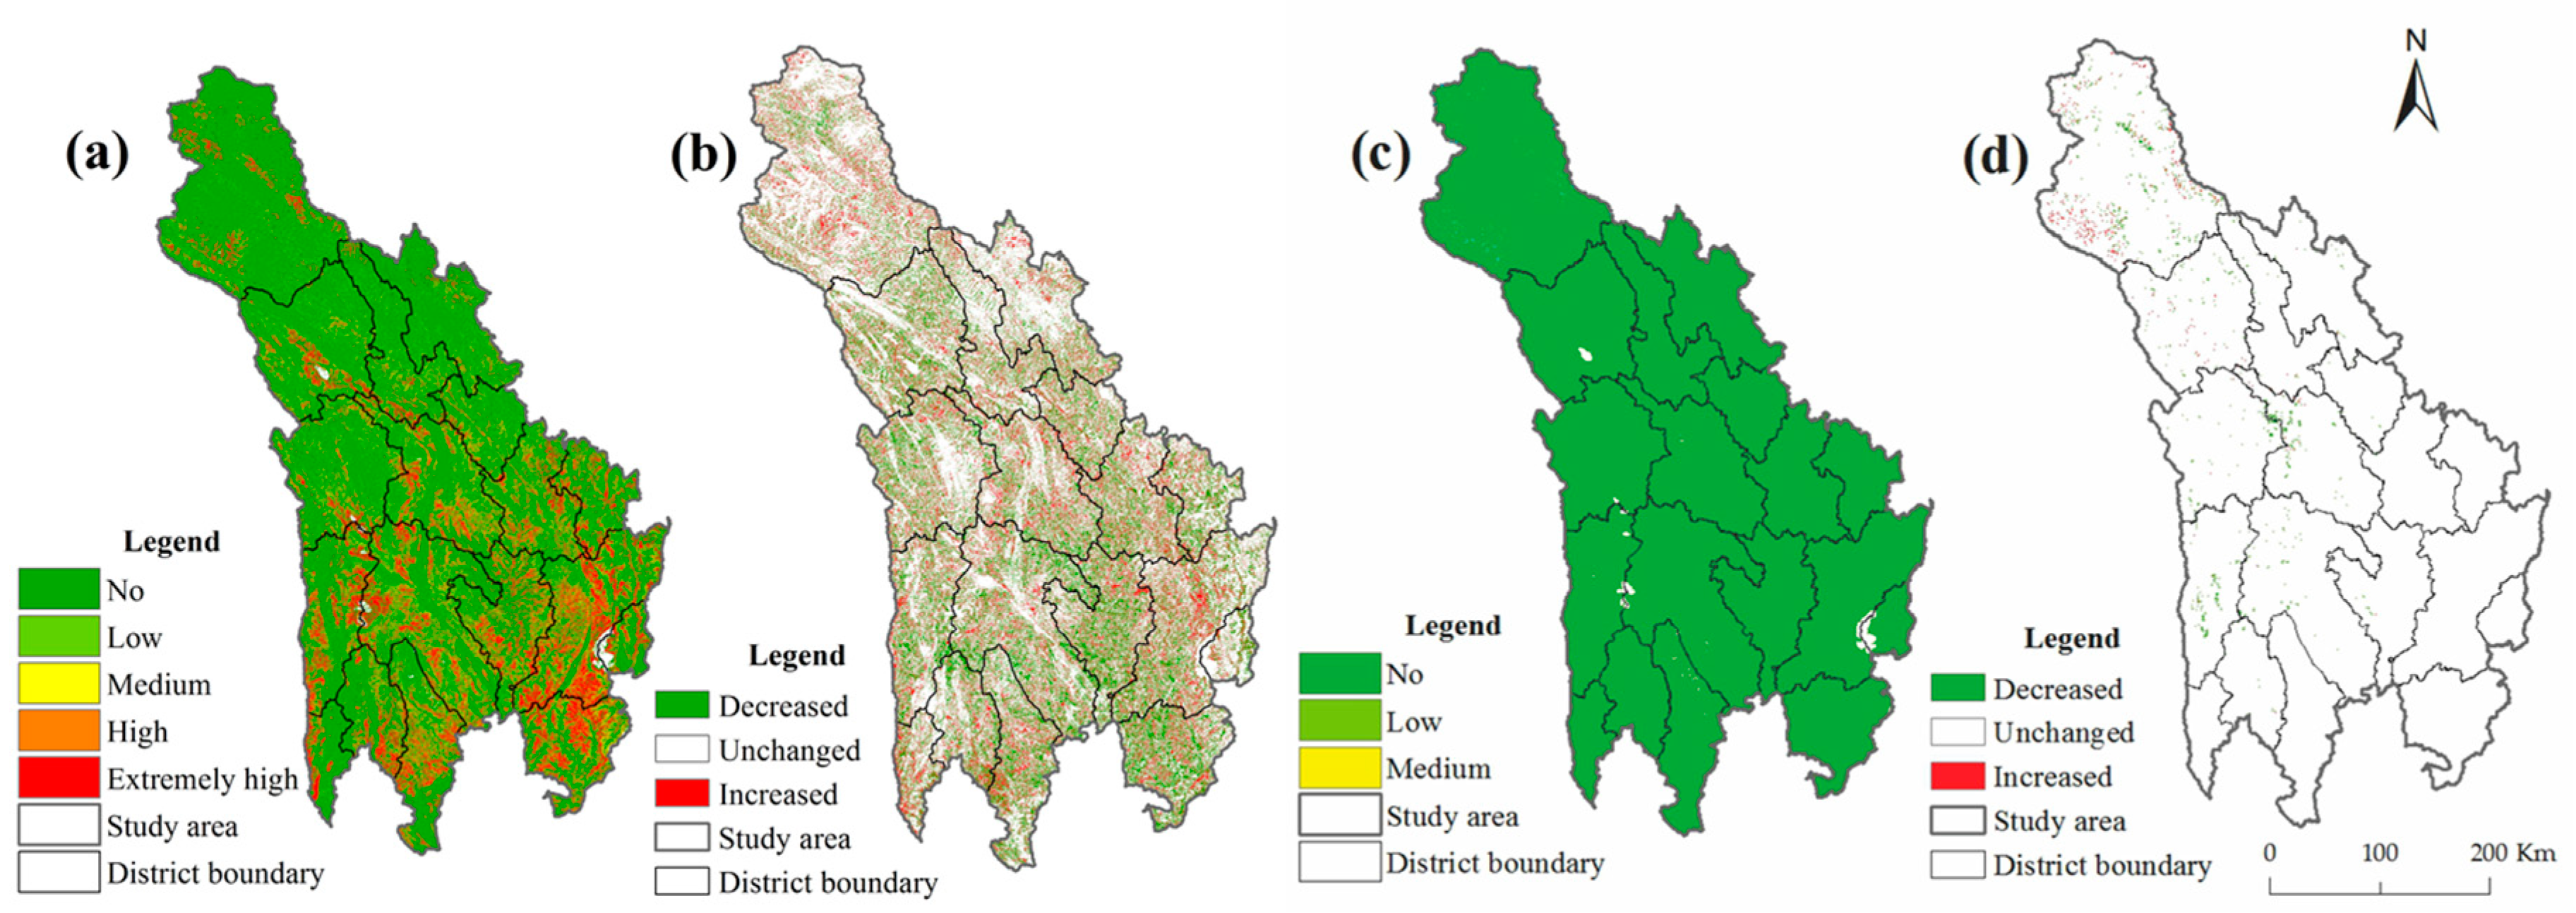
According to the water erosion intensity, the areas with no, low, medium, high, and extremely high ecological risk were 72.86%, 8.71%, 4.67%, 3.18%, and 10.57%, respectively, in 2015 (Figure 7a). This indicated that 27.14% of the study area was in ecological risk caused by water erosion. From 2000 to 2015 (Figure 7b), the total area of ecological risk decreased by 8.8%. Among this area, the area with extremely high risk decreased by 13.95%, followed by high (9.55%), medium (6.67%), and low (2.68%). In contrast, low and medium ecological risks caused by wind erosion accounted for 0.08% and 0.002% of the study area, respectively, in 2015, and 99.91% of the land was not in ecological risk (Figure 7c). From 2000 to 2015, the percentages of different ecological risk grades almost remained unchanged (Figure 7d).
3.4. Impact Factors of Ecological Risk Changes
The changes in the provision of soil retention service and sandstorm prevention service from 2000 to 2015 are the result of changes in biophysical factors, and socioeconomic development (Table 2). Overall, the results suggest that natural vegetation changes contributed significantly to the increases in the two key ecosystem services in Ganzi. For the soil retention service, the coefficient for the aboveground forest biomass per unit area in 2000 is positive and statistically significant. Coefficients for the proportion of forest area in 2000, proportion of grassland area in 2000, and changes in the proportion of shrub area from 2000 to 2015 are negative and statistically significant. For the sandstorm prevention service, coefficients for the proportion of grassland area in 2000 and changes in the density of agricultural output are negative and statistically significant. Coefficients for the aboveground grassland biomass per unit area in 2000 and changes in the proportion of forest area from 2000 to 2015 are positive and statistically significant (Table 2).
4. Discussion
Ecosystems provide a series of goods and services essential for human well-being [1]. However, climate changes and human activities are damaging the ecosystem services, especially the regulating services [1]. These impacts have created many ecological problems (e.g., soil erosion, sandstorms, flooding) [26]. The main goals of regional ecosystem management are to identify the ecological risks of ecosystem services and their drivers and maintain the sustainable delivery of ecosystem services through effective warning systems of ecological risk [3,4]. A framework for ecological risk assessment was constructed using the ecosystem services approach in this study. The framework clarifies the methodological linkages between ecosystems, ecosystem services, ecological problems, ecological risks, and warning/management. The ecosystem services approach quantifies the risk changes and their drivers causing the loss of ecosystem services.
Based on the framework, the ecosystem changes were identified (Figure 3 and Figure 4), including ecosystem types and natural ecosystem quality (forest, shrub, and grassland), and their impacts on important ecosystem services (Figure 5). The increase in forest and grassland, and the decrease in farmland and barren land (Figure 3), in conjunction with improvements in forest and grassland quality (Figure 4), have greatly improved soil retention and sandstorm prevention services (Figure 5). Correspondingly, the ecological risks of ecosystem service degradation decreased gradually (Figure 6). By identifying the thresholds of ecological risks [39,40,41], the condition of the different ecosystem services relative to their stressors can be categorized [20]. The results also showed that changes of ecosystem types and quality influenced the ecological risks of ecosystem services [42].
The framework in this study links the changes of ecosystem services and their drivers, which could help inform regional ecological risk management. In this study in Ganzi, for soil retention, the coefficients of the proportion of forest area and grassland area in 2000, and the change in the proportion of shrub area from 2000 to 2015, were significantly negative. This shows that natural vegetation restoration, as well as the conversion from shrub to forest, was likely contributing to the improvement of ecosystem services. However, for sandstorm prevention, the coefficient for changes in the density of agricultural output was significantly negative (Table 2), which suggests that agricultural development is impairing the sandstorm prevention service; however, grassland restoration decreased the ecological risk of the sandstorm prevention service. These changes may mainly result from the implementation of the slope cropland conversion program and natural forest conservation program since 2000 [26] as well as the grassland conversion program [43]. Any improvement in the natural vegetation would likely further decrease the ecological risk to these ecosystem services. Complexities of ecological risk mitigation may exist due to the time-lag effect of ecological protection and restoration projects, as well as the linkages between ecosystems, ecosystem services, ecological problems, and ecological risks. In this study, the soil retention service and sandstorm prevention service increased by 66.92% and 8.59%, respectively, between 2000 and 2015, but ecological risk of soil retention decreased by 8.8%.
Therefore, the framework proposed in this study provides a new perspective (i.e., ecosystem services) for linking ecological problems and ecological risks. Different to the other studies on ecological risks [6,7,8], in this study changes in ecosystem services caused by ecosystem changes were regarded as a major reason of ecological risk. Also, according to the framework in this study, the driving factors for ecological risks were easily identified to provide a basis for risk prevention and control. In the Ganzi case study, forest and grassland areas increased and their quality improved, thereby enhancing the soil retention service, which further reduced the ecological risk of soil erosion. Thus, measures on forest and grassland protection and restoration will be the key factors controlling the ecological risk of soil erosion.
In the future, the framework of regional ecological risk assessment using the ecosystem services approach could prove to be quite helpful to the management of large landscapes. First, to make ecosystem service-based risk assessment feasible, the relationships between ecological mechanisms and ecosystem services should be further clarified [9,10,11] in order to provide causal information on ecological risk, which could then be used for the direct management of problems driving ecosystem service degradation. Second, more robust models for the ecological risk assessment of ecosystem services based on ecological mechanisms and ecosystem services provision to quantify the risks are needed [3]. Third, specific thresholds causing ecosystem services degradation for regional risk assessment should be measured [39,40,41]. It is also needed to strengthen the ecological risk prediction of ecosystem services based on future possible scenarios.
5. Conclusions
Traditional ecological risk assessment focuses on the assessment of adverse effects by toxic chemicals. Different from that, a framework for ecological risk assessment was constructed using the ecosystem services approach in this study and tested in Ganzi. The results showed that with the increase in area and quality of forest and grassland, the soil retention service and sandstorm prevention service increased by 66.92% and 8.59%, respectively, from 2000 to 2015. Correspondingly, the ecological risk of soil erosion decreased by 8.8%, and wind erosion remained stable. This indicated that the increase in vegetation and improvement in ecological quality cause a decrease in ecological risks of soil erosion and wind erosion by improvement of ecosystem services. Therefore, this research can contribute to improving the current understanding of the relationship among ecosystem changes, ecosystem services, and ecological risks. Additionally, the framework proposed in this study provides a new perspective for ecological risk assessment, and it can be applied to the management of large landscapes in the future.
Author Contributions
W.X. and T.D. conceived and designed the research; T.D. analyzed the data and wrote the paper; W.X., H.Z., Y.X., L.K., and Z.O. revised the paper and contributed materials; all authors read and approved the paper.
Funding
This research was funded by the National Natural Science Foundation of China (No. 71533005).
Conflicts of Interest
The authors declare no conflict of interest.
References
- Millennium Ecosystem Assessment (MEA). Ecosystems and Human Well-Being: Synthesis; Island Press: Washington, DC, USA, 2005. [Google Scholar]
- McNeely, J.A.; Mittermeier, R.A.; Brook, T.M.; Boltz, F.; Ash, A.N. The Wealth of Nature: Ecosystem Services, Biodiversity, and Human Well-Being; Conservation International: Arlington, VA, USA, 2011. [Google Scholar]
- Xu, X.B.; Yang, G.S.; Tan, Y.; Zhuang, Q.; Li, H.; Wan, R.; Su, W.; Zhang, J. Ecological risk assessment of ecosystem services in the Taihu Lake Basin of China from 1985 to 2020. Sci. Total Environ. 2016, 554–555, 7–16. [Google Scholar] [CrossRef] [PubMed]
- Lawler, J.J.; Lewis, D.J.; Nelson, E.; Plantinga, A.J.; Polasky, S.; Withey, J.C.; Helmers, D.P.; Martinuzzi, S.; Pennington, D.; Radeloff, V.C. Projected land-use change impacts on ecosystem services in the United States. Proc. Natl. Acad. Sci. USA 2014, 111, 7492–7497. [Google Scholar] [CrossRef] [PubMed] [Green Version]
- Munns, J.W.R. Assessing risks to wildlife populations from multiple stressors: Overview of the problem and research needs. Ecol. Soc. 2006, 11, 23. [Google Scholar] [CrossRef]
- Environmental Protection Agency. Guidelines for Ecological Risk Assessment (EPA/630/R-95/002F); Federal Register: Washington, DC, USA, 1998; pp. 26846–26924.
- Moraes, R.; Molander, S. A procedure for ecological tiered assessment of risks (PETAR). Hum. Ecol. Risk Assess. 2004, 10, 349–371. [Google Scholar] [CrossRef]
- Landis, W.G.; Wiegers, J.K. Ten years of the relative risk model and regional scale ecological risk assessment. Hum. Ecol. Risk Assess. 2007, 13, 25–38. [Google Scholar]
- Bennett, E.M.; Peterson, G.D.; Gordon, L.J. Understanding relationships among multiple ecosystem services. Ecol. Lett. 2009, 12, 1394–1404. [Google Scholar] [CrossRef] [PubMed] [Green Version]
- Daily, G.C.; Matson, P.A. Ecosystem services: From theory to implementation. Proc. Natl. Acad. Sci. USA 2008, 105, 9455–9456. [Google Scholar] [CrossRef] [PubMed]
- Wong, C.P.; Jiang, B.; Kinzig, A.P.; Kai, N.L.; Ouyang, Z. Linking ecosystem characteristics to final ecosystem services for public policy. Ecol. Lett. 2015, 18, 108–118. [Google Scholar] [CrossRef] [PubMed]
- Galic, N.; Schmolke, A.; Forbes, V.; Baveco, H.; van, P.J. The role of ecological models in linking ecological risk assessment to ecosystem services in agroecosystems. Sci. Total Environ. 2012, 415, 93–100. [Google Scholar] [CrossRef] [PubMed] [Green Version]
- Xu, X.B.; Tan, Y.; Chen, S.; Yang, G. Changing patterns and determinants of natural capital in the Yangtze River Delta of China 2000–2010. Sci. Total Environ. 2014, 466–467, 326–337. [Google Scholar] [CrossRef] [PubMed]
- Dawson, N.; Martin, A. Assessing the contribution of ecosystem services to human wellbeing: A disaggregated study in western Rwanda. Ecol. Econ. 2015, 117, 62–72. [Google Scholar] [CrossRef] [Green Version]
- Li, C.; Zheng, H.; Li, S.; Chen, X.; Li, J.; Zeng, W.; Liang, Y.; Stephen, P.; Marcus, W.F.; Mary, R.; et al. Impacts of conservation and human development policy across stakeholders and scales. Proc. Natl. Acad. Sci. USA 2015, 112, 7396–7401. [Google Scholar] [CrossRef] [PubMed] [Green Version]
- Gómez-Baggethun, E.; Groot, R.D.; Lomas, P.L.; Montes, C. The history of ecosystem services in economic theory and practice: From early notions to markets and payment schemes. Ecol. Econ. 2010, 69, 1209–1218. [Google Scholar] [CrossRef]
- Smith, J. Sand storm. New. Sci. 2018, 237, 35–39. [Google Scholar] [CrossRef]
- Pereira, P.; Bogunovic, I.; Muñoz-Rojas, M.; Brevik, E.C. Soil ecosystem services, sustainability, valuation and management. Curr. Opin. Environ. Sci. Health 2018, 5, 7–13. [Google Scholar] [CrossRef]
- Sun, X.; Li, C.; Kuiper, K.F.; Zhang, Z.; Gao, J.; Wijbrans, J.R. Human impact on erosion patterns and sediment transport in the Yangtze River. Glob. Planet. Chang. 2016, 143, 88–99. [Google Scholar] [CrossRef]
- Xu, W.H.; Yang, Y.Y.; Zhang, L.; Xiao, Y.; Wang, X.; Ouyang, Z. Evaluation methods and case study of regional ecological carrying capacity for early-warning. Prog. Geogr. 2017, 36, 306–312. (In Chinese) [Google Scholar]
- Groffman, P.; Baron, J.; Blett, T.; Gold, A.J.; Goodman, I.; Gunderson, L.H.; Levinson, B.M.; Palmer, M.A.; Paerl, H.W.; Peterson, G.D.; et al. Ecological thresholds: The key to successful environmental management or an important con-cept with no practical application? Ecosystems 2006, 9, 1–13. [Google Scholar] [CrossRef]
- Zhu, W.Z.; Fan, J.R.; Wang, Y.K.; Sheng, X.H.; Tian, B.W. Assessment of biodiversity conservation importance in the upper reaches of the Yangtze River: By taking county area as the basic assessment unit. Acta. Ecol. Sin. 2009, 29, 2603–2611. (In Chinese) [Google Scholar]
- Peng, L. The Geographical Pattern of Wild Vertebrate and Assessment for Biodiversity Conservation Priority in Ganzi; Chengdu University of Technology: Chengdu, China, 2014. (In Chinese) [Google Scholar]
- Zhang, J.H.; Wang, Y.; Zhang, Z.H. Effect of terrace forms on water and tillage erosion on a hilly landscape in the Yangtze River Basin, China. Geomorphology 2014, 216, 114–124. [Google Scholar] [CrossRef]
- Tao, Y.; Wang, H.; Ou, W.; Guo, J. A land-cover-based approach to assessing ecosystem services supply and demand dynamics in the rapidly urbanizing Yangtze River Delta region. Land Use Policy 2018, 72, 250–258. [Google Scholar] [CrossRef]
- Ouyang, Z.; Zheng, H.; Xiao, Y.; Polasky, S.; Liu, J.; Xu, W.; Wang, Q.; Zhang, L.; Xiao, Y.; Rao, E.; et al. Improvements in ecosystem services from investments in natural capital. Science 2016, 352, 1455–1459. [Google Scholar] [CrossRef] [PubMed]
- Jiapaer, G.; Chen, X.; Bao, A. A comparison of methods for estimating fractional vegetation cover in arid regions. Agric. Forest Meteorol. 2011, 151, 1698–1710. [Google Scholar] [CrossRef]
- Song, W.; Mu, X.; Ruan, G.; Gao, Z.; Li, L.; Yan, G. Estimating fractional vegetation cover and the vegetation index of bare soil and highly dense vegetation with a physically based method. Int. J. Appl. Earth Obs. 2017, 58, 168–176. [Google Scholar] [CrossRef]
- Zhang, M.; Lal, R.; Zhao, Y.; Jiang, W.; Chen, Q. Estimating net primary production of natural grassland and its spatio-temporal distribution in China. Sci. Total Environ. 2016, 553, 184–195. [Google Scholar] [CrossRef] [PubMed]
- Xiao, Y.; Ouyang, Z.Y.; Wang, L.Y.; Rao, E.; Jiang, L.; Zhang, L. Spatial patterns of ecosystem quality in Inner Mongolia and its driving forces analysis. Acta. Ecol. Sin. 2016, 36, 6019–6030. (In Chinese) [Google Scholar]
- Rao, E.; Ouyang, Z.; Yu, X.; Xiao, Y. Spatial patterns and impacts of soil conservation service in China. Geomorphology 2014, 207, 64–70. [Google Scholar] [CrossRef]
- Kong, L.; Zheng, H.; Rao, E.; Xiao, Y.; Ouyang, Z.; Li, C. Evaluating indirect and direct effects of eco-restoration policy on soil conservation service in Yangtze River Basin. Sci. Total Environ. 2018, 631–632, 887–894. [Google Scholar] [CrossRef] [PubMed]
- Fryrear, D.W. Revised Wind Erosion Equation (RWEQ). In Wind Erosion and Water Conservation Research Unit; Technical Bulletin. No. 1; United States Southern Plains Area Cropping Systems Research Laboratory, USDA-ARS: Washington, DC, USA, 1998. [Google Scholar]
- Fryrear, D.W.; Chen, W.N.; Lester, C. Revised wind erosion equation. Ann. Arid Zone 2001, 40, 265–279. [Google Scholar]
- Karssenberg, D.; Jong, K.D. Dynamic environmental modeling in GIS: 1. Modelling in three spatial dimensions. Int. J. Geogr. Inf. Sci. 2005, 19, 623–637. [Google Scholar] [CrossRef]
- China’s Ministry of Water Resources, SL190-2007. Available online: https://wenku.baidu.com/view/486e14214b35eefdc8d333c6.html (accessed on 1 January 2018).
- China Ecosystem Assessment and Ecological Security Database. Available online: http://www.ecosystem.csdb.cn/ (accessed on 1 January 2018).
- Institute of the Chinese Academy of Agricultural Sciences. Available online: http://aii.caas.net.cn/ (accessed on 1 January 2018).
- Qian, S.S. Ecological threshold and environmental management: A note on statistical methods for detecting thresholds. Ecol. Indic. 2014, 38, 192–197. [Google Scholar] [CrossRef]
- Johnson, C.J. Identifying ecological thresholds for regulating human activity: Effective conservation or wishful thinking? Biol. Conserv. 2013, 168, 57–65. [Google Scholar] [CrossRef]
- Uehara, T. Ecological threshold and ecological economic threshold: Implications from an ecological economic model with adaptation. Ecol. Econ. 2015, 93, 374–384. [Google Scholar] [CrossRef]
- Sutton, P.C.; Anderson, S.J.; Costanza, R.A.; Kubiszewski, I. The ecological economics of land degradation: Impacts on ecosystem service values. Ecol. Econ. 2016, 129, 182–192. [Google Scholar] [CrossRef]
- Zhao, X.Q.; Zhao, L.; Li, Q.; Chen, H.; Zhou, H.; Xu, S.; Dong, Q.; WU, G.; He, Y. Using balance of seasonal herbage supply and demand to inform sustainable grassland management on the Qinghai-Tibetan Plateau. Front. Agric. Sci. Eng. 2018, 5, 1–8. [Google Scholar] [CrossRef]
Figure 1.
Location of Ganzi in China and landcover types in Ganzi.

Figure 2.
Framework for a regional ecological risk warning system based on the ecosystem services approach.
Figure 2.
Framework for a regional ecological risk warning system based on the ecosystem services approach.

Figure 3.
Area of ecosystem changes between 2000 and 2015 in Ganzi.

Figure 4.
Changes of forest and grassland ecosystem quality. (a) Distribution of improved and degraded forest and grassland ecosystems. (b) Proportion of area change of different qualities of forest and grassland ecosystems.
Figure 4.
Changes of forest and grassland ecosystem quality. (a) Distribution of improved and degraded forest and grassland ecosystems. (b) Proportion of area change of different qualities of forest and grassland ecosystems.

Figure 5.
Changes in the soil retention service and sandstorm prevention service between 2000 and 2015. (a) Soil retention service in 2015. (b) Soil retention service change. (c) Sandstorm prevention service in 2015. (d) Sandstorm prevention service change.
Figure 5.
Changes in the soil retention service and sandstorm prevention service between 2000 and 2015. (a) Soil retention service in 2015. (b) Soil retention service change. (c) Sandstorm prevention service in 2015. (d) Sandstorm prevention service change.

Figure 6.
Intensity changes of water erosion and wind erosion between 2000 and 2015. (a) Water erosion intensity in 2015. (b) Water erosion intensity change. (c) Wind erosion intensity in 2015. (d) Wind erosion intensity change.
Figure 6.
Intensity changes of water erosion and wind erosion between 2000 and 2015. (a) Water erosion intensity in 2015. (b) Water erosion intensity change. (c) Wind erosion intensity in 2015. (d) Wind erosion intensity change.

Figure 7.
Ecological risk changes between 2000 and 2015 caused by water erosion and wind erosion. (a) Ecological risk caused by water erosion in 2015. (b) Ecological risk changes caused by water erosion. (c) Ecological risk caused by wind erosion in 2015. (d) Ecological risk changes caused by wind erosion.


Table 1.
Thresholds for ecological risk warning of ecosystem services.
| Ecological Risk Grade | Thresholds for Water Erosion (t·km−2·yr−1) | Thresholds for Wind Erosion (t·km−2·yr−1) |
|---|---|---|
| No | [0, 500] | [0, 200] |
| Slight | (500, 1000] | (200, 400] |
| Medium | (1000, 1500] | (400, 600] |
| High | (1500, 2000] | (600, 800] |
| Extremely high | >2000 | >800 |
Table 2.
Factors associated with increases in soil retention and sandstorm prevention services.
| Independent Variable | Soil Retention Service Increase (t∙km−2) | Sandstorm Prevention Service Increase (t∙km−2) |
|---|---|---|
| Aboveground forest biomass per unit area in 2000 (t∙km−2) | 0.431 * (0.167) | - |
| Aboveground grassland biomass per unit area in 2000 (t∙km−2) | - | 0.735 *** (0.143) |
| Proportion of forest area in 2000 (%) | −0.928 ** (0.248) | - |
| Proportion of grassland area in 2000 (%) | −1.098 *** (0.202) | −1.08 *** (0.128) |
| Changes in proportion of forest area from 2000 to 2015 (%) | - | 0.457 ** (0.105) |
| Changes in proportion of shrub area from 2000 to 2015 (%) | −0.513 ***(0.073) | - |
| Change in density of agricultural output value (104 Yuan km−2) | - | −0.251 * (0.104) |
| R2 | 0.942 | 0.881 |
| N | 18 | 18 |
Notes: * p < 0.05; ** p < 0.01; *** p < 0.001. Standardized coefficients and robust standard errors are reported respectively outside and inside parentheses. Dependent variables are increases in per-unit-area soil retention and sandstorm prevention, respectively. Standardized coefficients and robust standard errors are reported outside and inside parentheses, respectively. Model results passed standard regression diagnostics. Variance inflation factors (VIFs) were tested to be <5.
© 2018 by the authors. Licensee MDPI, Basel, Switzerland. This article is an open access article distributed under the terms and conditions of the Creative Commons Attribution (CC BY) license (http://creativecommons.org/licenses/by/4.0/).
Share and Cite
MDPI and ACS Style
Dong, T.; Xu, W.; Zheng, H.; Xiao, Y.; Kong, L.; Ouyang, Z. A Framework for Regional Ecological Risk Warning Based on Ecosystem Service Approach: A Case Study in Ganzi, China. Sustainability 2018, 10, 2699. https://doi.org/10.3390/su10082699
AMA Style
Dong T, Xu W, Zheng H, Xiao Y, Kong L, Ouyang Z. A Framework for Regional Ecological Risk Warning Based on Ecosystem Service Approach: A Case Study in Ganzi, China. Sustainability. 2018; 10(8):2699. https://doi.org/10.3390/su10082699
Chicago/Turabian StyleDong, Tian, Weihua Xu, Hua Zheng, Yang Xiao, Lingqiao Kong, and Zhiyun Ouyang. 2018. "A Framework for Regional Ecological Risk Warning Based on Ecosystem Service Approach: A Case Study in Ganzi, China" Sustainability 10, no. 8: 2699. https://doi.org/10.3390/su10082699
Note that from the first issue of 2016, this journal uses article numbers instead of page numbers. See further details here.