An Analysis of the Energy Consumption Behavior of Scaled, Containerized Web Apps


Institute for Software Systems, Environmental Campus Birkenfeld, Trier University of Applied Sciences, 55765 Birkenfeld, Germany
*
Author to whom correspondence should be addressed.
Sustainability 2018, 10(8), 2710; https://doi.org/10.3390/su10082710
Submission received: 30 May 2018
/
Revised: 23 July 2018
/
Accepted: 31 July 2018
/
Published: 1 August 2018
(This article belongs to the Special Issue Information and Communications Technologies (ICT) for Sustainability)
Abstract
:Containerization is one of the most important topics for modern data centers and web developers. Since the number of containers on one- and multi-node systems is growing, knowledge about the energy consumption behavior of single web-service containers is essential in order to save energy and, of course, money. In this article, we are going to show how the energy consumption behavior of single containerized web services/web apps changes while creating replicas of the service in order to scale and balance the web service.
1. Introduction
In the field of green IT, virtualization is considered an essential measure for saving energy [1]. Therefore, it makes sense to study the energy efficiency of widely used virtualization tools and alternative techniques. This year, Docker, one of the most popular options for virtualization in data centers [2], will celebrate its fifth birthday. Since it was presented at PyCon in 2013, Docker became very popular in the developer community, with more than 29 billion downloads and 900 thousand images in Docker Hub [3]. It “provides the ability to package and run an application in a loosely isolated environment, called a container. The isolation and security allows running many containers simultaneously on a given host.” [4]. The containerization of web apps through Docker is one of the first widely accepted approaches that is used in enterprises, in order to improve continuous delivery and integration as well as the reliability and scalability of services and, especially in this case, microservices [5]. Of course, there are different container software approaches that try to compete with Docker by using different structures and additional functionalities. Therefore, it is reasonable for corporations that want to use containers to check all the features of Docker and their competitive products. In the first part of this article, we compare the Docker container Model with Rocket, an open-source container engine developed by CoreOS (acquired by RedHat in January 2018), as well as their features and energy consumption by using web-server containers. As containers are used because they are more lightweight than virtual machines (VM), a closer inspection of the energy consumption behavior of the two different approaches makes sense; especially when we consider that most of the time, container software is used on clusters, where the containers are spread over several nodes via cluster management software. In order to create reliable and scaled environments, software, such as Kubernetes, duplicates containers onto other systems or the system it is currently running on, to prevent cancellation of services and avoid the overload of any single resource. Moreover, systems in clusters, built for containerization, are often occupied by more than one container. In multiple cases, many containers of the same type are running on the same node/system. For this reason, we also show the energy consumption behavior of equivalent containers on one system.
2. Experiment Backgrounds, Prospects, and Related Work
Since green IT is an established field in research and practice, the last few years have shown that the energy consumption of software is gaining importance in the scientific world [6]. Software can be seen as a driver for the energy consumption of information and communication technology in general [7], and thus is a lever to reduce this consumption. Existing research approaches are summed up by the term “green and sustainable software” and comprise, for example, definitions, characteristics, and measurements for the energy efficiency of software [8,9]. However, due to the constantly increasing digitalization, the share of the general power consumption generated by software is also growing [10,11]. On the one hand, this increase in power consumption also applies to the increasing number of server systems [12] and clusters used for processing large amounts of data, virtualization, and the provision of all kinds of web services. On the other hand, containerization provides the possibility to ship services without creating a new VM for each service. In enterprise systems, containers are usually running on VMs in order to obtain security for the cloud services of different clients. Therefore, several connected services can run on one VM, decreasing the total number of needed VMs.
Additionally, since the number of containers on clusters is growing due to more and more powerful servers, it is necessary for computing and data centers to know about the energy consumption of the smallest unit in the system, to simulate the overall energy consumption, and therefore, estimate the energy costs per year. When working on productive clusters, where web services are scaled via cluster management tools such as Kubernetes, scaling depends on the CPU utilization of every node in the cluster. Deployments are only made on nodes with adequate available resources. Hence, a “replica”, which means a complete copy of a container with all its functionalities, can be deployed on the same node as its source. As two instances of the same service on two different nodes (same node specification with the same load on the service) should have the same CPU utilization, two questions arise especially: (1) “Does a containerized web service under load consume the same energy as a scaled service (two or more containers of the same type) with evenly distributed load?” (scaled on one or several nodes) and (2) “Does a containerized web service consume the same energy on a system on which the same service is already running?”. The aims of the experiments, as well as the prospects of this article, result from the mentioned questions.
Although containerization, Docker [13], and, of course, energy awareness are current topics [14], research considering their combination lags behind. In some papers, such as [15,16], the topics are only briefly raised. Most of the papers use other approaches to deal with the subject matter. For example, in [16], entire systems are compared natively and inside Docker containers, whereas we are more concerned with single containers connected to a network, without referring to overall systems, but taking scalability into account. Other papers are concerned with solving well-known problems; for example, the creation of a container broker system for monitoring containers and their consumption [17] or the consolidation of VMs if containers can be moved to other systems [18].
3. Measurement Setup and Results
In the following subsections, we show the results of a preliminary experiment in order to verify the decision of using Docker, describe the measuring environment, and present our measurement results.
3.1. Preliminary Experiment
Before investigating the energy consumption behavior of single containers, it is necessary to compare Docker to different container software solutions. Since LXC (Linux Containers) formed the basis of Docker in the beginning of its development, it seems to be an inappropriate choice for a comparison. However, LXC is mostly used for containerization on an operating-system level. The formerly mentioned software Rocket (also known as rkt) was first based on LXC as well. In contrast to Docker, Rocket does not use a daemon, on which the container processes are running. Therefore, each container appears as a real system process. The exact differences are shown in Table 1.
There is, of course, more software that can be used for containerization; for example, Packer by HashiCorp (https://www.packer.io/intro/index.html) or Flockport (https://www.flockport.com/). However, since our focus was on Docker as the best-known container engine, we wanted to juxtapose it with a comparable, alternative system. On the one hand, unlike Rocket (see below), Flockport is not compatible with Docker images. This makes it difficult to compare containers, because they are built in other ways. Packer, on the other hand, is geared towards the automated creation of various images (VM and container). Thus, it is basically designed for other functionalities, whereas Rocket tries to make a different approach for the same functionalities as Docker. For this reason, we decided to compare Docker and Rocket. However, since Rocket is such a lightweight alternative for Docker in terms of the number of system processes started while using one container (see Table 1), it gives a satisfying overview of the energy consumption behavior of container software, since containers are only separated from the system by a Rocket bash command (tracking actual container processes is possible).
3.2. Measuring Environment
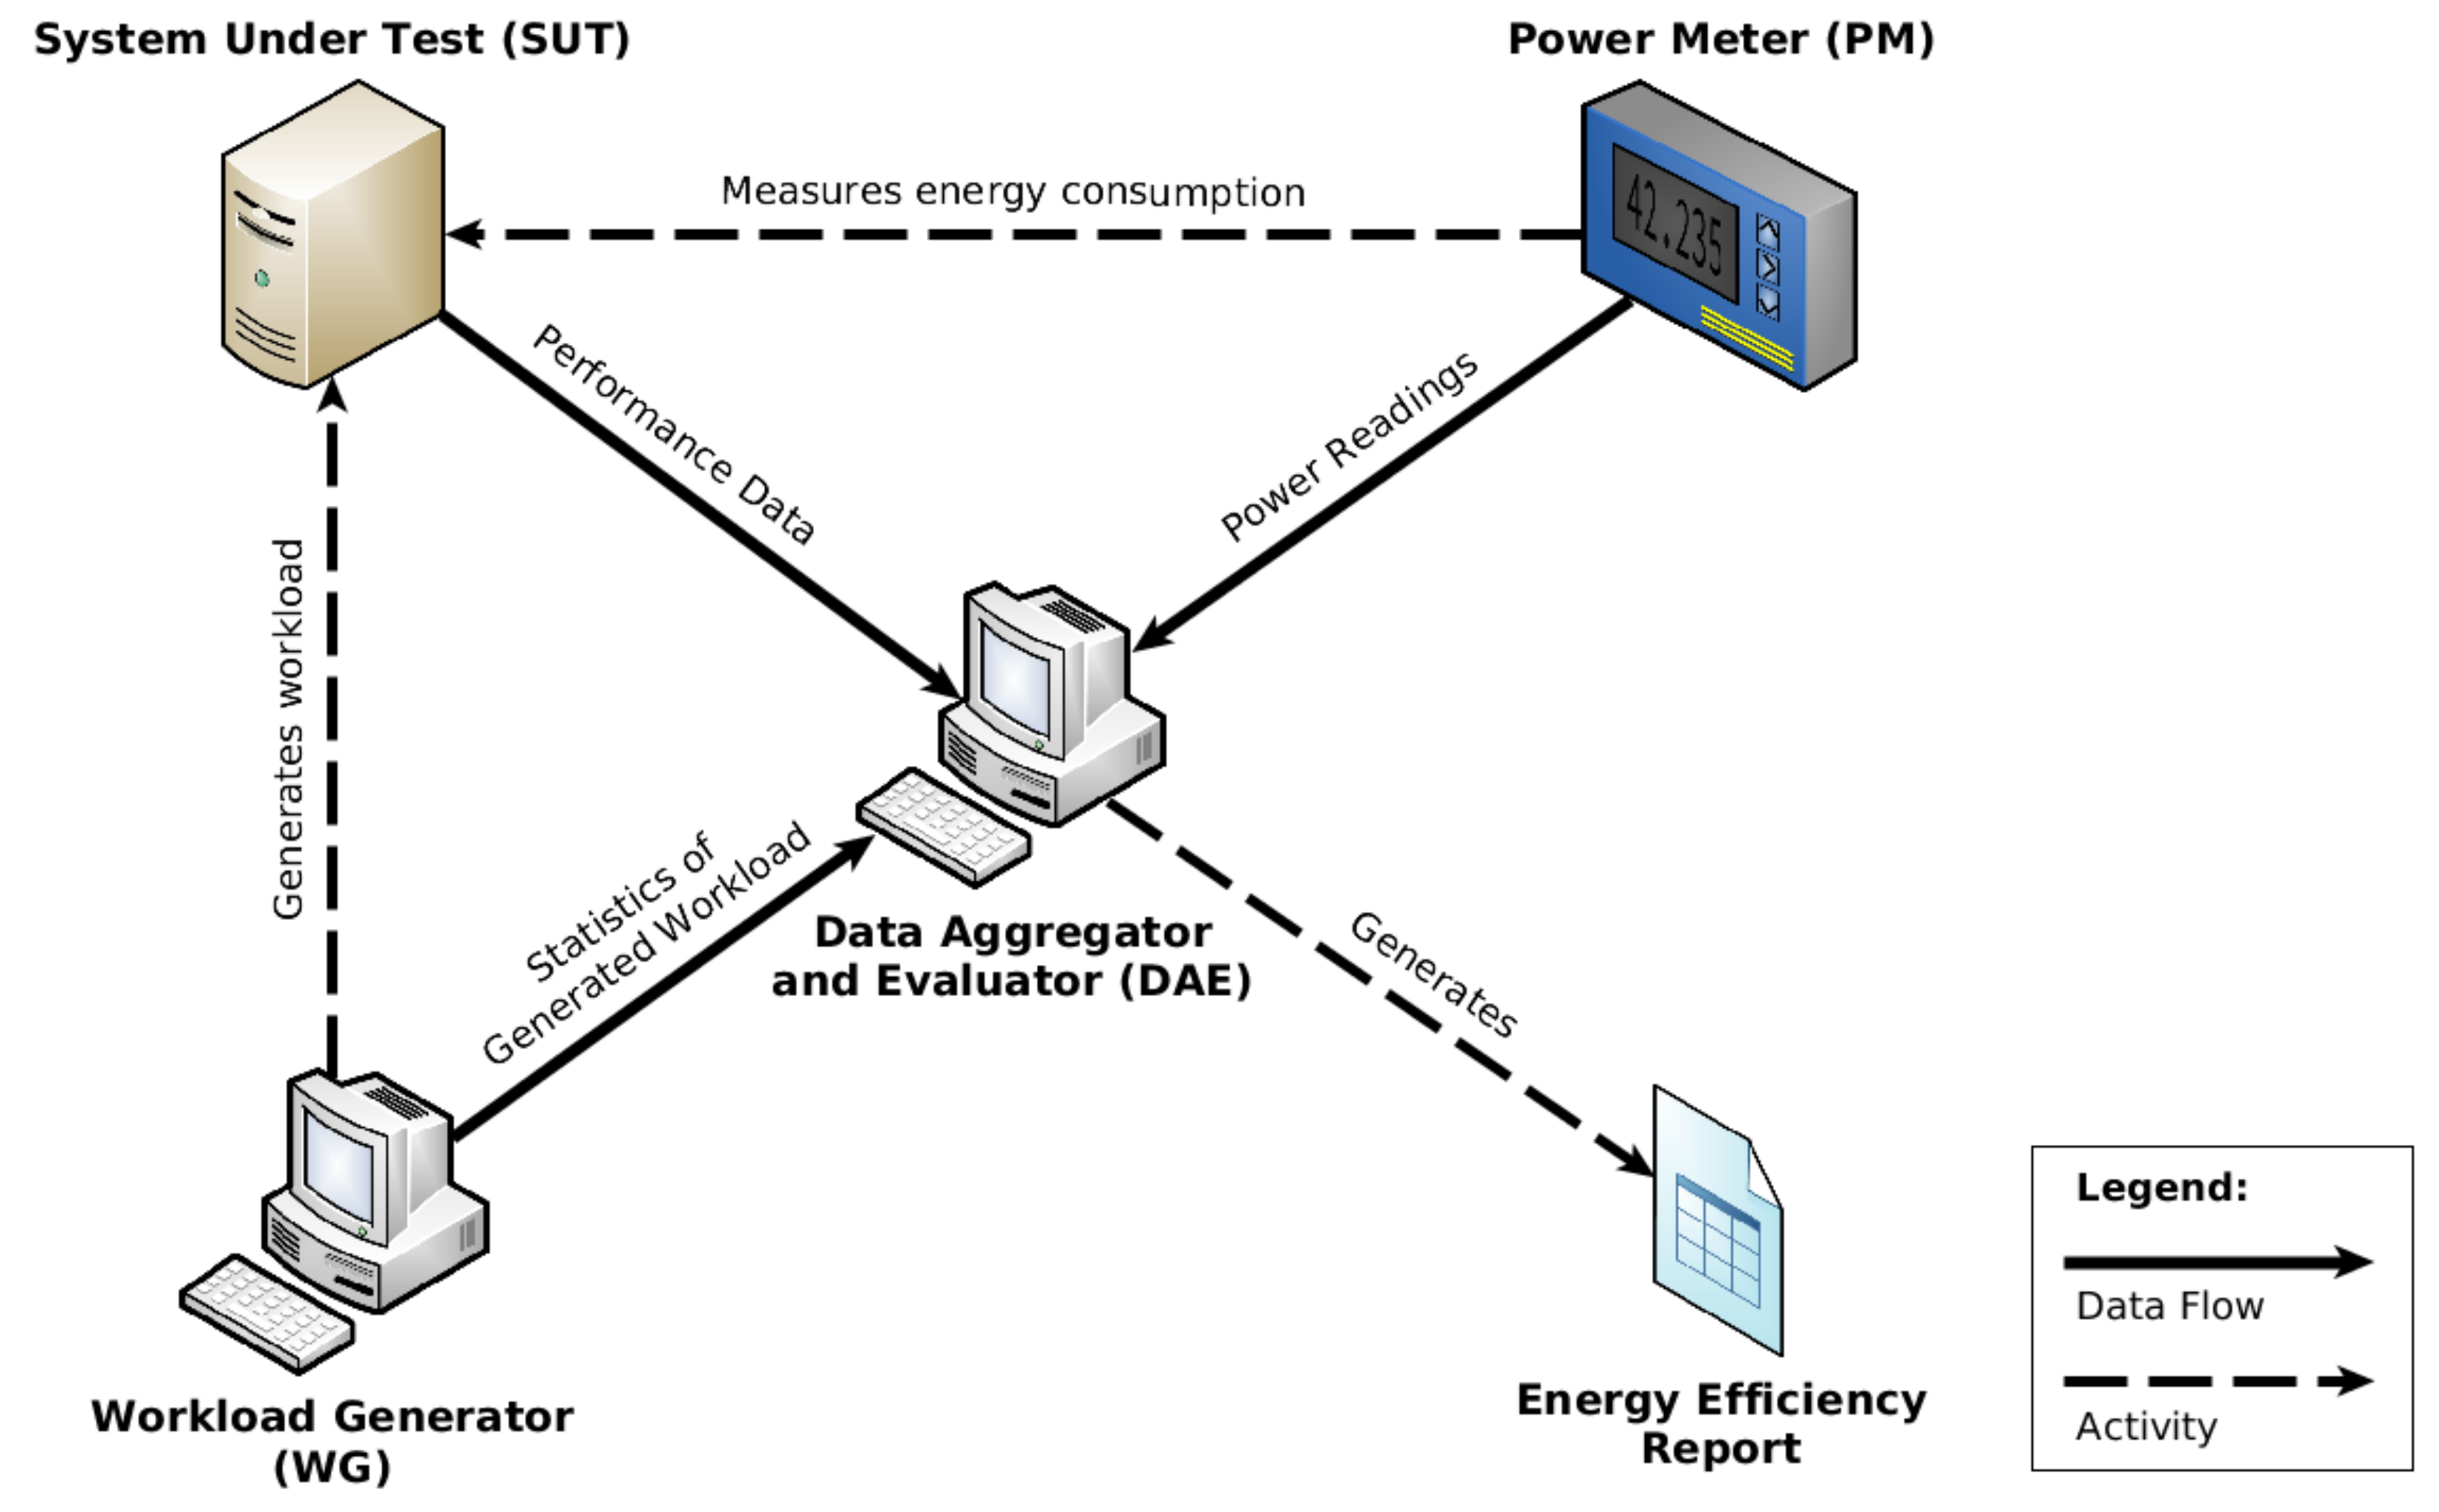
To measure the energy consumption of containers, we devised the experimental set-up in accordance with ISO/IEC 14756, as introduced by Dirlewanger [20]. In order to apply the measurement method described in [14], it is necessary to facilitate a usage scenario, so that the criteria can be reproducibly applied to different evaluations of software sustainability. At first, we had to generate different kinds of use cases for containers (ordinary websites, mailers, web interfaces, etc.), to determine the energy consumption of the software in variable situations. Because containers are mostly connected to each other by the internal network systems of the container software or communicate with the outside world via webservers, we could reduce every single use case to a minimally built container image. On the container, a webserver, which is also set up with a minimal configuration (see below), is running. This represents only one usage scenario as described in [14]. With this minimal container image, it was possible to create a sufficient quantity of small containers on our system, which was put under load with a webserver stress test tool. It should be mentioned that the amount of containers always depends on the hardware used. In our case, it is limited by the CPU and the network controller. Even though this amount of containers is smaller in comparison to an enterprise solution, it is sufficient to yield reliable measuring results, because we presuppose that higher amounts of containers could be extrapolated. Our measuring environment is visualized in Figure 1.
The load is produced with the Linux tool Siege [22], which allows us to generate load in a specific time interval or restrict the number of server hits (load is produced as fast as possible). As a result, we were able to monitor the transaction time and, therefore, the availability of the containers as well as the energy consumption behavior over a specific time interval. The exact measuring parameters are discussed in Section 3.3.
As a data aggregator and evaluator as well as a workload generator, we used a MacBook with four cores, each with 2.4 GHz and 4 GB of RAM. In order to collect the information about the energy consumption of the containers, we wrote a small Python script that pulled the information from our measuring devices via Simple Network Management Protocol (SNMP). The energy consumption of the system under test (SUT) was determined with a GUDE Expert 1202 [23] power distribution unit which can be used in 19-inch server racks. This allowed our experiment to be more strongly related to a real-life scenario. Consequently, we decided on using a SUT which comes close to server blades used in data centers. Since the energy consumption of real server blades is generally high, it would be nearly impossible to get the energy consumption of one specific container, because it would get lost in the white noise of the energy measurements of the server blade. However, in order to compare the results to servers running several containers, we needed the energy baseline of one container. So, we employed an UDOO X86 Advanced Plus, a small blade with an Intel Celeron N3160 2.24 GHz, 4 GB of RAM, and Gigabit Ethernet [24]. Docker and Rocket ran on the UDOO with Ubuntu 16.04. A second UDOO was used the compare the results of the experiment on one system to a two-system setup with several containers. One UDOO has 4 W as its power baseline.
The container images were built with the official Ubuntu image found on Docker Hub according to [25]. We used the Ubuntu base image to create a more accurate comparison to the basic system of the UDOO and to a native NGINX. Furthermore, we cannot say to which extent NGINX has been changed in the official image. In addition, the replication package shows that the official build consumed more power (NIGNX official up to 1.3 W; our image: up to 1.1 W), even though it was smaller (NGINX official: 102 MB; our image: 180 MB). Since, as mentioned before, Rocket can translate Docker images into its own format, it was easy to generate the same image for two different container engines. As a webserver, we installed NGINX and configured it minimally, so only 376 Bytes were downloaded with each server-hit of the testing tool. The minimal configuration of NGINX corresponds to its default configuration. Thus, a static default HTML file is served that generates the 376 Bytes of downloaded content. The size of the downloaded content influences the speed of the hits generated by Siege, because all content is downloaded before the next hit starts. Since we wanted to generate as many hits as possible in a test run, the content had to be small. Therefore, the default HTMLpage of NGINX is well suited for the test. It is also easy to replicate, as it is included with every NGINX installation. Furthermore, the configuration files are cleaned up by removing unnecessary code, according to [26]. DeJonghe [26] does not describe a minimal configuration, but shows which code is needed for special functionalities, such as high-performance load balancing, authentication, and deployment, and therefore this code was removed. NGINX workers are set to auto (which means that all available cores will be auto-detected), and the number of simultaneous connections is set to 768 by default. As mentioned above, we wanted to create a lot of load in one minute. With, for example, only one worker, the number of finished requests would be much lower and therefore the work done by the server in one test round would be less. The configuration file, as well as the default sites-available file, can be found in our replication package on GitLab for further information [27]. Preliminary tests showed that the minimal build of a container basis (in this case, container image basis and webserver) does not always deliver the best power measurement results. Normally, we could have written our own small server with Python or Go, but then we would have had to compare the languages’ energy consumption behavior first for the reason of completeness.
3.3. Results
3.3.1. Comparison between Docker and Rocket
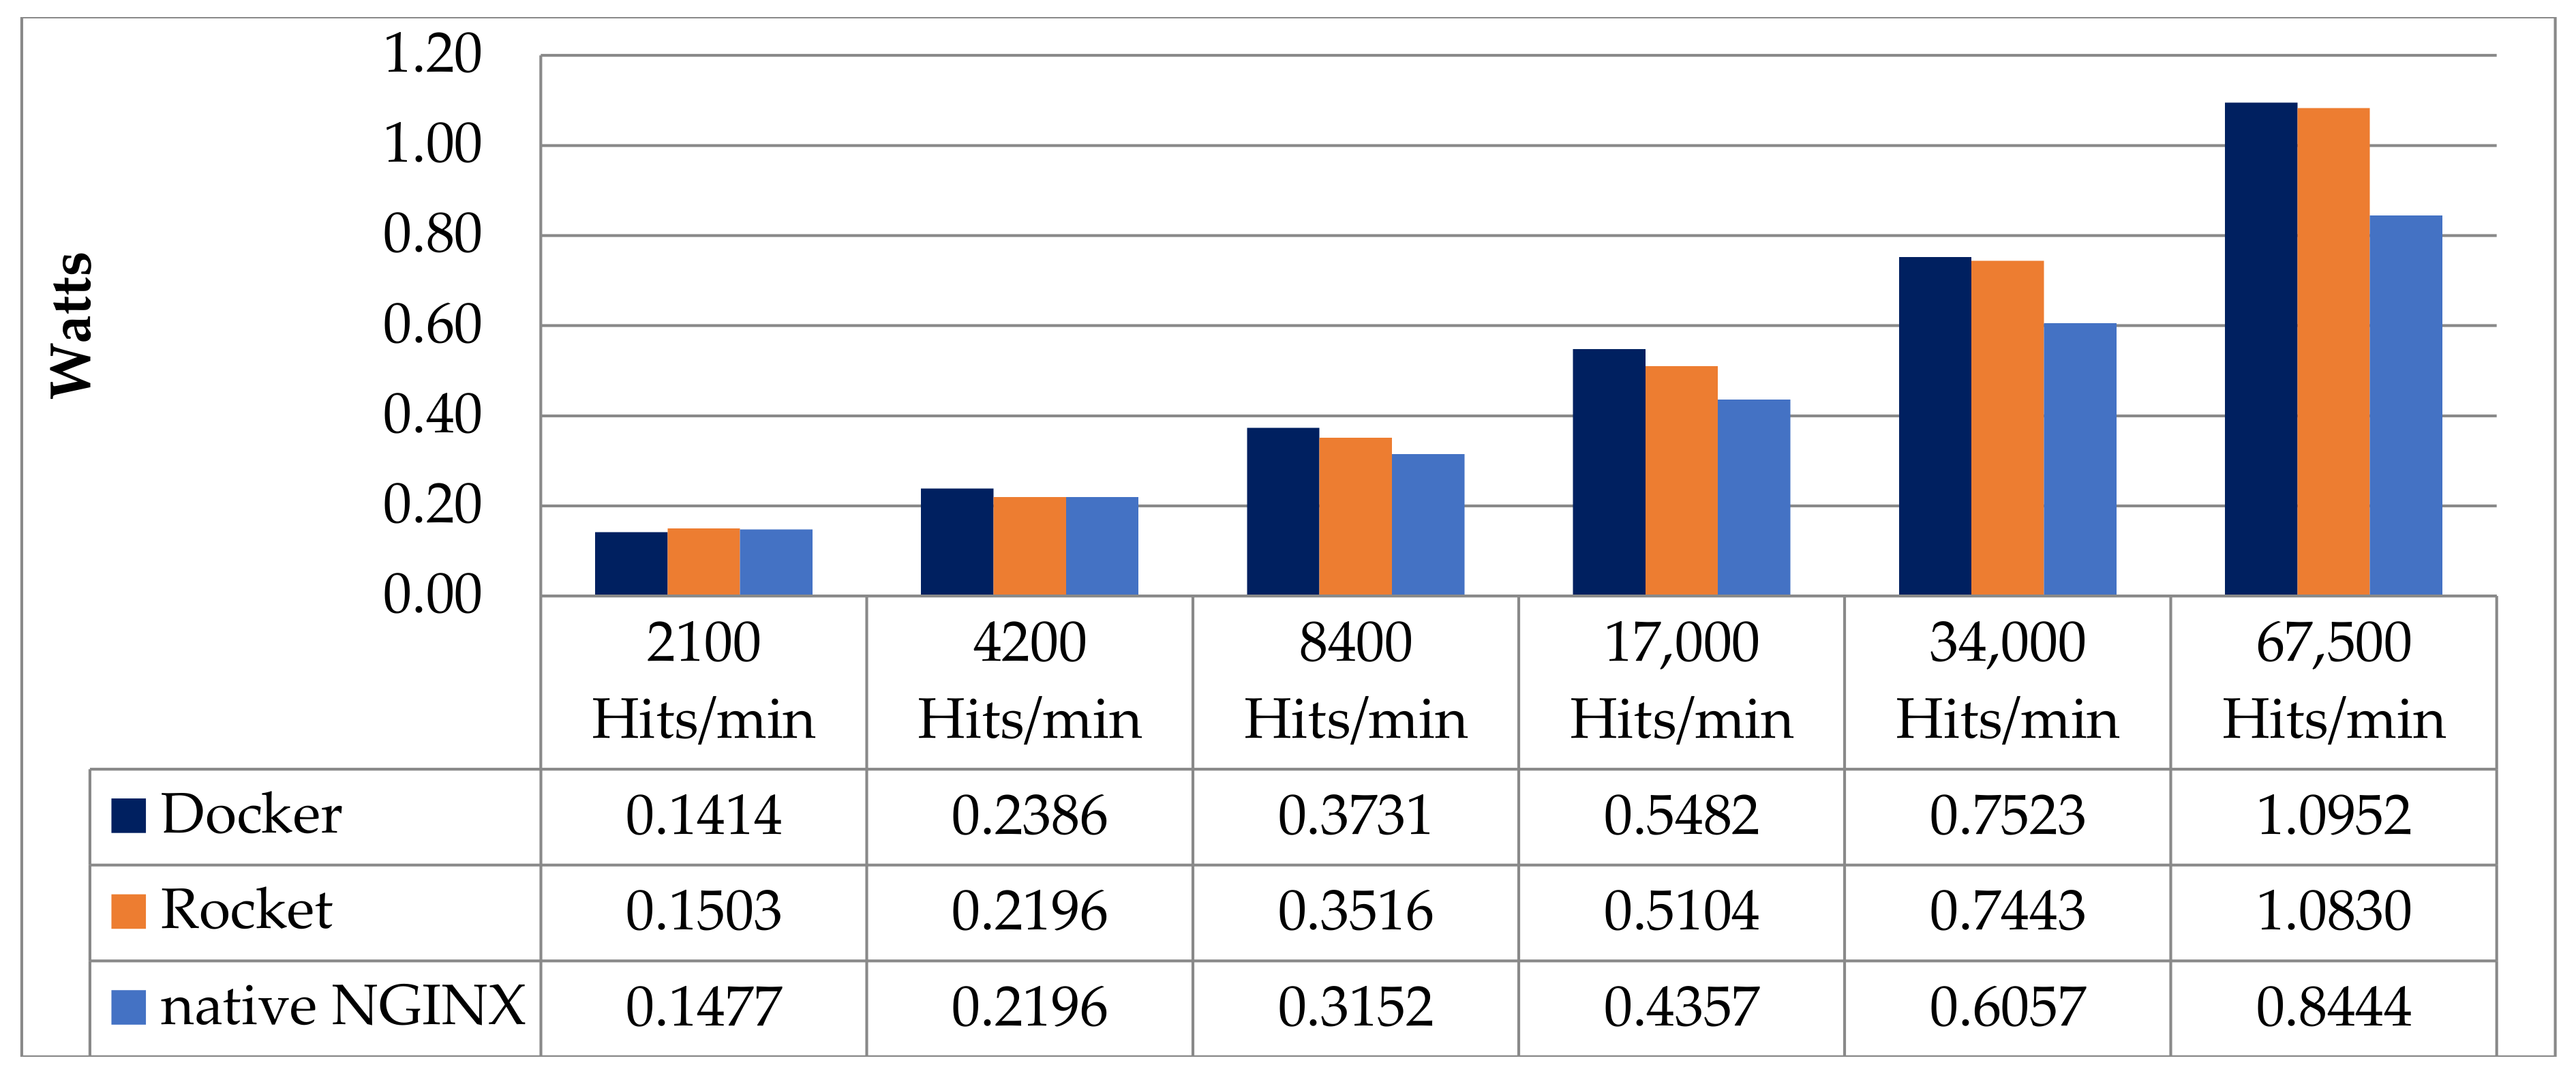
As already mentioned, Rocket does not use a daemon like Docker. As a result, we had to use systemd to start a container in the background. In addition, it can be expected that a container built out of the same image should consume less energy than in Docker. For this test, a single container (in Docker and Rocket) was started and set under load for 1 min with a growing number of simulated concurrent users. In order to validate whether the results of the measurement were replicable, the first test (load from one user on one container) was repeated 100 times before we started the main experiment. Herein, every test round was started manually 10 times, as can be seen in the replication package file measurement_test_series_1.xlsx. The following Figure 2 shows the results in comparison to a native NGINX tested with the same parameters and configuration (see configuration of the NGINX containers above). The baseline of 4 W is, as in every other subsequent Figure, already subtracted from the results.
As we can see, the power consumption of Docker and Rocket differs only minimally, but in continuously occurring watt intervals. The difference is only substantial when several NGINX containers are used in a cluster. In another case, it would of course be possible to save energy by using native NGINX. However, there is the problem of that only one web server can be active per system. The figure shows the mean values of test rounds. The divergences of the measurements were minimal.
Because the difference between Rocket and Docker is so small relating to single containers, the following experiments were only set up with Docker. Additionally, it was easier to create a workflow with Docker than with Rocket because of the existing Docker daemon. Starting and stopping containers inside the measuring environment was faster and less complicated because of Docker’s better documentation and, of course, the fact that Docker is more widely used than Rocket.
3.3.2. Comparison of One Container under Load to Several Containers
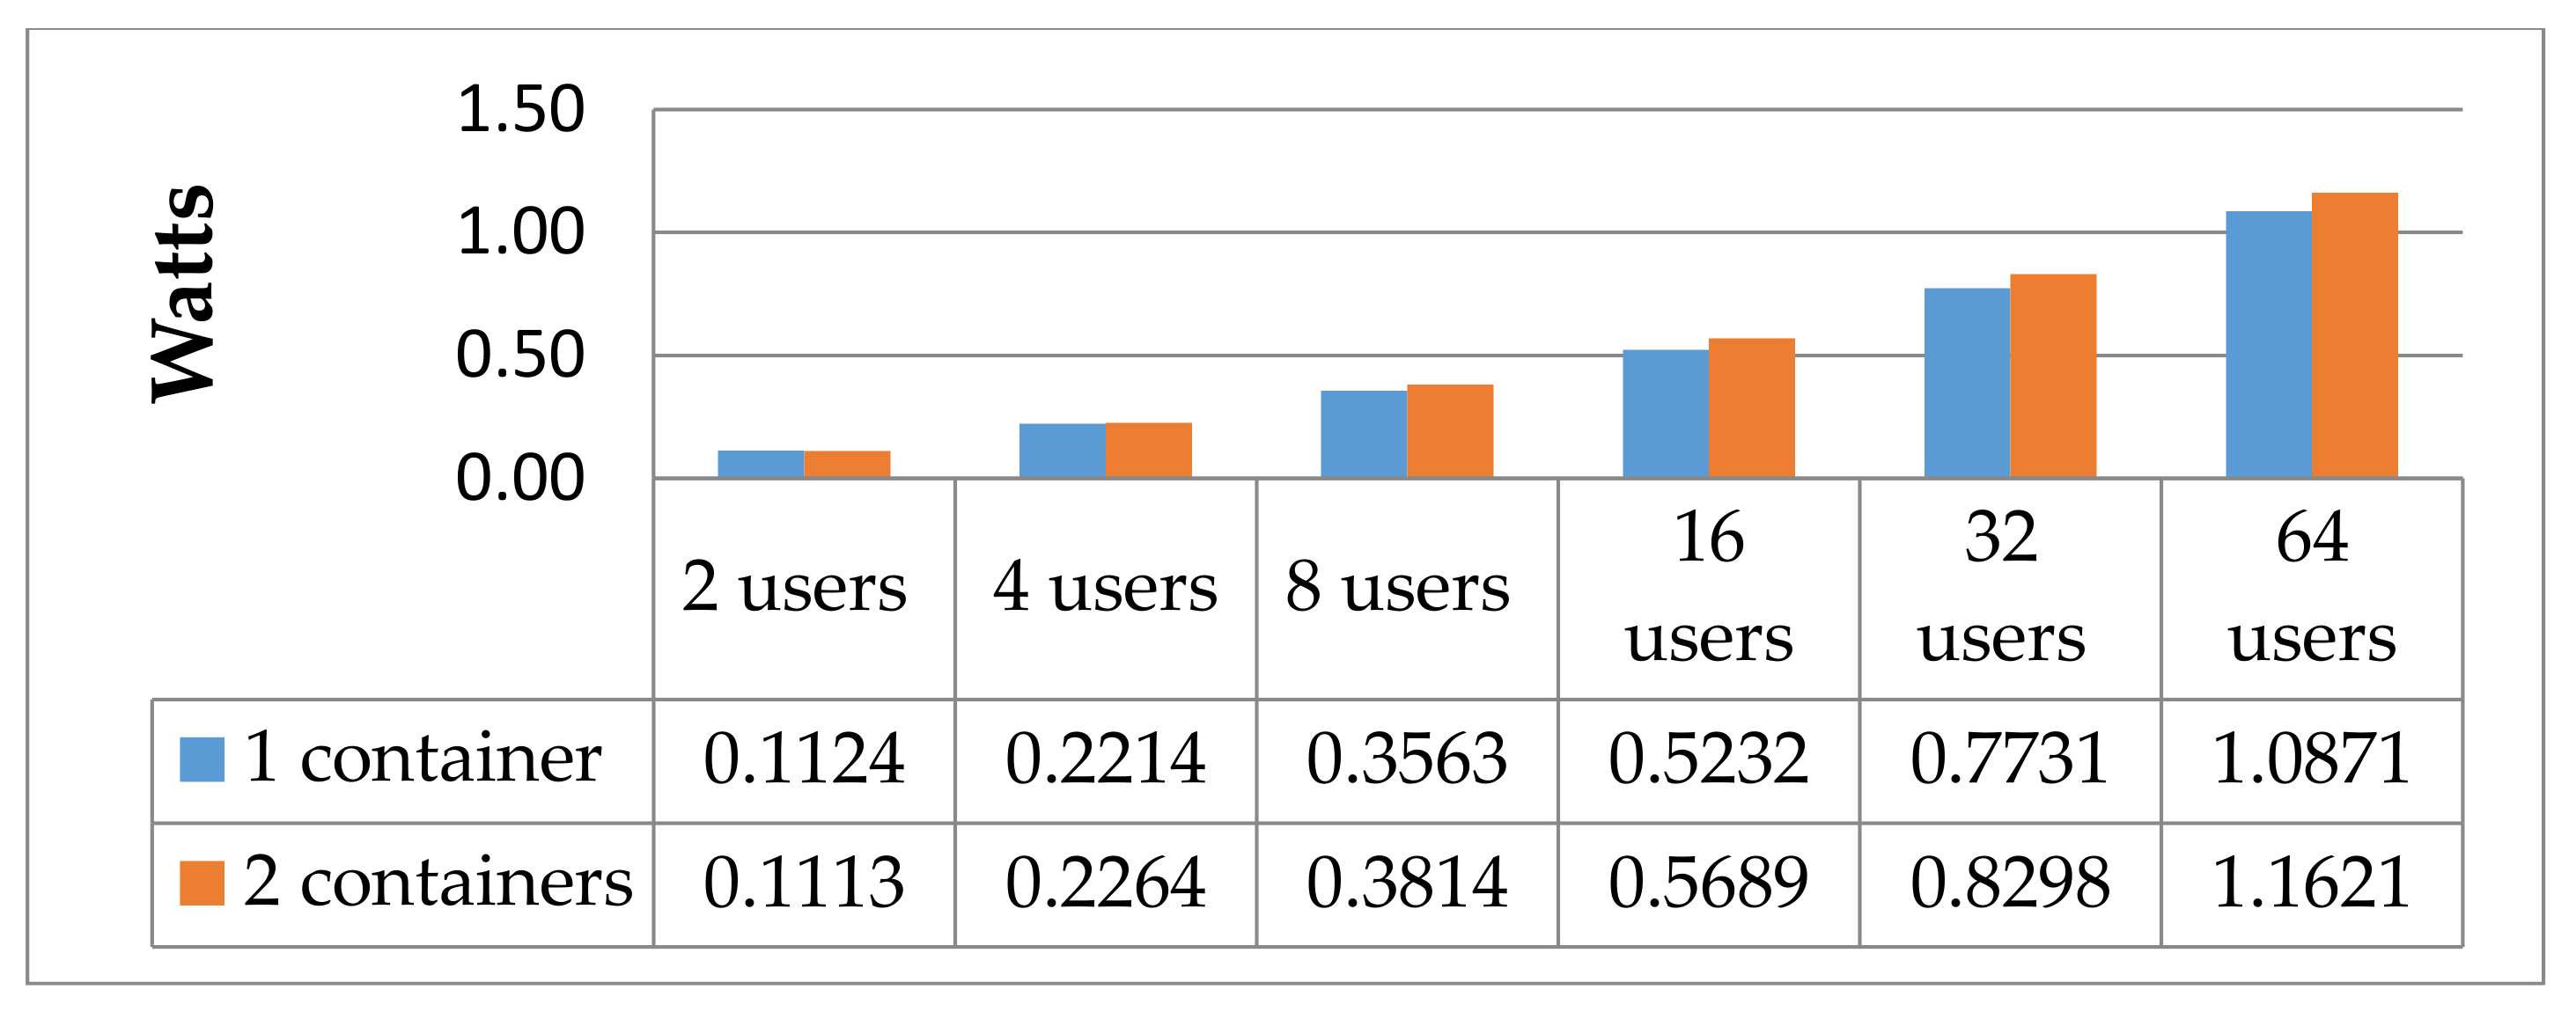
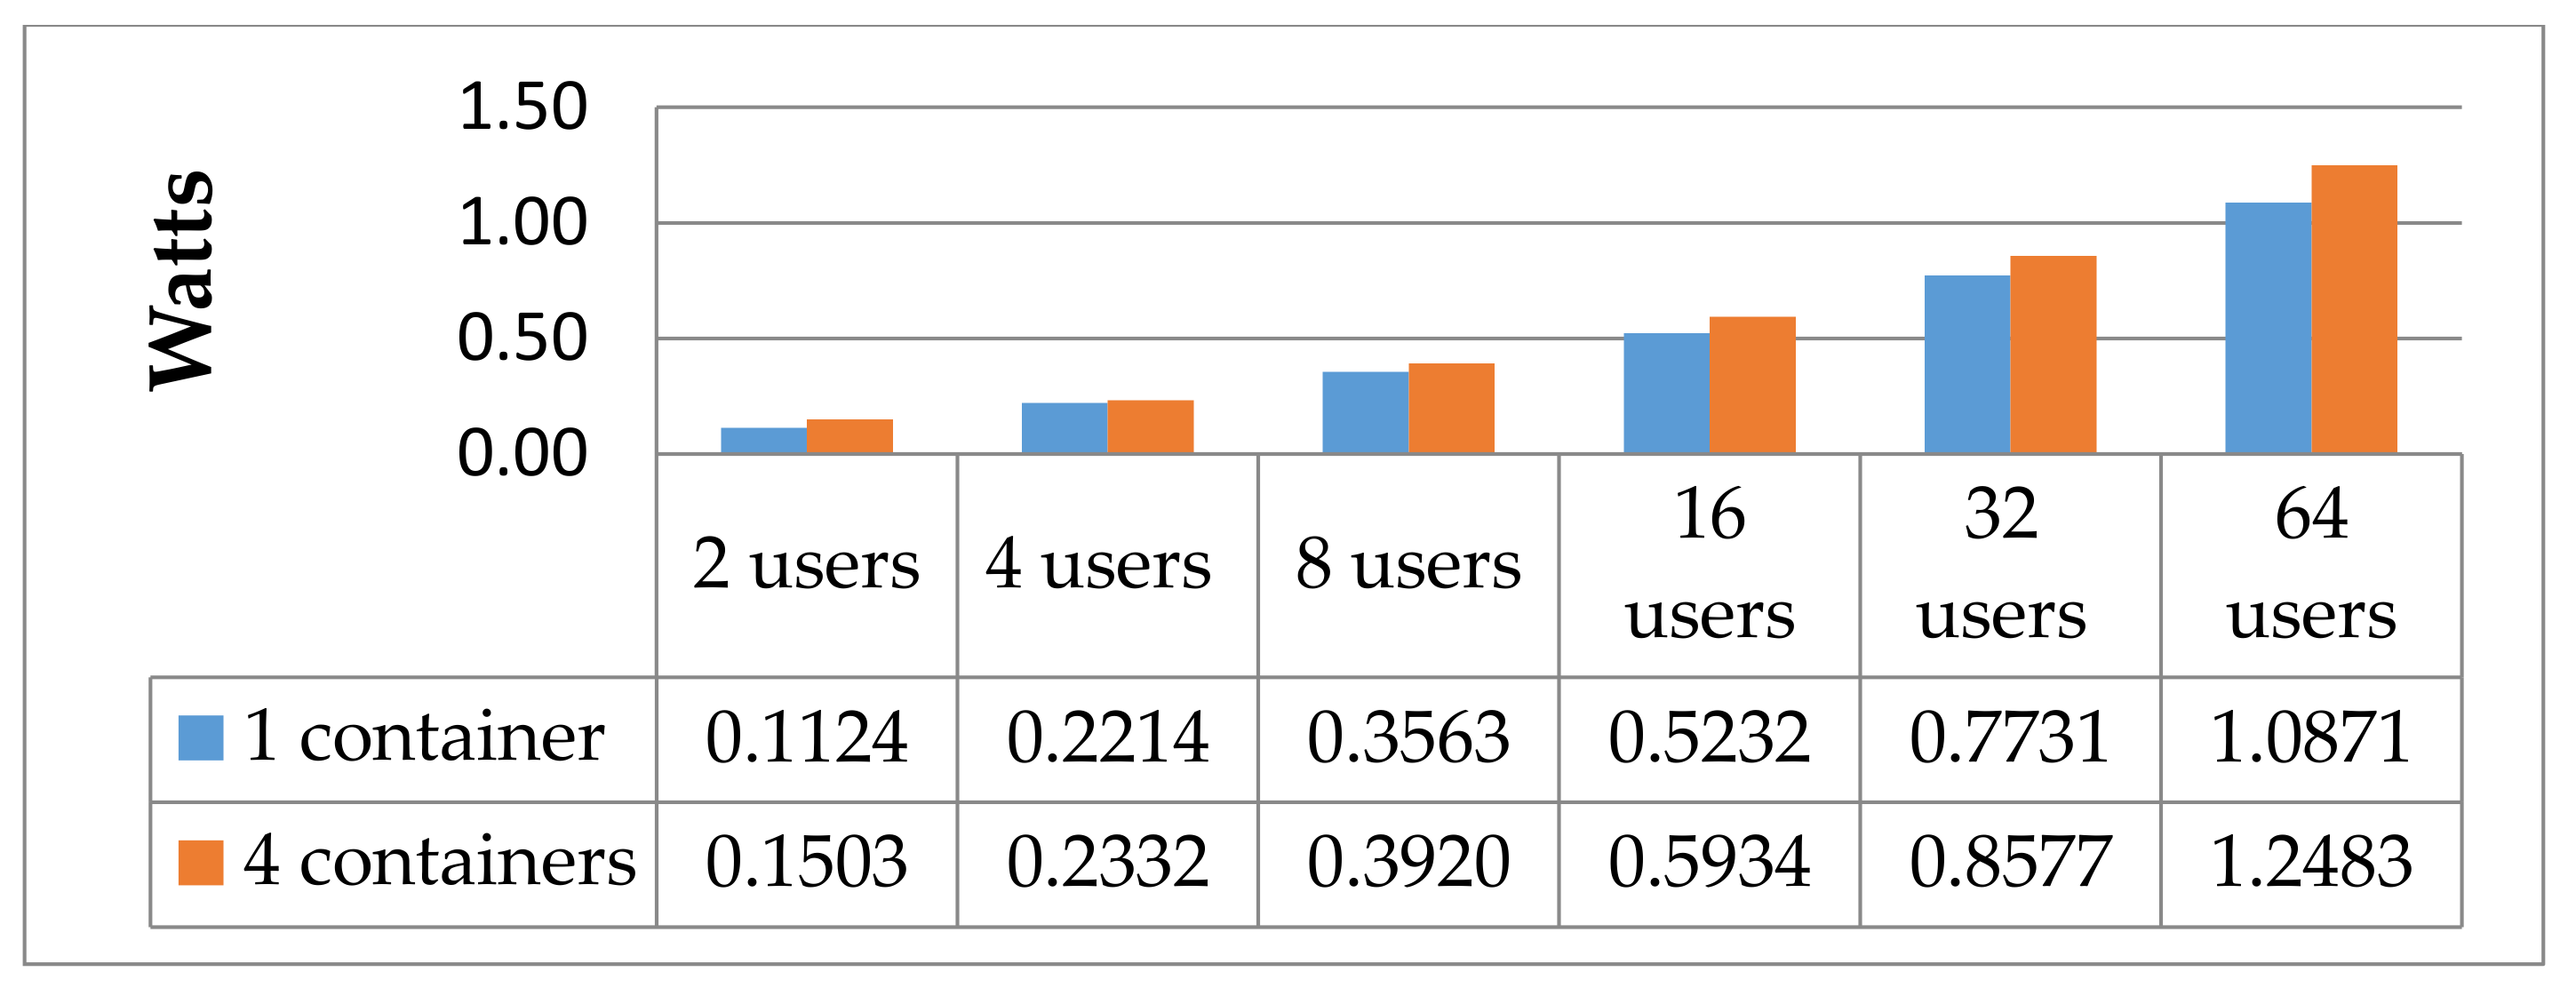
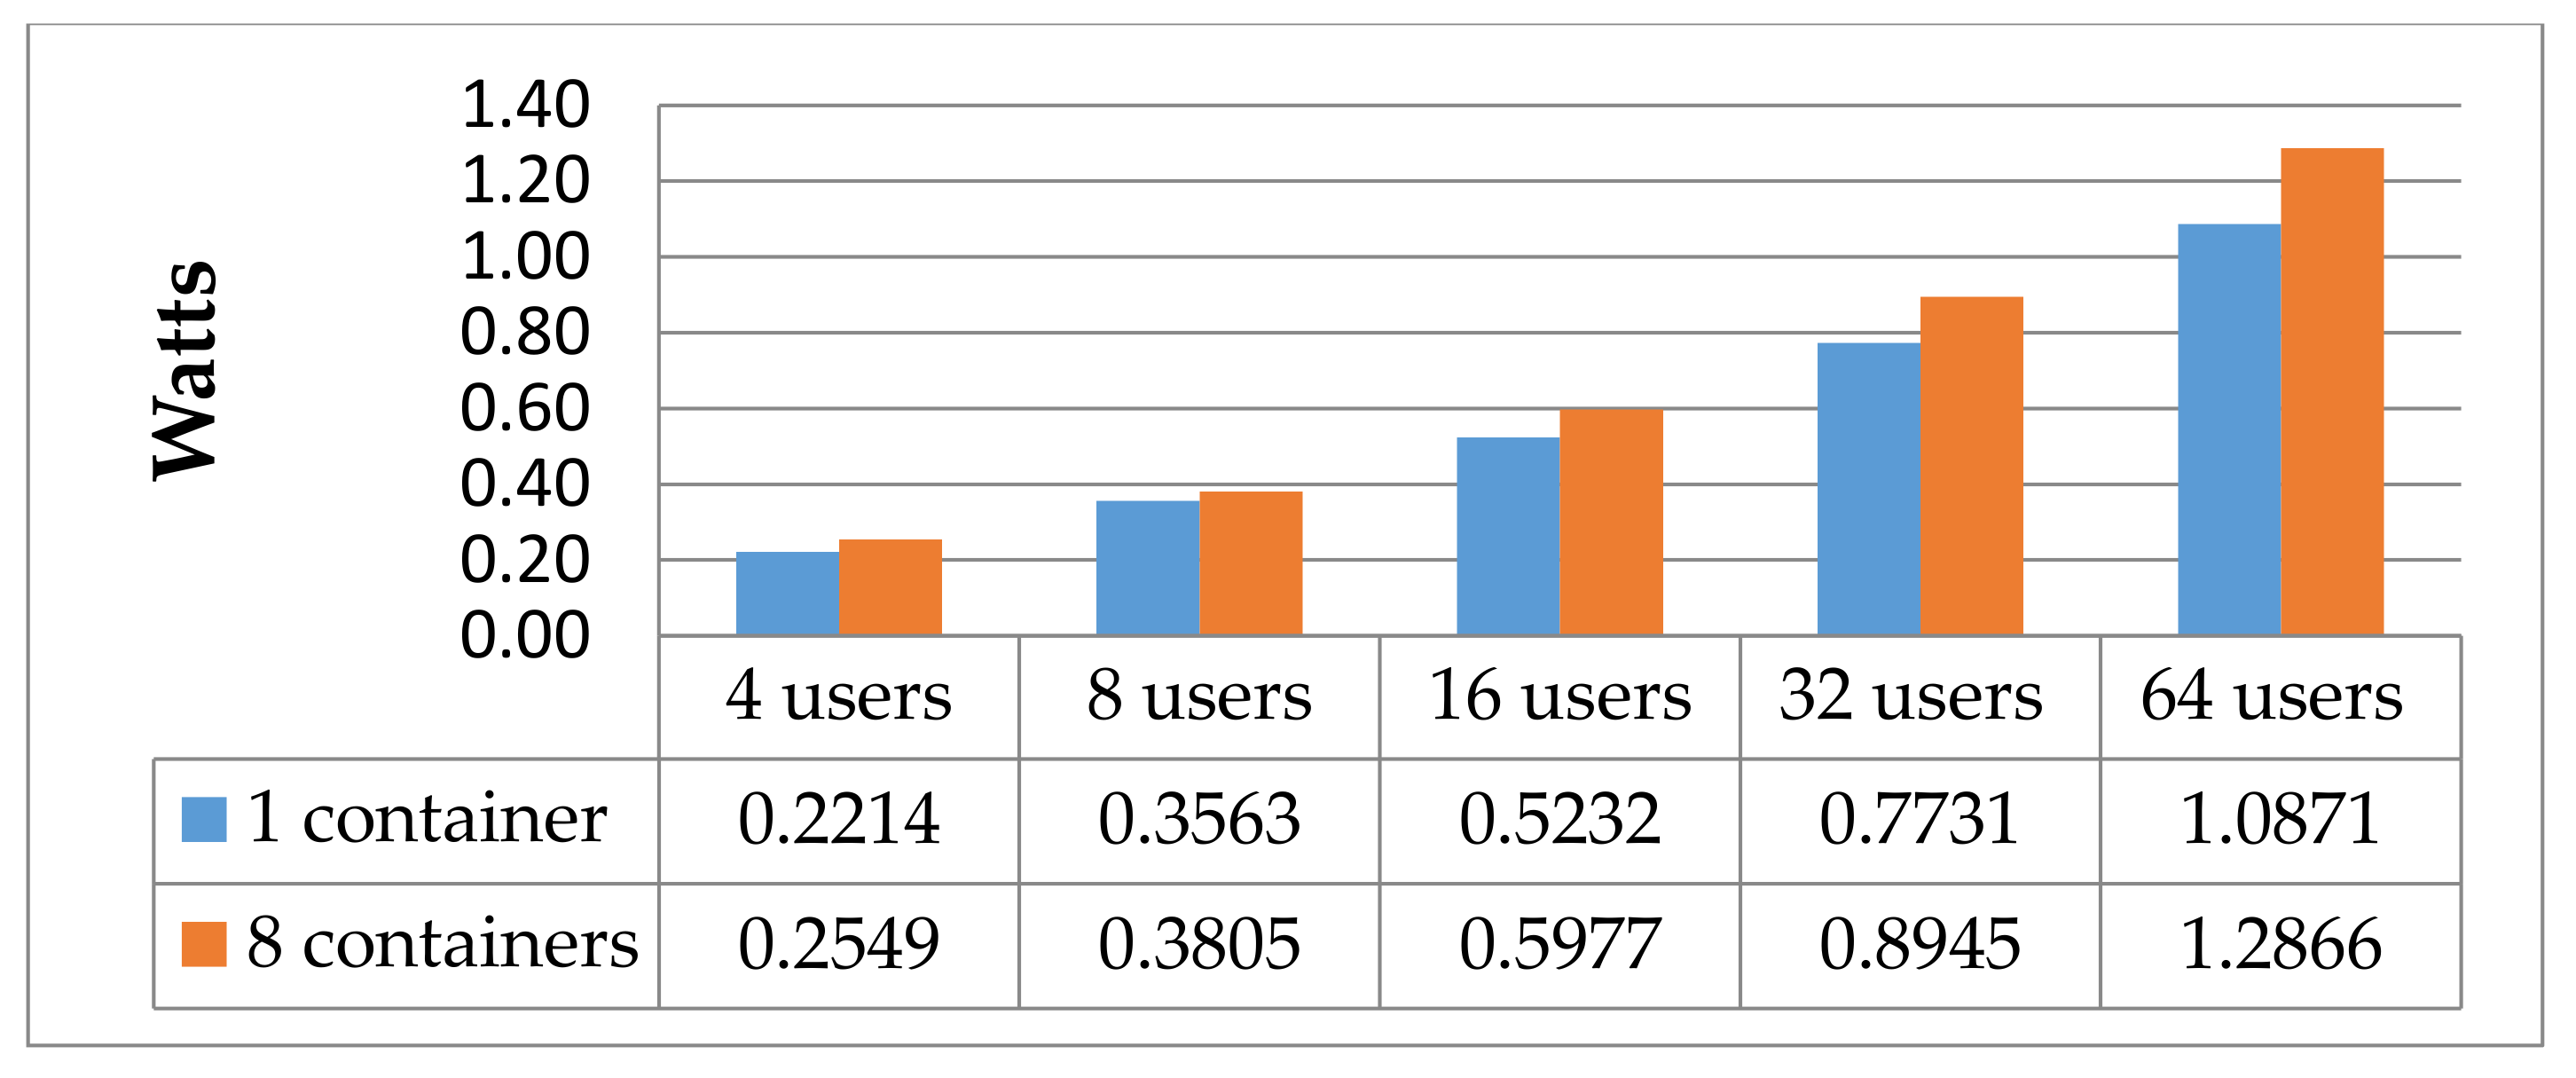
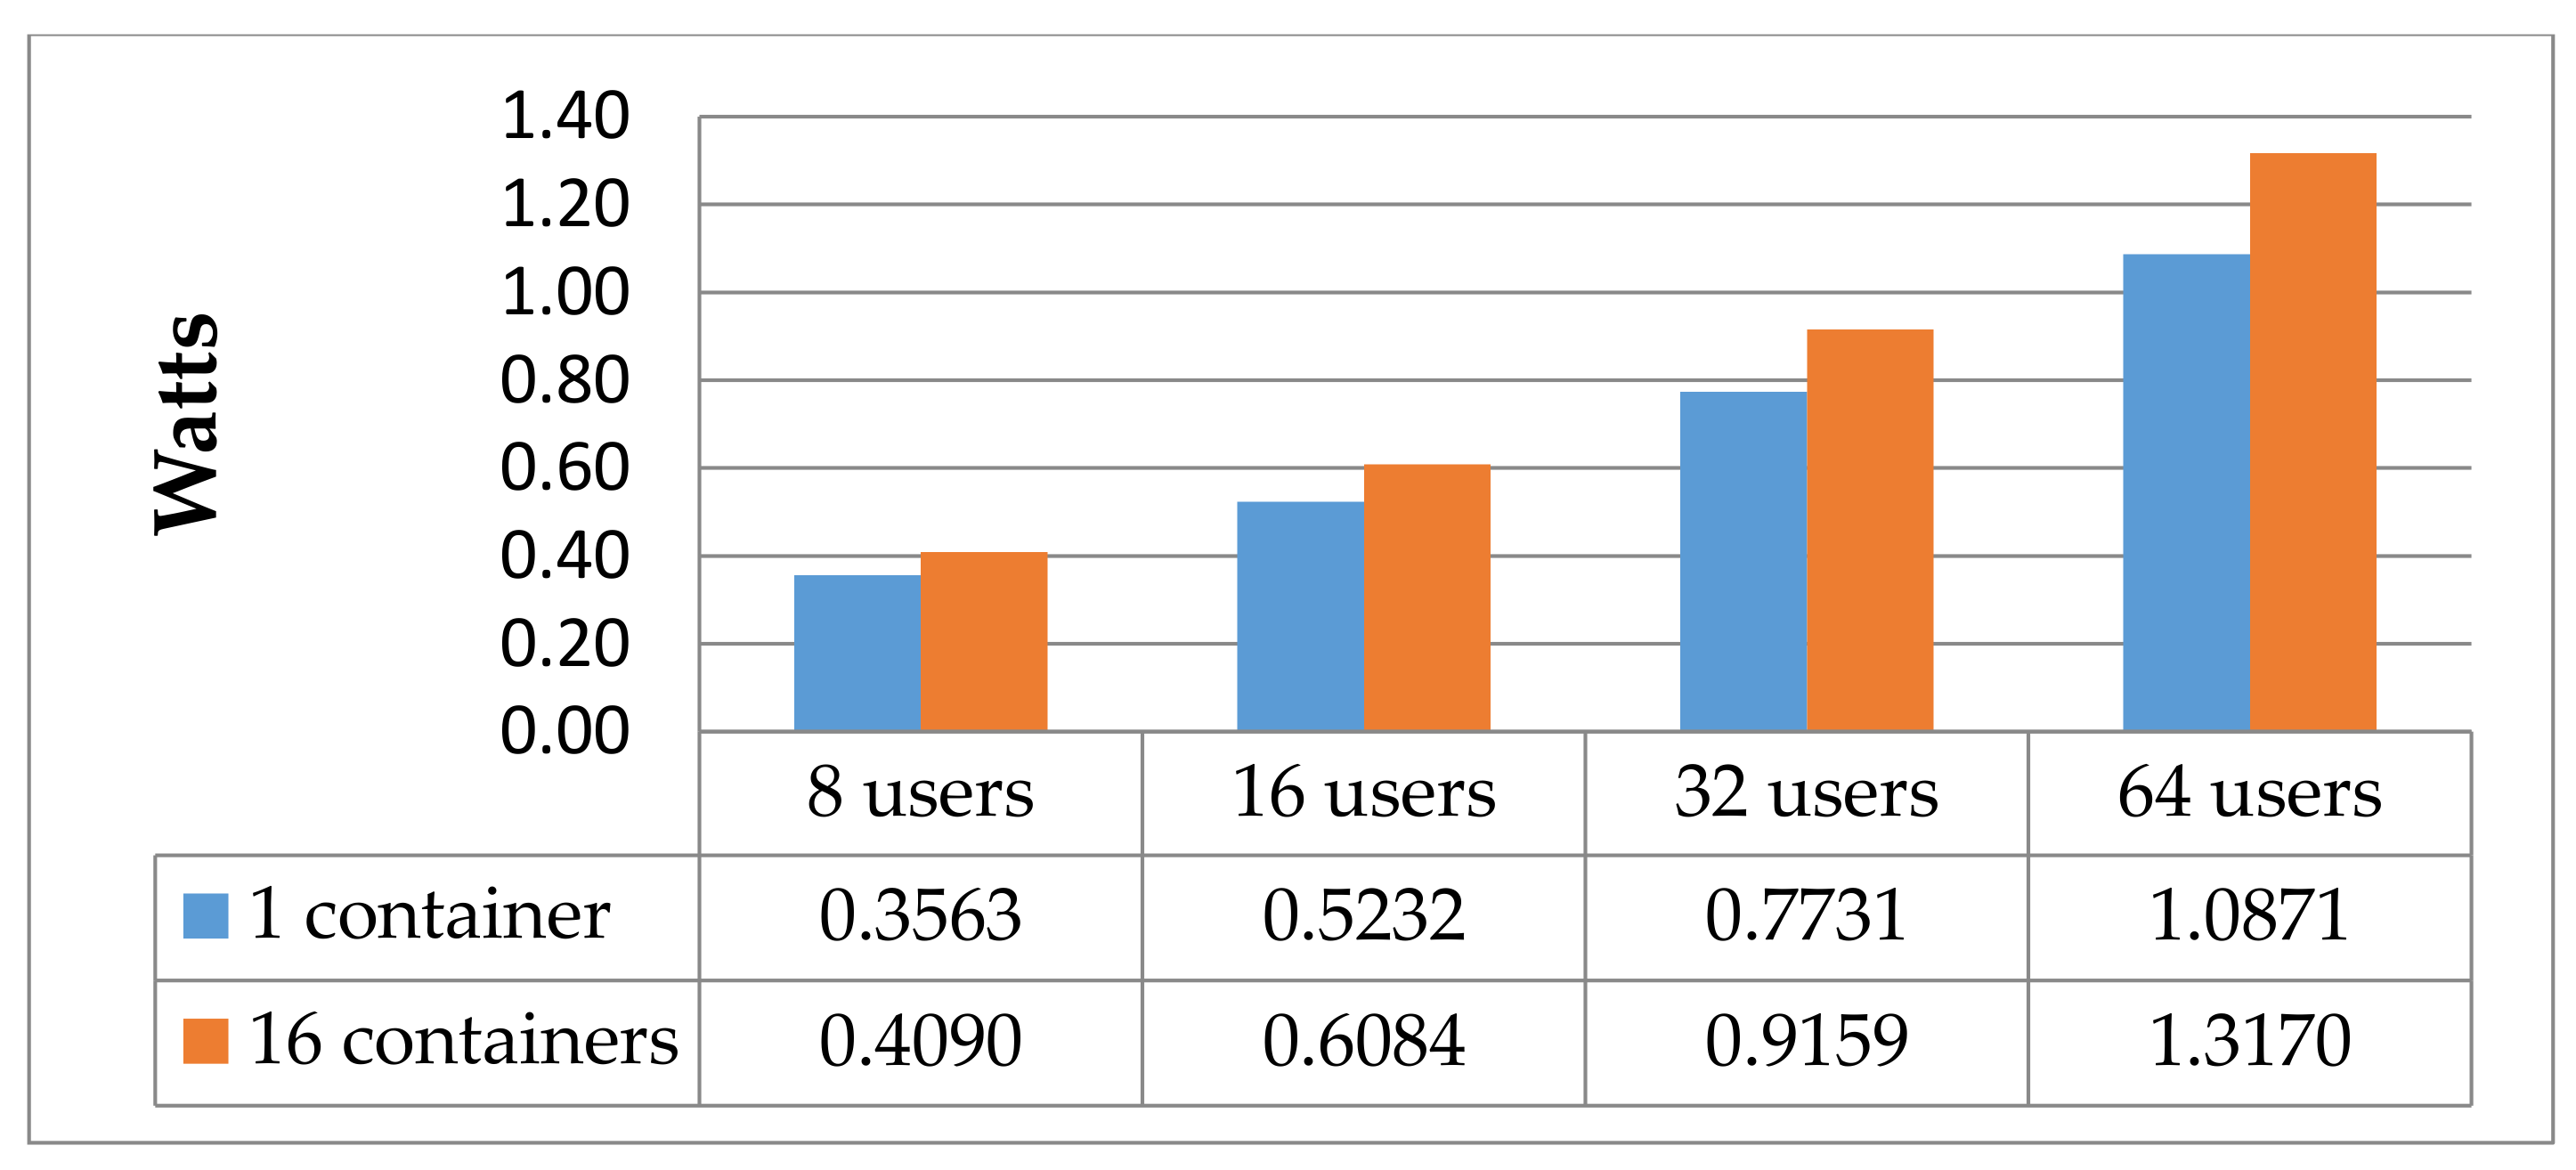
As mentioned at the beginning of the chapter, we wanted to answer the question, how several containers of the same type (web apps in general) behave on one system, considering power consumption. For this purpose, we started with one Docker container, configured as mentioned before (NGINX, minimal configuration), put it under load for one minute, and repeated the test 100 times. The results give us an average baseline of the power consumption of one container and, of course, its capability related to availability and “concurrency” (average number of simultaneous connections, a number which rises as server performance decreases). After this, we apportioned the amounts of hits (through the configuration of Siege) among two containers. To guarantee the same amount of hits on each container, the load was produced by 2, 4, 8, 16, 32, and 64 simultaneous users. Therefore, we could split the users accordingly. Afterwards, the same test was repeated for 4, 8, and 16 containers on one system. The results of the test are shown in Figure 3, Figure 4, Figure 5 and Figure 6. As we can see, the measurements for two users allocated to eight and two or four users allocated to 16 containers are missing. This is the case because even though it may be possible to split the hits of one user to two containers accurately (e.g., configuring Siege with an extended delay configuration), the readings could not be distinguished from the energetic white noise.
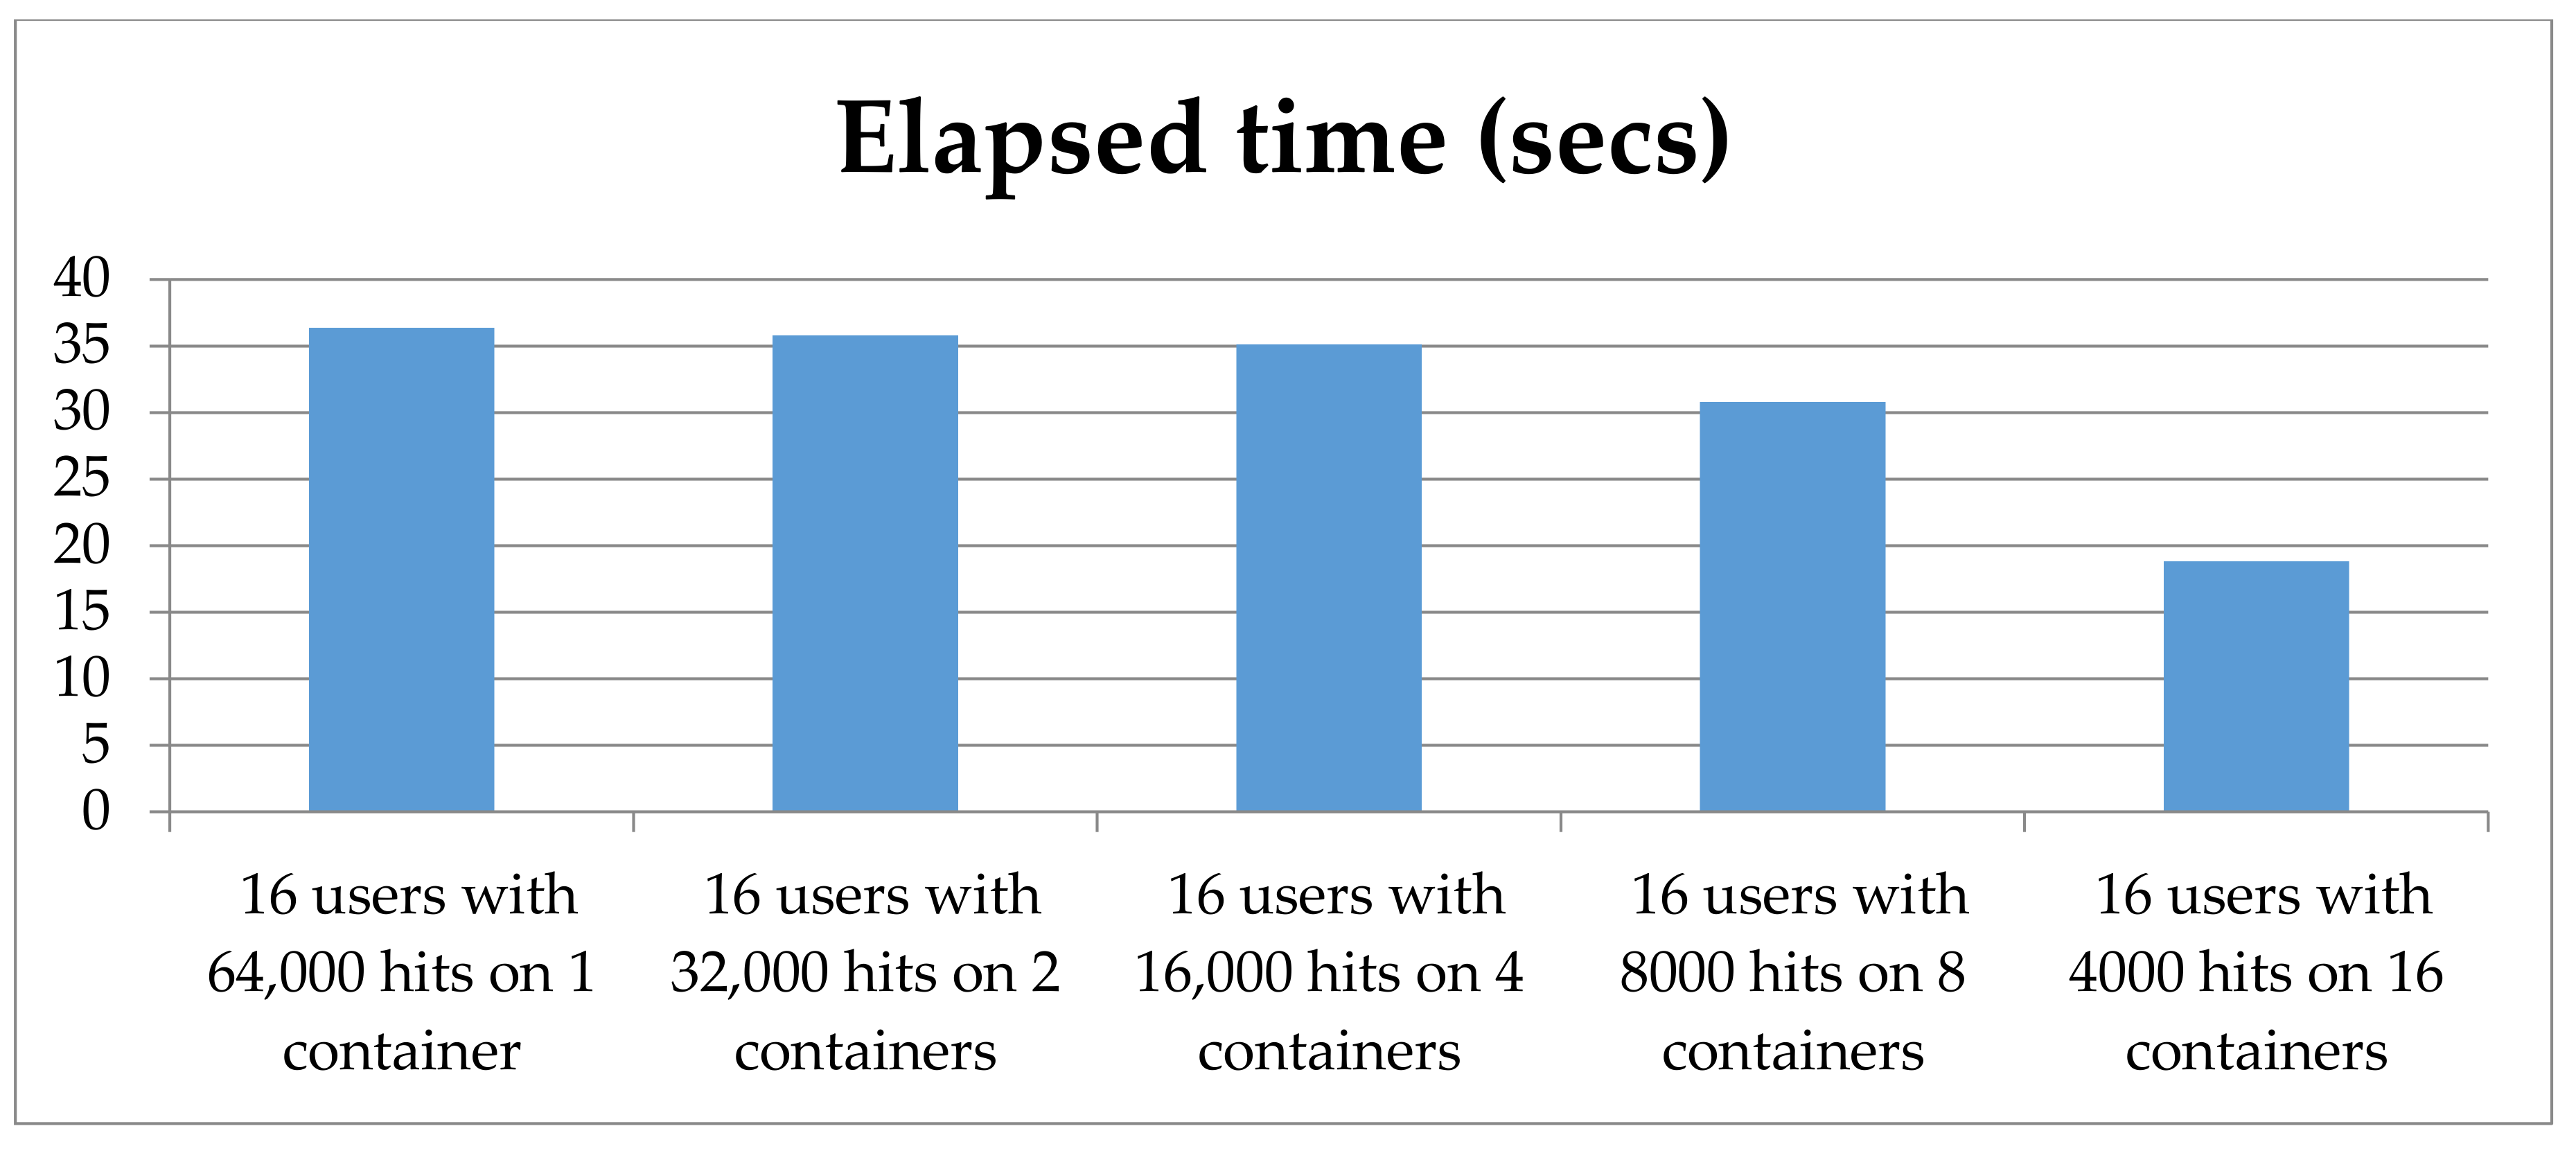
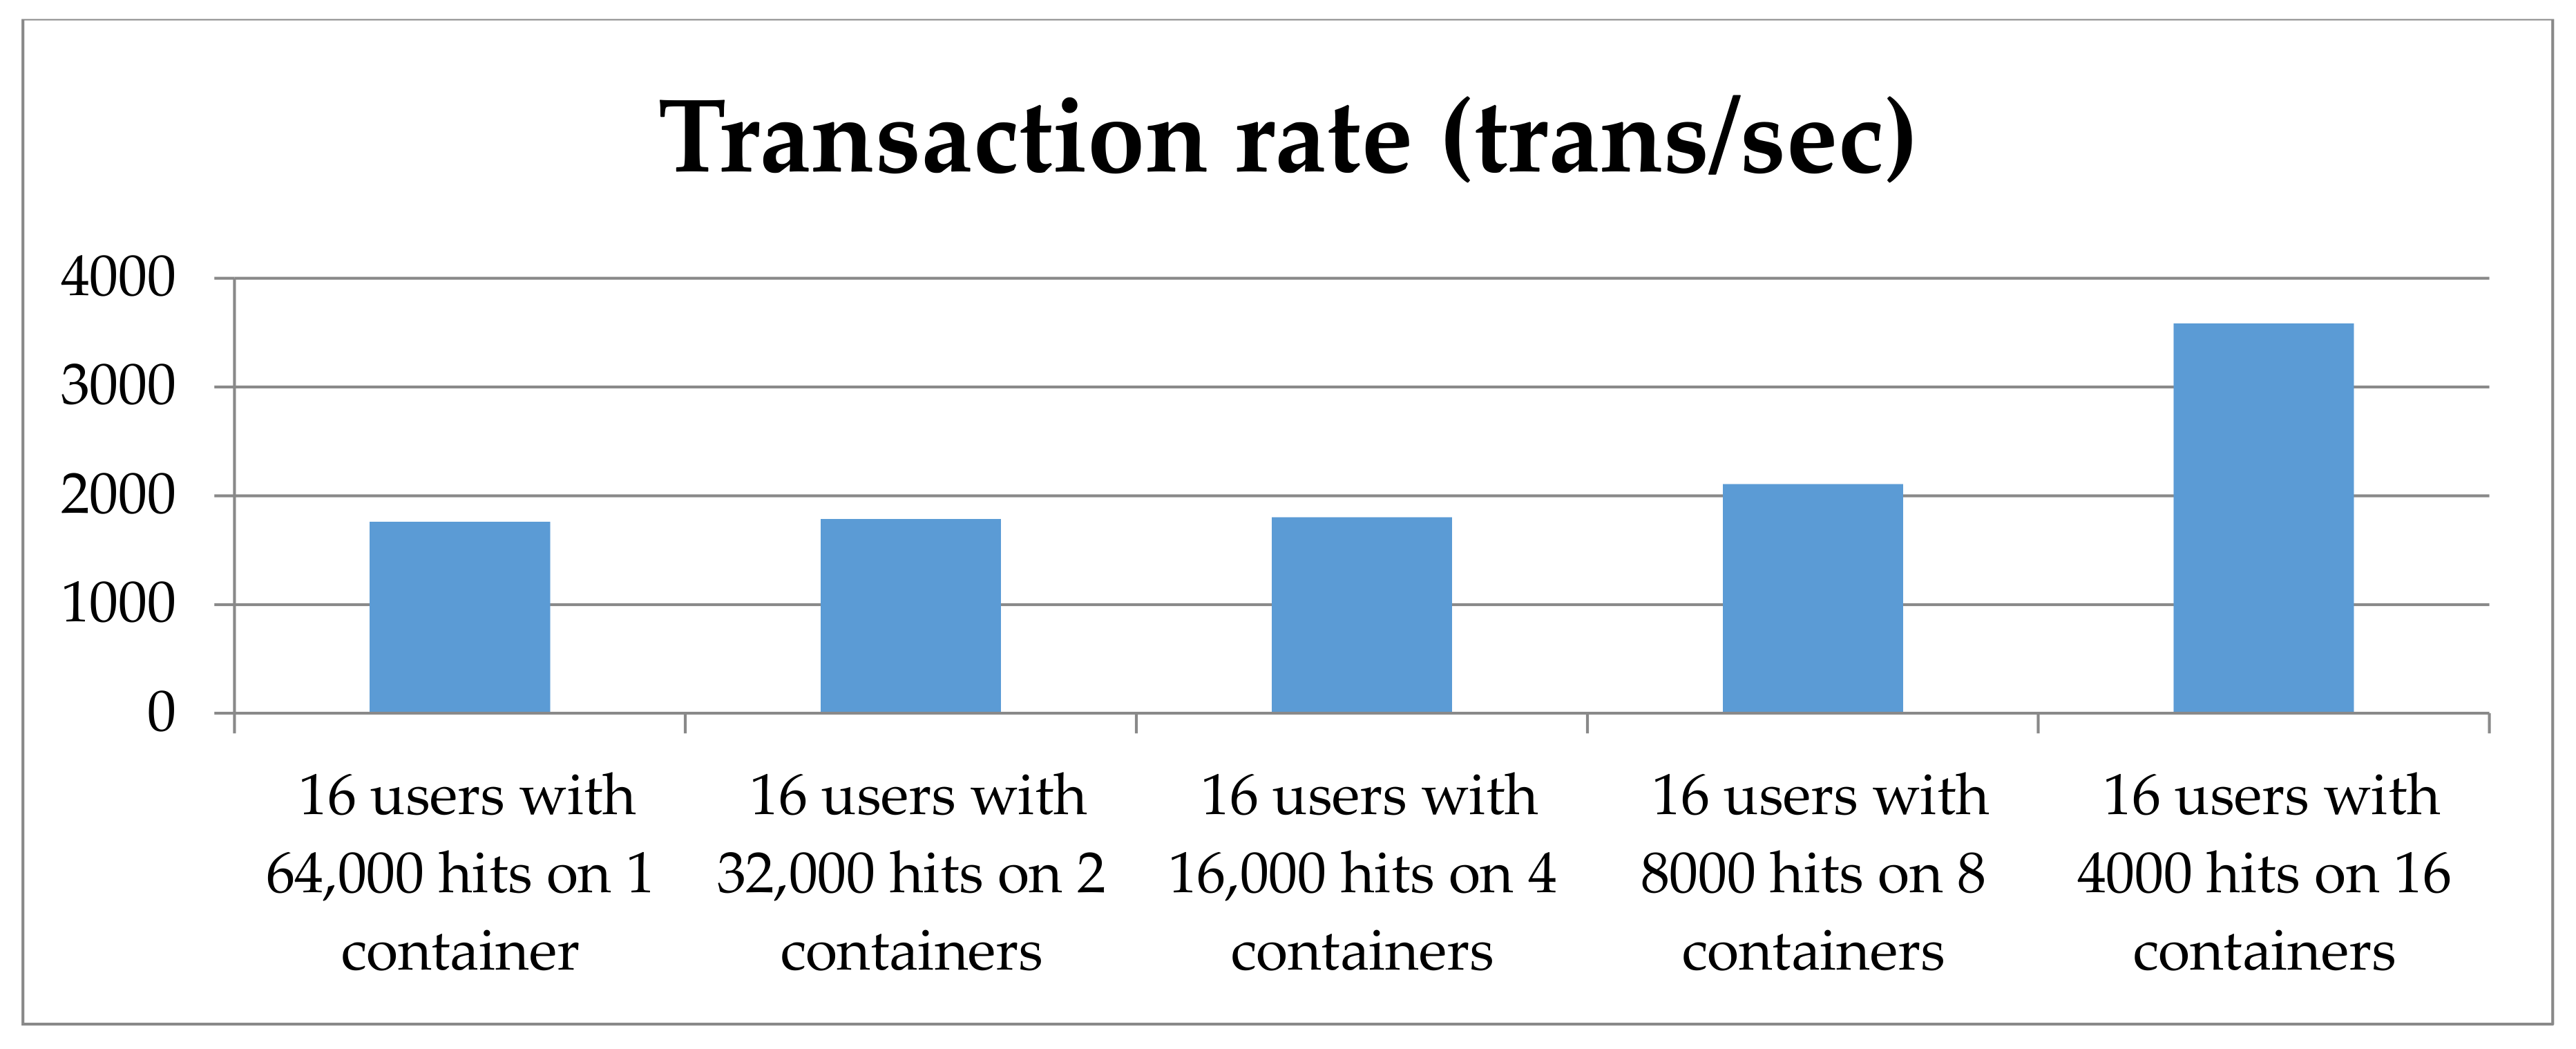
During the power measurement process, we could record additional data about the availability and the scalability of the containers. We validated this data with a different setup, in which the transaction time was not specified. In this way, we could see which configuration was the fastest. Because of the large amount of data, we only show the results for 64,000 hits on 1 to 16 containers produced by 16 users set on each container. The collected data can be found in Figure 7, Figure 8, Figure 9 and Figure 10.
All results shown before were validated via the second UDOO and on a small cluster composed of UDOOs. The raw data results can be found in our GitLab repository [27].
4. Analysis of the Results
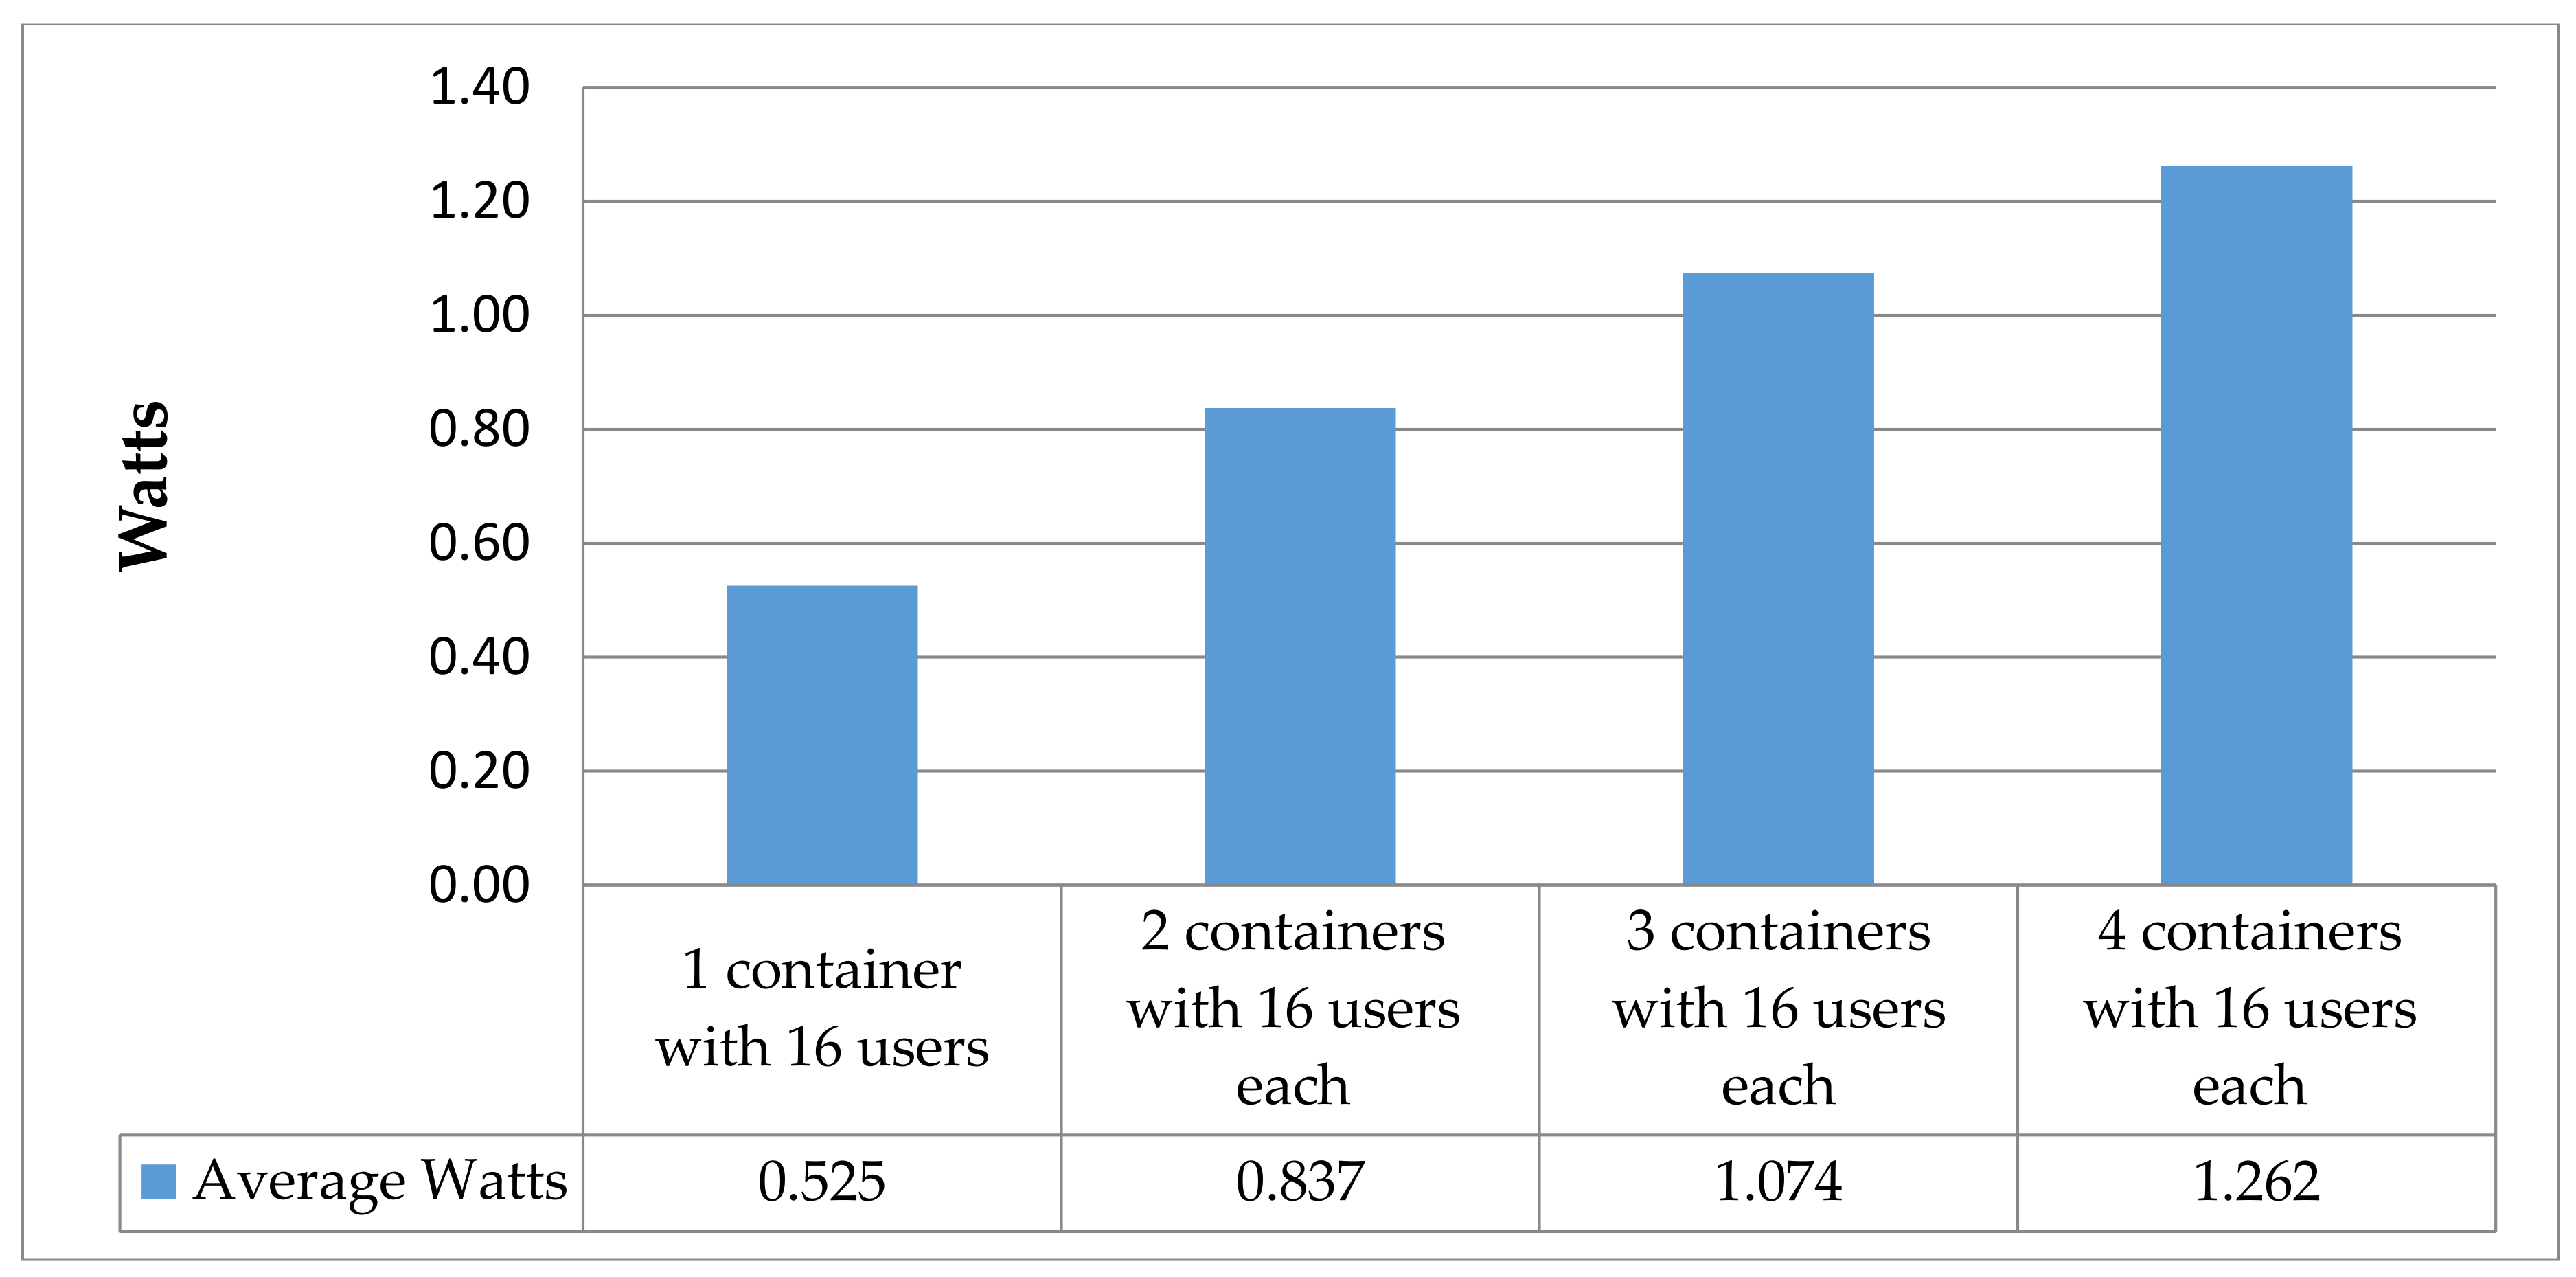
First, prior to measurements, we expected that two containers with x hits each per minute would consume twice the energy of one container with x hits per minute, since containers should guarantee that they are independent of each other until it is explicitly requested. It should be mentioned that the power consumption of our containers in idle mode completely faded within the energetic white noise. This expectation is supported by the number of processes that each container starts (one process for the daemon entry in the Docker daemon and one for the link between host ports and container ports). Additionally, there can be one process for each process running inside the container (e.g., a script). However, for example, if we compare the result of Figure 10 with one container handling 16 users (16,000 hits) and four containers handling 16 users each (16,000 hits per container), the difference is not 400%, but only 140%. We get similar results when we look at the load balancing between containers. As the measuring results of Figure 3, Figure 4, Figure 5 and Figure 6 show, the difference between one container and 16 containers with equally shared hits (16 users shared between 16 containers) is only 0.1 W at most, which means only 16% more power per service than before. Furthermore, in relation to Figure 9, the transaction rate doubles and the longest average transaction took 0.0466 s instead of 0.871 s (see replication package file measurement_test_series_1.xlsx). Therefore, we recommend scaling web services as soon as possible in order to guarantee the availability of the web service without consuming too much energy, even if they are used to capacity. Where these energy savings result from cannot be answered at this point; however, we assume that they result from the layer resolution of Docker. Since resources such as the network hardware are normally allocated to every container, the energy costs for one container cannot be half the costs of two containers. It is worthwhile to mention that since the amount of data used in the experiment is very small, no point could be determined at which the server/container could no longer handle the requests (since load was only generated by one system). If we increase the amount of data downloaded per access (for example, dynamic web pages), we get an upper limit for requests per container.
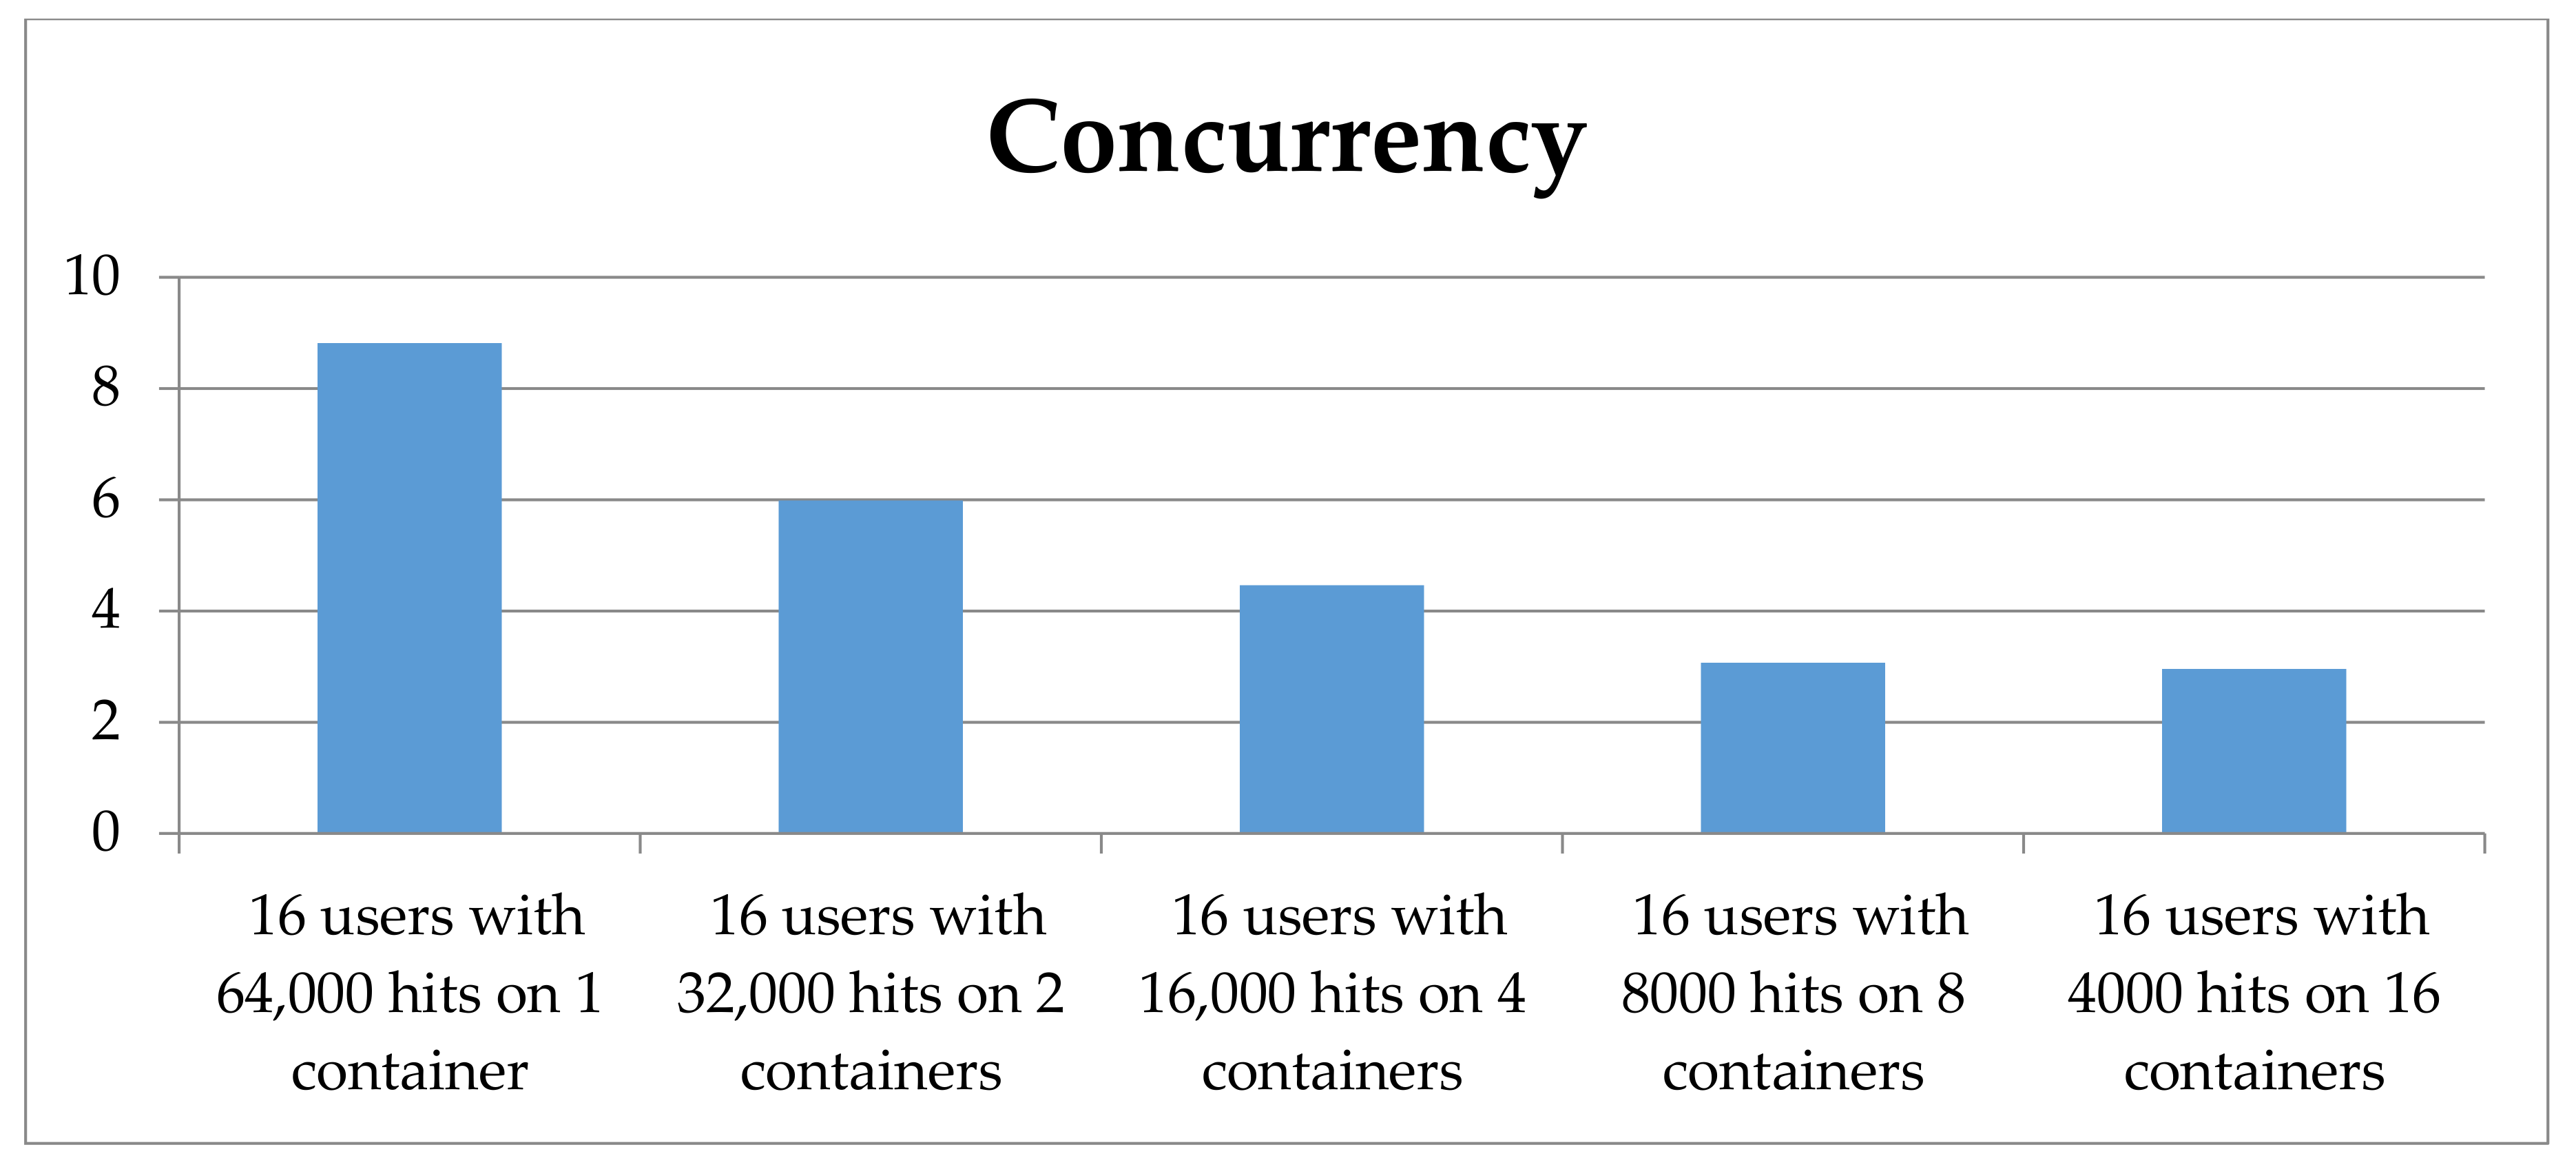
Related to the values in Figure 7, Figure 8 and Figure 9, it is possible to find the optimal point of creating a replica of a service in order to scale it without consuming much more energy. The problem is that this point cannot be found in general, because it depends on the container that is running. Moreover, it depends on the cluster management tool that is used and on its replica controller, because in contrast to our test, every replica uses the same port, but is balanced via the replica controller, which consumes further energy (we simulated this controller manually). The aforementioned optimal point of creating another container could be found by observing the energy consumption behavior related to the concurrency value of Figure 9 and the limit of requests per container (see above). In comparison to cluster management tools such as Kubernetes, an autoscaler based on this consideration would likely save more energy than classic autoscalers, which only observe the average CPU utilization of the service to match a user-specified limit and, thus, periodically adjust the number of replicas [28]. It should be possible to create an autoscaler that scales with regard to CPU utilization and energy consumption. Since the energy consumption is dependent on the CPU utilization, the controller should create replicas even before they are really needed, without spending too much energy and CPU resources at the same time. As shown in [29], there is a linear connection between CPU consumption and power consumption. However, since reading the CPU consumption simultaneously influences the low power values in our test, we did not find a satisfying method to collect the CPU data in parallel to our tests.
5. Conclusions and Future Work
Looking at the results of our experiments in summary, it can be clearly said that even if the difference between a single web-server container and scaling to several web-server containers seems small, there is potential for saving energy and simultaneously increasing reliability and accessibility. As mentioned in Section 4, in order to use this potential, the cluster management tools have to find the perfect point of scaling a service in order to save energy. It is important to create more comprehensive test scenarios with the aim of using them to generate realistic training data. In the future, we will work towards such an intelligent cluster manager. The first step is to generate a simulation tool for the exact determination of the energy that can be saved. Secondly, this tool will be applied to the different test scenarios.
As it turned out in the course of the experiment, the CPU and RAM consumption as well as the power consumption of web-server containers are exact images of native web servers. If this also applies to all other scenarios and different software (for example, databases), this knowledge could be used to extend the abovementioned simulation tool in such a way that complex network systems can be modeled and simulated. It would be possible to make a precise statement in advance about the resource consumption of entire network systems and adapt and design server farms/clusters accordingly. Using the criteria defined in [14], the method proposed here may further be used to develop an awarding procedure for environmental labels for containerization.
In future experiments, we would like to give an overview of different container software regarding their power consumption, as mentioned before during the test for the different power consumptions of Rocket, Docker, and native NGINX. We are currently preparing test environments for examining the various network techniques of container software. Here, we would like to show the energetic differences of the implementation possibilities of software-defined networks (e.g., bridge networks and Macvlan networks) in container software. All in all, this subject area offers sufficient potential to continue research, since the increasing amount of collected data and therefore the increasing number of servers leads to higher energy consumption through data centers.
Author Contributions
Conceptualization, S.K.; Methodology, A.G. and S.N.; Software, S.K.; Validation, S.K., A.G. and S.N.; Formal Analysis, S.K.; Investigation, S.K.; Resources, S.K., A.G.; Data Curation, S.K., A.G.; Writing-Original Draft Preparation, S.K., A.G. and S.N.; Writing-Review & Editing, S.K., A.G. and S.N.; Visualization, S.K.; Supervision, S.N.; Project Administration, S.K.
Funding
This research received no external funding.
Conflicts of Interest
The authors declare no conflict of interest.
References
- Deep Borah, A.; Mucharary, D.; Singh, S.; Borah, J. Power saving strategies in green cloud computing systems. Int. J. Grid Distrib. Comput. 2015, 8, 299–306. [Google Scholar] [CrossRef]
- What Is Docker. Available online: https://www.docker.com/what-docker (accessed on 8 May 2018).
- About Docker. Available online: https://www.docker.com/company (accessed on 8 May 2018).
- Docker Overview. Available online: https://docs.docker.com/engine/docker-overview/#what-can-i-use-docker-for (accessed on 8 May 2018).
- Docker Usage Statistics: Increased Adoption by Enterprises and for Production Use. Available online: https://www.coscale.com/blog/docker-usage-statistics-increased-adoption-by-enterprises-and-for-production-use (accessed on 3 July 2018).
- Penzenstadler, B.; Bauer, V.; Calero, C.; Franch, X. Sustainability in software engineering: A systematic literature review. In Proceedings of the 16th International Conference on Evaluation & Assessment in Software Engineering (EASE 2012), Ciudad Real, Spain, 14–15 May 2012; pp. 32–41. [Google Scholar] [CrossRef]
- Hilty, L.M.; Aebischer, B. ICT for Sustainability: An Emerging Research Field. In ICT Innovations for Sustainability: Advances in Intelligent Systems and Computing; Hilty, L.M., Aebsicher, B., Eds.; Springer: Basel, Switzerland, 2015; pp. 3–36. [Google Scholar]
- Naumann, S.; Dick, M.; Kern, E.; Johann, T. The GREENSOFT model: A reference model for green and sustainable software and its engineering. Sustain. Comput. Inform. Syst. 2011, 1, 294–304. [Google Scholar] [CrossRef]
- Green Software Engineering Criteria Catalog. Available online: http://green-software-engineering.de/kriterienkatalog-v01/einleitung.html (accessed on 8 May 2018).
- Andrae, Anders (Huawei). Total Consumer Power Consumption Forecast. 2017. Available online: https://www.researchgate.net/publication/320225452_Total_Consumer_Power_Consumption_Forecast (accessed on 3 July 2018).
- Andrae, A.S.G.; Edler, T. On global electricity usage of communication technology: Trends to 2030. Challenges 2015, 6, 117–157. [Google Scholar] [CrossRef]
- Gartner Infineon. Worldwide Server Shipments from 2010 to 2017 (in Million Units). Available online: https://www.statista.com/statistics/219596/worldwide-server-shipments-by-vendor/ (accessed on 4 July 2018).
- Stack Overflow Insight Trends. Available online: https://insights.stackoverflow.com/trends?tags=containers%2Cdocker (accessed on 4 July 2018).
- Kern, E.; Hilty, L.M.; Guldner, A.; Maksimov, Y.V.; Filler, A.; Gröger, J.; Naumann, S. Sustainable software products-Towards assessment criteria for resource and energy efficiency. Future Gener. Comput. Syst. 2018, 86, 199–210. [Google Scholar] [CrossRef]
- Tadesse, S.; Chiasserini, C.-F.; Malandrino, F. Energy consumption measurements in docker. In Proceedings of the IEEE 41st Annual Computer Software and Applications Conference, Turin, Italy, 4–8 July 2017; pp. 272–273. [Google Scholar]
- Santos, E.; McLean, C.; Solinas, C.; Hindle, A. How does Docker affect energy consumption? Evaluating workloads in and out of Docker containers. arXiv, 2017; arXiv:1705.01176. [Google Scholar]
- Kang, D.K.; Choi, G.B.; Kim, S.H.; Hwang, I.S.; Youn, C.H. Workload-aware resource management for energy efficient heterogeneous Docker containers. In Proceedings of the 2016 IEEE Region 10 Conference (TENCON), Singapore, 22–25 November 2016; pp. 2428–2431. [Google Scholar] [CrossRef]
- Piraghaj, S.F.; Dastjerdi, A.V.; Calheiros, R.N.; Buyya, R. A framework and algorithm for energy efficient container consolidation in cloud data centers. In Proceedings of the 2015 IEEE International Conference on Data Science and Data Intensive Systems, Sydney, NSW, Australia, 11–13 December 2015; pp. 368–375. [Google Scholar] [CrossRef]
- CoreOS Rocket. Available online: https://coreos.com/rkt/docs/latest/rkt-vs-other-projects.html#process-model (accessed on 8 May 2018).
- Dirlewanger, W. Measurement and Rating of Computer Systems Performance and of Software Efficiency: An Introduction to the ISO/IEC 14756 Method and a Guide to Its Application; Kassel University Press: Kassel, Germany, 2006. [Google Scholar]
- Figures Regarding Sustainable Software Engineering. Available online: http://green-software-engineering.de/en/downloads.html (accessed on 8 May 2018).
- Siege Home. Available online: https://www.joedog.org/siege-home/ (accessed on 8 May 2018).
- Gude Expert Power Control 1202. Available online: https://www.gude.info/power-distribution/switched-metered-pdu/expert-power-control-1202-serie.html (accessed on 8 May 2018).
- Udoo x86. Available online: https://www.udoo.org/udoo-x86/ (accessed on 8 May 2018).
- Nickoloff, J. Docker in Action pp. 44-48: 3.2 Finding and Installing Software; Manning: Shelter Island, NY, USA, 2016; ISBN 9781633430235. [Google Scholar]
- DeJonghe, D. Compelte NGINX Cookbook; O’Reilly: Sebastopol, CA, USA, 2017; ISBN 9781491968656. [Google Scholar]
- Replication Package and Raw Data. Available online: https://gitlab.umwelt-campus.de/skreten/Docker_Energy_Measurements (accessed on 1 August 2018).
- Horizontal Pod Autoscaler. Available online: https://kubernetes.io/docs/tasks/run-application/horizontal-pod-autoscale/ (accessed on 8 May 2018).
- Fan, X.; Weber, W.-D.; Barroso, L.A. Power provisioning for a warehouse-sized computer. In SIGARCH Computer Architecture News; ACM: New York, NY, USA, 2007; Volume 35, pp. 13–23. [Google Scholar] [CrossRef]
Figure 1.
Measuring environment [21].
Figure 1.
Measuring environment [21].

Figure 2.
Power consumption of Rocket and Docker relating to NGINX.

Figure 3.
Average power consumption of a model web app with an amount of hits on one NGINX container and allocated to two NGINX containers.
Figure 3.
Average power consumption of a model web app with an amount of hits on one NGINX container and allocated to two NGINX containers.

Figure 4.
Average power consumption of a model web app with an amount of hits on one NGINX container and allocated to four NGINX containers.
Figure 4.
Average power consumption of a model web app with an amount of hits on one NGINX container and allocated to four NGINX containers.

Figure 5.
Average power consumption of a model web app with an amount of hits on one NGINX container and allocated to eight NGINX containers.
Figure 5.
Average power consumption of a model web app with an amount of hits on one NGINX container and allocated to eight NGINX containers.

Figure 6.
Average power consumption of a model web app with an amount of hits on one NGINX container and allocated to 16 NGINX containers.
Figure 6.
Average power consumption of a model web app with an amount of hits on one NGINX container and allocated to 16 NGINX containers.

Figure 7.
Elapsed time, hitting 1 NGINX container to 16 NGINX containers with 64,000 overall hits.

Figure 8.
Transaction rate, hitting 1 NGINX container to 16 NGINX containers with 64,000 overall hits.
Figure 8.
Transaction rate, hitting 1 NGINX container to 16 NGINX containers with 64,000 overall hits.

Figure 9.
Concurrency of the webservers/containers (average number of simultaneous connections, a number which rises as server performance decreases).
Figure 9.
Concurrency of the webservers/containers (average number of simultaneous connections, a number which rises as server performance decreases).

Figure 10.
Power consumption of containers with equal load.


Table 1.
Hierarchical container engine process models and process description [19].
Table 1.
Hierarchical container engine process models and process description [19].
| Rocket (rkt) | Process Description | Docker | Process Description | |
|---|---|---|---|---|
| 1 | systemd | System daemon for starting, monitoring, and closing processes | systemd | System daemon for starting, monitoring, and closing processes |
| 2 | rkt run container | Processes the client command, talks to init systems such as systemd | docker run container | Processes the client command, talks to Docker daemon API and containerd |
| 3 | application | Process of the application | docker engine | Process of the docker containerization technology |
| 4 | containerd | Container runtime system with open standard of the Open Container Initiative | ||
| 5 | run C | Container runtime system, used to interact with the host system | ||
| 6 | application | Process of the application |
© 2018 by the authors. Licensee MDPI, Basel, Switzerland. This article is an open access article distributed under the terms and conditions of the Creative Commons Attribution (CC BY) license (http://creativecommons.org/licenses/by/4.0/).
Share and Cite
MDPI and ACS Style
Kreten, S.; Guldner, A.; Naumann, S. An Analysis of the Energy Consumption Behavior of Scaled, Containerized Web Apps. Sustainability 2018, 10, 2710. https://doi.org/10.3390/su10082710
AMA Style
Kreten S, Guldner A, Naumann S. An Analysis of the Energy Consumption Behavior of Scaled, Containerized Web Apps. Sustainability. 2018; 10(8):2710. https://doi.org/10.3390/su10082710
Chicago/Turabian StyleKreten, Sandro, Achim Guldner, and Stefan Naumann. 2018. "An Analysis of the Energy Consumption Behavior of Scaled, Containerized Web Apps" Sustainability 10, no. 8: 2710. https://doi.org/10.3390/su10082710
Note that from the first issue of 2016, this journal uses article numbers instead of page numbers. See further details here.