The Influence of Local Environmental, Economic and Social Variables on the Spatial Distribution of Photovoltaic Applications across China’s Urban Areas


1
School of Architecture, Harbin Institute of Technology, Harbin 150006, China
2
Heilongjiang Cold Region Urban-Rural Human Settlements Science Key Laboratory, No.66 Xidazhi St., Harbin 150006, China
*
Author to whom correspondence should be addressed.
Energies 2018, 11(8), 1986; https://doi.org/10.3390/en11081986
Submission received: 18 July 2018
/
Revised: 26 July 2018
/
Accepted: 27 July 2018
/
Published: 31 July 2018
(This article belongs to the Special Issue Solar Thermal Energy Utilization Technologies in Buildings)
Abstract
:The capacity of new installed photovoltaic (PV) in China in 2017 was increased to 53.06 GW, reaching a total of 402.5 GW around the world. Photovoltaic applications have a significant role in the reduction of greenhouse gas emissions and alleviating electricity shortages in the sustainable development process of cities. Research on the factors that influenced the spatial distribution of photovoltaic applications mostly focus on a certain project or a region. However, it is a complicated process for decision-making of photovoltaic installations in urban areas. This study uses zip code level data from 83 cities to investigate the influence of local environmental, economic and social variables on the spatial distribution of photovoltaic applications across China’s urban areas. By analyzing the current situation, the locations of urban photovoltaic applications are collected and presented. Statistical analysis software is used to evaluate the influence of selected variables. In this paper, correlation analysis, principle component analysis (PCA) and cluster analysis are generated to predict urban photovoltaic installations. The results of this research show that Gross Domestic Product (GDP), electricity consumption, policy incentives, the number of photovoltaic companies, population, age, education and rate of urbanization were important factors that influenced the adoption of urban photovoltaic systems. The results also indicate that Southeast China and Hangzhou Province are currently the most promising areas as they have a higher rate of solar photovoltaic installation. These conclusions have significancefor energy policy and planning strategies by predicting the future development of urban photovoltaic applications.
1. Introduction
Many cities around the world have started to develop solar urban plans to promote environmental protection and sustainable development. Considering that an estimated 59% of China’s population in 2017 is located in urban areas, with an annual urbanization rate of 1.2%, it is clear that most of the energy consumption in China takes place in urban areas. With energy prices increasing and CO2 emission reduction remaining a serious problem, adopting solar energy in urban areas appears to be an essential and practicable strategy for sustainable development [1]. Solar urban planning is a complex process that must consider the interplay between solar energy and urban form. In the context of rapid urbanization, site selection for photovoltaic systems in urban development land should be used to guide urban planning. Considering urban planning as a first field for solar design, the new urban pattern and built environment are based on some spatial determinants, such as solar potential, economic capacity, energy policies and photovoltaic market competition.
By 2020, European Union has a 20% energy savings goal [2]. According to the 13th Five-Year Plan for the Development of Renewable Energy of China, non-fossil fuels accounted for 15% of primary energy consumption by 2020. It is crucial to develop renewable energy and improve energy efficiency for these countries. Due to the decreasing costs, government support and the technological progress of solar modules [3,4], solar photovoltaic energy has seen a significant increase in recent years. The newly installed photovoltaic capacity around the world grew by about 29% to approximately 98 GW in 2017, reaching a total of 402.5 GW. China has assumed a leading role in the global photovoltaic market, with new installed power in 2017 at 53.06 GW, a 53% increase. Among them, distributed photovoltaic generation was increase by 3.7 times compared to 2016, the cumulative distributed power installation was 29.66 GW. From the layout of the newly installed power generation, we found an obvious transition trend from the northwest region to the central and eastern regions of China. Zhejiang, Shandong and Anhui provinces accounted for 45.7% of the newly installed distributed photovoltaic applications in China [5]. The development of distributed photovoltaic applications benefits the environment by reducing the emissions of greenhouse gases. In addition, the sustainable increase of distributed photovoltaic applications in China illustrates the diversification of the market development and the improvement of key technologies, which were an increase of energy independence. In the future, more economic and technological photovoltaic systems are needed to create appropriate benefits [6].
The ambition to develop renewable energy resources began in 2006 when China’s “Renewable Energy Law” came into effect. In 2009, following the interaction of this law, the Ministry of Housing and Urban Rural Development (MHURD), the Ministry of Finance (MOF) and the National Energy Administration (NEA) initiated the Golden Sun Program. In 2014, policies for distributed photovoltaic applications were created by the NEA, which applied distributed photovoltaic power generation to urban master planning. Roofs, electricity load and other indices were considered in the planning of distributed photovoltaic applications. Demonstration areas of distributed photovoltaic applications were established by the NEA and the National Development and Reform Commission (NDRC) to improve photovoltaic technologies and decrease costs and electricity prices. The government’s primary means of inspiring the development of distributed photovoltaic applications is the investment of financial subsidies in enterprises, energy service companies and individual investors. From 2013 to 2017, the national subsidy for distributed photovoltaic applications was 0.42 yuan per kilowatt, which decreased to 0.37 yuan per kilowatt in 2018. Local governments were encouraged to provide matching financial subsidies based on the national subsidies. Moreover, commercial enterprises and industrial areas with higher electricity prices and public utilities such as roads, parks and parking lots were encouraged to prioritize installing photovoltaic systems [7,8]. Buildings integrated with photovoltaic (BIPV), especially public buildings such as schools, hospitals, stations, airport terminals, stadiums and official buildings, were also encouraged by the Chinese government.
The government has begun to look forward to the promotion of distributed photovoltaic applications into urban areas, which are severely appropriate to build in cities. Even the irradiation influences the efficiency of solar energy arriving onto the surface of photovoltaic panels, site selection of photovoltaic applications in urban areas is flexible [9,10,11]. Due to the strong support of national policies, the non-technical costs (the cost of land and the cost of access to the grid) are also decreasing, the growth of photovoltaic applications in urban areas is rapid. Presently, urban photovoltaic applications take land and spatial characteristics of cities into account to integrate these applications with the structure of buildings and infrastructure [12].
Previous research has studied the spatial distribution of photovoltaic applications. Snape investigated the spatial and temporal characteristics of photovoltaic adoption in the UK; he used quantitative analysis of photovoltaic adoption data and qualitative policy analysis to indicate the influence of external factors on the decision-making process. Data analysis, policy impact and socio-psychological drivers were needed to understand the adoption of photovoltaics [13]. He et al. constructed an evaluation index system for the core abilities of distributed PV-generation project, the results showed that installed capacity, local economy development and grid-connected power quantity were factors influencing the distributed PV-generation projects [14]. Cucchiella et al. presented an economic analysis of a photovoltaic system to make it more competitive, they concluded that photovoltaic investments increase the energy independence of a country and the installations of these systems [15]. Cucchiella et al. also estimated the economic profitability and environmental impact of building integrated photovoltaic systems in Italian regions to delineate the general characteristics [16]. Wang et al. analyzed the policy effects of feed-in tariff on the solar photovoltaic installations [17]. In fact, much of the current literature has examined the environmental resources [18,19], markets, investments and policies influencing the distribution of solar energy. However, the development of photovoltaic installations in urban areas is complicated in terms of the decision-making process [20,21]. There is a lack of literature quantifying the factors that influence the distribution of solar photovoltaic applications across China’s urban areas. In this sense, environmental resources, economic assessment and social variables need to be evaluated together to investigate influencing factors relating to photovoltaic applications in urban areas.
This paper evaluates the influence of environmental, economic and social factors on the spatial distribution of photovoltaic installations across China’s central urban areas. A statistical method is used to analyze the influence of environmental, economic and social variables on the spatial distribution of photovoltaic applications in central urban areas. We first identify the photovoltaic projects in different ZIP codes to analyze the spatial distribution of urban photovoltaic applications in China. Then we select 16 explanation variables representing environmental, economic and social variables to analyze the influencing mechanism of spatial distribution. Finally, through cluster analysis we provide useful information and advice to the government for the future development of installation and the energy policy.
The paper is organized as follows: Section 2 presents the methodology used in this paper and data collection is defined. Results in terms of statistical analysis (correlation analysis, principal component analysis and cluster analysis) are proposed in Section 3 and a discussion is conducted in Section 4. Finally, Section 5 presents some concluding remarks.
2. Materials and Methods
This study used ZIP code level data to examine how photovoltaic applications in central urban areas are influenced by different environmental, economic and social variables. A statistical analysis method was used in this study to test the effect of the independent variable on the number of photovoltaic applications in each ZIP code. Correlation analysis, principal component analysis (PCA) and cluster analysis were conducted by using the statistical analysis software, IBM SPSS Statistics 21.0 (International Business Machines, New York, NY, USA). The Spearman correlation coefficient was selected to analyze the relevance between the independent variable and dependent variables, while those dependent variables with strong correlation were then extracted by PCA. Afterwards, regression analysis was used to measure the contribution of each ZIP code to the main factors. The cluster analysis of the ZIP codes was conducted to predict future development trends. Data collection and sources are presented in this section.
2.1. Data Collection
We obtained the administrative division data from the National Administration of Surveying, Mapping and Geo-information (NASMG). There are 34 provincial administrative regions in China, including 23 provinces, 5 autonomous regions, 4 municipalities and 2 special administrative regions. The distribution of administrative regions with photovoltaic installations was collected from the NEA and photovoltaic companies. Of the 34 provincial administrative regions in China, only 25 administrative regions had photovoltaic installations in central urban areas. Basic information includes the location of the installation, the time of installation and the installed capacity.
2.2. Dependent Variable
The dependent variable for this study was the number of photovoltaic installations in each administrative region. We collected these data from the NEA and photovoltaic companies to cover the period from 1999 to 2016. The information on these photovoltaic installations included the location of the installation, the year of installation and the installed capacity. As of December 31, 2016, there were 247 photovoltaic installations in the central urban areas of China. These photovoltaic installations were in 19 provinces, 3 municipalities, 2 autonomous regions and 1 special administrative region. The number of these photovoltaic applications reflected the agglomeration of spatial distribution and the installed capacity reflected the level of development.
Since the photovoltaic installations in central urban areas were mostly distributed photovoltaic applications, the area of the photovoltaic panels and installed capacity were limited. The total installed capacity of these urban photovoltaic projects is 339,456.06 kWp. These data do not include photovoltaic applications that were not recorded in the NEA. The photovoltaic systems in central urban areas were installed on the rooftops and facades of public and residential buildings or public utilities. The installed capacity of each photovoltaic project was lower than ground-mounted photovoltaic plants.
2.3. Independent Variables
2.3.1. Environmental Variables
The annual total solar radiation (kWh/m2) and annual sunshine hours (h) were selected as the environmental variables. Data were downloaded from the National Meteorological Information Center (NMIC) [22]. The techno-economic performance of a photovoltaic system depends on climatic conditions [23]. IEA-PVPS (International Energy Agency Photovoltaic Power Systems Programme) indicated that if the surface of a building received 80% of the total solar radiation, then the building is suitable for the installation of photovoltaic systems [24]. Based on this standard, Compagnon [25] and Kanters [26] established the threshold of solar radiation for photovoltaic installation. Regarding China, to improve generation efficiency, the Ministry of Housing and Urban-Rural Development of the People’s Republic of China (MOHURD) and some cities specified photovoltaic systems be positioned where they received more than 3 h in the winter solstice [27]; namely, 4 h in Jiangsu Province [28] and 6 h in Shanghai [29]. These studies have shown that annual total solar radiation and annual sunshine hours positively correlated with the location of photovoltaic installations.
2.3.2. Economic Variables
There were six economic variables related to the number of photovoltaic installations in each ZIP code, including the Gross Domestic Product of each ZIP code (GDP, billion yuan), per capita disposable income (yuan), electricity consumption (billion kWh), feed-in tariffs (yuan), policy incentives and number of photovoltaic companies.
GDP, per capita disposable income and electricity consumption data were downloaded from the National Bureau of Statistics of the People’s Republic of China [30]. GDP reflected the economic condition of an administrative region. The installation of photovoltaic systems was an investment cost that would be recovered after a long time. In this case, photovoltaic installations were only affordable for ZIP codes with strong economies.
Per capita disposable income referred to the annual income of an urban resident; rural residents were excluded from this study. Administrative regions with higher incomes were expected to be more likely to install photovoltaic systems. Previous studies have shown that citizens with low incomes were less likely to invest in photovoltaic installations; accessibility and affordability were limitations for consumers [31].
Noll et al. investigated the generous feed-in tariffs that have brought higher adoption rates and more market competition [32]. For ZIP codes with higher electricity consumption, decreasing the price of electricity was an urgent issue, which provided an incentive to develop the photovoltaic industry. In 2016, the feed-in tariffs were 0.80 yuan, 0.88 yuan and 0.98 yuan, depending on the solar resource areas to which the location of photovoltaic installations belong. There were three solar resource areas in China and the division was based on the abundance of solar radiation. The greater the solar radiation was, the less the feed-in tariff was. In this study, we did not consider the finance subsidies from the local government or community, because the incentives from these departments only benefited specific areas and groups of people, which had no general significance.
Except for the feed-in tariffs, the finance subsidy for the photovoltaic installations in urban areas was a solar energy policy incentive established by the Chinese government. Financial subsidies for enterprises, energy service companies and individual investors are the government’s main means of inspiring the development of distributed photovoltaic applications. From 2013 to 2017, the national subsidy for distributed photovoltaic applications was 0.42 yuan per kilowatt. The Ministry of Finance of the People’s Republic of China, the Ministry of Housing and Urban-Rural Development of the People’s Republic of China (MOHURD) (2009) and the State Council (2013) indicated the application of the subsidy as follows: commercial enterprises and industrial areas with higher electricity prices received priority support to install photovoltaic systems; schools, hospitals, official buildings and residential buildings and structures received support to install photovoltaic systems; and public utilities such as roads, parks and parking lots were encouraged to install photovoltaic systems.
Due to a difference in the level of incentive, photovoltaic installations that received priority support received a score of 4, photovoltaic installations that were supported received a score of 3, photovoltaic installations that were encouraged received a score of 2 and the installations received a score of 1. Additionally, policies regarding the local government were excluded in this part.
The number of photovoltaic companies in each ZIP code was used to analyze the current condition of the photovoltaic market. The data were downloaded from the Photovoltaic Companies Directory of China. ZIP codes with a greater number of photovoltaic companies demonstrated greater growth in the solar electricity industry, providing a better background for photovoltaic installations.
2.3.3. Social Variables
The following four social variables were used in this study to evaluate their influence on spatial distribution: population, age, education and rate of urbanization of a ZIP code. All data were obtained from the National Bureau of Statistics of the People’s Republic of China.
Labay and Kinnear collected age and education data to explore the consumer decision making process in the adoption of solar energy systems [33]. Recent work has explored the role of peer effects in the adaptation of solar panels by residents [34], which also considers individual preferences as social factors. Through previous studies, we investigated the fact that older people in China were less concerned about the energy crisis than younger people. Labay and Kinnear also highlighted that income affected the installation of solar energy. People with higher levels of education were more likely to adopt new technologies and the level of education resulted in knowledge of the market, which was also correlated with the installation of photovoltaic systems.
Therefore, the population, age and education of citizens in a ZIP code may correlate with solar photovoltaic installations. The age information includes individuals aged 15–64 and 65+, while the population under 14 years of age was excluded. Additionally, the education information includes college, high school, middle school and primary school.
The rate of urbanization was calculated by the percentage of the permanent population in urban areas and the total permanent population in a ZIP code. The level of urbanization is an important indicator for the socio-economic development in a ZIP code. Chaianong et al. indicated that an increasing urbanization rate also resulted in an increase of potential suitable space for solar systems [35]. The ZIP codes with more photovoltaic installations were predicted to have higher urbanization rates.
3. Results
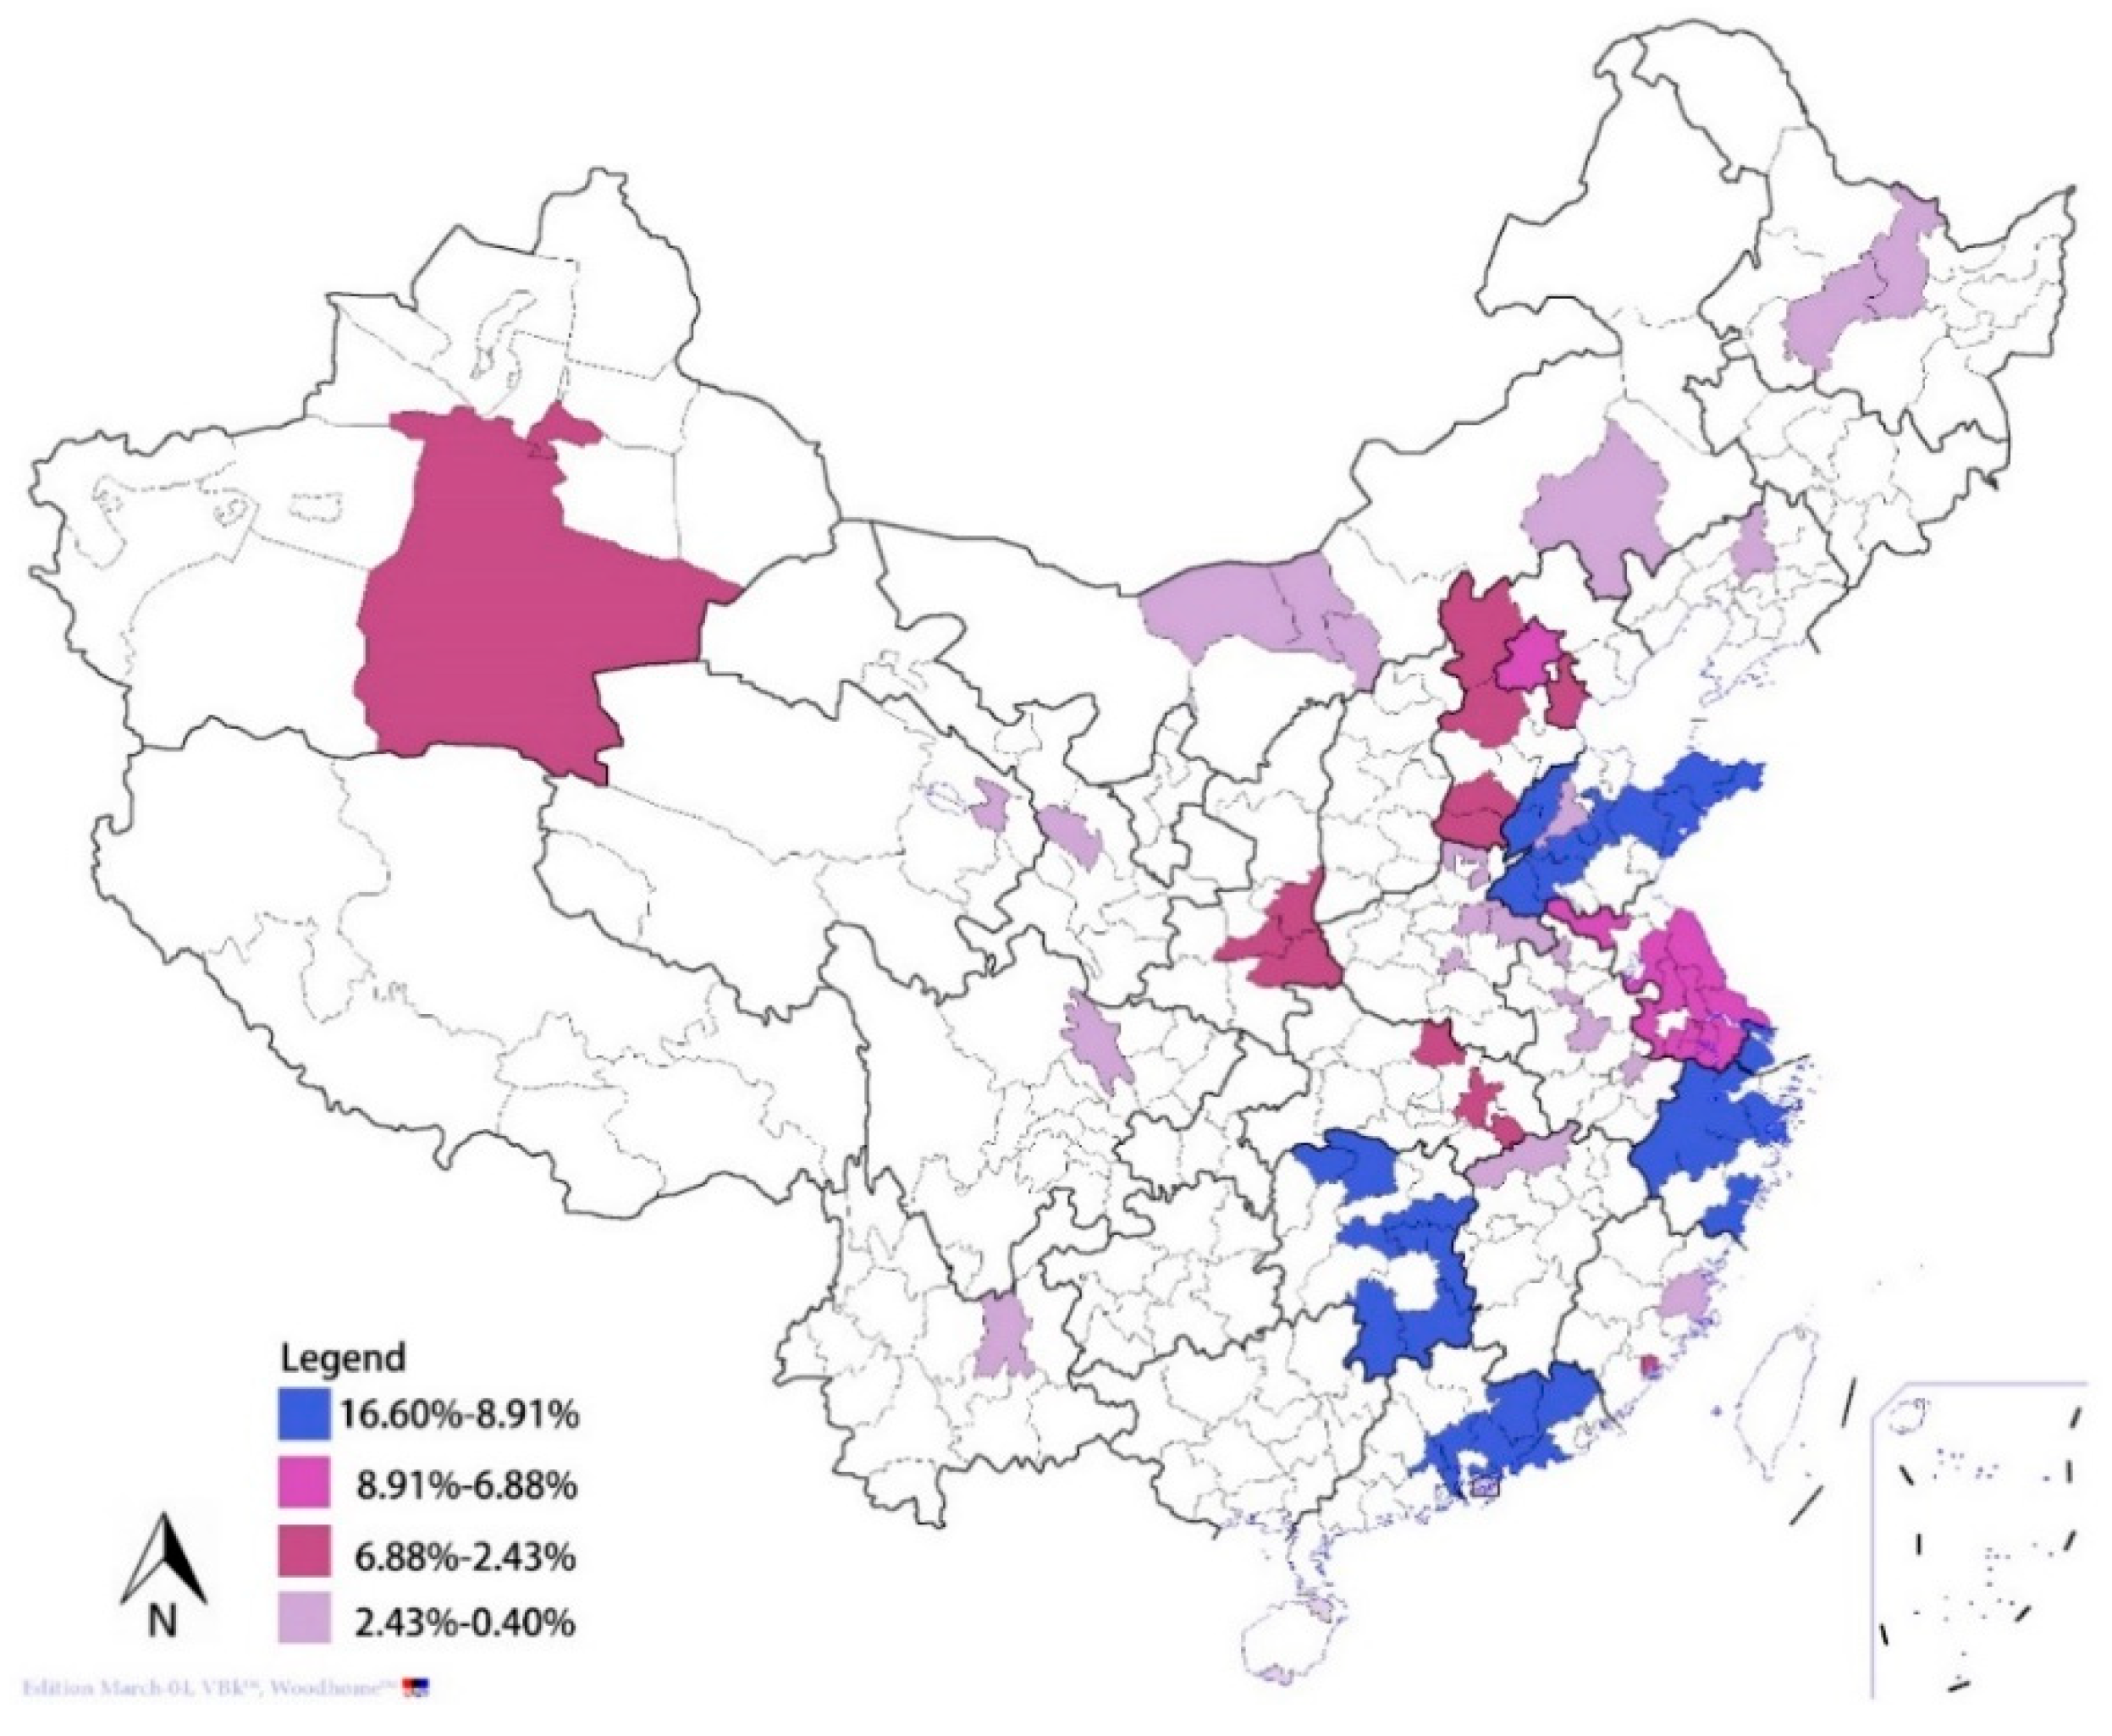
Figure 1 shows the geographic distribution of urban photovoltaic applications by Chinese ZIP code. Urban photovoltaic applications are defined as being in urban development land and divided by ZIP code. Of the total land area in China, approximately 13% of all ZIP codes have photovoltaic applications in urban development land. One black dot represents that there are photovoltaic applications within the ZIP code. The different colors represent the 9 geographical areas of China.
We found that the spatial distribution of urban photovoltaic applications had obvious spatial heterogeneity and regional differences and installations were mainly concentrated in East China and North China, especially for the ZIP codes near the coastline. Along the southeast coast there were urban photovoltaic installations in almost every ZIP code. However, smaller clusters were observed in the northwest, southwest and northeast areas of China. As a whole, the spatial distribution gradually increased from north to south. The percentage of photovoltaic projects in the southern coastal areas is higher and gradually decreases inland to the northwest region. When observing other statistics, photovoltaic projects were mainly concentrated in the following ZIP codes: Hangzhou, Shanghai, Beijing, Shenzhen, Qingdao, Tianjin, Changsha and Guangzhou, which accounted for 50% of the total. Therefore, urban photovoltaic applications show a rising trend every year.
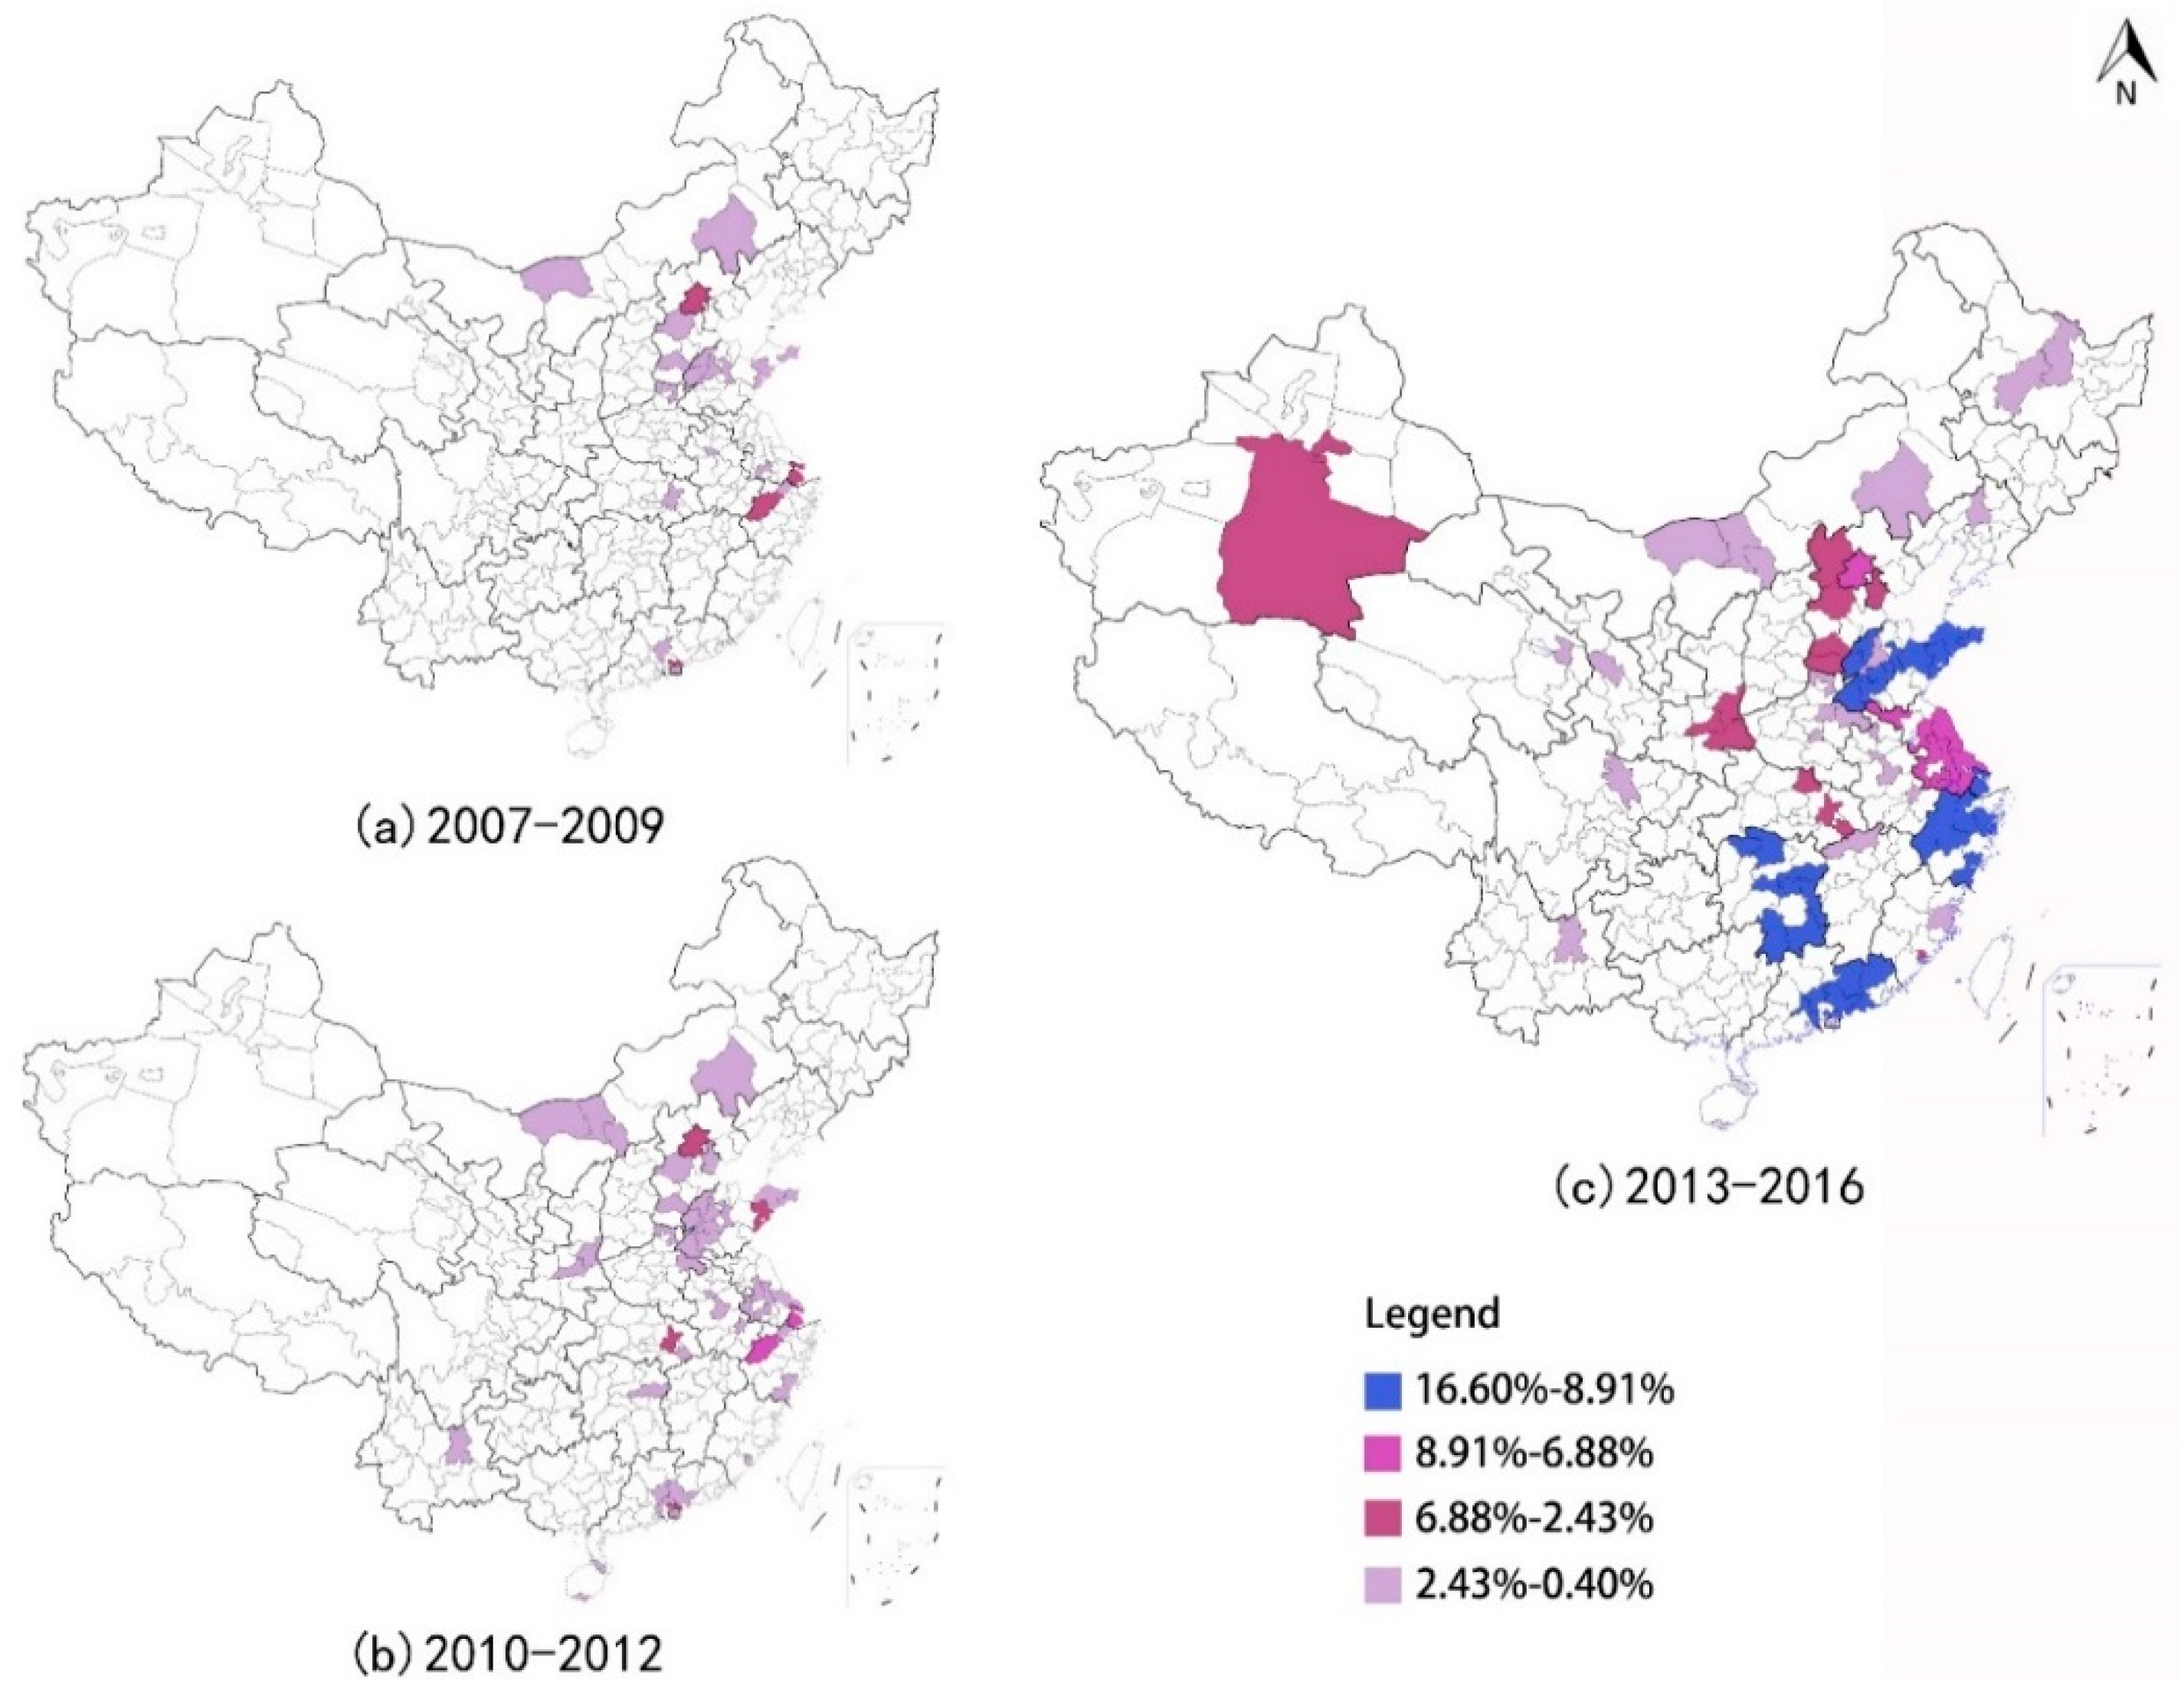
From 1999 to 2016, the spatial distribution of urban photovoltaic applications showed characteristics of dynamic change (see Figure 2). Before 2006, urban photovoltaic applications were in the initial stages of development and Beijing, Dezhou, Shenzhen and Hong Kong had a good foundation for development. From 2007 to 2009, there was a significant increase in the number of photovoltaic projects in the urban agglomerations of the Yangtze River Delta and Beijing-Tianjin-Hebei, which is represented by Beijing and Hangzhou. From 2010 to 2012, the photovoltaic applications of the southeast coastline were mainly distributed in Shandong Province, Jiangsu Province and Zhejiang Province and showed a trend of gradually advancing inland. During the same period, economic development accelerated the development of photovoltaic applications in the Pearl River Delta urban agglomeration. From 2013–2016, the gap between Beijing, Hangzhou and Shanghai and other cities increased and more obvious because of these provinces had a better foundation for development. In addition, Beijing, Shanghai, Hangzhou and Shenzhen were the core provinces across China, around which a radiative spatial distribution was seen.
In summary, the current state of photovoltaic applications is very different and the uneven phenomenon of spatial distribution is obvious. Zhejiang Province had the most urban photovoltaic installations in China but this result was not unexpected, as Zhejiang seemed to have ideal environmental, economic and social characteristics for the installation of photovoltaics. It is necessary to evaluate the influence of independent variables on the number of photovoltaic applications in these ZIP codes in order to define the influence of local environmental, economic and social variables on the spatial distribution of photovoltaic installations across China’s urban areas.
3.1. Correlation Analysis
Correlation analysis, PCA and cluster analysis were used to evaluate the influence of independent variables on the number of urban photovoltaic installations. Table 1 indicates the results of correlation analysis between the dependent variable and independent variables. It was found that, among the 16 independent variables, 11 variables had a statistically significant correlation with the dependent variables (p < 0.01) and 2 variables had a weak correlation (p < 0.05), while 3 variables had no correlation. The results of the correlation analysis indicated that among the most important variables influencing a ZIP code’s photovoltaic applications in urban development land were policy incentives, number of photovoltaic companies, education profile and GDP of a ZIP code. In the environmental variables, the amount of solar radiation and sunshine hours in a particular area negatively correlated with photovoltaic applications, which is unexpected. In the economic variables, policy incentives lead to higher rates of installation in urban development land and the number of photovoltaic companies positively associated with urban photovoltaic installations. Similarly, GDP and electricity consumption were statistically significant and positively associated with urban photovoltaic applications. Income had a lower correlation, surprisingly and feed-in tariffs had no relationship with the number of photovoltaic installations. Each social variable was statistically significant. Of the four education groups, only three groups, college, high school and middle school showed statistically significant results (p < 0.01). The results indicate that ZIP codes with a greater population of individuals aged 15–64 and with better educated populations (college) have more photovoltaic installations. Furthermore, ZIP codes with a higher rate of urbanization tend to have more installations.
3.2. Principal Component Analysis
In factor analysis, we selected the PCA to extract the main factors from 11 explanatory variables with a strong correlation. In addition, the maximum variance method was used to rotate the main factors. Two factors were extracted, the KMO (Kaiser-Meyer-Olkin) and Bartlett test values of these main factors were 0.890 and the cumulative variance was 85.313%. As shown in Table 2, electricity consumption, population, age and education had larger load values in Factor 1 (F1), while GDP, policy incentives, number of photovoltaic companies and rate of urbanization had larger load values in Factor 2 (F2). Therefore, F1 is defined as social acceptance and electricity demand and F2 is defined as the level of urban and market development. After factor analysis, it was found that social acceptance and power demand, as well as city and market development levels, were the determinant factors that affect urban photovoltaic installations.
3.3. Cluster Analysis
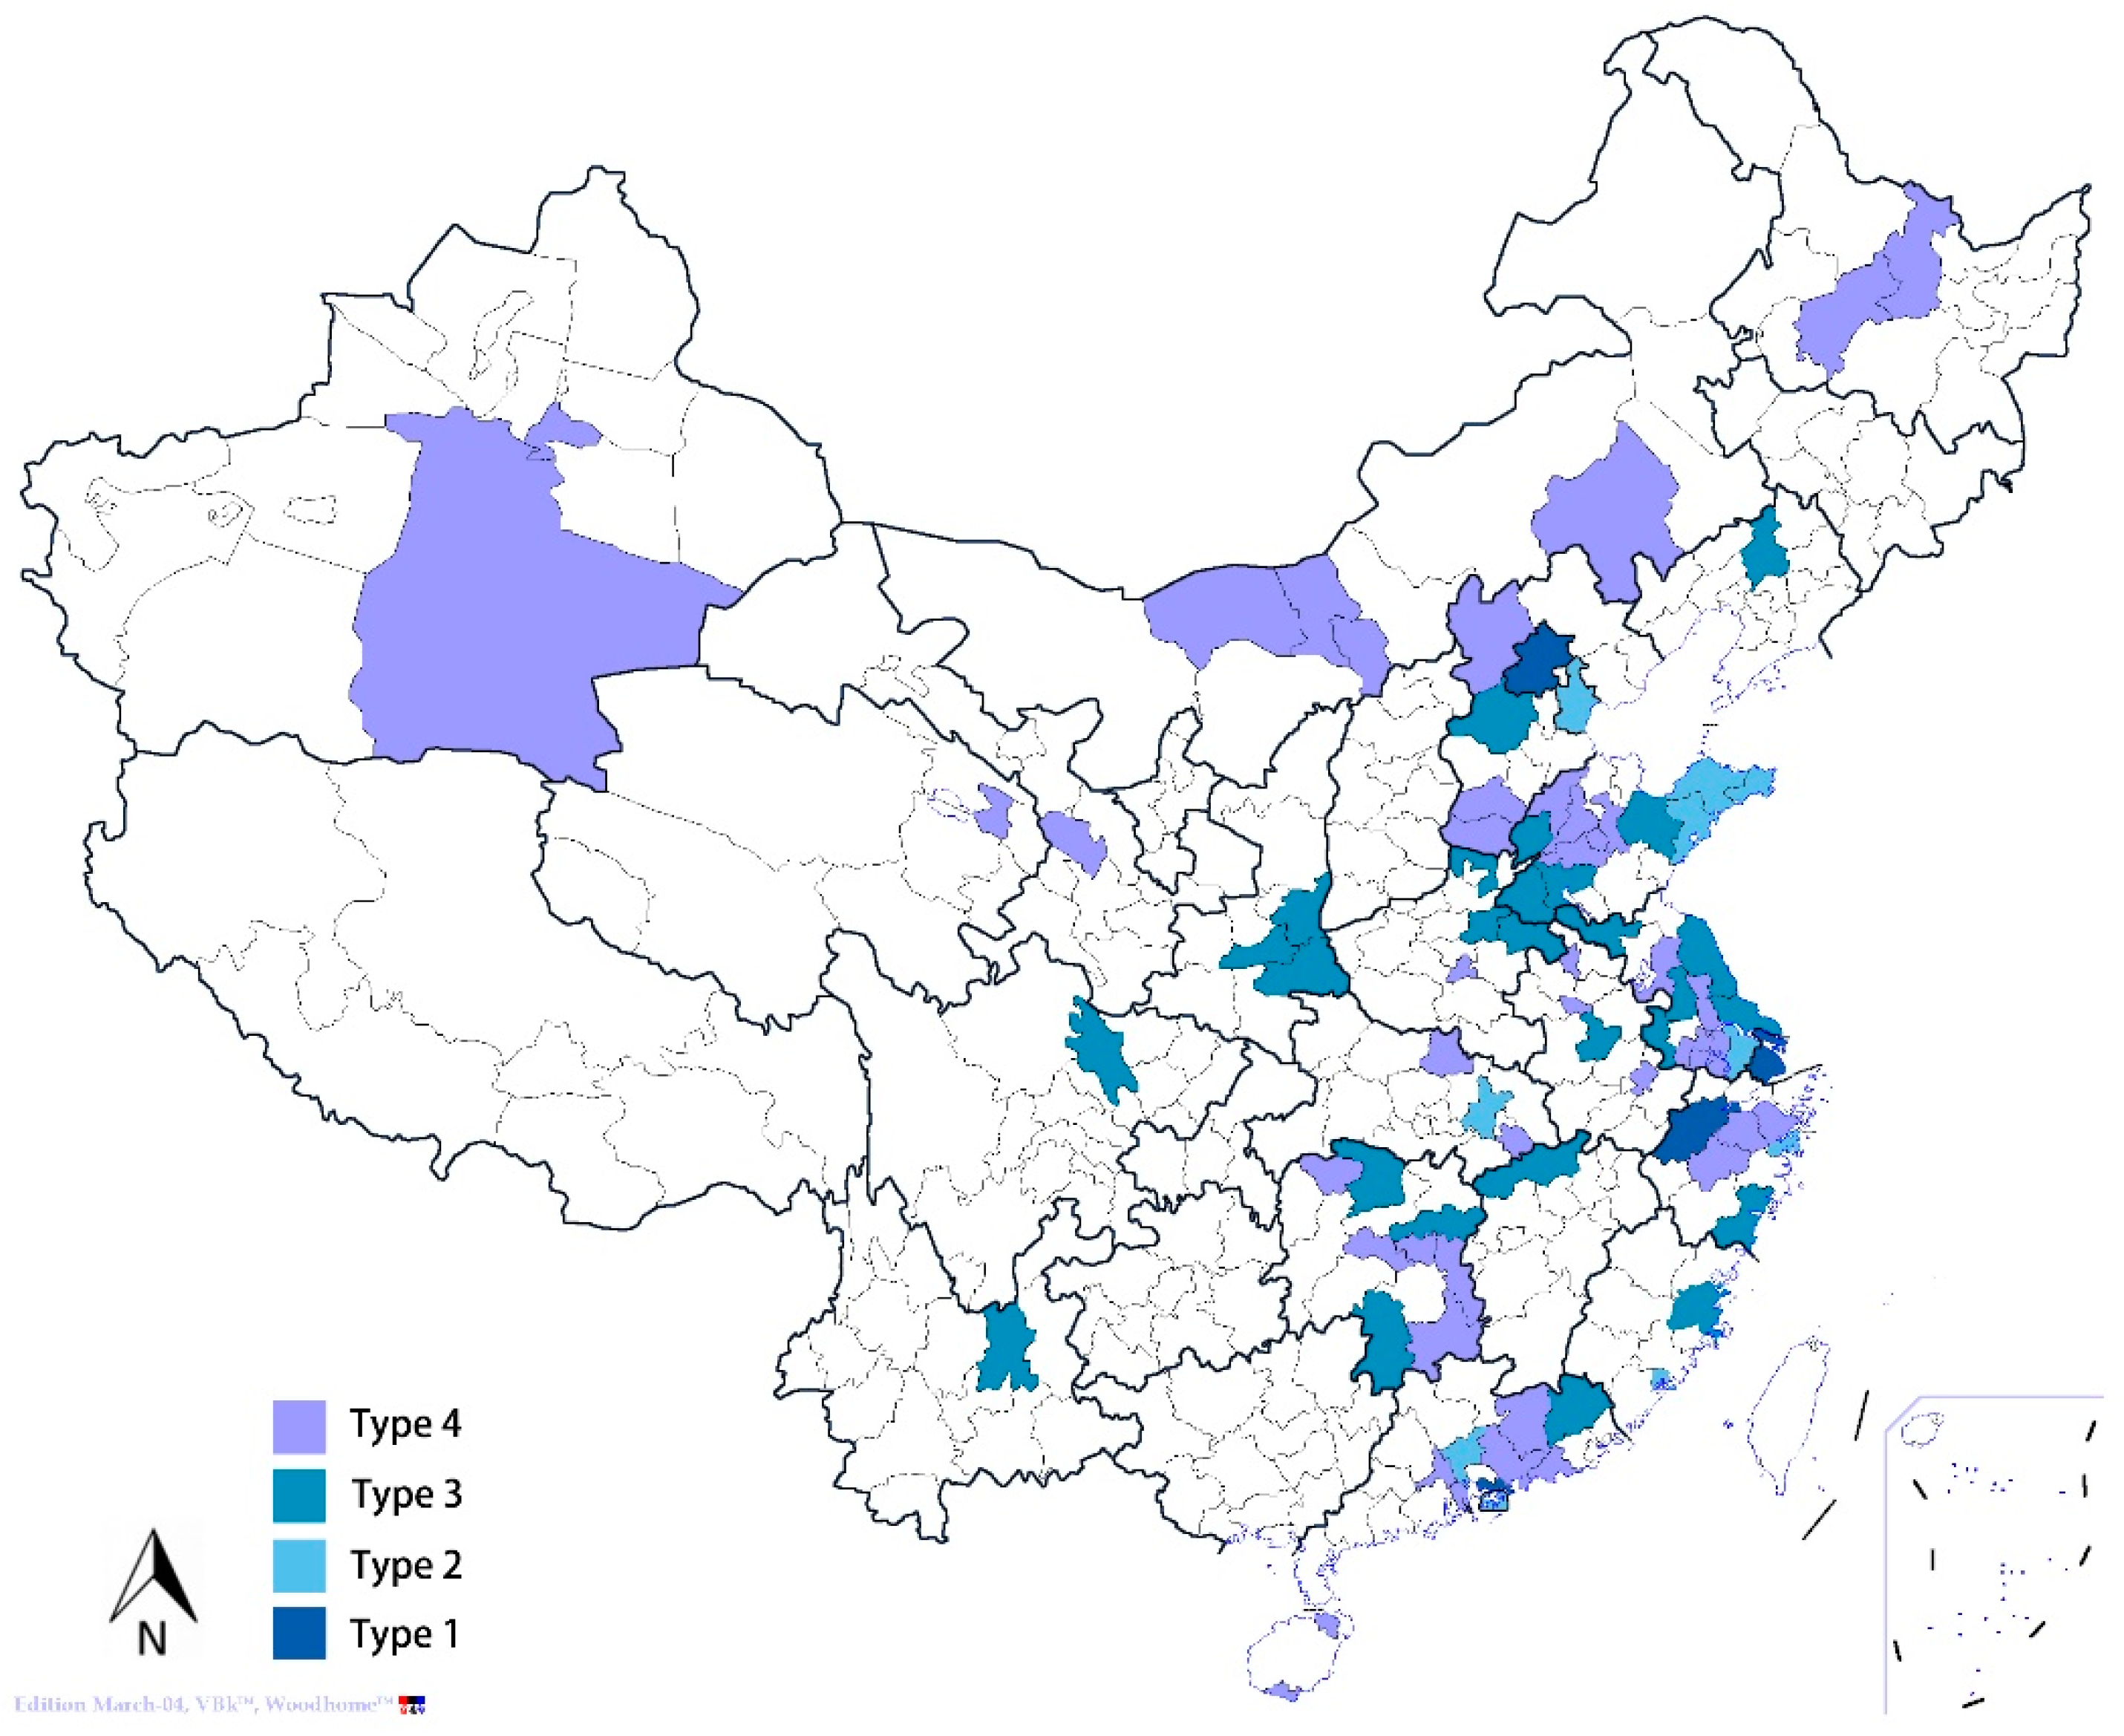
We calculated the contribution scores of 2 main factors for each ZIP code and the Z score method was used to standardize the factor scores of each administrative area. Q-type cluster analysis was used to classify the administrative areas and predict installation trends in future development. The results of the cluster analysis can be seen in Table 3, Figure 3 and Figure 4.
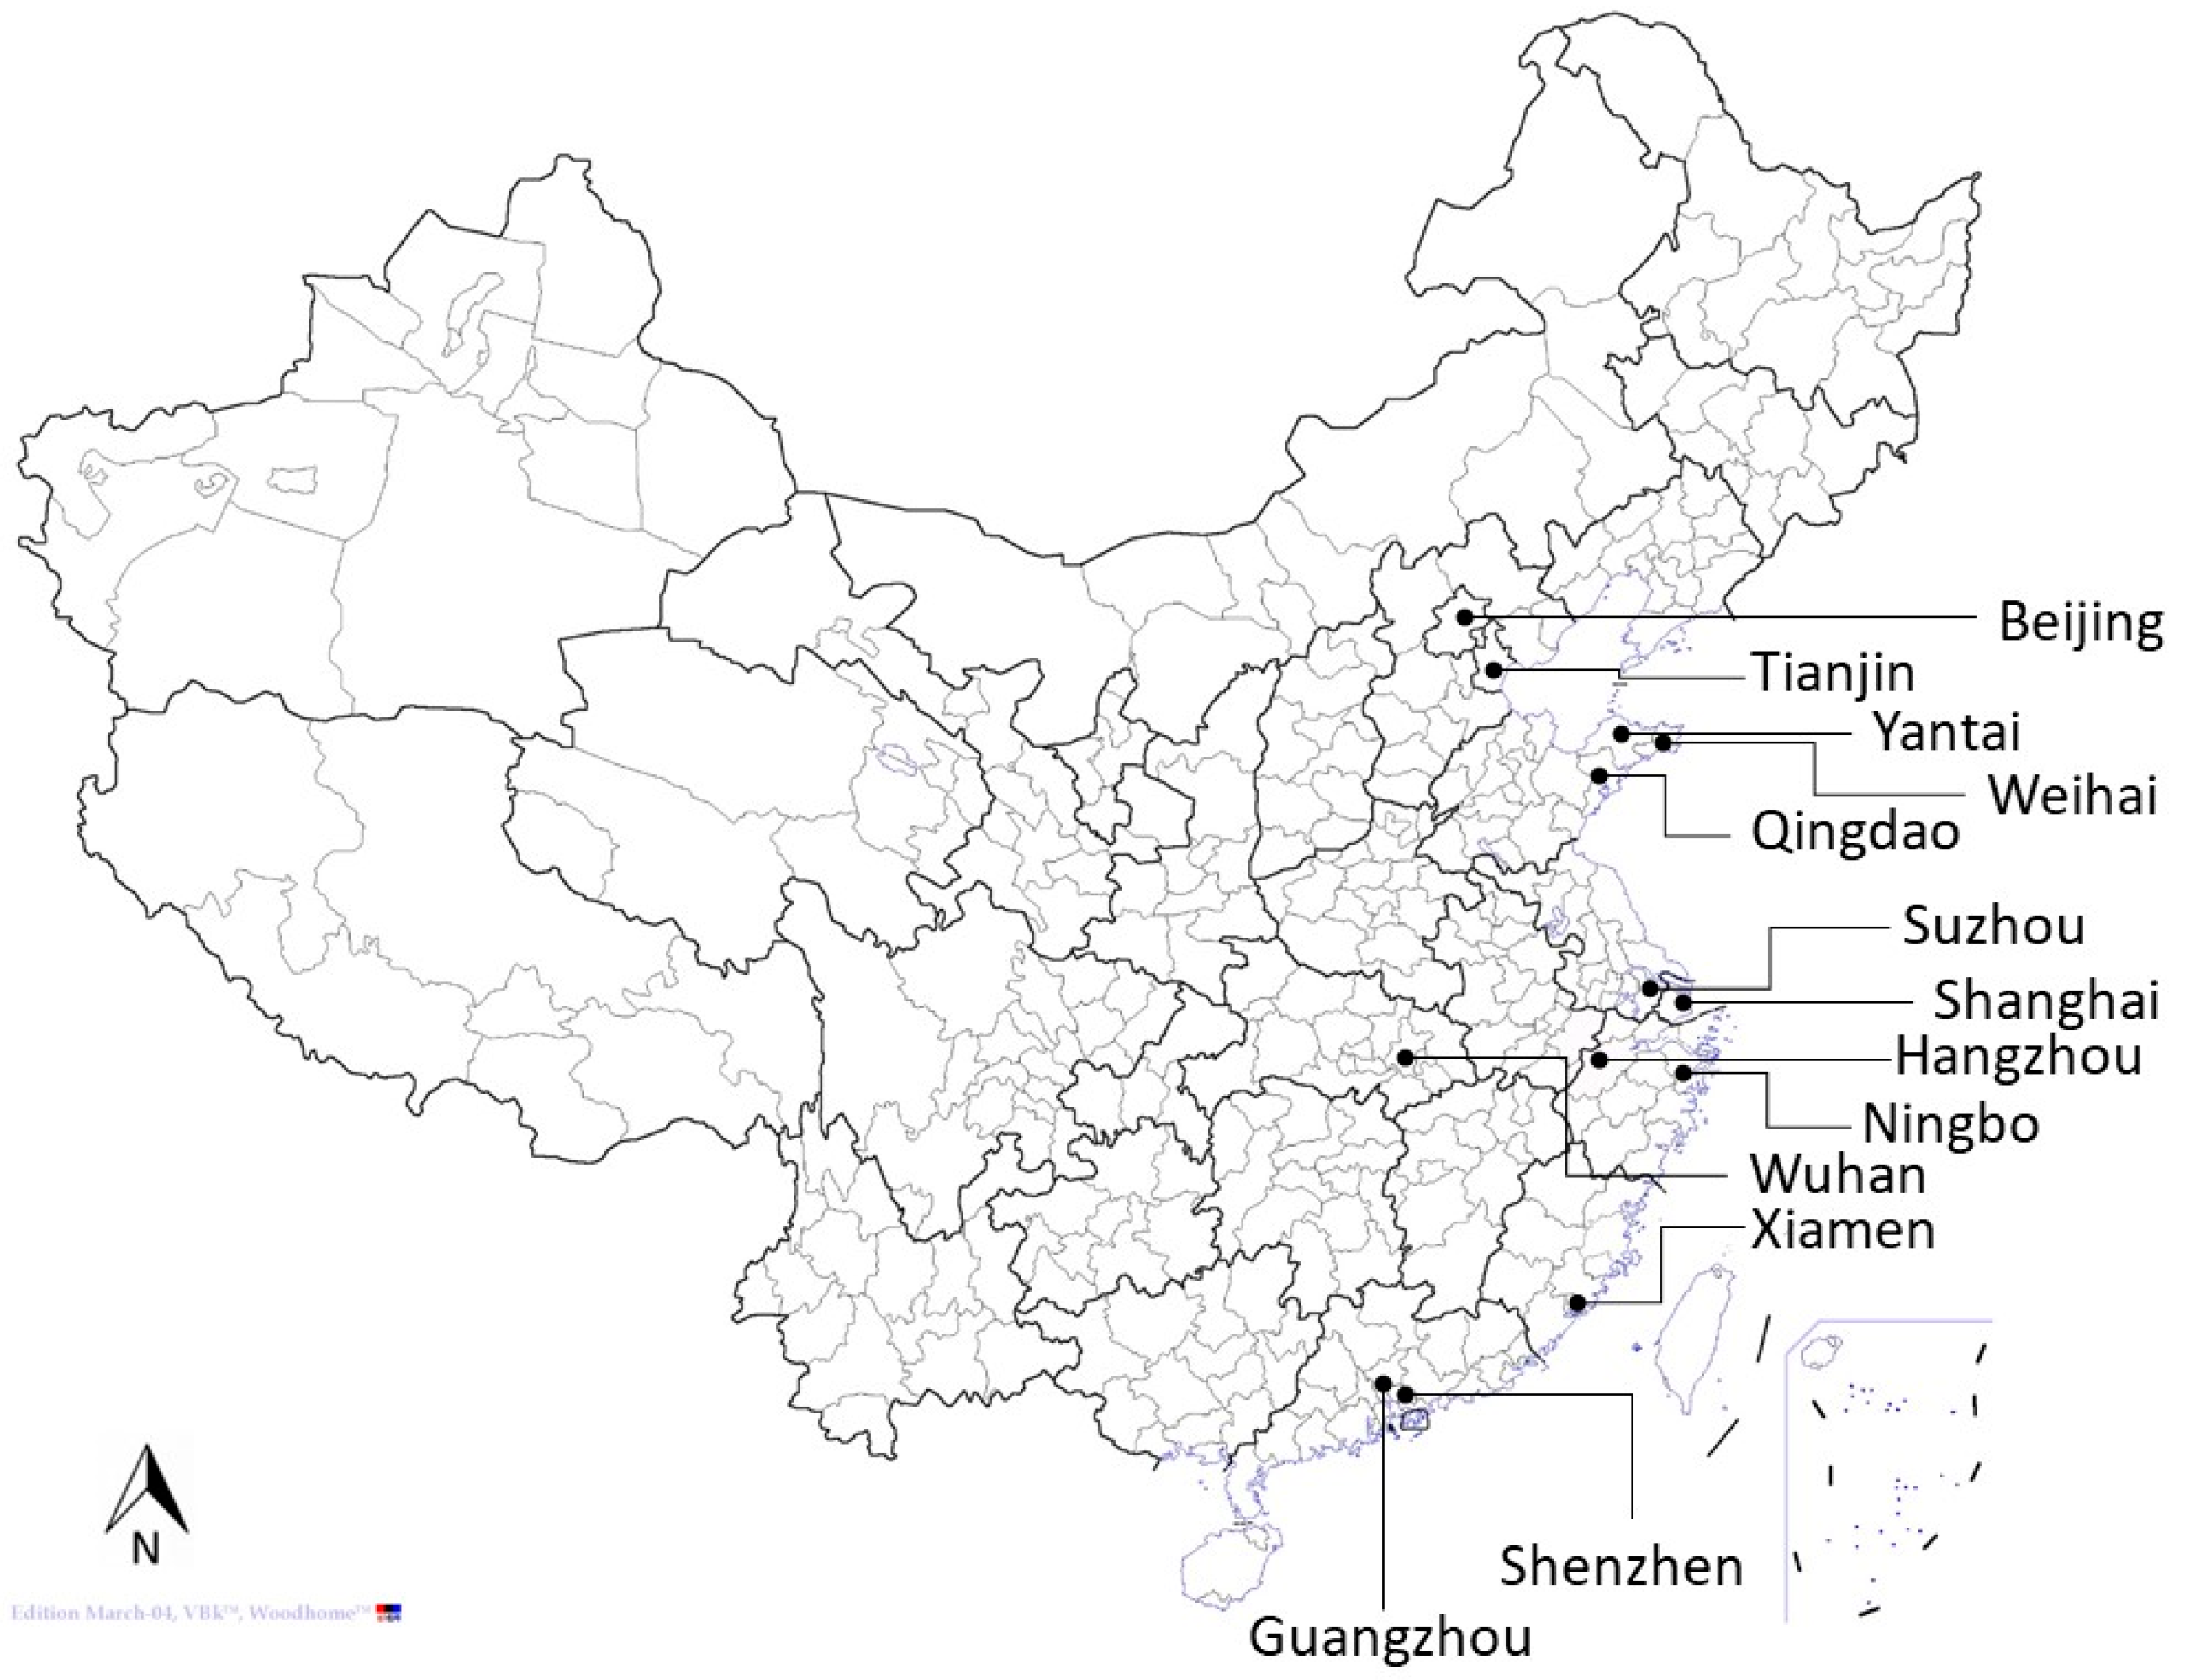
The predicted distribution of urban photovoltaic applications is similar to the current situation we observed. Most of the predicted ZIP codes with photovoltaic installations are in southeast China and Beijing. In fact, Hangzhou is predicted to have the most installations. These four cities are supported by national policy and the market environment, as well as by economic conditions. In addition, against the backdrop of national events, such as the Shanghai World Expo and the Beijing Olympic Games, photovoltaic applications in this region are in the public eye and set up an advertising effect; the development of photovoltaic applications in this area tends to be seen as virtuous. As the administrative center of the country and a major metropolis, Type 1 will have more development opportunities and greater potential.
In Type 2, ZIP codes with photovoltaic installations enjoy financial subsidies that are similar to those experienced in Type 1 but the energy consumption of Type 2 is lower than Type 1. Therefore, the social demand for photovoltaic power generation is lower than Type 1. In the future, the government should pay more attention to these ZIP codes in order to balance development. It will take some time for these areas to form photovoltaic projects with influential effects.
Type 3 belongs to the inland area, which had lower installation, where the social acceptance of and demand for photovoltaic applications are lower and where the level of urban economy and market development is less than that of Type 1 and 2. As a result, the number of photovoltaic applications is small and the economic benefit is limited. From a long-term point of view, the development of photovoltaic applications can promote economic development, so it is necessary to improve the social acceptance of photovoltaic applications in these cities.
In Type 4, policies are quite weak, energy consumption is relatively low and there is no contradiction between supply and demand, so photovoltaic applications are bound to a certain extent, even though solar energy resources are rich. Solar city design among Type 4 has just started and there is a need to cultivate the consciousness of the energy crisis and more funds are needed to develop the economy as well as photovoltaic applications.
4. Discussion
Distributed photovoltaic applications in China play important roles in improving the electric power structure, advancing economic conditions, reducing polluted air and enhancing traditional energy saving. Photovoltaic applications in urban areas make full use of urban leftover space and alleviate the problem of electricity shortage, which promoting the sustainable development of cities. In addition, the service life of photovoltaic systems is about 15–25 years, most of them in China’s urban areas are not yet for recycling.
Urban photovoltaic applications are mostly on public buildings and industrial buildings in China, rather than residential households. The primary development stage of photovoltaic installations is led by government. As public awareness of the environmental and economic benefits has increased, installations of photovoltaic systems have gradually become popular. Based on the current situation, the statistical analysis of the spatial distribution of urban photovoltaic applications was performed.
The results indicated that the installations were mainly influenced by economic and social factors, rather than by environmental factors. Statistically significant variables (p < 0.05) positively influencing the spatial distribution of solar installations of urban areas, include GDP, electricity consumption, policy incentives, number of photovoltaic companies, population, age, education and rate of urbanization. The proportion of policy incentives, the number of photovoltaic companies and the amount of college-educated people were higher than other variables.
It was unexpected that the amount of solar radiation that a ZIP code received would be one of the less important factors affecting urban photovoltaic installations. Environmental factors are not the main factors that affect the spatial distribution of photovoltaic projects in urban areas and these photovoltaic projects are mostly located in the areas of China that are less rich in solar resources and not in the areas of rich solar resources. The spatial distribution of photovoltaic applications is very low, which is in accordance with the partition of solar radiation resources in China. The large-scale ground photovoltaic applications were mostly far from urban areas and in areas that are rich in solar radiation. While the economic factors were one of the main factors affecting the spatial distribution of urban photovoltaic installations. The higher the city’s economic aggregate is, the more photovoltaic projects there are. Due to the cost of photovoltaic projects needing to be recovered after a number of years, a certain amount of economic input is required. Social factors, particularly education, also provide an explanation for the higher installation of photovoltaic panels. The social acceptance of urban photovoltaic installations was the key factor in urban areas.
The results also extracted two factors as the main influencing factors on the spatial distribution of urban photovoltaic applications. These are the need and acceptance from citizens and the economic environment and development levels of cities. We see that electricity consumption, population, age and education explained F1, while F2 is explained by GDP, policy incentives, number of photovoltaic companies and rate of urbanization. These two main factors show that the installation of photovoltaic systems in urban development land are influenced by internal factors from cities and citizens. The economic background, public acceptance and policies from the government are connected and considering the results of clustering analysis, we can conclude that electricity demand is closely related to public acceptance and public acceptance of photovoltaic installations depends on the composition of age and the level of education of the local citizens. Cities with high economic conditions (such as Shanghai, Beijing, Hangzhou and Shenzhen) have the largest concentration of photovoltaic applications. Therefore, economic strength and market environment have facilitated the development of photovoltaic applications in cities and increases in both electricity demand and social acceptance have led to a sharp increase in the installation of photovoltaic systems.
Policy incentives have been an effective measure to initiate the widespread installation of photovoltaic systems across China’s urban areas. In addition to financial subsidies, some documents issued by the NEA put forward regulations for the application of urban photovoltaics, especially for public buildings. Local state governments also introduced some regulations that encourage citizens to install photovoltaic systems rather than the integration of photovoltaic systems into public buildings. Several methods of installation are promoted, not only on the surfaces of buildings but also in facilities in urban areas. In addition, photovoltaic systems not only generate electricity but also promote the protection of the urban environment.
In the future, we need to continuously improve the scale of photovoltaic applications in Beijing-Tianjin-Hebei, the Yangtze River Delta and the Pearl River Delta urban agglomeration. Inland cities such as Xi’an, Nanjing, and Changsha have great potential for development. Local governments can establish a state-led development model based on national policies supplemented by post-construction indemnificatory subsidy policies. Future photovoltaic policies, especially financial subsidies, continue to play a leading role in photovoltaic installations.
In the context of the rapid development of urbanization, it is worth paying attention to the development and utilization of renewable energy and the construction of renewable energy cities, while emphasizing upgrading industrial structures and optimizing energy structures at the same time. On the one hand, we should pay attention to the level of economic development, the market environment of the city itself and social acceptance of and demand for photovoltaic applications. We should also integrate solar energy planning into regional planning and urban master planning and strengthen the government supervision of photovoltaic applications in urban development land.
5. Conclusions
This study provides a reference for future policy-making and financial subsidies, with significant implications for solar city planning in China. By analyzing the influence of local environmental, economic and social variables on the spatial distribution of photovoltaic applications across China’s urban areas, we reached the following conclusions.
The spatial distribution of photovoltaic applications in urban development land in China shows obvious spatial heterogeneity and regional differences. Photovoltaic projects are mainly concentrated in East China and North China, which is gradually increasing from north to south. The proportion of photovoltaic projects in coastal areas is higher but decreases in the northwest region. Before 2006, development was slow but China entered a period of rapid development beginning in 2007. The spatial distribution of urban photovoltaic applications is mainly influenced by economic and social factors, rather than environmental factors. Among them are the need for photovoltaic applications, the acceptance of citizens, the economic environment and the developmental levels of cities.
It is necessary for policy makers to adjust and control photovoltaic applications in various cities according to social and economic factors to ensure that the development of urban photovoltaic applications occurs in a balanced way. Not only to maintain its development momentum for the regions with great potential but also to implement more policies and produce linkage effects to the less developed areas. Finally, more time is needed to focus on the sustainable development of urban photovoltaic applications in China.
There are limitations to this study concerning the environmental, social and economic factors of the spatial distribution of urban photovoltaic applications, namely, the research on the influencing factors of spatial distribution is not thorough enough. In future research, we must establish a more refined evaluation index system to promote the spatial distribution of photovoltaic utilization in Chinese cities and to explore the feasible space optimization measures of solar energy city construction in China.
Author Contributions
The paper was a collaborative effort among the authors. M.L. provided the research direction; A.L. was involved in processing phase and data collection; A.L. and M.L. designed and performed the experiments; A.L. and P.S. analyzed the data. Both authors have concluded the scientific findings.
Funding
This study was funded by National Natural Science Foundation of China (No. 51438005), Key Science and Technology Program of Heilongjiang Province (No. GZ15A508) and Scientific Research Project of the Ministry of Housing and Urban-Rural Development (No. 2016-K1-011).
Conflicts of Interest
The authors declare no conflict of interest.
References
- Liu, Z.; Wu, D.; Yu, H.; Ma, W.; Gin, G. Field measurement and numerical simulation of combined solar heating operation modes for domestic buildings based on the Qinghai-Tibetan plateau case. Energ. Build. 2018, 167, 312–321. [Google Scholar] [CrossRef]
- Pintér, G.; Baranyai, N.H.; Wiliams, A.; Zsiborács, H. Study of photovoltaics and LED energy efficiency: case study in Hungary. Energies 2018, 11, 790. [Google Scholar] [CrossRef]
- Zsiborács, H.; Bai, A.; Popp, J.; Gabnai, Z.; Pályi, B.; Farkas, I.; Baranyai, N.H.; Veszelka, M.; Zentkó, L.; Pintér, G. Change of real and simulated energy production of certain photovoltaic technologies in relation to orientation, tilt angle and dual-axis sun-tracking. a case study in Hungary. Sustainability 2018, 10, 1394. [Google Scholar] [CrossRef]
- Liu, Z.; Li, H.; Liu, K.; Yu, H.; Cheng, K. Design of high-performance water-in-glass evacuated tube solar water heaters by a high-throughput screening based on machine learning: A combined modeling and experimental study. Sol. Energy 2017, 142, 61–67. [Google Scholar] [CrossRef]
- National Energy Administration. 53.06 GW of Photovoltaic Power Installed in 2017, Top the List of Renewable Energy Sources. Available online: http://www.nea.gov.cn/2018-01/24/c_136920159.htm (accessed on 24 July 2018).
- Zsiborács, H.; Baranyai, N.H.; Vincze, A.; Pintér, G. Economic and technical aspects of flexible storage photovoltaic systems in Europe. Energies 2018, 11, 1445. [Google Scholar] [CrossRef]
- Some Suggestions on Promoting the Healthy Development of Photovoltaic Industry. Available online: http://www.gov.cn/zhengce/content/2013-07/15/content_2632.htm (accessed on 26 June 2013).
- Lu, M.; Lin, A.L.; Sun, J.Y. The impact of photovoltaic applications on urban landscapes based on visual Q methodology. Sustainability 2018, 10, 1051. [Google Scholar] [CrossRef]
- Ko, Y. Urban form and residential energy use: A review of design principles and research findings. J. Plan. Lit. 2013, 28, 327–351. [Google Scholar] [CrossRef]
- Liu, F.F.; Zhan, C.H.; Kang, J.; Wu, Y. Integrated design of the solar roofs in cold regions based on a questionnaire survey on problems in current devices. J. Harbin Inst. Technol. 2016, 48, 163–166. [Google Scholar] [CrossRef]
- Zsiborács, H.; Pályi, B.; Pintér, G.; Popp, J.; Balogh, P.; Gabnai, Z.; Peto, K.; Farkas, I.; Baranyai, N.H.; Bai, A. Technical-economic study of cooled crystalline solar modules. Sol. Energy 2016, 140, 227–235. [Google Scholar] [CrossRef]
- Amado, M.; Poggi, F. Towards solar urban planning: A new step for better energy performance. Energy Procedia 2012, 30, 1261–1273. [Google Scholar] [CrossRef]
- Snape, J. Spatial and temporal characteristics of PV adoption in the UK and their implications for the smart grid. Energies 2016, 9, 210. [Google Scholar] [CrossRef] [Green Version]
- He, L.; Li, C.L.; Nie, Q.Y.; Men, Y.; Shao, H.; Zhu, J. Core abilities evaluation index system exploration and empirical study on distributed PV-generation projects. Energies 2017, 10, 2083. [Google Scholar] [CrossRef]
- Cucchiella, F.; D’Adamo, I.; Gastaldi, M. Economic analysis of a photovoltaic system: A resource for residential households. Energies 2017, 10, 814. [Google Scholar] [CrossRef]
- Cucchiella, F.; D’Adamo, I.; Koh, L.S.C. Environmental and economic analysis of building integrated photovoltaic systems in Italian regions. J. Clean. Prod. 2015, 98, 241–252. [Google Scholar] [CrossRef]
- Wang, H.; Zheng, S.; Zhang, Y.; Zhang, K. Analysis of the policy effects of downstream feed-in tariff on china’s solar photovoltaic industry. Energy Policy 2016, 95, 479–488. [Google Scholar] [CrossRef]
- Ma, W.W.; Rasul, M.G.; Liu, G.; Li, M.; Tan, X.H. Climate change impacts on techno-economic performance of roof pv solar system in Australia. Renew. Energy 2016, 88, 430–438. [Google Scholar] [CrossRef]
- Rai, V.; Reeves, D.C.; Margolis, R. Overcoming barriers and uncertainties in the adoption of residential solar PV. Renew. Energy 2016, 89, 498–505. [Google Scholar] [CrossRef]
- Li, G.; Xuan, Q.; Pei, G.; Su, Y.; Ji, J. Effect of non-uniform illumination and temperature distribution on concentrating solar cell—A review. Energy 2018, 144, 1119–1136. [Google Scholar] [CrossRef]
- Liu, X.; Zhou, Y.; Chen, X. Mining outlier data in mobile internet-based large real-time databases. Complexity 2018, 4, 1–12. [Google Scholar] [CrossRef]
- China Meteorological Administration. China Meteorological Data Service Center (CMDC). Available online: http://data.cma.cn/site/index.html (accessed on 15 March 2017).
- Li, G.; Xuan, Q.; Lu, Y.; Pei, G.; Su, Y.; Ji, J. Numerical and lab experiment study of a novel concentrating PV with uniform flux distribution. Sol. Energy Mater. Sol. C 2018, 179, 1–9. [Google Scholar] [CrossRef]
- IEA PVPS Task 7: Potential for Building Integrated Photovoltaics. Available online: http://task07.iea-shc.org/ (accessed on 27 June 2018).
- Compagnon, R. Solar and daylight availability in the urban fabric. Energy Build. 2004, 36, 321–328. [Google Scholar] [CrossRef]
- Kanters, J.; Wall, M. The impact of urban design decisions on net zero energy solar buildings in Sweden. Urban Plan. Transp. Res. 2014, 2, 312–332. [Google Scholar] [CrossRef]
- Technical Code for Solar PV System of Civil Buildings (JGJ203-2010). Available online: https://wenku.baidu.com/view/5ca34565f5335a8102d2208a.html (accessed on 20 March 2018).
- The Technology Code in Integration of Building and Photovoltaic (DGJ32/J87-2009). Available online: https://wenku.baidu.com/view/9abcb768011ca300a6c3908a.html (accessed on 20 March 2018).
- Technical Specification for Solar Energy Application in Civil Building (Fascicule: Photovoltaic System DG/TJ08-2004B-2008). Available online: http://jz.docin.com/p-46416225.html (accessed on 21 March 2018).
- National Statistical Yearbook 2017. Available online: http://www.stats.gov.cn/tjsj/ndsj/2017/indexch.htm (accessed on 8 January 2018).
- Vote Solar. Solar for All: Making It Happen in Low-Income Communities, Presentation. Available online: digital.library.unt.edu/ark:/67531/metadc949316/ (accessed on 25 March 2018).
- Noll, D.; Dawes, C.; Rai, V. Solar community organizations and active peer effects in the adoption of residential PV. Energy Policy 2014, 67, 330–343. [Google Scholar] [CrossRef]
- Labay, D.G.; Kinnear, T.C. Exploring the consumer decision process in the adoption of solar energy systems. J. Consum. Res. 1981, 8, 271–278. [Google Scholar] [CrossRef]
- Graziano, M.; Gillingham, K. Spatial patterns of solar photovoltaic system adoption: the influence of neighbors and the built environment. J. Econ. Geogr. 2014, 15, 815–839. [Google Scholar] [CrossRef] [Green Version]
- Chaianong, A.; Pharino, C. Outlook and challenges for promoting solar photovoltaic rooftops in Thailand. Renew. Sustain. Energy Rev. 2015, 48, 356–372. [Google Scholar] [CrossRef]
Figure 1.
The spatial distribution of photovoltaic applications across China’s urban areas.

Figure 2.
The dynamic change of photovoltaic applications across China’s urban areas.

Figure 3.
The cluster analysis of different ZIP codes.

Figure 4.
The locations of ZIP codes in Type 1 and 2.


Table 1.
The results of the correlation analysis at the ZIP code level.
| Independent Variables | Explanation Variables | Correlation Coefficient |
|---|---|---|
| Environmental variables | Annual total solar radiation | −103 |
| Annual sunshine hours | −0.200 | |
| Economic variables | GDP | 0.463 ** |
| Per capita disposable income | 0.281 * | |
| Electricity consumption | 0.303 ** | |
| Feed-in tariffs | −0.046 | |
| Policy incentives | 0.911 ** | |
| Number of photovoltaic companies | 0.722 ** | |
| Social variables | Population | 0.381 ** |
| Age 15–64 | 0.366 ** | |
| Age 65+ | 0.318 ** | |
| Education: college | 0.478 ** | |
| Education: high school | 0.422 ** | |
| Education: middle school | 0.292 ** | |
| Education: primary school | 0.219 * | |
| Rate of urbanization | 0.380 ** |
* Significant at 5%; ** Significant at 1%.
Table 2.
The results of PCA (principle component analysis).
| Explanatory Variables | F1 | F2 |
|---|---|---|
| GDP | 0.654 | 0.713 |
| Electricity consumption | 0.636 | 0.598 |
| Policy incentives | 0.327 | 0.783 |
| Number of PV companies | 0.406 | 0.802 |
| Population | 0.908 | 0.380 |
| Age 15–64 | 0.916 | 0.383 |
| Age 65+ | 0.906 | 0.215 |
| Education: college | 0.744 | 0.469 |
| Education: high school | 0.846 | 0.501 |
| Education: middle school | 0.928 | 0.242 |
| Rate of urbanization | 0.155 | 0.807 |
| Eigenvalue | 5.824 | 3.560 |
| Variance % | 52.947 | 32.366 |
| Cumulative variance % | 52.947 | 85.313 |
Table 3.
The cluster analysis results of urban photovoltaic applications at the ZIP code level.
| Types | The Name of Each ZIP Code |
|---|---|
| 1 | Shanghai, Beijing, Hangzhou, Shenzhen |
| 2 | Suzhou, Wuhan, Guangzhou, Tianjin, Qingdao, Ningbo, Yantai, Xiamen, Weihai |
| 3 | Weifang, Xuzhou, Yangzhou, Jining, Shangqiu, Heze, Jiujiang, Meizhou, Mianyang, Kaifeng, Anyang, Yongzhou, Weinan, Liaocheng, Changde, Kunming, Nanjing, Shenyang, Xian, Fuzhou, Wenzhou, Nantong, Changsha, Baoding, Hefei |
| 4 | Xingtai, Handan, Dongguan, Foshan, Wuxi, Sanya, Zhaodong, Hohhot, Wuhu, Huangshi, Yichun, Xining, Jiangyin, Huainan, Huaibei, Zhangjiajie, Linan, Laiwu, Kuerle, Baotou, Cixi, Yiwu, Zhuhai, Jinan, Zhuzhou, Shaoxing, Zibo, Taizhou, Huaian, Changzhou, Taian, Dezhou, Chenzhou, Lanzhou, Zhangjiakou, Chifeng, Loudi, Luohe, Shangluo, Heyuan, Xiangtan, Urumqi, Bayannaoer, Suizhou, Haikou |
© 2018 by the authors. Licensee MDPI, Basel, Switzerland. This article is an open access article distributed under the terms and conditions of the Creative Commons Attribution (CC BY) license (http://creativecommons.org/licenses/by/4.0/).
Share and Cite
MDPI and ACS Style
Lin, A.; Lu, M.; Sun, P. The Influence of Local Environmental, Economic and Social Variables on the Spatial Distribution of Photovoltaic Applications across China’s Urban Areas. Energies 2018, 11, 1986. https://doi.org/10.3390/en11081986
AMA Style
Lin A, Lu M, Sun P. The Influence of Local Environmental, Economic and Social Variables on the Spatial Distribution of Photovoltaic Applications across China’s Urban Areas. Energies. 2018; 11(8):1986. https://doi.org/10.3390/en11081986
Chicago/Turabian StyleLin, Alin, Ming Lu, and Pingjun Sun. 2018. "The Influence of Local Environmental, Economic and Social Variables on the Spatial Distribution of Photovoltaic Applications across China’s Urban Areas" Energies 11, no. 8: 1986. https://doi.org/10.3390/en11081986
Note that from the first issue of 2016, this journal uses article numbers instead of page numbers. See further details here.