The Public Willingness to Pay for Reducing the Incidence of Hazardous Chemical Spill Accidents by Half in South Korea


Department of Energy Policy, Graduate School of Energy & Environment, Seoul National University of Science & Technology, 232 Gongreung-Ro, Nowon-Gu, Seoul 01811, Korea
*
Author to whom correspondence should be addressed.
Sustainability 2018, 10(8), 2673; https://doi.org/10.3390/su10082673
Submission received: 25 May 2018
/
Revised: 20 July 2018
/
Accepted: 25 July 2018
/
Published: 30 July 2018
(This article belongs to the Special Issue Disasters, Crisis, Hazards, Emergencies and Sustainable Development)
Abstract
:Hazardous chemical spill (HCS) accidents, which occur due to careless workers, transport accidents, etc., can be harmful to humans. Recently, an average of 96 cases of HCS accidents have taken place in South Korea annually. As a result, the government is trying to reduce the incidence of HCS accidents by 50%. Government officials are seeking information about the value that the enforcement of the reduction plan will bring for the public. This knowledge will help government officials decide whether to implement the reduction plan. This article seeks to acquire information about the public willingness to pay (WTP) for the reduction plan, employing the contingent valuation (CV) technique. For this purpose, a total of 1000 households living in South Korea participated in the CV survey in 2017. The data on the WTP were gathered using a dichotomous choice question and analyzed using the spike model. Forty-five percent of the respondents were willing to accept an increase in income taxes to carry out the reduction plan. The mean household WTP estimate was obtained as KRW 3830 (USD 3.41) per annum. The national value expanded from the sample to the population is worth KRW 74.8 billion (USD 66.6 million) per year. This value implies the public value of the reduction plan and can be applied in policy analysis and decision-making concerning the reduction of the incidence of HCS accidents.
1. Introduction
Depending on the increase in the production and distribution of chemicals, governments around the world have strived to prevent hazardous chemical spill accidents by strengthening regulations on chemicals. As a representative regulation, the European Union (EU) has a new chemical substance management system called Registration, Evaluation, Authorization, and Restriction of Chemicals (REACH) [1]. The United States of America has the Toxic Substances Control Act (TSCA) and the Pollution Prevention Act. Under the TSCA and the Pollution Prevention Act, the United States Environmental Protection Agency (EPA) evaluates potential risks from new and existing chemicals and finds ways to prevent or reduce pollution before it affects the environment [2]. Japan has the Chemical Substances Control Law (CSCL). The CSCL controls both new and existing substances. For new substances, a strict pre-manufacture evaluation system is implemented [3]. In the case of Korea, there is the Korea REACH and the Chemical Control Act. The Korea REACH is similar to the EU REACH, and the Chemical Control Act controls hazardous substances and response to chemical accidents [4,5].
Recently, accidents related to the chemical industry, which have continuously increased in the near past, have become a serious social problem. In the case of other countries, about 100 tons of fireworks and other explosives detonated after a fire in the S.E. Fireworks factory in 2000 in the eastern Dutch city of Enschede. Twenty-one people were killed and 946 were injured. Insufficient management of the facilities was a major contributor to the accident. In 2013, an ammonium nitrate explosion occurred at the storage and distribution facilities of the West Fertilizer Company in west Texas. Fifteen people were killed, 200 were injured, and more than 150 buildings were damaged or destroyed [6]. As another example of a severe accident, the Clorados III plant producing vinyl chloride was wrecked by a huge explosion in Coatzacoalcos, Mexico in 2016. Thirty-two people were killed and more than 100 were injured [7]. Hazardous chemical spill (HCS) accidents are mostly due to inadequate safety management. According to the statistics on the causes of these accidents [8], operators’ carelessness, insufficient facility management, and transportation vehicle accidents resulted in an average of 96 hazardous chemical accidents over the past four years (from 2013 to 2016). Representative chemical accidents that have taken place in South Korea are as follows. For example, in 2012, leakage of hydrofluoric acid gas occurred at the Hube Global plant in Gumi. Five workers were killed and 18 injured in the accident. As a result, the damage cost caused by the leakage of hydrofluoric acid gas was estimated at KRW 177 billion [9]. In addition, a spill of 39,000 L of sulfuric acid occurred at the Korea Zinc factory in Ulsan in 2016. Two workers were killed and four others were injured in the accident.
Acidic chemicals such as hydrofluoric acid and sulfuric acid may cause skin burns and lung damage in the case of skin contact or inhalation (e.g., [10,11]). In accordance with toxicological information, toluene causes damage to the kidneys and the nervous system as well as having carcinogenic effects (e.g., [12]). As mentioned in the Mexican accident, vinyl chloride is a known cause of angiosarcoma of the liver and an atherogenic risk factor [13,14]. Thus, exposure to these chemicals will not only harm humans but could also have a severe impact on livestock and crops (e.g., [15,16]). In addition, water pollution caused by toxic chemicals affects human health as well as the water environment [17]. For example, agricultural chemicals affect the growth and development of amphibian populations [18].
Reducing the incidence of HCS accidents requires a lot of money and time. Thus an effort is needed to recover from such accidents. Accordingly, in order to reduce the incidence of HCS accidents, the government of South Korea intends to strengthen the chemical regulations and introduce an assessment system for the impact of accidents. Moreover, the government plans to reinforce the safety management and inspection of the workplace and activate a chemical accident response training program [19]. In this way, the South Korean government is considering a plan to reduce the incidence of HCS accidents by 50%. Government officials are seeking information about the value that the reduction plan will bring to the public [20]. The South Korean people, who will pay for the reduction plan through an increase in income tax, want to know how much the public value of the reduction plan is [21]. Since the people would bear the financial burden should the implementation of the reduction plan be continued, it is necessary to ascertain South Korean public support for the reduction plan to conduct it successfully. Thus, the people’s acceptance of the reduction plan should be explored.
For this purpose, this study seeks to acquire information about the household willingness to pay (WTP) for reducing the incidence of HCS accidents by half in South Korea, employing the contingent valuation (CV) technique. This is consistent with many cases in the literature [20,22]. This article comprises five sections. Section 1 provides an introduction. Section 2 presents the literature review. Section 3 describes the methodology and model adopted in this article. Section 4 reports the results. Lastly, some conclusions are made in Section 5.
2. Literature Review
2.1. A Short Review of Some Previous Related Studies
There are many previous studies on the seriousness of chemical accidents and the resultant damage to property and human life (e.g., [23,24]). Moreover, a number of studies are underway to investigate the causes, prevention, management, and analysis of HCS accidents (e.g., [25,26]). In addition, there have been many studies using the CV approach and choice experiment (CE) approach for the evaluation of the public value of lessening the occurrence of chemical or hazardous material accidents and preventing damages by hazardous materials, as explained in Table 1.
2.2. Object to Be Investigated
The possibility of large-scale chemical accidents is rising, as the use of chemical substances increases due to the advancement of industrial development and new chemical substances are continuously introduced. HCS accidents have occurred due to a lack of safety management programs and response systems. For example, most HCS accidents are caused by careless workers, inadequate facility management, and transportation vehicle accidents. The government established a chemical disaster safety management system after the Gumi accident in 2012, and HCS accidents have been counted accurately. The detailed tendency of the number of HCS accidents in South Korea is presented in Table 2.
The anticipated effects of the implementation of the reduction plan are that chemical accidents will be prevented in advance by strengthening on-site response capability and that the safety management of the workplace will be strengthened by enforcing penalties according to the law. Furthermore, it will be possible to reduce accident damage by developing experts through chemical accident response training.
3. Methodology
3.1. Method: CV
This article aims to look into people’s WTP for reducing the incidence of HCS accidents by half in South Korea. This study will employ the CV approach instead of the CE approach, as the first [21] is much simpler to apply than the second, and the attributes required in using the CE approach are not well-defined in this study. The CV approach is a standardized and widely used survey method used to estimate WTP [33]. The distinguished National Oceanic and Atmospheric Administration (NOAA) Panel concluded that the CV approach can produce estimates that are reliable enough to be the starting point for administrative and judicial determinations and presented several recommendations [33]. In addition, the validity and accuracy of a CV study can be enhanced if people are familiar with the good to be valued; thus, professional interviewers are used and other conventions suggested by the NOAA Panel are followed. Our study meets these conditions, as discussed below in detail. The CV technique usually asks randomly selected respondents to state their WTP for conducting the reduction plan. In the microeconomics sense, the WTP represents the public value of the reduction plan.
An application of the CV calls for a survey of citizens to be undertaken. Therefore, well-crafted questionnaires and scientific sampling and survey are a key to determining the success of CV applications. In this regard, some guidelines or recommendations to be followed in applying CV are presented in Arrow et al. [33] and Johnston et al. [34]. This study strove to reflect these guidelines in implementing the CV survey and making the CV survey questionnaire, as explained below.
3.2. Sampling and Survey Questionnaire
We commissioned a professional survey firm to arrange the CV field survey. The firm drew a stratified random sample of 1000 households from the national population to obtain information on the households’ WTP and their socioeconomic characteristics. A stratified random sampling method was commissioned from an expert who was affiliated with a professional survey firm; the sampling reflected the population characteristics observed from a census by Statistics Korea, the Korean National Statistical Office. More specifically, stratified random sampling was conducted. The survey firm performed a stratified random sampling and field CV survey during May 2017. A random sampling was conducted within 16 strata. The sizes of each stratum are shown in Table 3. The sampling within each stratum reflected each stratum’s population characteristics such as age, income, and gender.
The pre-assessment was done using small focus groups (30 interviewees) assembled to discuss their understanding of and reaction to the questionnaire prior to a pilot study. The final version reflected the focus groups’ input as well as advice from experts at the survey firm employed to organize the fieldwork. In addition, the pretest was conducted to obtain the distribution of the WTP values. They were asked to report their mean WTP for reduction plan. The authors sorted the reported positive values in ascending order, trimmed 10% of observations from both tails, and determined seven bids from the trimmed distribution in a manner of increasing interval.
Seven sets of bids are widely used in various papers (e.g., [20,36]). Thus, we followed previous papers and used seven sets of two bids, determined through a pretest of a focus group. The list of sets used in this study is as follows: (1000, 3000); (2000, 4000); (3000, 6000); (4000, 8000); (6000, 10,000); (8000, 12,000); (10,000, 15,000). The figures given are in Korean won; the first element of each set is the lower bid and the second element is the higher bid. There are two characteristics when determining the lower bid and higher bid. First, the sets of bids overlap each other. Second, the interval of sets of bids becomes larger. This method, proposed by Cooper et al. [36], is a common practice in the one-and-one-half-bounded (OOHB) dichotomous choice (DC) question method. Thus, this article followed this method proposed by Cooper et al. [37].
The final questionnaire comprises four sections: first, presentation of the background and objective of the survey, as shown in Figure A1; second, questions that lead to the opinions and judgments of the interviewer about lessening the incidence of HCS accidents in South Korea; third, questions related to the WTP for the reduction plan; fourth, questions about respondents’ socioeconomic properties. The main part of the survey questionnaire in this study is given in Appendix A.
3.3. WTP Elicitation
In accordance with the guidance of the NOAA on the CV approach [33], a dichotomous choice (DC) question method was used. Questions should be effectively asked respondents to ensure that the WTP of the respondents is well elicited. In recent CV studies, an open-ended question such as “How much will you pay for the reduction plan?” is not very good. An overestimated WTP can be derived through open-ended questions [38]. Thus, they are not recommended in empirical CV studies. Instead, closed-ended question asking “Are you willing to pay a specific amount of money for implementing the reduction plan?” should be used. This is because the latter is similar to the way people decide whether they buy a goods or not in the market, and thus it is incentive-compatible and familiar. In this article, a closed-ended question is applied following the recommendation of Arrow et al. [33].
The DC question method is usually classified into a single-bounded (SB) DC format and a double-bounded (DB) DC format. The first demands the respondent to answer just one question. On the other hand, the second asks the respondent to answer one question as well as other follow-up questions. As the additional questions obviously give a greater range for the WTP, DB questions are likely to be more efficient than SB ones [39]. However, many studies in the literature claim that some bias is captured when moving from an SB to a DB question [40,41,42]. In summary, the SB and DB formats may, respectively, suffer from statistical inefficiency and response bias. To overcome these complications, Cooper et al. [37] suggested the OOHB DC question method. The merits of using of the OOHB DC question, as employed in our study, are presented in Cooper et al. [37].
One complication involved in applying the CV is that it puts people in a hypothetical situation and thus the respondents can have difficulties in stating their true WTP. An appropriate payment can help the respondents confronted with the hypothetical situation report their WTP, making them feel as if they were in the real world. Some examples of the payment vehicle include a tax such as an income tax or property tax, a donation, a fund, a usage fee, and so on. The payment vehicle should be related to the funds used for enforcing the plan, should not be confined to routine expenditure, and should be familiar to people. We decided that the payment vehicle meeting these three conditions is income tax. This is because it is well-known to most of the interviewees and is clearly related to their actual expenditure [43,44].
Thus, the WTP question was posed in the following manner: “Would your household be willing to pay a specified bid for reducing the incidence of HCS accidents by half in South Korea through an increase in yearly income tax, supposing that the plan would certainly be implemented?” Additional statements regarding payment were provided. For example, the interviewees were asked, “If there is a preponderance of negative respondents for the expansion plan, the plan cannot be performed. However, in the case of objections, the plan can be implemented. Please keep in mind that your household’s income is constrained and that there are various expenditures in your household.”
3.4. The Basic Model
It is common to test for internal consistency (theoretical validity) in CV studies by estimating a WTP equation. The theoretical model for explaining an individual’s WTP comes from the income-compensating function [45]. When one takes WTP as the desired benefit measure, the income-compensating function is sometimes referred to as the WTP function; one could hypothesize that the arguments are elements of a vector of the respondent’s tastes or personal characteristics, as well as being variables representing both the respondent’s environmental concerns and economic situation [46]. Thus:
where is the vector of prices for the marketed goods; is the environmental amenity being changed; is the baseline level of the environmental good of interest; is a vector of the other public goods; is income; and is a vector of the respondent’s tastes or characteristics. In this study, and are measures of HCS accidents’ ‘quality’ after and before the reduction plan is implemented, respectively, and , , and are assumed to be constant across all respondents.
Equation (1) forms the basis for estimating a valuation function that depicts the monetary value of a change in economic welfare that occurs for any change in . Denoting these determinants of WTP as a vector, , and assuming a linear functional form for the WTP equation, then for each respondent in the sample, the WTP can be written as:
where is a vector of parameters and is a random error, assumed to be normally distributed with mean 0 and standard deviation σ5.
3.5. OOHB DC Model
An economic and statistical modeling of the closed-ended WTP data was suggested by Cooper et al. [37]. It is called the OOHB DC model. In the closed-ended question CV survey, the th interviewee is faced with a question of whether she/he is willing to pay an amount, or (), for the reduction plan. About half of the interviewees are randomly provided with as the first. If her/his WTP, , is less than (), she/he will answer “no”, and there was no further question. If her/his WTP, , is more than or equal to (), she/he will answer “yes” and receive an additional question of whether she/he is willing to pay an amount, . In the same way, the remaining half of the interviewees are presented with as the first bid. If her/his WTP, , is less than (), she/he will answer “no,” and receive additional question of whether she/he is willing to pay an amount, . If her/his WTP, , is more than or equal to (), she/he will answer “yes” and there was no further question.
To specify the responses, indicator variables, , , and , can be introduced such that the value is 1 if the response is “yes-yes” (), “yes-no” (), and “no” (), respectively, and zero otherwise in the case that is provided at first. Likewise, indicator variables, , , and , can be introduced such that the value is 1 if the response is “yes” (), “no-yes” (), and “no-no” (), respectively, and zero otherwise in the case that is provided at first. Therefore, there can be six kinds of responses. Let , , , , , and be binary variables which correspond to the six kinds of responses. For instance, is 1 if th interviewee reports “yes-yes” and zero otherwise.
3.6. Combination of OOHB DC Question and Spike Model
A respondent can report a zero WTP value when the reduction plan does not contribute to her/his utility, she/he cannot afford to pay some money for the reduction plan, or she/he is indifferent to the reduction plan. In this case, a WTP model that can deal with the zero WTP responses should be applied. This study uses the spike model [47,48] for the purpose of analyzing the WTP data with zero values. An additional question identifying the respondents’ WTP as a positive value less than the lower bid () or zero was asked of the respondents who gave “no” or “no-no” responses. The question is “Would your household be willing to pay anything at all?” Her/his WTP is more than zero and less than the lower bid () if the answer is “yes” and zero otherwise. In this regard, one more binary variable , can be formulated such that the value is zero if the WTP is non-zero and one if the WTP is zero. Thus, there are eight outcomes:
- -
- “yes-yes” (),
- -
- “yes-no” (),
- -
- “no-yes” (),
- -
- “no-no” (),
- -
- “yes” (),
- -
- “no-yes” (),
- -
- “no-no-yes” (), and
- -
- “no-no-no” ().
Here, the first four outcomes are achieved when is offered at first and the latter four outcomes are obtained when is supplied at first.
The spike model given in Kriström [47] can be usefully employed to deal with the WTP data. Usually, the model is specified as:
where is the WTP distribution function and D is defined as a bid presented to respondent in Equation (3). and are the parameters of .
When the number of observations is , the log-likelihood function of the model is:
The estimates for and can be derived through the maximum likelihood estimation method. The average WTP is obtained as [47].
4. Results
4.1. Data
The interviewees’ responses are summarized in Table 4. For people who gave a “no-no” and “no-no-no” responses, a third question was asked: “Are you willing to pay anything at all?” Those providing a “no” answer to this question represent a valid representation of their value or reflect a protest about some feature of the hypothetical market [38]. In the survey, out of the 1000 respondents, 533 (53.3%) said they had no intention of paying a penny. The 533 respondents who answered “no-no” and “no-no-no” to the question were asked: “What is the most important reason why you would not be willing to pay?” Table 5 summarizes the responses to this question.
Two categories present valid refusals or zeros and are considered nonprotests. These categories were “The plan has no value to me” and “I do not have enough income”. Forty percent of 533 household respondents gave the first reason, and 29% gave the second. Most of the remaining categories represent what are usually classified as protest or scenario rejection responses. In this study, there are no protest responses directly related to income tax as a payment vehicle. However, about 4% came out in the category, “I am already paying enough in taxes”. There are two ways to handle the protest: subtracting the protest and analyzing it as a conservative approach. The conservative approach means analyzing the protest at zero. Since this article adopted the conservative approach, it did not attempt to analyze after removing the protest.
4.2. Estimation Results
Covariates are the factors that can have an effect on the probability of saying “yes” to a provided bid. Generally, the interviewees’ characteristics were used as covariates. We considered four variables: gender, family size, education level, and income. Table 6 explains the variables.
Estimation results of the model with covariates are reported in Table 7. and denote the constant and bid amount, respectively. The coefficient estimate for the bid amount is statistically meaningful and negative. The spike, which indicates the possibility of reporting zero WTP, is estimated as 0.5383. This is equivalent to the sample proportion of zero WTP (53.3%). The average household WTP is KRW 3830 (USD 3.41) per annum and statistically significant. In addition, the constant term is statistically meaningful. Moreover, Table 7 presents the confidence intervals for the mean WTP estimate. They are computed from the method reported in Krinsky and Robb [49]. The Wald statistic indicates that the estimated utility function is statistically meaningful.
The covariates were reflected in the model by inserting them into in Equation (3). Therefore, the positive sign of the coefficient for a variable indicates that the variable has a positive correlation to the probability of reporting “yes” to an offered bid. Table 7 shows the estimation results of the model with covariates. The coefficient estimate for the bid amount term was statistically significant. More importantly, the estimated coefficient for the bid amount variable had the expected negative sign. The coefficient estimates for all variables were statistically meaningful except for gender and family size variables. The respondent’s education level was positively related to the probability of reporting “yes” to a given bid. Similarly, richer interviewees were more inclined to accept the payment of a proposed bid than less-rich interviewees.
4.3. Discussion of the Results
It is necessary to expand the findings for the sample to the population level. When the survey was conducted, South Korea had 19,523,587 households [35]. However, the number of observations used here was just 1000. Therefore, the representativeness of our sample should be examined. That is, whether our sample represents the population well or not is the key to obtaining population-level information. This study attempts to look into the issue in two aspects before the expansion is performed. First, random and scientific sampling in gathering the data is quite important to the expansion. As explained above, a professional survey company that has rich experience in field CV surveys commissioned the entire process of the sampling, thereby guaranteeing that the sample maintained a representative nature.
Second, whether some variables for the sample were similar to those for the population should be examined. In this regard, the ratio of female respondents, the monthly income of the household, and the size of the household were looked into here. The sample averages for the variables were 50.0%, KRW 4.40 million, and 3.31 persons. The population averages were 50.0%, KRW 4.36 million, and 3.13 persons when the survey was carried out [35]. Interestingly, it seems that there were no significant gaps between the two values for each variable. This finding makes the representativeness of our sample even stronger. Thus, the findings from the sample can be expanded to the inference of the population values.
The way in which the covariates are selected may affect the mean WTP estimate. Thus, the mean WTP estimate found in models with no covariates was used in expanding the sample figure to the population figure instead of that in the model with covariates. When the yearly values concerning the first and the total number of households in South Korea are used, we can compute the total WTP, expanded to the relevant population. As shown in Table 8, it was found that the population’s WTP for reducing the incidence of HCS accidents by half in South Korea was KRW 74.8 billion (USD 66.6 million) per annum. The corresponding 95% and 99% confidence intervals for the total public value are KRW 66.6 to 84.7 billion (USD 59.4 to 75.4 million) and KRW 64.4 to 87.8 billion (USD 57.4 to 78.3 million), respectively. It appears that reducing the incidence of HCS accidents by half contributes to South Korean households’ utility.
HCS accidents are increasing every year in South Korea, and some findings that emerge from our CV survey show that South Korean households are concerned about HCS accident damage. This means that a number of households want to enforce strong and systematic incident response regulations of HCS accidents. Therefore, the government needs to execute a joint public and private response and endeavor actively to reduce the incidence of HCS accidents.
Many countries around the world are implementing policies to manage hazardous chemicals, and actively obeying the policies. However, HCS accidents are constantly occurring, and once an accident happens, the extent of the damage is wide in the environment, society, and economy. It is very important to respond promptly to prevent the occurrence of accidents and to minimize the spread of damage in the area. Although domestic chemical substances are managed in accordance with international standards, there is a need to introduce systems and improve those existing to reduce HCS accidents.
5. Conclusions
HCS accidents are characterized by explosive eruptions and violent reactions, resulting in significant damage within a short time, both in terms of injury and property damage. To reduce the incidence of HCS accidents, the South Korean government has a plan to reduce the incidence of HCS accidents by 50%. This study sought to estimate the public value of the implementation of the reduction plan. For this purpose, the CV method was applied to 1000 randomly selected South Korean households. We found that the mean WTP for implementing the reduction plan was KRW 3830 (USD 3.41) per household per year, which was KRW 74.8 billion (USD 66.6 million) per year when expanded to the entire country. This has statistical meaningfulness at the 1% level and the sample also represented the population well.
It is costly to reduce HCS accidents by carrying out the government plan. Since the cost will eventually be covered by the national tax levied on people, it is vital to gather public opinion on whether or not citizens are willing to pay for the reduction. This is because the reduction cannot be successful without public support for the reduction. In particular, policymakers seek quantitative information about people’s willingness to pay for the reduction. The purpose of this study was to provide this information to policymakers. In this regard, the results from the study are useful from the perspective of policy. It was found that people are willing to pay a significant amount for the reduction of HCS accidents. Thus, the implementation of the reduction plan can be undertaken with Korean households’ support and will contribute to public utility.
Since there are few studies that have dealt with the public value of reducing the incidence of HCS accidents in the literature, it is difficult to compare our findings with the findings of other studies on this topic. However, by comparing our results with the results from analyzing the data from other countries, as well as clarifying the gap between the two and investigating some elements influencing the gap, we can gain new insights into the public value of reducing the incidence of HCS accidents from an international standpoint. These kinds of works could give us a new perspective on the public value of reducing the incidence of HCS accidents.
Follow-up work needs to be performed in the next phase of this study in two aspects. First, since the government attempts to implement various policies to enhance the safety of the people, the public value for implementing policies regarding safety management should be assessed and compared with the results of this study. In South Korea, for example, policies are underway to reduce the incidence of accidents such as fires and oil spills. Second, if the results of this article on reducing the incidence of HCS accidents are compared with those of other countries, new implications can be found.
Author Contributions
All authors participated in writing this article. H.-J.L. formulated the model adopted in this study and wrote half of the article; H.-J.K. made an empirical analysis of collected data and reported implications of the study; S.-H.Y. prepared the survey instrument and supervised the field survey to collect the data.
Acknowledgments
This study was supported by the Research Program funded by SeoulTech (Seoul National University of Science and Technology).
Conflicts of Interest
The authors declare no conflict of interest.
Appendix A. Main Part of the Survey Questionnaire
Appendix A.1. Part 1. Questions about Socioeconomic Characteristics
The interviewees were asked to divulge their socioeconomic characteristics, such as the gender of the individual, the number of family members, the level of education, and the monthly income per household (before tax deduction). Questions about the number of family and income were open-ended questions, and the question about the level of education was as follows:
Q1. Please check with √ your education level in years.
| Education level | Uneducated | Elementary school | Middle school | High school | University | Graduate school |
| Education level in years | 0 | 1 2 3 4 5 6 | 7 8 9 | 10 11 12 | 13 14 15 16 | 17 18 19 20 |
Appendix A.2. Part 2. Questions about Willingness to Pay for Reducing the Incidence of HCS Accidents by Half
Type A. Q1. Is your household willing to pay additional income tax of 1000 Korean won (lower bid amount) annually for the next 10 years for reducing the incidence of HCS accidents by half in South Korea, supposing that the project is certain to succeed?
- Yes—go to Type A. Q2.
- No—go to Q3.
Type A. Q2. Is your household willing to pay additional income tax of about 3000 Korean won (upper bid amount) annually for the next 10 years for reducing the incidence of HCS accidents by half in South Korea, supposing that the project is certain to succeed?
- Yes—Finish this survey
- No—Finish this survey
Type B. Q1. Is your household willing to pay additional income tax of about 3000 Korean won (upper bid amount) annually for the next 10 years for reducing the incidence of HCS accidents by half in South Korea, supposing that the project is certain to succeed?
- Yes—Finish this survey
- No—go to Type B. Q2.
Type B. Q2. Is your household willing to pay additional income tax of about 1000 Korean won (lower bid amount) annually for the next 10 years for reducing the incidence of HCS accidents by half in South Korea, supposing that the project is certain to succeed?
- Yes—Finish this survey
- No—go to Q3.
Q3. Then, is your household not willing to pay anything for reducing the incidence of HCS accidents by half in South Korea?
- Yes, our household is willing to pay something less than 1000 Korean won.
- No, our household is not willing to pay anything. In other words, our household’s willingness to pay is zero.
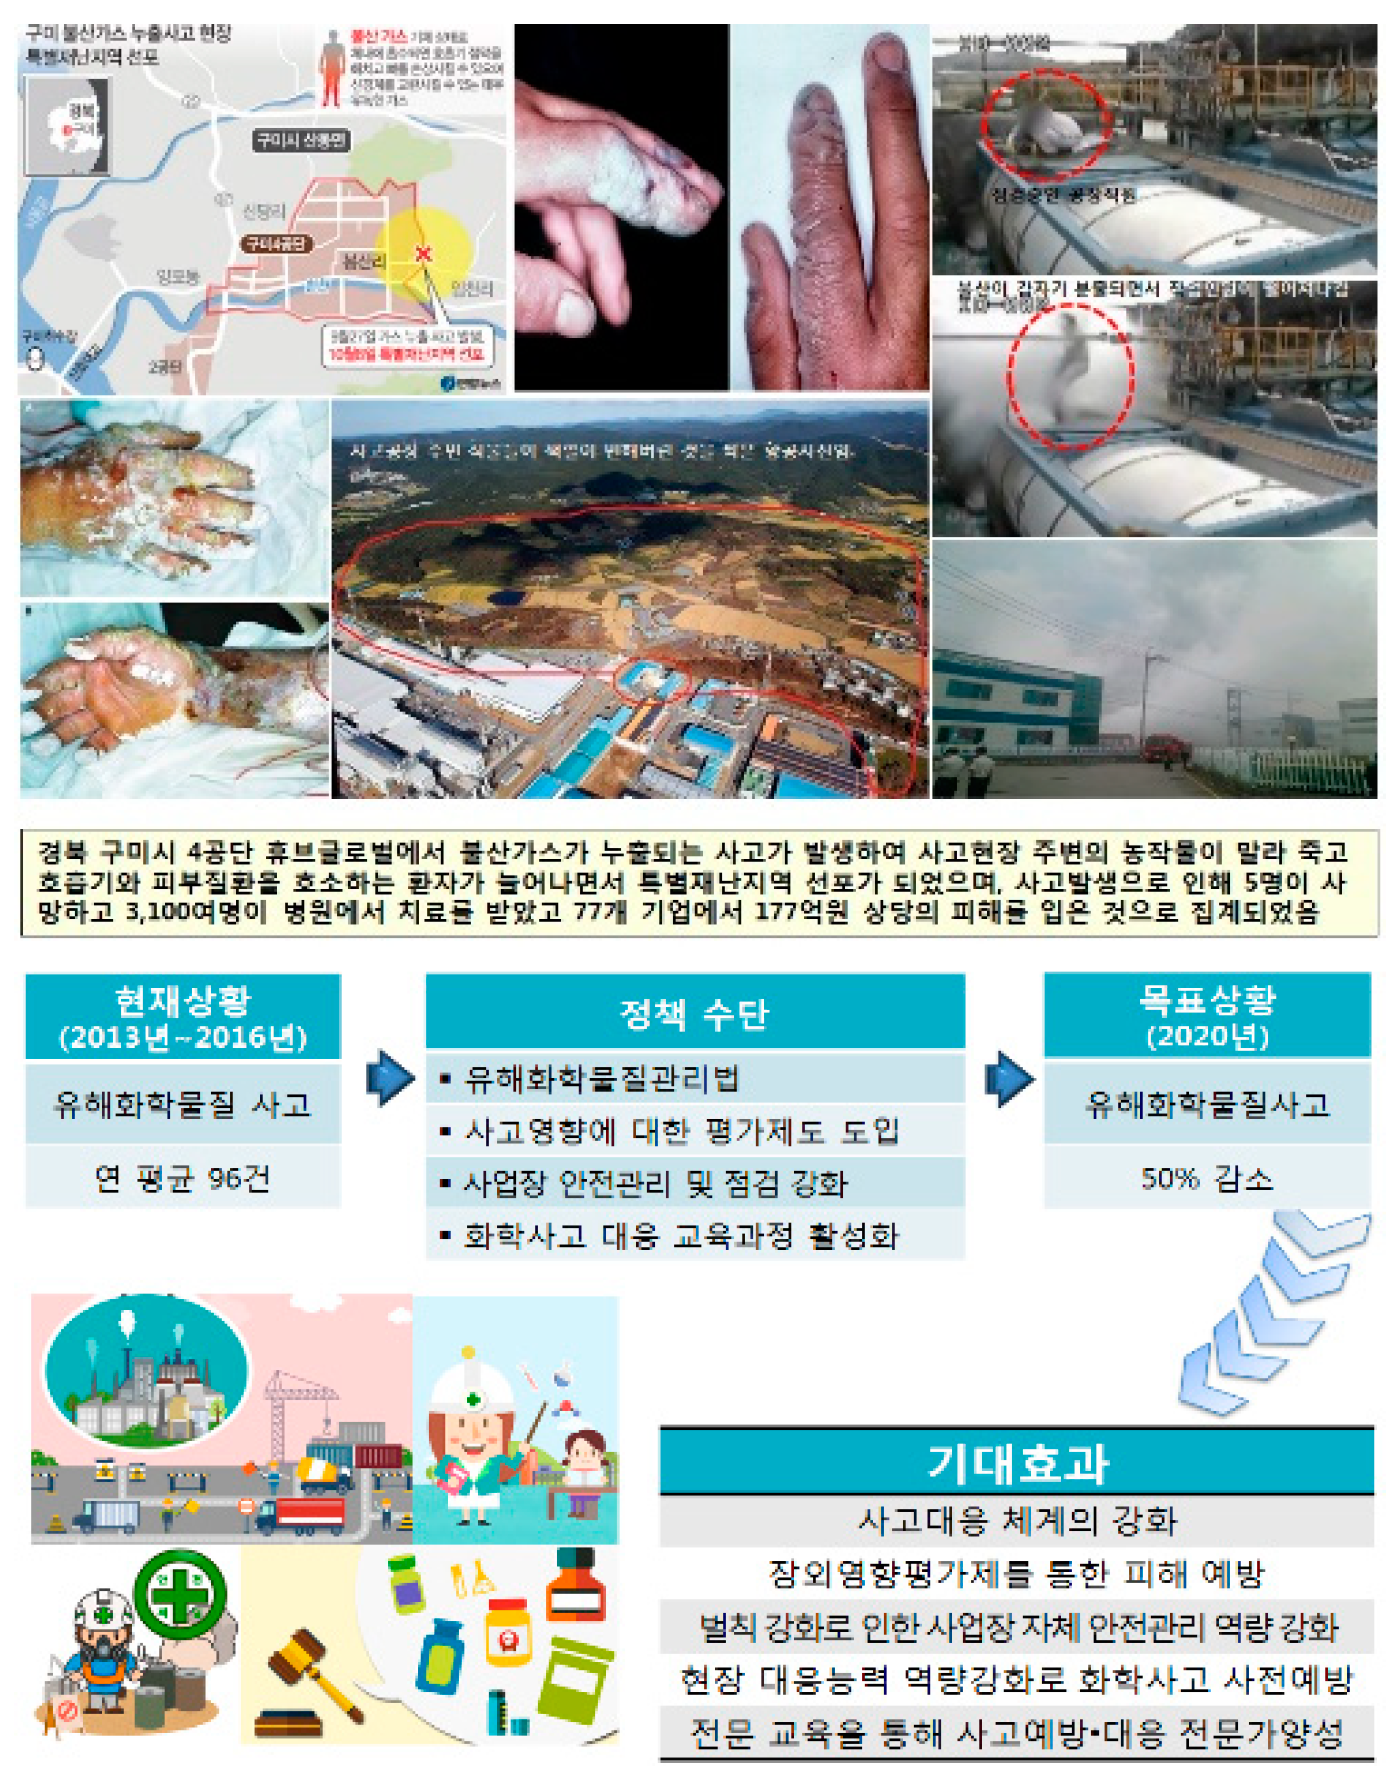
Figure A1.
Information materials used to inform interviewees about the issues of reducing the incidence of hazardous chemical spill accidents by half in South Korea.
Figure A1.
Information materials used to inform interviewees about the issues of reducing the incidence of hazardous chemical spill accidents by half in South Korea.

References
- Hansen, S.F.; Carlsen, L.; Tickner, J.A. Chemicals regulation and precaution: Does REACH really incorporate the precautionary principle. Environ. Sci. Policy 2007, 10, 395–404. [Google Scholar] [CrossRef]
- United States Environmental Protection Agency (EPA). Available online: https://www.epa.gov/chemicals-under-tsca (accessed on 11 June 2018).
- National Institute of Technology and Evaluation (NITE). Available online: https://www.nite.go.jp/en/index.html (accessed on 11 June 2018).
- Kim, J.C. A study on the full amendment of “Toxic Chemicals Control Act” into “Chemicals Control Act”. Environ. Law Res. 2014, 36, 3–42. (In Korean) [Google Scholar]
- Ha, S.; Seidle, T.; Lim, K.M. Act on the Registration and Evaluation of Chemicals (K-REACH) and replacement, reduction or refinement best practices. Environ. Health Toxicol. 2016, 31, 1–9. [Google Scholar]
- 25 Years of Chemical Accident Prevention at OECD History and Outlook, OECD 2013. Available online: https://www.oecd.org/chemicalsafety/chemical-accidents/Chemical-Accidents-25years.pdf (accessed on 10 June 2018).
- Death Toll Rises in Mexico Petrochemical Plant Blast. CBS News, 24 April 2016. Available online: https://www.cbsnews.com/news/death-toll-rises-in-mexico-petrochemical-plant-blast/ (accessed on 10 June 2018).
- Chemistry Safety Clearing-House. Available online: http://csc.me.go.kr (accessed on 13 August 2017).
- Lim, H.S.; Lee, K. Health care plan for hydrogen fluoride spill, Gumi, Korea. J. Korean Med. Sci. 2012, 27, 1283–1284. [Google Scholar] [CrossRef] [PubMed]
- Burge, M.; Hunsaker, J.C.; Davis, G.J. Death of a toddler due to ingestion of sulfuric acid at a clandestine home methamphetamine laboratory. Forensic Sci. Med. Pathol. 2009, 5, 298–301. [Google Scholar] [PubMed]
- Burgher, F.; Mathieu, L.; Lati, E.; Gasser, P.; Peno-Mazzarino, L.; Blomet, J.; Hall, A.H.; Maibach, H.I. Experimental 70% hydrofluoric acid burns: Histological observations in an established human skin explants ex vivo model. Cutan. Ocul. Toxicol. 2011, 30, 100–107. [Google Scholar] [PubMed]
- Greenberg, M.M. The central nervous system and exposure to toluene: A risk characterization. Environ. Res. 1997, 72, 1–7. [Google Scholar] [CrossRef] [PubMed]
- Sherman, M. Vinyl chloride and the liver. J. Hepatol. 2009, 51, 1074–1081. [Google Scholar] [CrossRef] [PubMed]
- Saad, A.A.A.; Mohsen, M.A.; Kandil, S.M.; Hassan, E.M.; Megahed, M.A.G.; Rahman, M.M.A. Predictive values of some atherogenic risk factors in young workers occupationally exposed to vinyl chloride and heavy metals. Arabian J. Chem. 2017, 10, 100–108. [Google Scholar]
- Pillai, L.V.; Ambike, D.P.; Husainy, S.; Vishwasrao, S.; Pataskar, S.; Kulkarni, S.D. Severe lung injury following inhalation of nitric acid fumes. Indian J. Crit. Care Med. 2005, 9, 244–247. [Google Scholar] [CrossRef]
- You, J.S.; Chung, Y.J. Case analysis of the harmful chemical substances’ spill. Fire Sci. Eng. 2014, 28, 90–98. (In Korean) [Google Scholar] [CrossRef]
- Schwarzenbach, R.P.; Egli, T.; Hofstetter, T.B.; Von Gunten, U.; Wehrli, B. Global water pollution and human health. Annu. Rev. Environ. Resour. 2010, 35, 109–136. [Google Scholar]
- Mann, R.M.; Hyne, R.V.; Choung, C.B.; Wilson, S.P. Amphibians and agricultural chemicals: Review of the risks in a complex environment. Environ. Pollut. 2009, 157, 2903–2927. [Google Scholar] [CrossRef] [PubMed]
- Park, J.G.; Seo, Y.W. A Study on the Improvement of the Chemical Accident Response System; Korea Environment Institute: Seoul, Korean, 2013. [Google Scholar]
- Kim, G.E.; Lee, H.J.; Yoo, S.H. Willingness to pay for substituting coal with natural gas-based combined heat and power in South Korea: A view from air pollutants emissions mitigation. Sustainability 2018, 10, 1–12. [Google Scholar]
- Lee, H.J.; Kim, H.J.; Yoo, S.H. The public value of reducing the incidence of oil spill accidents in Korean rivers. Sustainability 2018, 10, 1172. [Google Scholar] [CrossRef]
- Kim, H.J.; Lee, H.J.; Yoo, S.H. Are South Korean people willing to pay for official development assistance for building renewable power plants in developing countries? Energy Policy 2018, 118, 626–632. [Google Scholar] [CrossRef]
- Law, R.J.; Campbell, J.A. The effects of oil and chemical spillages at sea. Water Environ. J. 1998, 12, 245–249. [Google Scholar] [CrossRef]
- Galli, E. A sociological case study of occupational accidents in the Brazilian petrochemical industry. Accid. Anal. Prev. 1999, 31, 297–304. [Google Scholar] [CrossRef]
- Kwon, H.M. The effectiveness of process safety management (PSM) regulation for chemical industry in Korea. J. Loss Prev. Process Ind. 2006, 19, 13–16. [Google Scholar] [CrossRef]
- Cao, W.; Li, J.; Joksimovic, D.; Yuan, A.; Banting, D. Probabilistic spill occurrence simulation for chemical spills management. J. Hazard. Mater. 2013, 262, 517–526. [Google Scholar] [CrossRef] [PubMed]
- Carlsson, F.; Johansson-Stenman, O. Willingness to pay for improved air quality in Sweden. Appl. Econ. 2000, 32, 661–669. [Google Scholar] [CrossRef]
- Choi, K.S.; Lee, K.J.; Lee, B.W. Determining the value of reductions in radiation risk using the contingent valuation method. Ann. Nucl. Energy 2001, 28, 1431–1445. [Google Scholar] [CrossRef]
- Yoo, S.H.; Kwak, S.J.; Lee, J.S. Using a choice experiment to measure the environmental costs of air pollution impacts in Seoul. J. Environ. Manag. 2008, 86, 308–318. [Google Scholar] [CrossRef] [PubMed]
- Hammitt, J.K.; Zhou, Y. The economic value of air-pollution-related health risks in China: A contingent valuation study. Environ. Resour. Econ. 2006, 33, 399–423. [Google Scholar] [CrossRef]
- Wang, H.; Mullahy, J. Willingness to pay for reducing fatal risk by improving air quality: A contingent valuation study in Chongqing, China. Sci. Total Environ. 2006, 367, 50–57. [Google Scholar] [CrossRef] [PubMed]
- Travisi, C.M.; Nijkamp, P. Valuing environmental and health risk in agriculture: A choice experiment approach to pesticides in Italy. Ecol. Econ. 2008, 67, 598–607. [Google Scholar] [CrossRef]
- Arrow, K.; Solow, R.; Portney, P.R.; Leamer, E.E.; Radner, R.; Schuman, H. Report of the NOAA panel on contingent valuation. Fed. Regist. 1993, 58, 4601–4614. [Google Scholar]
- Johnston, R.J.; Boyle, K.J.; Adamowicz, W.; Bennett, J.; Brouwer, R.; Cameron, T.A.; Hanemann, W.M.; Hanley, N.; Ryan, M.; Scarpa, R.; et al. Contemporary guidance for stated preference studies. J. Assoc. Environ. Resour. Econ. 2017, 4, 319–405. [Google Scholar]
- Statistics Korea. Available online: http://kosis.kr (accessed on 20 September 2017).
- Kim, J.H.; Kim, H.J.; Yoo, S.H. Public value of enforcing the PM2.5 concentration reduction policy in South Korean urban areas. Sustainability 2018, 10, 1144. [Google Scholar] [CrossRef]
- Cooper, J.C.; Hanemann, W.M.; Signorello, G. One and one-half bound dichotomous choice contingent valuation. Rev. Econ. Stat. 2002, 84, 742–750. [Google Scholar] [CrossRef] [Green Version]
- Mitchell, R.C.; Carson, R.T. Using Surveys to Value Public Goods: The Contingent Valuation Method; Resources for the Future: Washington, DC, USA, 1989. [Google Scholar]
- Hanemann, W.M.; Loomis, J.; Kanninen, B.J. Statistical efficiency of double-bounded dichotomous choice contingent valuation. Am. J. Agric. Econ. 1991, 73, 1255–1263. [Google Scholar] [CrossRef]
- McFadden, D. Contingent valuation and social choice. Am. J. Agric. Econ. 1994, 76, 689–708. [Google Scholar] [CrossRef]
- Bateman, I.J.; Langford, I.H.; Jones, A.P.; Kerr, G.N. Bound and path effects in double and triple bounded dichotomous choice contingent valuation. Resour. Energy Econ. 2001, 23, 191–213. [Google Scholar] [CrossRef] [Green Version]
- Carson, R.T.; Groves, T. Incentive and informational properties of preference questions. Environ. Resour. Econ. 2007, 37, 181–210. [Google Scholar] [CrossRef]
- Lim, K.M.; Lim, S.Y.; Yoo, S.H. Estimating the economic value of residential electricity use in the Republic of Korea using contingent valuation. Energy 2014, 64, 601–606. [Google Scholar]
- Kwak, S.Y.; Yoo, S.H. The public’s value for developing ocean energy technology in the Republic of Korea: A contingent valuation study. Renew. Sustain. Energy Rev. 2015, 43, 432–439. [Google Scholar] [CrossRef]
- Willig, R.D. Consumer surplus without apology. Am. Econ. Rev. 1976, 66, 587–597. [Google Scholar]
- Yoo, S.H.; Chae, K.S. Measuring the economic benefits of the ozone pollution control policy in Seoul: Results of a contingent valuation survey. Urban Stud. 2001, 38, 49–60. [Google Scholar] [CrossRef]
- Kriström, B. Spike models in contingent valuation. Am. J. Agric. Econ. 1997, 79, 1013–1023. [Google Scholar] [CrossRef]
- Yoo, S.H.; Kwak, S.J. Using a spike model to deal with zero response data from double bounded dichotomous choice contingent valuation surveys. Appl. Econ. Lett. 2002, 9, 929–932. [Google Scholar] [CrossRef]
- Krinsky, I.; Robb, A.L. On approximating the statistical properties of elasticities. Rev. Econ. Stat. 1986, 68, 715–719. [Google Scholar] [CrossRef]

Table 1.
Summary of some previous related studies.
| Sources | Countries | Methodologies a | Objects to Be Valued | Main Results |
|---|---|---|---|---|
| Carlsson and Johansson-Stenman [27] | Sweden | CV | Air pollutants | Yearly household willingness to pay (WTP) for a 50% decrease of harmful substances to improve air quality: EUR 241.4 |
| Choi et al. [28] | South Korea | CV | Radiation | Yearly household WTP for reducing radiation risk: USD 47.6 |
| Lee et al. [21] | South Korea | CV | Oil spills | Yearly household WTP for lessening the occurrence of oil spill accidents in South Korean rivers: USD 5.28 |
| Yoo et al. [29] | South Korea | CE | Air pollutants | Yearly household WTP for a 10% reduction in the concentrations of major air pollutants in Seoul: USD 4.6 |
| Hammitt and Zhou [30] | China | CV | Air pollutants | Yearly household WTP for the prevention of a cold: USD 3 to 6 |
| Yearly household WTP for the prevention of chronic bronchitis: USD 500 to 1000 | ||||
| Yearly household WTP for reducing mortality risk: USD 4000 to 17,000 | ||||
| Wang and Mullahy [31] | China | CV | Air pollutants | Yearly household WTP for reducing fatal risk by improving air quality: USD 34,458 |
| Travisi and Nijkamp [32] | Italy | CE | Pesticides | Yearly household WTP for protecting all 15 endangered bird species: EUR 874 |
| Yearly household WTP for eliminating soil and groundwater contamination in farmland areas: EUR 1465 | ||||
| Yearly household WTP for eliminating all cases of acute pesticide intoxication: EUR 1286 |
Note: a CV means contingent valuation and CE indicates choice experiment.
Table 2.
Trend of hazardous chemical spill accidents in South Korea.
| Year | Inadequate Facility Management | Careless Workers | Transportation Vehicle Accidents | Totals |
|---|---|---|---|---|
| 2005 | 1 | 2 | 3 | 6 |
| 2006 | 1 | 6 | 8 | 15 |
| 2007 | 6 | 5 | 5 | 16 |
| 2008 | 8 | 4 | 5 | 17 |
| 2009 | 3 | 6 | 7 | 16 |
| 2010 | 4 | 2 | 9 | 15 |
| 2011 | 4 | 4 | 4 | 12 |
| 2012 | 3 | 5 | 1 | 9 |
| 2013 | 31 | 34 | 21 | 86 |
| 2014 | 33 | 49 | 22 | 104 |
| 2015 | 55 | 38 | 20 | 113 |
| 2016 | 32 | 25 | 21 | 78 |
| Totals | 181 | 180 | 126 | 487 |
Source: Chemistry Safety Clearing-House [8].
Table 3.
The sizes of each stratum.
| Population | Sample | |||
|---|---|---|---|---|
| Strata | Number | Percentage | Number | Percentage |
| Seoul | 3,787,319 | 19.6 | 196 | 19.6 |
| Busan | 1,351,166 | 7 | 70 | 7 |
| Daegu | 939,536 | 4.8 | 48 | 4.8 |
| Incheon | 1,070,384 | 5.5 | 55 | 5.5 |
| Gwangju | 573,359 | 2.9 | 29 | 2.9 |
| Daejeon | 594,615 | 3 | 30 | 3 |
| Ulsan | 428,652 | 2.2 | 22 | 2.2 |
| Sejong | 102,551 | 0.5 | 5 | 0.5 |
| Gyunggi | 4,541,136 | 23.5 | 235 | 23.5 |
| Gangwon | 621,044 | 3.2 | 32 | 3.2 |
| Chungbuk | 622,147 | 3.2 | 32 | 3.2 |
| Chungnam | 823,952 | 4.2 | 42 | 4.2 |
| Jeonbuk | 731,051 | 3.7 | 37 | 3.7 |
| Jeonnam | 733,391 | 3.8 | 38 | 3.8 |
| Gyungbuk | 1,087,679 | 5.6 | 56 | 5.6 |
| Gyungnam | 1,282,811 | 6.6 | 66 | 6.6 |
| Totals | 19,290,793 | 100.0 | 1000 | 100.0 |
Note: According to Statistics Korea, there were 19,523,587 households in South Korea in 2017. Korea has a total of 17 metropolitan and provincial governments, of which Jeju Island is usually excluded from CV surveys because it is a large island far from the mainland. Source: http://kosis.kr [35].
Table 4.
Number of willingness to pay responses.
| Bid Amount a | Lower Bid is Suggested as the First Bid (%) b | Upper Bid is Suggested as the First Bid (%) b | Sample Size | |||||||
|---|---|---|---|---|---|---|---|---|---|---|
| Lower Bid | Upper Bid | “yes–yes” | “yes–no” | “no–yes” | “no–no” | “yes” | “no–yes” | “no–no–yes” | “no–no–no” | |
| 1000 | 3000 | 18 (12.6) | 17 (11.9) | 4 (2.8) | 33 (23.1) | 23 (16.1) | 11 (7.7) | 2 (1.4) | 35 (24.5) | 143 (100.0) |
| 2000 | 4000 | 16 (11.2) | 17 (11.9) | 5 (3.5) | 33 (23.1) | 18 (12.6) | 9 (6.3) | 8 (5.6) | 37 (25.9) | 143 (100.0) |
| 3000 | 6000 | 13 (9.1) | 14 (9.8) | 6 (4.2) | 38 (26.6) | 16 (11.2) | 9 (6.3) | 9 (6.3) | 38 (26.6) | 143 (100.0) |
| 4000 | 8000 | 7 (4.9) | 9 (6.3) | 15 (10.5) | 41 (28.7) | 11 (7.7) | 8 (5.6) | 8 (5.6) | 44 (30.8) | 143 (100.0) |
| 6000 | 10,000 | 12 (8.5) | 11 (7.7) | 10 (7.0) | 38 (26.8) | 16 (11.3) | 2 (1.4) | 12 (8.5) | 41 (28.9) | 142 (100.0) |
| 8000 | 12,000 | 6 (4.2) | 9 (6.3) | 17 (12.0) | 39 (27.5) | 17 (12.0) | 3 (2.1) | 12 (8.5) | 39 (27.5) | 142 (100.0) |
| 10,000 | 15,000 | 6 (4.2) | 12 (8.3) | 17 (11.8) | 37 (25.7) | 14 (9.7) | 3 (2.1) | 15 (10.4) | 40 (27.8) | 144 (100.0) |
| Totals | 78 (7.8) | 89 (8.9) | 74 (7.4) | 259 (25.9) | 115 (11.5) | 45 (4.5) | 66 (6.6) | 274 (27.4) | 1000 (100.0) | |
Notes:a The unit is the Korean won (USD 1.0 = KRW 1122 at the time of the survey). b The numbers in parentheses indicate the percentage of the sample size. The responses are presented in sequence. For example, “yes-yes” means that the first response to the lower bid is “yes” and the second response to the upper bid is “yes”. “no-no-no” implies that the first response to the upper bid is “no”, the second response to the lower bid is “no”, and the response to the question of intention of paying a penny is also “no”.
Table 5.
The most important reasons why respondents would not be willing to pay.
| Reasons | Number of Respondents (%) |
|---|---|
| The plan has no value to me | 213 (40.0) |
| I do not have enough income | 155 (29.1) |
| I do not trust the government | 17 (3.2) |
| I am already paying enough in taxes | 21 (3.9) |
| I do not like hypothetical questions | 11 (2.1) |
| Polluters should pay | 90 (16.8) |
| I do not think the plan will be effective | 21 (3.9) |
| Far from paying, I should be paid | 5 (1.0) |
| Totals | 533 (100.0) |
Table 6.
Definitions and sample statistics of the variables.
| Variables | Definitions | Mean | Standard Deviation |
|---|---|---|---|
| Gender | The respondent’s gender (0 = male; 1 = female) | 0.50 | 0.50 |
| Family size | The number of person in the respondent’s household (unit: person) | 3.31 | 1.05 |
| Education | The respondent’s education level in years | 14.23 | 2.28 |
| Income | The household’s monthly income before tax (unit: million Korean won) | 4.40 | 2.00 |
Table 7.
Estimation results of the model with covariates.
| Variables a | Coefficient Estimates | t-Values |
|---|---|---|
| Constant | −2.8912 | −6.58 # |
| Bid amount b | −0.1617 | −18.31 # |
| Gender | 0.0143 | 0.11 |
| Family size | −0.0073 | −0.11 |
| Education | 0.1743 | 5.84 # |
| Income | 0.0626 | 1.84 * |
| Spike | 0.5383 | 33.8 # |
| Yearly mean WTP per household | KRW 3830 (USD 3.41) | |
| t-value | 16.37 # | |
| 95% confidence interval c | KRW 3412 to 4336 (USD 3.04 to 3.86) | |
| 99% confidence interval c | KRW 3299 to 4499 (USD 2.94 to 4.01) | |
| Wald statistic (p-value) d | 267.96 (0.000) | |
| Log-likelihood | −1180.31 | |
| Number of observations | 1000 | |
Notes:aTable 6 explains the variables. b The unit is KRW 1000 (USD 1.0 = KRW 1122 at the time of the survey). c Calculated using the parametric bootstrapping method given in Krinsky and Robb [49]. d Calculated under the null hypothesis of all parameters being jointly zero. * and # indicate statistical significance at the 10% and 1% levels, respectively.
Table 8.
Estimation of total willingness to pay (WTP).
| Estimates | 95% Confidence Intervals | 99% Confidence Intervals | |
|---|---|---|---|
| Mean annual WTP per household | KRW 3830 | KRW 3412 to 4336 | KRW 3299 to 4499 |
| (USD 3.41) | (USD 3.04 to 3.86) | (USD 2.94 to 4.01) | |
| Total annual WTP | KRW 74.8 billion | KRW 66.6 to 84.7 billion | KRW 64.4 to 87.8 billion |
| (USD 66.6 million) | (USD 59.4 to 75.4 million) | (USD 57.4 to 78.3 million) |
Note: South Korea had 19,523,587 households when the survey was carried out.
© 2018 by the authors. Licensee MDPI, Basel, Switzerland. This article is an open access article distributed under the terms and conditions of the Creative Commons Attribution (CC BY) license (http://creativecommons.org/licenses/by/4.0/).
Share and Cite
MDPI and ACS Style
Lee, H.-J.; Kim, H.-J.; Yoo, S.-H. The Public Willingness to Pay for Reducing the Incidence of Hazardous Chemical Spill Accidents by Half in South Korea. Sustainability 2018, 10, 2673. https://doi.org/10.3390/su10082673
AMA Style
Lee H-J, Kim H-J, Yoo S-H. The Public Willingness to Pay for Reducing the Incidence of Hazardous Chemical Spill Accidents by Half in South Korea. Sustainability. 2018; 10(8):2673. https://doi.org/10.3390/su10082673
Chicago/Turabian StyleLee, Hye-Jeong, Hyo-Jin Kim, and Seung-Hoon Yoo. 2018. "The Public Willingness to Pay for Reducing the Incidence of Hazardous Chemical Spill Accidents by Half in South Korea" Sustainability 10, no. 8: 2673. https://doi.org/10.3390/su10082673
Note that from the first issue of 2016, this journal uses article numbers instead of page numbers. See further details here.