Numerical Analysis to Determine Reliable One-Diode Model Parameters for Perovskite Solar Cells
by
 , and
, and
Esteban Velilla
*, 
Juan Bernardo Cano
,
Keony Jimenez
,
Jaime Valencia
,
Daniel Ramirez
and
Franklin Jaramillo
Centro de Investigación, Innovación y Desarrollo de Materiales-CIDEMAT, Grupo en Manejo Eficiente de la Energía-GIMEL, Universidad de Antioquia UdeA, Calle 70 No. 52-21, Medellín 050010, Colombia
*
Author to whom correspondence should be addressed.
Energies 2018, 11(8), 1963; https://doi.org/10.3390/en11081963
Submission received: 14 June 2018
/
Revised: 25 July 2018
/
Accepted: 26 July 2018
/
Published: 28 July 2018
(This article belongs to the Section A: Sustainable Energy)
Abstract
:With the aim to determine the photo-generated current, diode saturation current, ideality factor, shunt, and series resistances related to the one-diode model for p-i-n planar perovskite solar cells, reference cells with active area of approximately 1 cm2 and efficiencies ranging between 4.6 and 12.2% were fabricated and characterized at standard test conditions. To estimated feasible parameters, the mean square error between the I-V curve data of these cells and the circuital model results were minimized using a Genetic Algorithm combined with the Nelder-Mead method. When considering the optimization process solutions, a numerical sensitivity analysis of the error as a function of the estimated parameters was carried out. Based on the errors behavior that is showed graphically through maps, it was demonstrated that the set of parameters estimated for each cell were reliable, meaningful, and realistic, and being related to errors lower than 9.1 × 10⁻⁹. Therefore, these results can be considered as global solutions of the optimization process. Moreover, based on the lower errors obtained from the optimization process, it was possible to affirm that the one-diode model is suitable to model the I-V curve of perovskite solar cells. Finally, the estimated parameters suggested that the average ideality factor is close to 2 when the fill factor of the I-V curves is higher than 0.5. Lower fill factors corresponded to ideality that was higher than 3, linked to lower efficiencies, and high loses effects reflected on lower shunt resistances. Lower ideality factor of 1.4 corresponds to the best performing solar cells.
1. Introduction
The electrical performance of solar cells and panels is described by the I-V curve. This curve presents all the possible operative points, including the Short-Circuit Current (0, Isc), Open Circuit Voltage (Voc, 0) and the Maximum Power Point (Vmpp, Impp). Several numerical models have been developed to reproduce this curve at different conditions and illumination levels. Some of them are based on electrical circuits [1,2], partial differential equations or semiconductor equations [3,4], artificial intelligent technics [5,6], curve fitting [7,8], among others.
Circuital models based on the Kirchhoff’s current law, such as the one-diode model have been widely used to reproduce the I-V curve of different solar technologies [9,10] under different environmental conditions [11,12]. The one-diode model is characterized to be implicit, nonlinear, and multivariable. Therefore, there is no way to calculate an exact solution from the I-V data. Hence, up to 34 methods were proposed in literature to extract or estimate the five parameters related to the model [2,13,14]. Where the shunt resistance (Rsh) is related to the leakage current across the surfaces involving pin-holes, grain boundaries, and charge recombination processes [15]. The series resistance (Rs) is reflected in the voltage drops and is related to the conductivity of the layers and interphases, this parameter is affected by space charges, traps, or other barriers [16]. Virtually, a proportional relationship between the photo-generated current (Iph) and irradiance intensity is observed. The diode saturation current (Io) is related to the material properties, junction configuration, recombination processes, and temperature. Finally, the ideality factor (n) is related to the Shockley theory involving conduction, interfacial layers, transport, and recombination processes in the bulk and surface regions, which directly affects the shunt resistance and the open-circuit voltage [17,18].
However, since the parameters estimation of this model depend on different physical aspects (such as temperature, light condition, number of series cells, among others), mathematical assumptions to simplify or transform the problem, and the numerical method, which can be initial value dependent [13] or instable in the results [19], it is possible to obtain relatively large error in the optimization process [6], unrealistic parameters, such as negative resistances [20] or high diode ideality factors [21]. In the same way, instability in the estimated parameters has been observed under measurement uncertainty when data noise or fewer points of the I-V curve are considered [22]. These facts remark the complexity that is involved to estimate reliable parameters from the I-V curve.
In spite of the last drawbacks, the optimized parameters that are related to the circuital model have allowed for predicting the electrical performance of panels [11,23] and solar cells [24], reflect the dynamic of panels under different environment conditions [12], explain the transport and recombination process in solar cells [18,25], determine the minority carrier lifetime [26], investigate the interface state density quality [27] and losses effects [28], study the degradation effects [29], among others.
The ideality factor is the most reported parameter for different solar cells technologies. In the case of silicon solar cells, this value is between 1 and 2. n close to 1 indicates ideal junctions, while n equal to 2 would be related to degradation of the solar cell, non-uniformities on recombination centers, and shunt resistance effects [30]. In dye-sensitized solar cells, this factor is between 2 and 3 [31] and in organic solar cells this factor is higher than 2 [32]. In the case of Perovskite solar cells (PSC), ideality factors that are close to 2 have been reported due to carrier recombination and trap-assisted recombination under dark condition [33,34]. When several hole transport layer thicknesses are considered at dark conditions, the ideality factor has been found to range between 1.3 and 2.5 [35]. Additionally, based on the intensity dependence of Voc under illumination conditions, an ideality factor between 1.7 and 1.9 has also been reported [36], and based on different device architectures, this parameter has been close to 1.0 for devices without hole transport layer (HTL) or even higher than 2 when considering the HTL [25]. However, due to the estimation of this parameter could be affected by different aspects such as hysteresis, slow relaxation processes, open-circuit voltage dependence of light intensity and temperature, capacitive effects and parasitic resistances, among others, the perovskite ideality factor from the dark I-V curve could produce values higher than 2 [37]. Therefore, another diode was included in the circuital model to agree with theoretical expectation [7], or methods that are based on light-intensity dependence, such as electroluminescence, Voc as function of illumination intensity, or based on AC resistances, as electrochemical impedance spectroscopy was proposed to estimate this parameter [25,37].
In order to fully determine the parameters that are related to the one-diode model that represents p-i-n perovskite solar cells, 11 cells of approximately 1 cm2 of area were fabricated and characterized at standard test conditions. The I-V curve of these cells was fitted to the one-diode model to estimate the five parameters using a Genetic Algorithm combined with the Nelder-Mead method to minimize the mean square error between experimental data and the model results. Finally, a numerical analysis of the mean square error between the data and the model was carried out to determine feasible, realistic, and reliable values that represent the electrical behavior of perovskite cells. Hence, it was demonstrated that under a rigorous methodology and a numerical optimization process, the one-diode model is suitable to model the I-V curve of perovskite solar cells.
2. Materials and Methods
2.1. Perovskite Solar Cells
Taking into account that the reproducibility [38] and large area devices [39,40] play a crucial role in the photovoltaic performance of perovskite solar, different p-i-n planar devices (ITO/NiOx/CH3NH3PbI3/PC60BM/Rhodamine/silver) were fabricated with an active area between 1 and 1.5 cm2 while using a previously reported protocol [41]. Briefly, devices were fabricated on Indium Tin Oxide (ITO) coated glass (Naranjo). The substrates were washed with neutral soap (Inmunodet neutro) and sequentially sonicated in Deionized (DI) water, acetone, and isopropanol for 5 min. Then, ultraviolet ozone (UVO) treatment was done for 5 min at 100 °C. The NiOx hole transporting material spin coated at 3000 rpm for 30 s with a 3 s ramp. To obtain a 430 ± 10 nm perovskite layer, a precursor solution of methylammonium iodide (Dyesol, Queanbeyan, Australia) and lead iodide (Alfa Aesar, Haverhill, MA, USA; 1:1 molar ratio; 55 wt %) in N, N-dimethylformamide (DMF) was deposited by spin-coating at 4000 rpm for 25 s. During spinning, 500 µL of Diethyleter (Aldrich, St. Louis, MO, USA) were dripped on the substrate after 10 seconds and the films were annealed at 65 °C for 1 min and 100 °C for 10 min. PCBM (1-Material) was deposited via spin-coating a 20 mg/mL solution in chlorobenzene (CB) at 2000 rpm for 30 s. Rhodamine 101 was deposited on top of the PCBM layer by spin coating a 0.5 mg/L solution at 4000 rpm for 30 s. Finally, to complete the devices, 100 nm thick silver electrodes were thermally evaporated under vacuum (≈10−6 mbar) at a deposition rate around ≈0.1 nm/s.
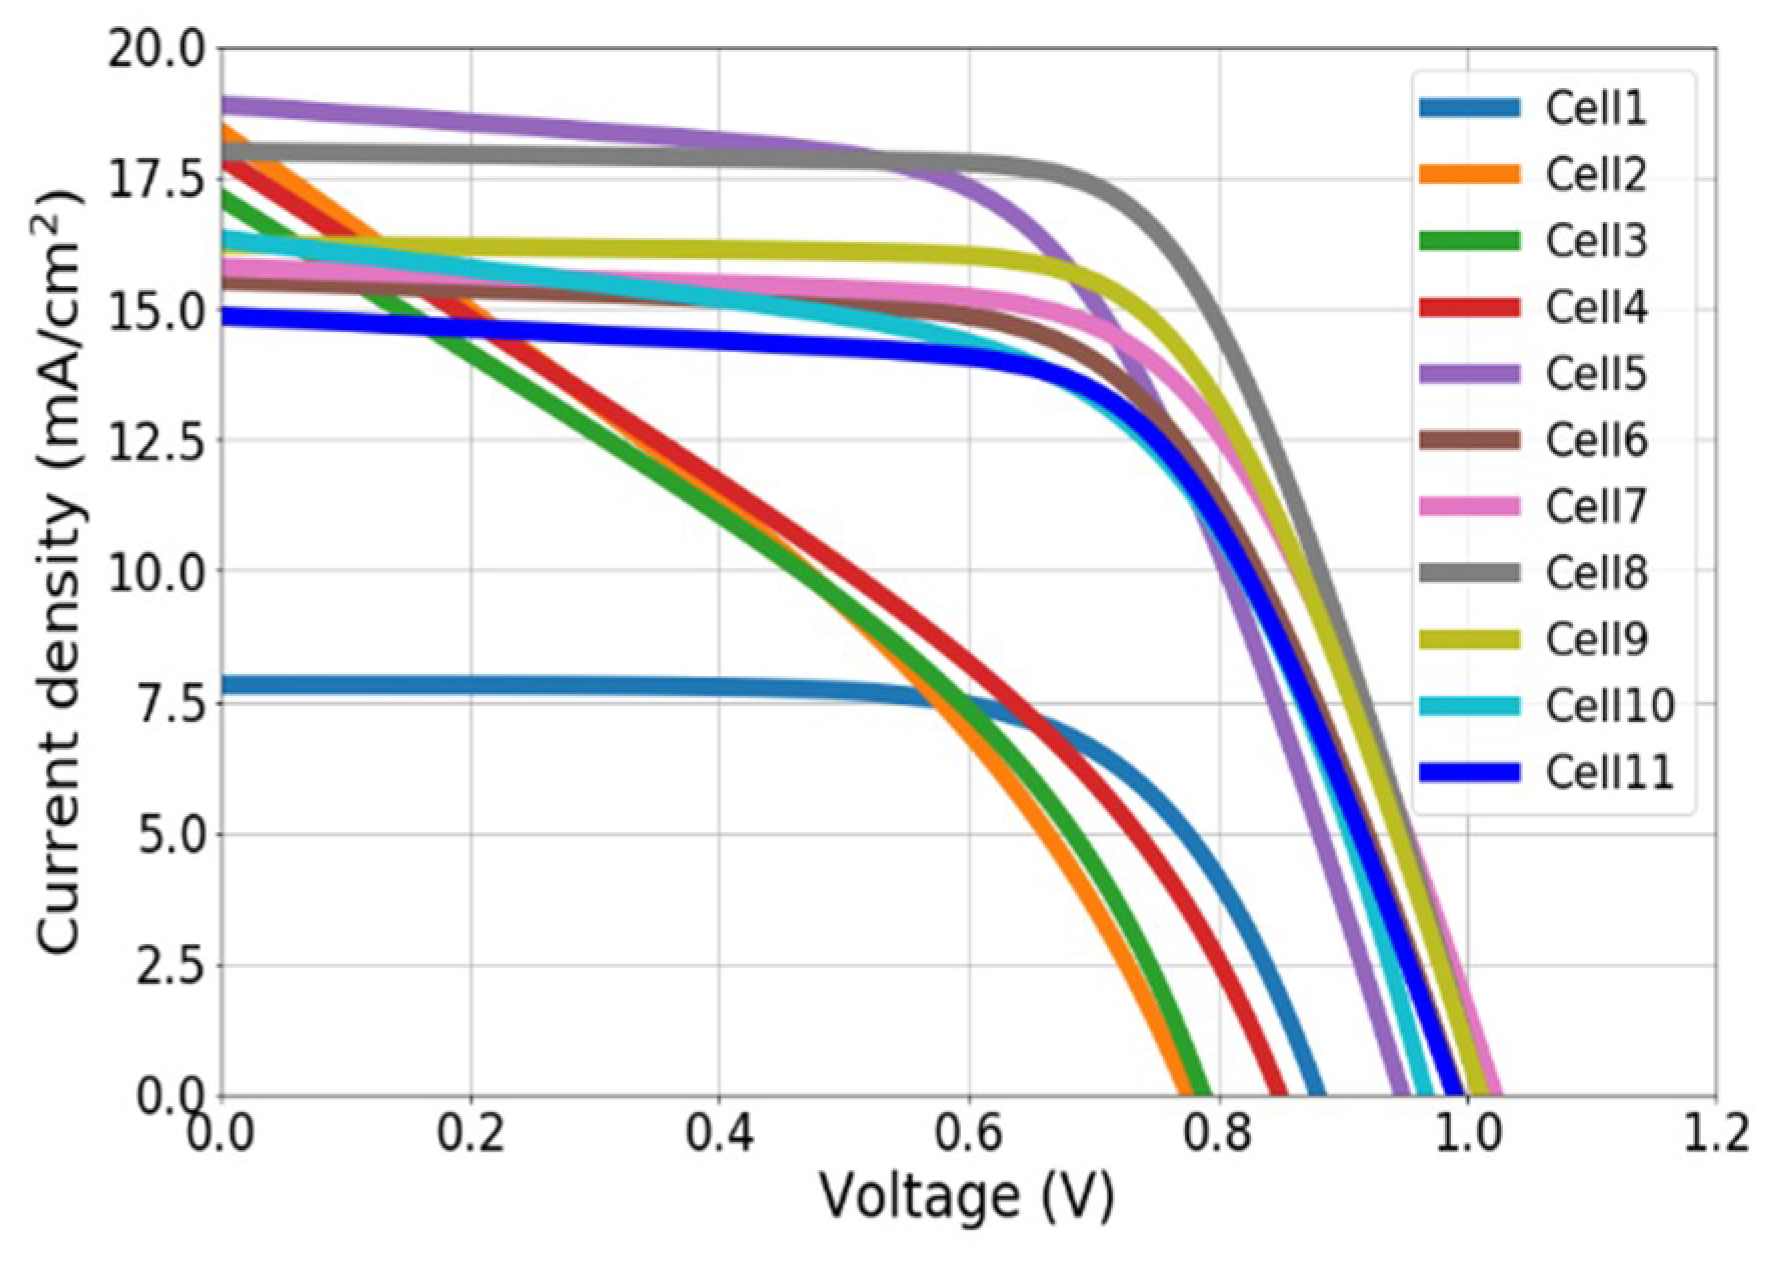
The electrical performance of these devices was measured without mask at standard test conditions using a 4200SCS Keithley system (Tektronix, Beaverton, OR, USA) and an Oriel sol3A sun simulator (Newport Corporation, Irvine, CA, USA). From different batches fabricated, 11 cells that represent different electrical performances were intentionally selected. These cells showed different I-V curve characteristics, as shown in Figure 1 and Table 1.
2.2. Numerical Methods Used to Extract the One-Diode Parameters
The one-diode model is characterized to be implicit, nonlinear, and multivariable (Equation (1)). This model showed the relationship between the current (I) and voltage (V) of solar device, the five parameters (photo-generated current, diode saturation current, ideality factor, shunt, and series resistances) and thermal voltage (VT) that depends on the temperature, the Boltzmann constant (k), and electron charge (q), Equation (2).
Different numerical methods have been proposed in literature to estimate the five parameters that are related to one-diode model from the I-V curve data. Some of them are called exact because these parameters are expressed explicitly from algebraic manipulation. To obtain analytical expression for these parameters, most exact methods evaluate one-diode model equation and his derivative at specific points of the I-V curve, such as (Voc, 0), (0, Isc), and (Vmpp, Impp). Moreover, to extract the parameters, some assumptions have been incorporated to simplify the iterative process or reduce the number of variables to be estimated. In Table 1 and Table 2 were summarized and correlated the assumptions and implications to some common exact methods reported in literature [17,42,43,44,45,46]. Corresponding the most part of these assumptions to the resistances that are involved in the model. For instance, if Rs is approached to zero, then the exponential term of the Equation (1) can be simplified to (assumption 1). If Rsh is approached to infinity, then the term can be neglected (assumptions 2–4). If Equation (1) is evaluated at the short circuit current point, then the diode current can be simplified (assumptions 5–7). If Equation (1) is evaluated at the maximum power point (assumption 8), then the term “−1” can be neglected [45]. Moreover, if high illumination conditions are considered, then assumptions 9 and 10 can be applied [17]. Finally, if Iph is approached to Isc (value that is known), then just four variables can be estimated (assumption 11).
Six exact methods that are commonly suggested in literature that involved the last assumptions are shown in Table 3. Due to that this kind of methods were developed to obtain quickly results and the number of assumptions are linked to the model simplicity, the generality, and accuracy of the solution can be compromised.
Other methods are called numerical because they evaluate the one-diode equation and his derivate in different points of the I-V curve, obtaining a set of nonlinear equations that can be solved using Newton-Raphson method [6,29], iterative process [47], among others. Additionally, when the numerical methods used to estimate the parameters required to calculate numerically the slope at Voc and/or the slope at Isc as initial conditions, instability and non-convergence of the solution can appear. Moreover, some of these methods can be sensitive to initial conditions [19].
To figure out these problems, numerical methods that are related to artificial intelligence, such as particular swarm [11], Genetic Algorithm (GA) has been successfully used to extract the five parameters of the one-diode model [5,48]. In these cases, one common way to express the parameter estimation as an optimization problem is minimizing the mean square error (Equation (3)) between the current measured (iexp) and the current calculated evaluating the Equation (1) as a function of the five parameters. Where the samples corresponded to the number of points that are considered in the I-V curve.
3. Results
With the aim of obtaining the five parameters according to the one-diode model for a broad range of performance PSCs, the I-V curves of devices fabricated and characterized in Section 2 (see Figure 1 and Table 1) were fitted to the circuital model. This process was divided in two parts. As an example, in the first part, the analysis was performed to Cell 1, which is a device with lower efficiency and short circuit current (see Table 1). For that, different numerical methods were used to extract the five parameters (see Table 2 and Table 3). In the second part, the analyses were extended to other cells using the method that shows the best fitting performance. Note that in order to have a good validation of our method, the efficiencies of the studied devices ranged between 4.6 and 12.19%, Fill Factors (FF) between 0.3 and 0.7, open circuit voltages between 0.7 and 1 V, and short circuit current densities (J) between 7 and 18 mA/cm2. The variability of these main variables indicated a broad range of electrical performance to be analyzed.
3.1. Extracting Parameters Using Different Exact and Numerical Methods
The electrical performance of cell 1 represented by the I-V was fitted to the one-diode model using the six exact methods described on Table 3. Additionally, due to Genetic Algorithm (GA) explores global solutions and the method does not required any assumptions, constrains or derivatives, it is suitable to the paradigm addressed here (Equation (3)), in which the equation to fit is non-linear and multivariable [49].
The GA was defined by a mutation rate of 0.95 with 100 individuals in the population and 40 generations, tournament selection, and rank algorithm is considered [50]. The chromosome is determined by the five parameters of interest and the fitness function by the mean square error (MSE) between the current measured (Iexp) and the one-diode model evaluated at each point of the I-V curve, Equation (3).
The five parameters estimated and the MSE between the data and the fitting process are shown in Table 4. Notice that, in all cases, the errors were lower than 10−4, values that are in the same order as those commonly published in literature by implicit and explicit methods [11]. In the case of GA, the error was in the same order of evolutionary algorithms when synthetic data were used [49], indicating a good fitting and reproducibility of the I-V curve.
The GA method that explores global solution showed the lowest error, followed by the oblique asymptote method proposed by Toledo et al. [51] that considers just two assumptions (Table 3). However, the method proposed by Khan et al. [17], which considers the largest number of assumptions obtained higher error, higher ideality factor, and negative series resistance, which lack physical meaning. These results confirmed that methods with less assumptions give more realistic parameters. Moreover, high ideality factors are correlated to negatives series resistances. Aspects mentioned in literature [13].
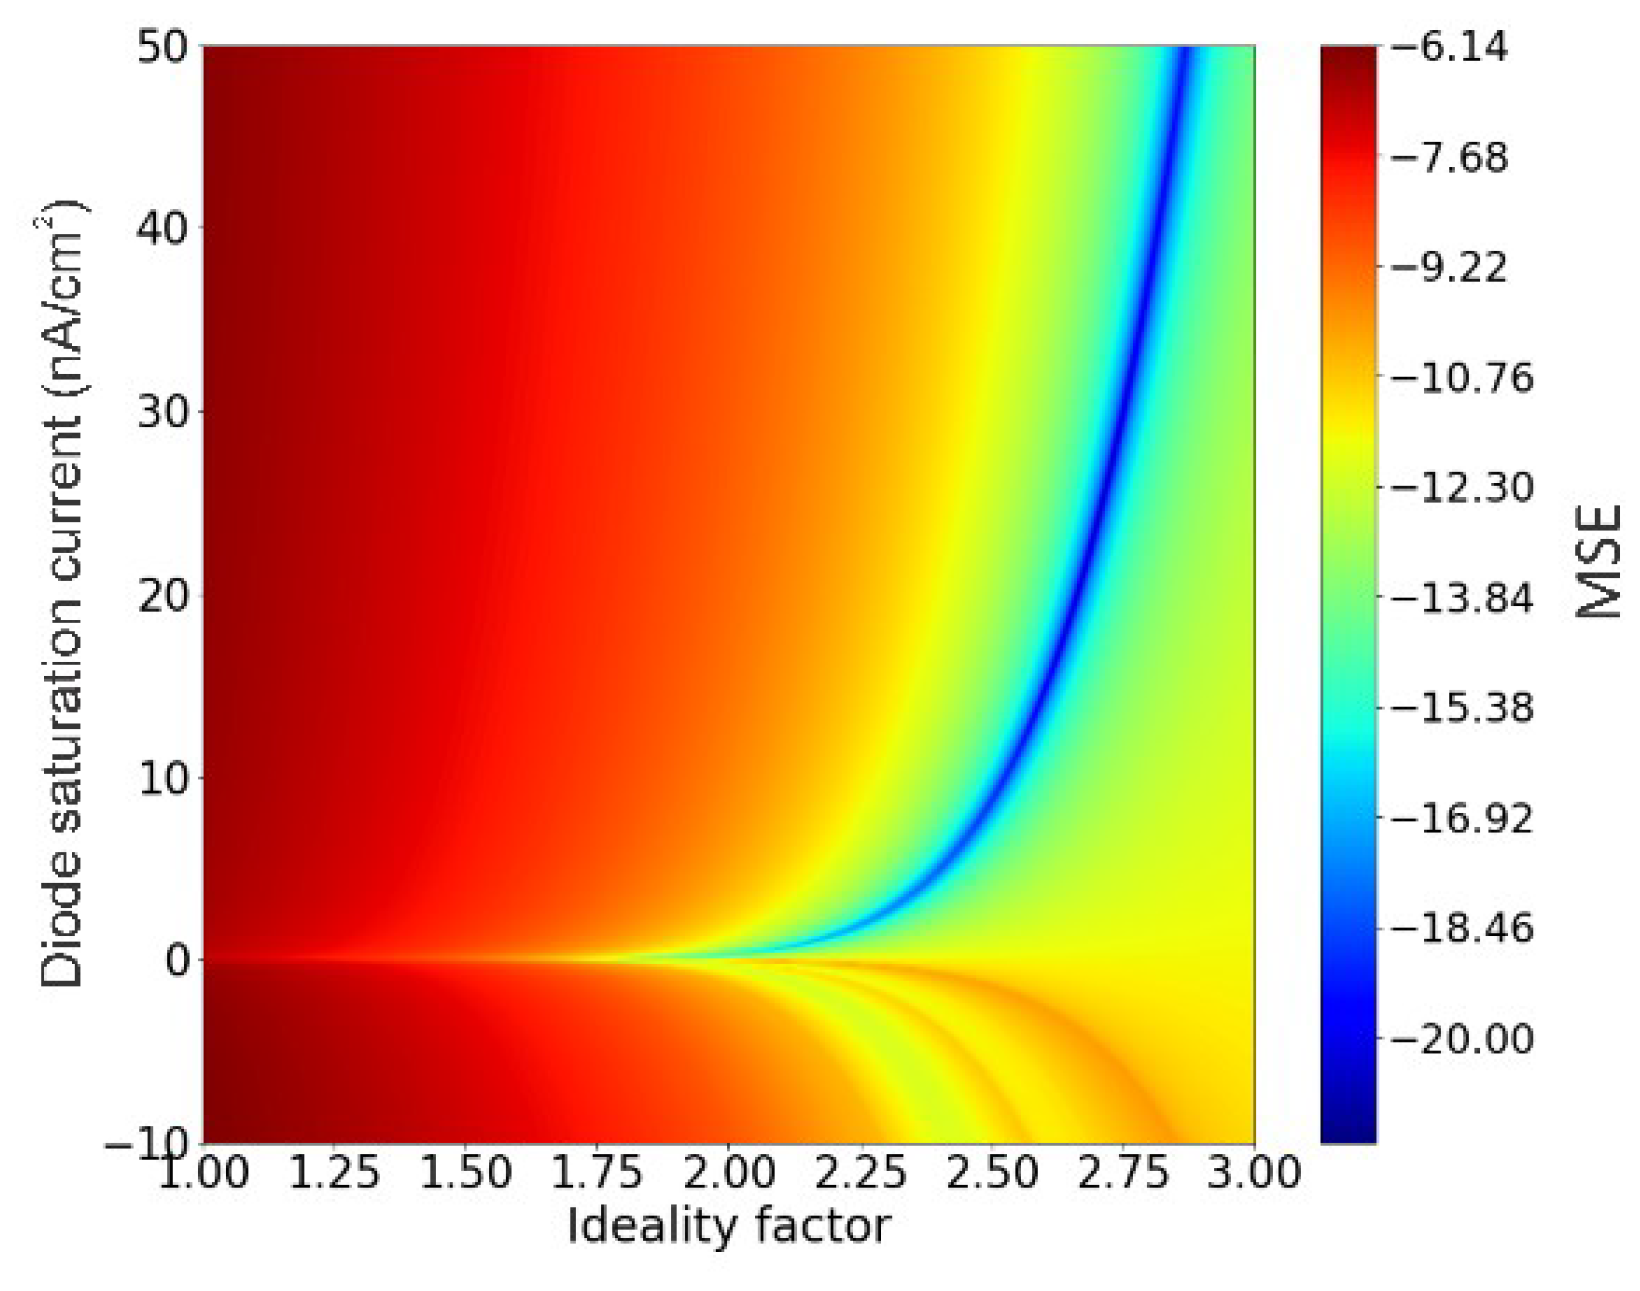
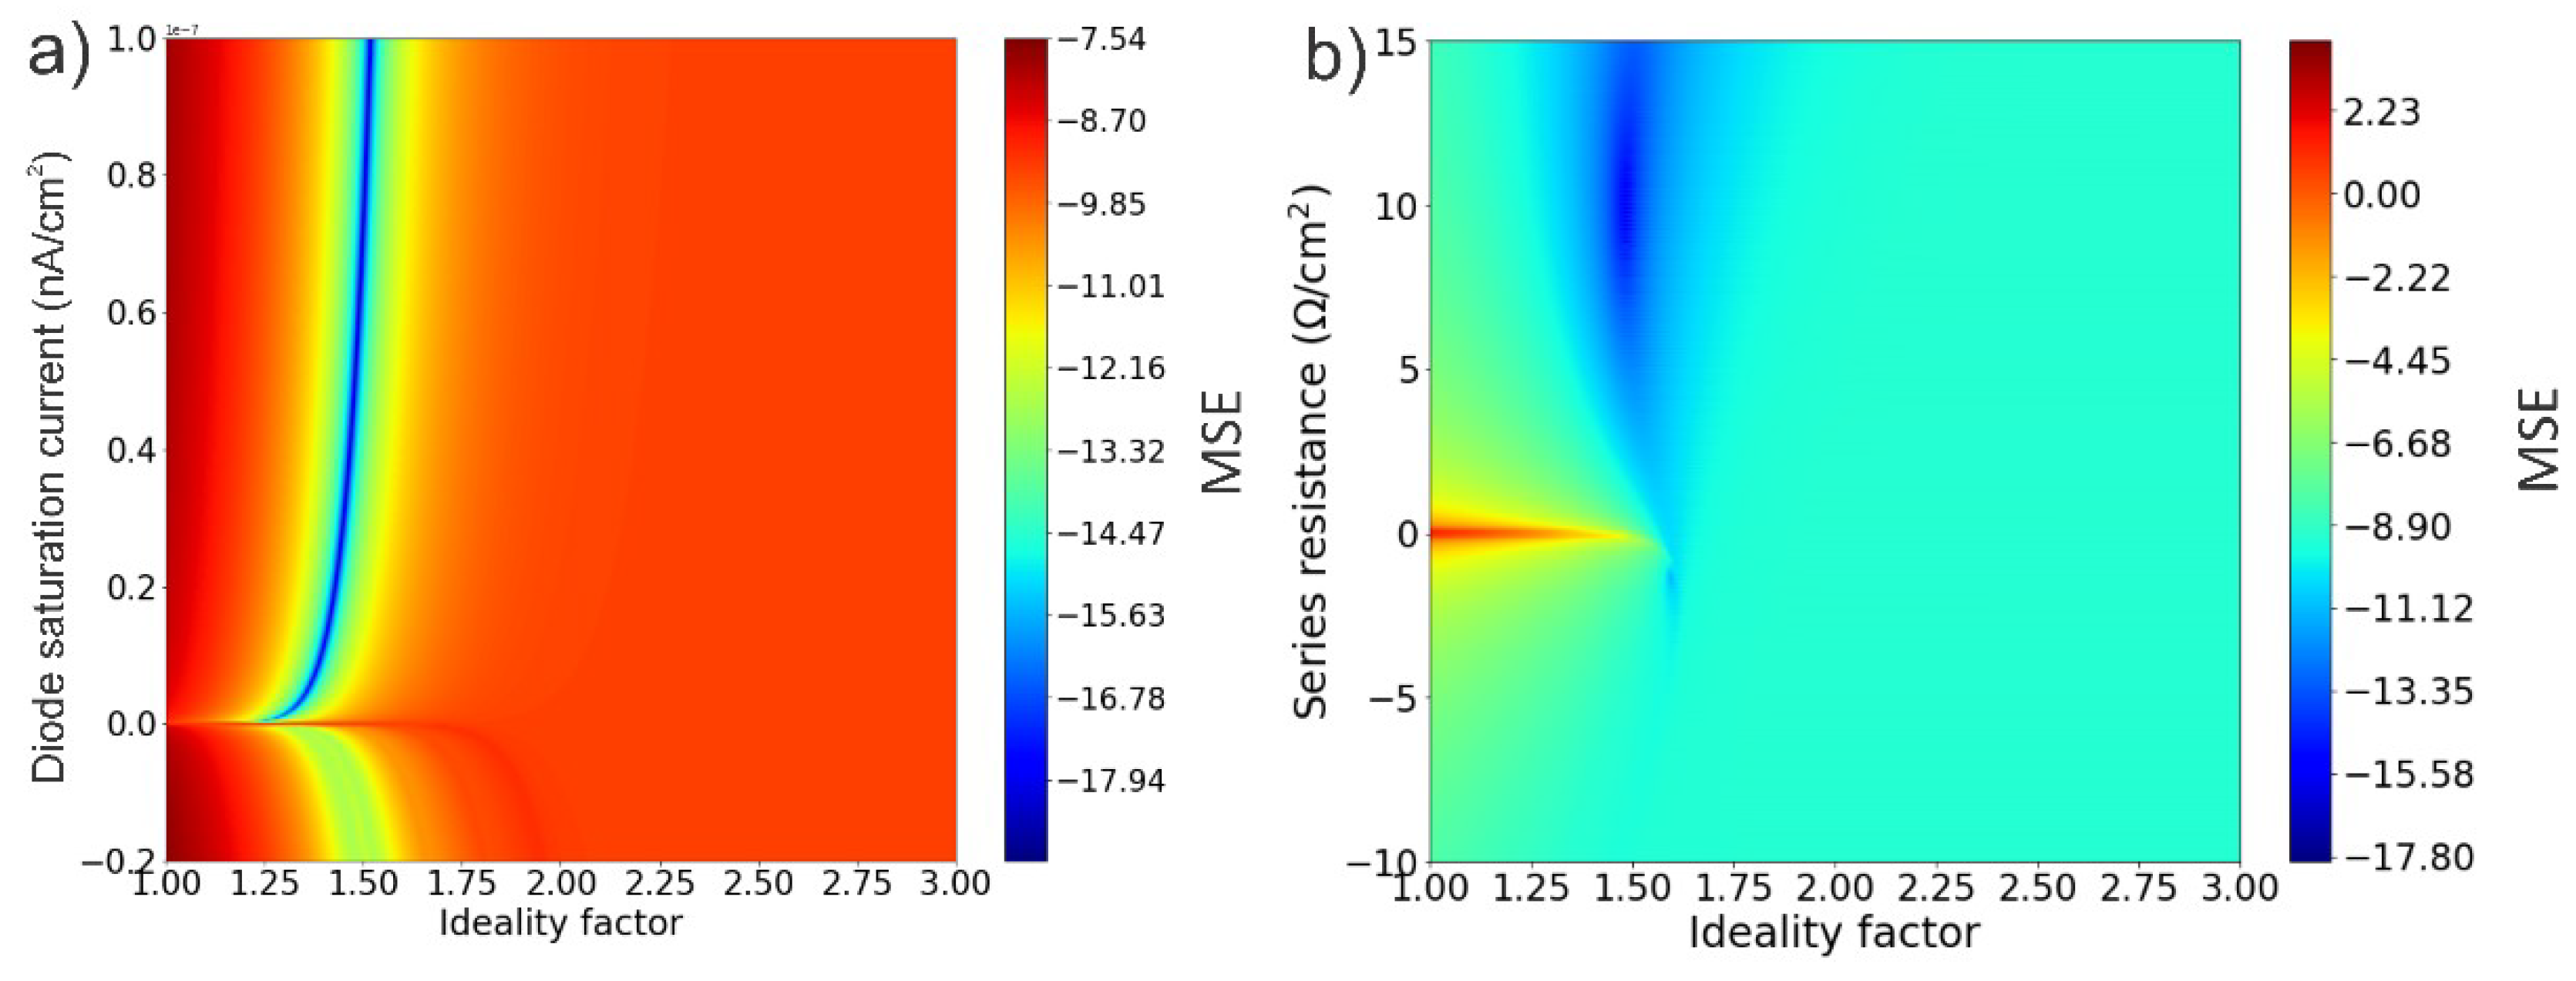
Due that Iph did not show significant changes (Table 4), a numerical sensibility analysis of error when considering the other four parameters was carried out with the aim to define feasible values. The MSE behavior as function of the estimated parameters is showed in Figure 2 and Figure 3 while considering the logarithm of the MSE to improve visualization.
These results illustrate that the problem of estimate these five parameters from the I-V curve is very sensitive to small differences in the parameters that are involved in the one-diode model equation. In the case of Io and n (Figure 2), a small increase on the ideality factor causes a great decrease on the exponential function value, which can be compensated by increasing the Io value and vice-versa. A small decrease on n can be compensated by decreasing the Io value or changing the series resistances by negative values (Figure 3a), behavior showed in Table 4. However, the Figure 2 suggested that the ideality factor has to be higher than 2.00 in order to minimize the MSE.
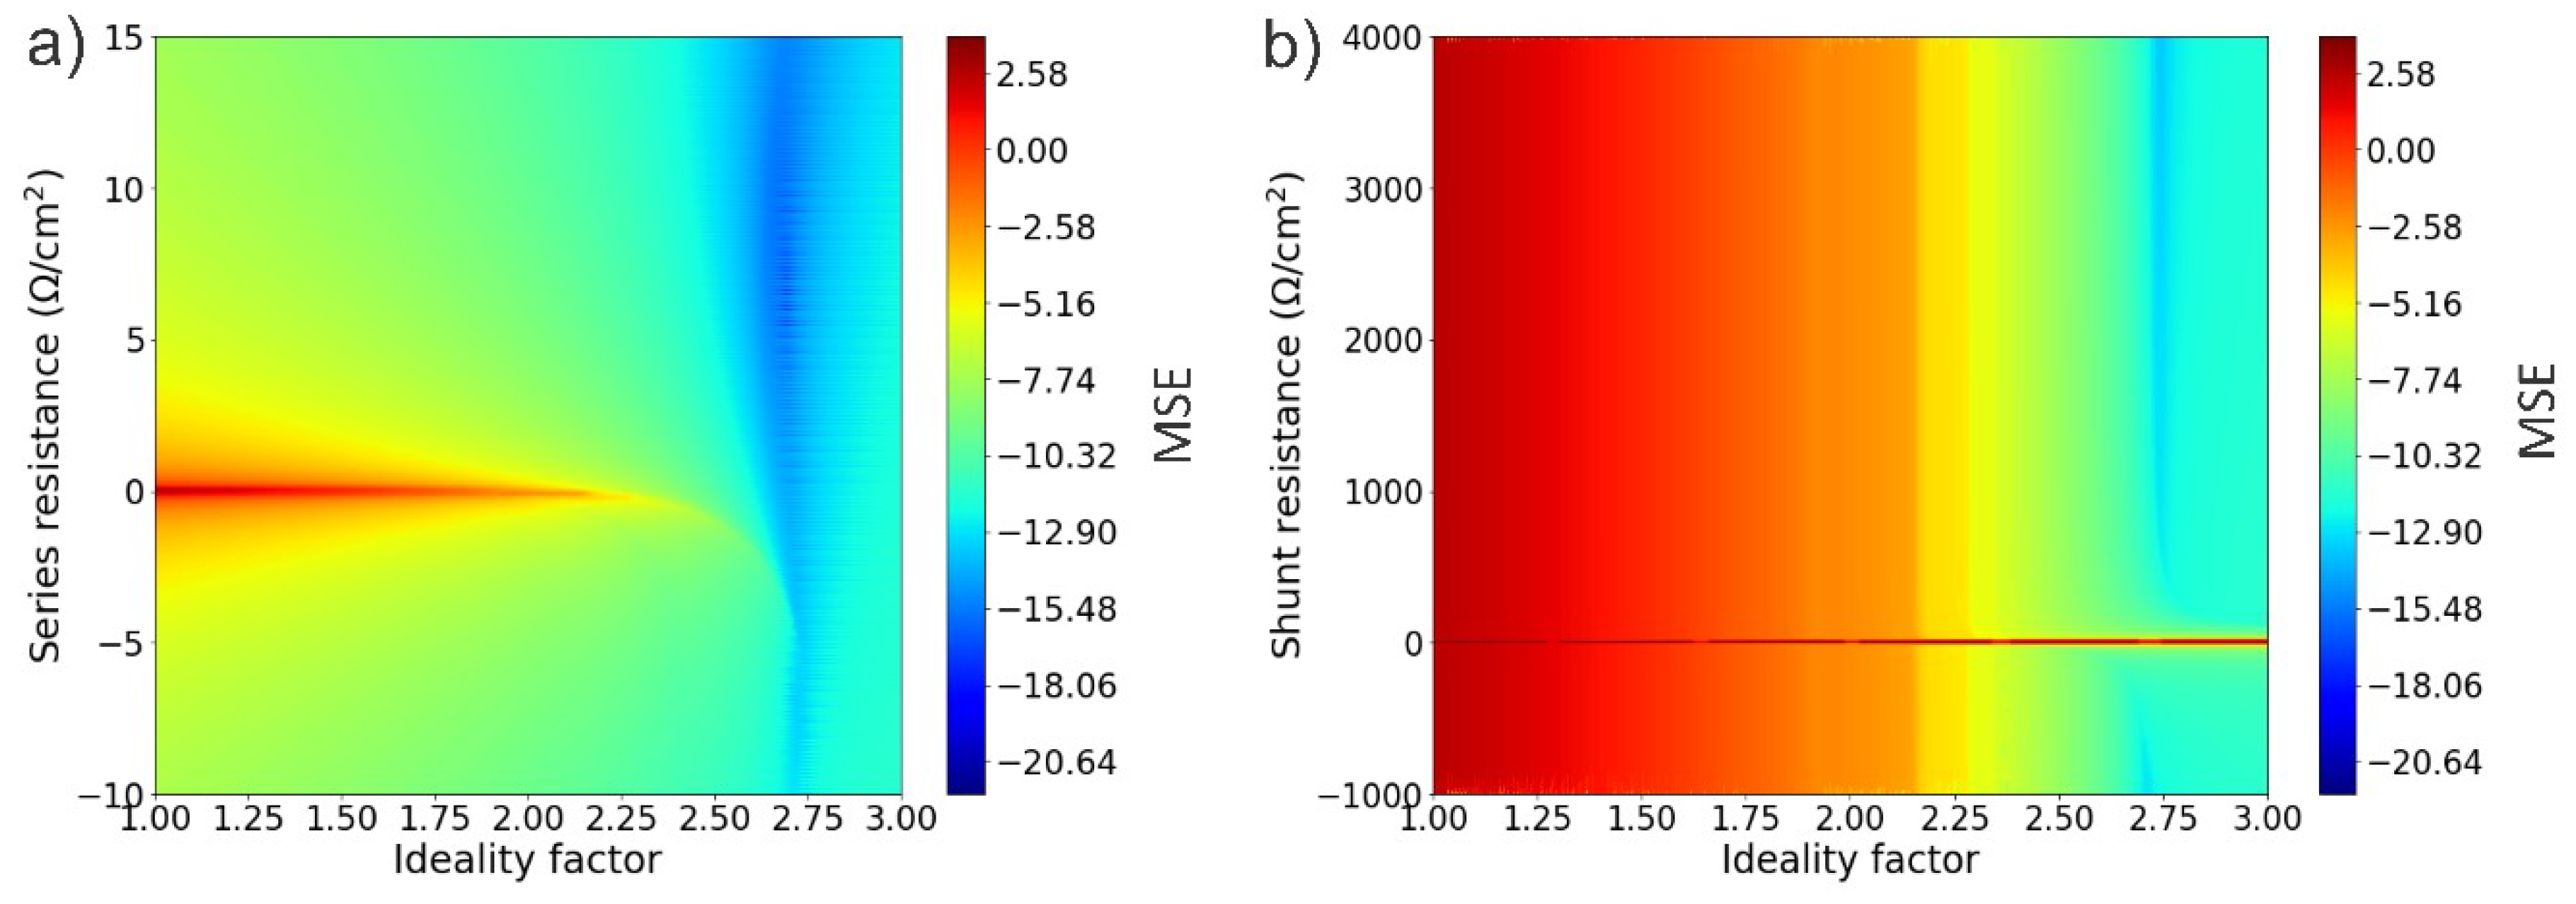
In the case of the resistances that are involved in the model, different local regions with lower errors are obtained, even with negative values, see Figure 3. In these cases, negative or unrealistic resistances, trends to increase the ideality factor and the saturation current to minimize the MSE. Similar behavior was shown by some exact methods (Table 4). Variation of Shunt resistance did not show significant changes on MSE (Figure 3b).
These graphical results suggested that this optimization problem is characterized by many feasible local minimums. However, due that the solution is a trade of between the five parameters, the realistic and reliable parameter values that describe the electrical performance of this cell and minimize the MSE correspond to the parameters shown in Table 4 by GA, this set of parameters can be considered as a global solution.
3.2. One-Diode Model Parameters for Perovskite Solar Cells
From the last results, it is easy to see why numerical methods that search for local solutions could be trapped in a specific region, and why methods, such as GA, which explore global solutions could perform better. Being the local minimums the most common issues in optimization problems. For that reason, the next analyses were carried out while using the GA method combined with the Nelder-Mead method to explore global solutions, refining the search, and minimizing the MSE [52]. Additionally, based on the relationship between the parameters involved in the one-diode equation that represents the electrical behavior showed by the I-V curve, a sensitive analysis is performed by changing the diode saturation current, ideality factor, and resistances obtained from the optimization process.
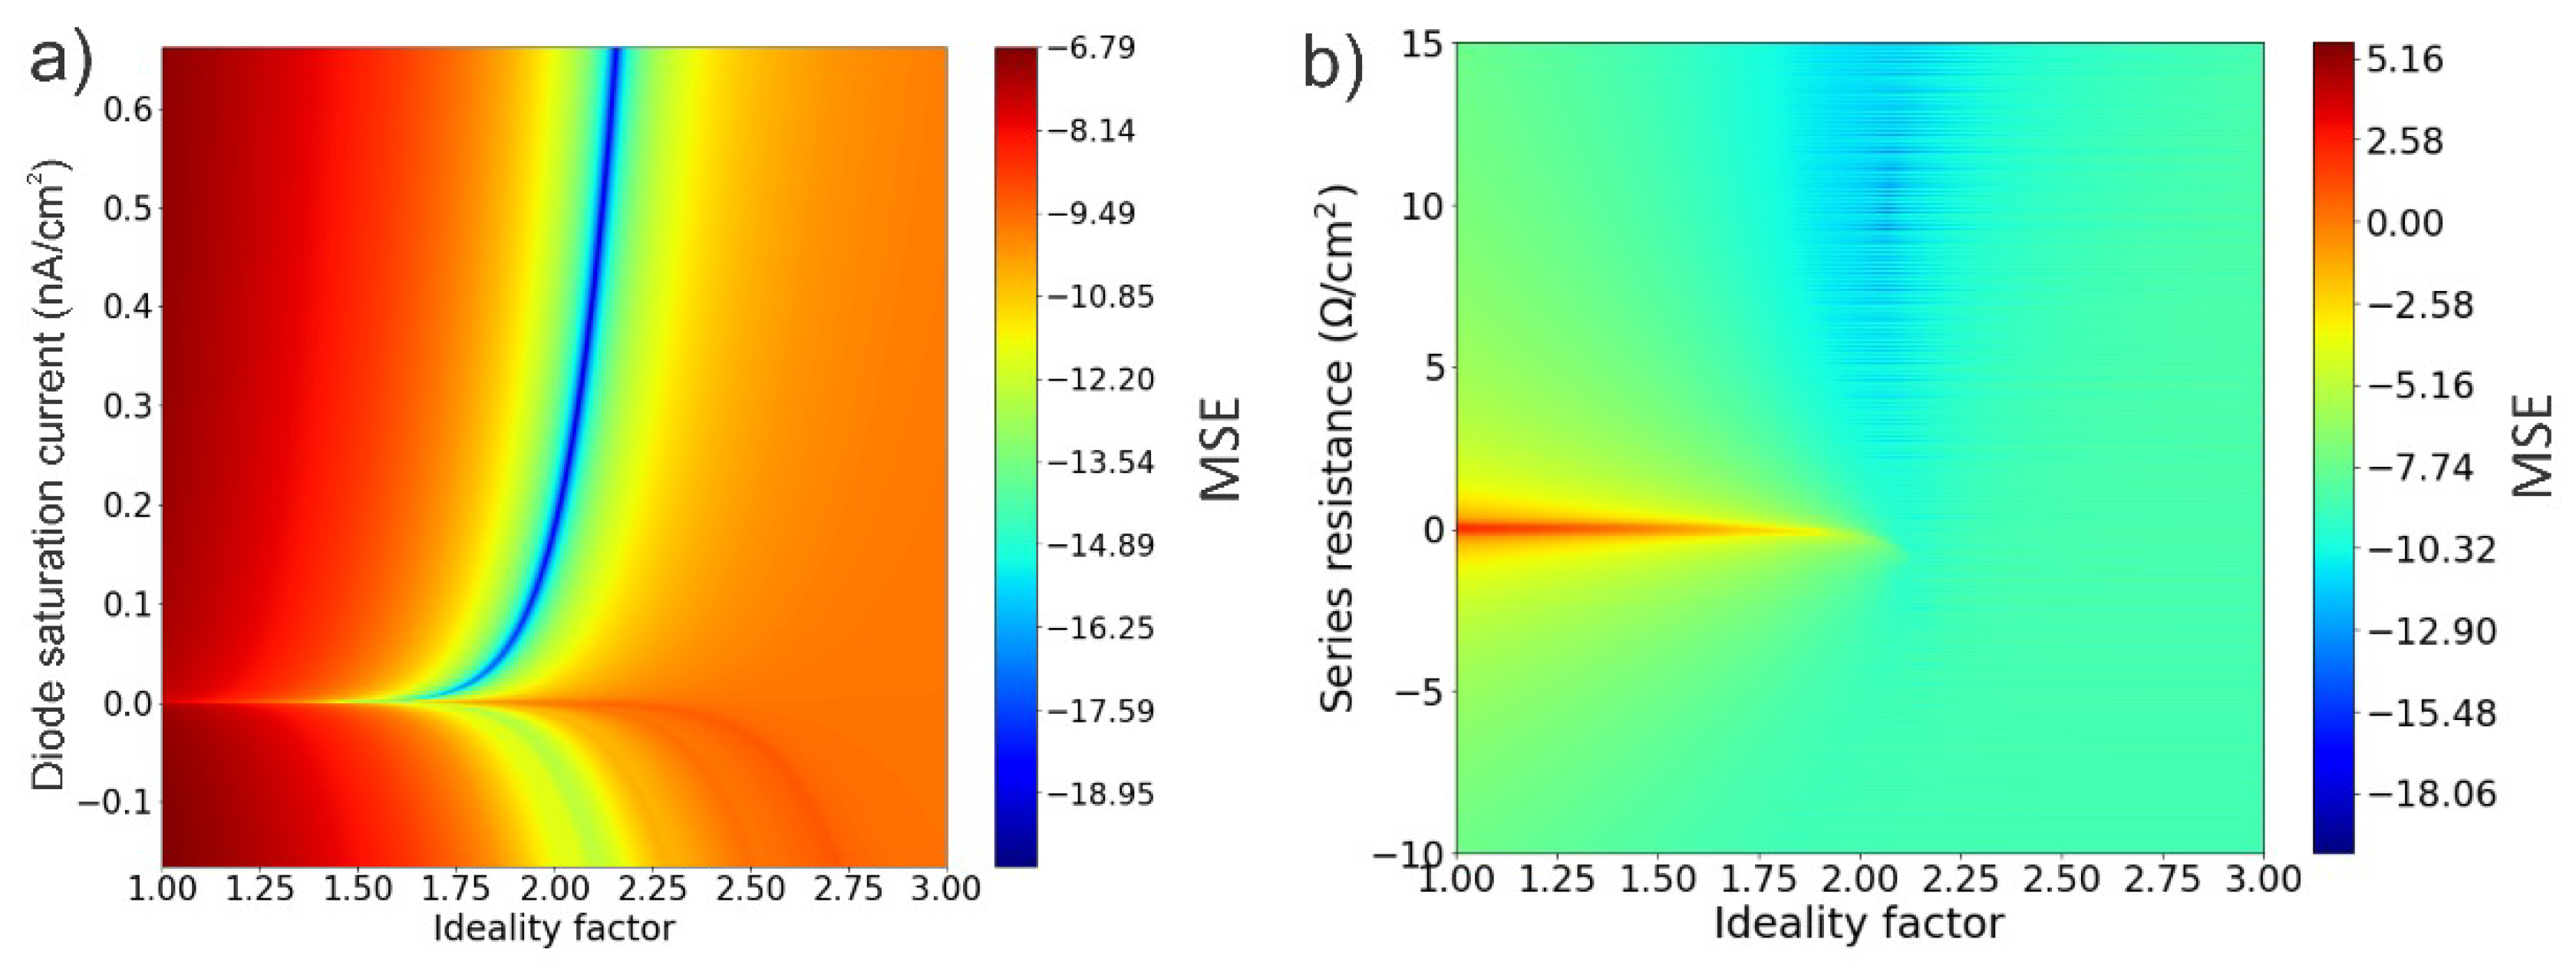
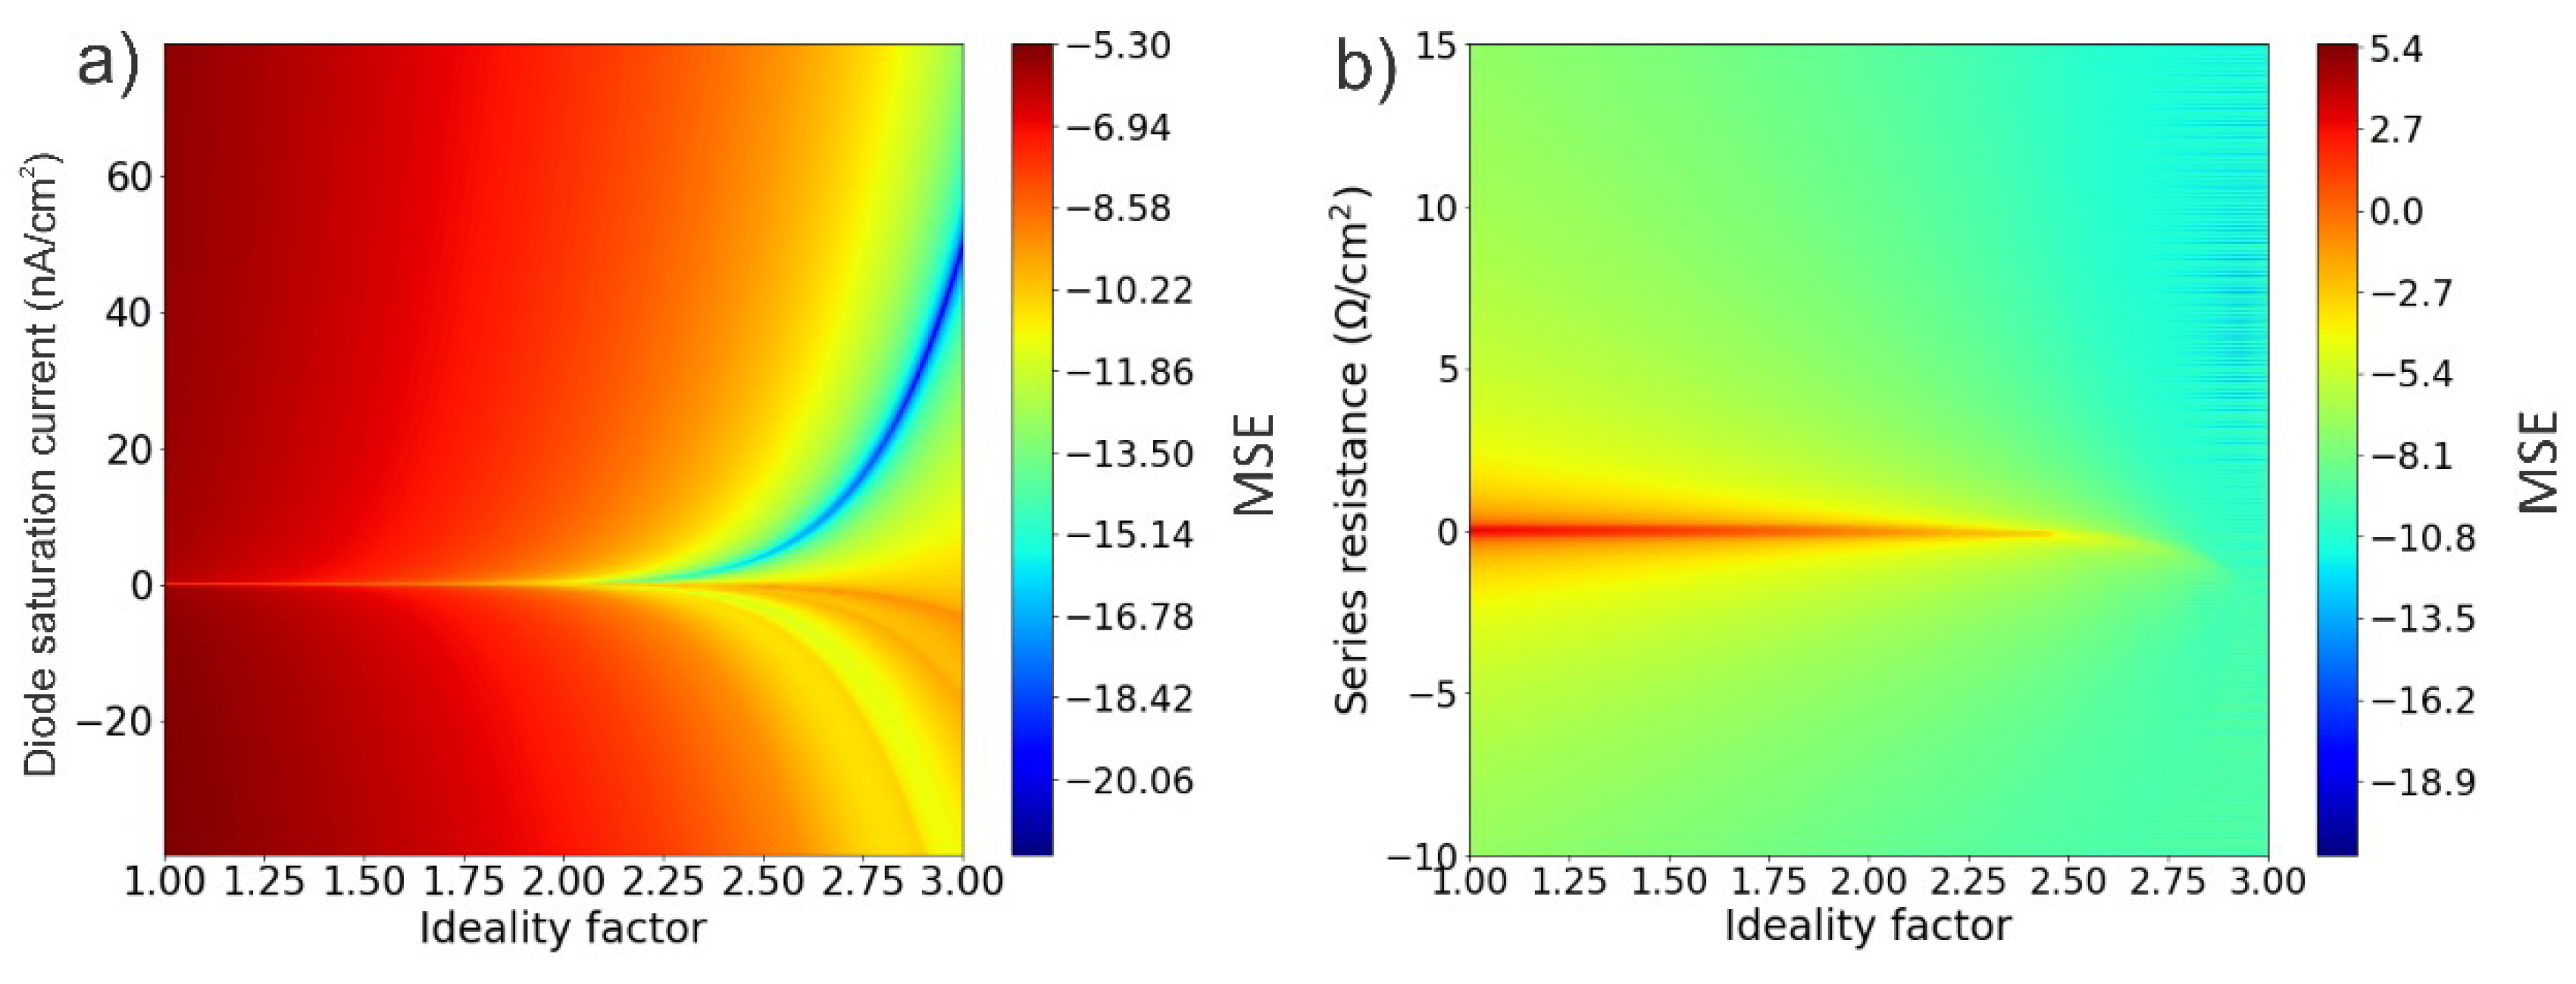
Figure 4, Figure 5 and Figure 6 showed representative cases of the sensitivity analysis of MSE. For each case, the feasible range for the ideality factor that minimize the MSE is shown. The complete set of parameters from the sensitivity analyses for all cells are shown in Table 5. Notice that the MSE is lower than 9 × 10⁻⁹ in all cases, indicating a successful fitting, as it was mentioned before.
As it can be seen in Table 5, the lower ideality factor corresponds to the device with higher efficiency. Devices with n in the expected range that are discussed in literature (between 1.7 and 2) are characterized by average series resistance of 9.78 Ω, average shunt resistances of 1672 Ω and Fill Factor higher than 0.5. Other cases related to n higher than 2.9 corresponded to lower efficiencies and FFs. This result is congruent with a defective cell or high loses effect due that variables, such as Rsh, Io, and n are reflected in the recombination processes.
4. Discussion
In order to determine feasible and reliable one-diode parameters that represent the electrical performance of PSC, five common exact methods that are proposed in literature were used to estimate the parameters based on the I-V curve. From these results, it was showed that sometimes, these exact methods could obtain parameter estimations with low fitting error but lacking physical meaning due to negative resistances and higher ideality factors, as it has been reported in literature [13]. However, by combining the GA with Nelder-Mead method, it was possible to explore global solutions and minimize the error between the data and model, being these errors lower than those published in the literature [2,13]. Becoming this procedure in a powerful tool to fully estimate the parameters that are related to one-diode model, avoiding issues, such as initial condition and physical or mathematical assumptions to simplify the optimization process.
Based on the MSE behavior showed graphically through maps as a function of the estimated parameters, it was possible to determine feasible and reliable solutions to the circuital model. Showing that the problem of estimate the one-diode model parameters from the I-V curve is very sensitive to small differences in the parameters that are involved, and that different parameter combinations lead to the reduction of the MSE even by solutions lacking physical meaning as negative resistances, being these results local minimal solutions defined by feasible, but not realistic, regions. However, MSE lower than 1 × 10⁻⁹ could be considered as a good metric to evaluate the performance fitting and determine the more meaningful and reliable parameter estimation. These solutions could be considered as a global minimum.
When considering the five parameters estimated for each perovskite solar cell at standard test condition. These results suggested that the ideality factor is in average close to 2 when the FF is higher than 0.5. In this sense, the ideality factor that was obtained for perovskite agreed with values published in literature using other measures, such as electroluminescence [25] or electrochemical impedances spectroscopy [37]. Lower FF are linked to ideality factor higher than 3 and low series resistances, fact that could be correlated to defects such as pinholes, which is reflected on the low shunt resistances, indicating high losses effects. An ideality factor of 1.4 was obtained for the best performing cell.
5. Conclusions
In this paper p-i-n perovskite solar cell with an active area of approximately 1 cm2 were fabricated and characterized. To estimate feasible and reliable parameters that are related to the one-diode model and represent the electrical performance of p-i-n PSC, two powerful numerical methods, called Nelder-Mead method and Genetic algorithm, were mixed. This procedure searches for global solution and no assumptions were required, ensuring errors lower than 1 × 10⁻⁹ in all cases.
The dependence of the error (MSE) to the one-diode model parameters were shown for first time graphically through maps with the aim to illustrate why different common numerical methods obtained lower errors and solutions lacking physical meaning as negative resistances. Based on this error behavior and considering that the fitted errors were lower than 1 × 10⁻⁹, the estimated parameters that represented the electrical performance of devices can be considered as a global minimum of the optimization problem.
This procedure is reliable to estimate not only the ideality factor, which is related to the quality of the cells, but the series and shunt resistances and the saturation current. Therefore, due to the I-V curve data of devices (that define their electrical performance in all operative points) at standard test conditions were considered, the estimated parameters represent these conditions, and for that, no extra measures, such as changing the light intensity, electroluminescence, or dark measures are necessary. From this way, we can estimate parameters related to electrical performance based on common data, such as described on solar devices datasheet.
Finally, based on the lower MSE obtained from the fitting process, it was possible to affirm that the one-diode model is suitable to model the I-V curve of perovskite solar cell technology, even for low performance devices characterized by low fill factor.
Author Contributions
Conceptualization, E.V., J.B.C., D.R. and F.J. Data curation, E.V., K.J., J.V. and D.R. Formal analysis, E.V. and D.R.; Funding acquisition, E.V. and F.J.; Investigation, E.V., J.B.C., K.J. and D.R. Methodology, E.V. Project administration, F.J. Software, E.V., K.J. and J.V. Supervision, J.B.C. and F.J. Validation, E.V. Visualization, E.V. Writing—original draft, E.V., J.B.C. and K.J. Writing—review & editing, E.V., J.B.C., J.V., D.R. and F.J.
Funding
This research received no external funding.
Acknowledgments
The author Esteban Velilla thanks Colombia’s Administrative Department of Science Technology and Innovation (COLCIENCIAS), for the national doctoral scholarship number 727-2015 and contract number FP44842-124-2017.
Conflicts of Interest
The authors declare no conflict of interest.
References
- Humada, A.M.; Hojabri, M.; Mekhilef, S.; Hamada, H.M. Solar cell parameters extraction based on single and double-diode models: A review. Renew. Sustain. Energy Rev. 2016, 56, 494–509. [Google Scholar] [CrossRef]
- Cotfas, D.T.; Cotfas, P.A.; Kaplanis, S. Methods to determine the dc parameters of solar cells: A critical review. Renew. Sustain. Energy Rev. 2013, 28, 588–596. [Google Scholar] [CrossRef]
- Wong, J. Griddler: Intelligent computer aided design of complex solar cell metallization patterns. In Proceedings of the IEEE Photovoltaic Specialists Conference, Proceedings of the 2013 IEEE 39th Photovoltaic Specialists Conference (PVSC), Tampa, FL, USA, 16–21 June 2013; IEEE: Piscataway, NJ, USA, 2013; pp. 933–938. [Google Scholar]
- Miyadera, T.; Ogo, H.; Taima, T.; Yamanari, T.; Yoshida, Y. Analytical model for the design principle of large-area solar cells. Sol. Energy Mater. Sol. Cells 2012, 97, 127–131. [Google Scholar] [CrossRef]
- Mellit, A.; Kalogirou, S.A. Artificial intelligence techniques for photovoltaic applications: A review. Prog. Energy Combust. Sci. 2008, 34, 574–632. [Google Scholar] [CrossRef]
- Karatepe, E.; Boztepe, M.; Colak, M. Neural network based solar cell model. Energy Convers. Manag. 2006, 47, 1159–1178. [Google Scholar] [CrossRef]
- Liao, P.; Zhao, X.; Li, G.; Shen, Y.; Wang, M. A New Method for Fitting Current–Voltage Curves of Planar Heterojunction Perovskite Solar Cells. Nano-Micro Lett. 2018, 10, 5. [Google Scholar] [CrossRef]
- Ciulla, G.; Lo Brano, V.; Di Dio, V.; Cipriani, G. A comparison of different one-diode models for the representation of I-V characteristic of a PV cell. Renew. Sustain. Energy Rev. 2014, 32, 684–696. [Google Scholar] [CrossRef]
- Chegaar, M.; Nehaoua, N.; Bouhemadou, A. Organic and inorganic solar cells parameters evaluation from single I-V plot. Energy Convers. Manag. 2008, 49, 1376–1379. [Google Scholar] [CrossRef]
- Easwarakhanthan, T.; Bottin, J.; Bouhouch, I.; Boutrit, C. Nonlinear Minimization Algorithm for Determining the Solar Cell Parameters with Microcomputers. Int. J. Sol. Energy 1986, 4, 1–12. [Google Scholar] [CrossRef]
- Boutana, N.; Mellit, A.; Haddad, S.; Rabhi, A.; Pavan, A.M. An explicit I-V model for photovoltaic module technologies. Energy Convers. Manag. 2017, 138, 400–412. [Google Scholar] [CrossRef]
- Lim, L.H.I.; Ye, Z.; Ye, J.; Yang, D.; Du, H. A linear method to extract diode model parameters of solar panels from a single I-V curve. Renew. Energy 2015, 76, 135–142. [Google Scholar] [CrossRef]
- Bashahu, M.; Nkundabakura, P. Review and tests of methods for the determination of the solar cell junction ideality factors. Sol. Energy 2007, 81, 856–863. [Google Scholar] [CrossRef]
- Wang, G.; Zhao, K.; Shi, J.; Chen, W.; Zhang, H.; Yang, X.; Zhao, Y. An iterative approach for modeling photovoltaic modules without implicit equations. Appl. Energy 2017, 202, 189–198. [Google Scholar] [CrossRef]
- Mialhe, P.; Charles, J.P.; Khoury, A.; Bordure, G. The diode quality factor of solar cells under illumination. Appl. Phys. 1986, 19, 483–492. [Google Scholar] [CrossRef]
- Li, Y.; Huang, W.; Huang, H.; Hewitt, C.; Chen, Y.; Fang, G.; Carroll, D.L. Evaluation of methods to extract parameters from current-voltage characteristics of solar cells. Sol. Energy 2013, 90, 51–57. [Google Scholar] [CrossRef]
- Khan, F.; Baek, S.H.; Park, Y.; Kim, J.H. Extraction of diode parameters of silicon solar cells under high illumination conditions. Energy Convers. Manag. 2013, 76, 421–429. [Google Scholar] [CrossRef]
- Wetzelaer, G.A.H.; Kuik, M.; Lenes, M.; Blom, P.W.M. Origin of the dark-current ideality factor in polymer:fullerene bulk heterojunction solar cells. Appl. Phys. Lett. 2011, 99, 2011–2014. [Google Scholar] [CrossRef]
- Ishibashi, K.I.; Kimura, Y.; Niwano, M. An extensively valid and stable method for derivation of all parameters of a solar cell from a single current-voltage characteristic. J. Appl. Phys. 2008, 103, 1–7. [Google Scholar] [CrossRef]
- Chan, D.S.H.; Phillips, J.R.; Phang, J.C.H. A comparative study of extraction methods for solar cell model parameters. Solid State Electron. 1986, 29, 329–337. [Google Scholar] [CrossRef]
- Araki, K.; Yamaguchi, M. Novel equivalent circuit model and statistical analysis in parameters identification. Sol. Energy Mater. 2003, 75, 457–466. [Google Scholar] [CrossRef]
- Caracciolo, F.; Dallago, E.; Finarelli, D.G.; Liberale, A.; Merhej, P. Single-variable optimization method for evaluating solar cell and solar module parameters. IEEE J. Photovolt. 2012, 2, 173–180. [Google Scholar] [CrossRef]
- Villalva, M.G.; Gazoli, J.R.; Filho, E.R. Comprehensive Approach to Modeling and Simulation of Photovoltaic Arrays. IEEE Trans. Power Electron. 2009, 24, 1198–1208. [Google Scholar] [CrossRef]
- Green, M.A. Solar cell fill factors: General graph and empirical expressions. Solid State Electron. 1981, 24, 788–789. [Google Scholar] [CrossRef]
- Tress, W.; Yavari, M.; Domanski, K.; Yadav, P.; Niesen, B.; Correa, P. Interpretation and evolution of open-circuit voltage, recombination, ideality factor and subgap irreversible degradation of perovskite solar cells. Energy Environ. Sci. 2017, 11, 151–165. [Google Scholar] [CrossRef]
- Kerr, M.J.; Cuevas, A. Generalized analysis of the illumination intensity vs. open-circuit voltage of solar cells. Sol. Energy 2004, 76, 263–267. [Google Scholar] [CrossRef]
- Ahaitouf, A.; Losson, E.; Bath, A. On the determination of interface state density in n-InP Schottky structures by current-voltage measurements comparison with DLTS results. Solid State Electron. 2000, 44, 515–520. [Google Scholar] [CrossRef]
- Aberle, A.G.; Wenham, S.R.; Green, M.A. A new method for accurate measurements of the lumped series resistance of solar cells. In Proceedings of the 23rd IEEE Photovoltic Specialists Conference, Louisville, KY, USA, 10–14 May 1993; pp. 133–139. [Google Scholar] [CrossRef]
- Kennerud, K. Analysis of Performance Degradation in CdS Solar Cells. IEEE Trans. Aerosp. Electron. Syst. 1969, AES-5, 912–917. [Google Scholar] [CrossRef]
- Jain, A.; Kapoor, A. A new method to determine the diode ideality factor of real solar cell using Lambert W-function. Sol. Energy Mater. Sol. Cells 2005, 85, 391–396. [Google Scholar] [CrossRef]
- Murayama, M.; Mori, T. Equivalent Circuit Analysis of Dye-Sensitized Solar Cell by Using One-Diode Model: Effect of Carboxylic Acid Treatment of TiO2 Electrode. Jpn. J. Appl. Phys. 2006, 45, 542–545. [Google Scholar] [CrossRef]
- Chegaar, M.; Azzouzi, G.; Mialhe, P. Simple parameter extraction method for illuminated solar cells. Solid State Electron. 2006, 50, 1234–1237. [Google Scholar] [CrossRef]
- Wetzelaer, G.J.A.H.; Scheepers, M.; Sempere, A.M.; Momblona, C.; Ávila, J.; Bolink, H.J. Trap-Assisted Non-Radiative Recombination in Organic-Inorganic Perovskite Solar Cells. Adv. Mater. 2015, 27, 1837–1841. [Google Scholar] [CrossRef] [PubMed]
- Agarwal, S.; Seetharaman, M.; Kumawat, N.K.; Subbiah, A.S.; Sarkar, S.K.; Kabra, D.; Namboothiry, M.A.G.; Nair, P.R. On the uniqueness of ideality factor and voltage exponent of perovskite-based solar cells. J. Phys. Chem. Lett. 2014, 5, 4115–4121. [Google Scholar] [CrossRef] [PubMed]
- Marinova, N.; Tress, W.; Humphry-Baker, R.; Dar, M.I.; Bojinov, V.; Zakeeruddin, S.M.; Nazeeruddin, M.K.; Grätzel, M. Light Harvesting and Charge Recombination in CH3NH3Pbi3 Perovskite Solar Cells Studied by Hole Transport Layer Thickness Variation. ACS Nano 2015, 9, 4200–4209. [Google Scholar] [CrossRef] [PubMed]
- Singh, T.; Miyasaka, T. Stabilizing the Efficiency Beyond 20% with a Mixed Cation Perovskite Solar Cell Fabricated in Ambient Air under Controlled Humidity. Adv. Energy Mater. 2017, 8, 1700677. [Google Scholar] [CrossRef]
- Almora, O.; Cho, K.T.; Aghazada, S.; Zimmermann, I.; Matt, G.J.; Brabec, C.J.; Nazeeruddin, M.K.; Garcia-Belmonte, G. Discerning recombination mechanisms and ideality factors through impedance analysis of high-efficiency perovskite solar cells. Nano Energy 2018, 48, 63–72. [Google Scholar] [CrossRef]
- Fabregat-Santiago, F.; Kulbak, M.; Zohar, A.; Valles-Pelarda, M.; Hodes, G.; Cahen, D.; Mora-Sero, I. Deleterious effect of Negative Capacitance in the Performance of Halide Perovskite Solar Cells. ACS Energy Lett. 2017, 2, 2007–2013. [Google Scholar] [CrossRef]
- Ono, L.K.; Park, N.-G.; Zhu, K.; Huang, W.; Qi, Y. Perovskite Solar Cells—Towards Commercialization. ACS Energy Lett. 2017, 1749–1751, 1749–1751. [Google Scholar] [CrossRef]
- Galagan, Y.; Coenen, E.W.C.; Verhees, W.; Andriessen, R. Towards scaling up of perovskite solar cells and modules. J. Mater. Chem. A 2016, 4, 5700–5705. [Google Scholar] [CrossRef]
- Ciro, J.; Mesa, S.; Uribe, J.I.; Mejía Escobar, M.A.; Ramirez, D.; Montoya, J.F.; Betancur, R.; Yoo, H.-S.; Park, N.-G.; Jaramillo, F. Optimization of the Ag/PCBM interface by Rhodamine interlayer to enhance efficiency and stability of perovskite solar cells. Nanoscale 2017, 9, 9440–9446. [Google Scholar] [CrossRef] [PubMed]
- Phang, J.C.H.; Chan, D.S.H.; Phillips, J.R. Accurate analytical method for the extraction of solar cell model parameters. Electron. Lett. 1984, 20, 406–408. [Google Scholar] [CrossRef]
- De Blas, M.A.; Torres, J.L.; Prieto, E.; García, A. Selecting a suitable model for characterizing photovoltaic devices. Renew. Energy 2002, 25, 371–380. [Google Scholar] [CrossRef]
- Toledo, F.J.; Blanes, J.M. Analytical and quasi-explicit four arbitrary point method for extraction of solar cell single-diode model parameters. Renew. Energy 2016, 92, 346–356. [Google Scholar] [CrossRef]
- Bai, J.; Liu, S.; Hao, Y.; Zhang, Z.; Jiang, M.; Zhang, Y. Development of a new compound method to extract the five parameters of PV modules. Energy Convers. Manag. 2014, 79, 294–303. [Google Scholar] [CrossRef]
- Cubas, J.; Pindado, S.; Victoria, M. On the analytical approach for modeling photovoltaic systems behavior. J. Power Sources 2014, 247, 467–474. [Google Scholar] [CrossRef] [Green Version]
- Carrero, C.; Ramírez, D.; Rodríguez, J.; Platero, C.A. Accurate and fast convergence method for parameter estimation of PV generators based on three main points of the I-V curve. Renew. Energy 2011, 36, 2972–2977. [Google Scholar] [CrossRef]
- Zagrouba, M.; Sellami, A.; Bouaïcha, M.; Ksouri, M. Identification of PV solar cells and modules parameters using the genetic algorithms: Application to maximum power extraction. Sol. Energy 2010, 84, 860–866. [Google Scholar] [CrossRef]
- Ishaque, K.; Salam, Z.; Taheri, H.; Shamsudin, A. A critical evaluation of EA computational methods for Photovoltaic cell parameter extraction based on two diode model. Sol. Energy 2011, 85, 1768–1779. [Google Scholar] [CrossRef]
- Narváez, P.A.; López-Lezama, J.M.; Velilla, E. Ubicación de generación distribuida para minimización de pérdidas usando un algoritmo genético híbrido location of distributed generation for power losses reduction using a hybrid genetic algorithm. Inf. Technol. 2015, 26, 123–131. [Google Scholar] [CrossRef]
- Toledo, F.J.; Blanes, J.M. Geometric properties of the single-diode photovoltaic model and a new very simple method for parameters extraction. Renew. Energy 2014, 72, 125–133. [Google Scholar] [CrossRef]
- Velilla, E.; Villada, F.; Echeverría, F. Models of steel mass loss by atmospheric corrosion in Colombia using. Rev. Fac. Ing. Univ. Antioquia 2009, 80–87. [Google Scholar]
Figure 1.
I-V curve of perovskite solar cells.

Figure 2.
Mean Squared Error (MSE) behavior as function of ideality factor and diode saturation current for Cell 1. Bar on the right denotes the MSE logarithm.
Figure 2.
Mean Squared Error (MSE) behavior as function of ideality factor and diode saturation current for Cell 1. Bar on the right denotes the MSE logarithm.

Figure 3.
Mean Squared Error (MSE) behavior as function of ideality factor and series (a) and shunt (b) resistances for Cell 1. Bar on the right denotes MSE logarithm.
Figure 3.
Mean Squared Error (MSE) behavior as function of ideality factor and series (a) and shunt (b) resistances for Cell 1. Bar on the right denotes MSE logarithm.

Figure 4.
Mean Squared Error (MSE) behavior as function of the estimated parameters for cell 5. MSE as function of ideality factor and diode saturation current (a), and MSE as a function of the ideality factor and series resistance (b).
Figure 4.
Mean Squared Error (MSE) behavior as function of the estimated parameters for cell 5. MSE as function of ideality factor and diode saturation current (a), and MSE as a function of the ideality factor and series resistance (b).

Figure 5.
Mean Squared Error (MSE) behavior as function of the estimated parameters for cell 8. MSE as function of ideality factor and diode saturation current (a), and MSE as function of the ideality factor and series resistance (b).
Figure 5.
Mean Squared Error (MSE) behavior as function of the estimated parameters for cell 8. MSE as function of ideality factor and diode saturation current (a), and MSE as function of the ideality factor and series resistance (b).

Figure 6.
Mean Squared Error (MSE) behavior as function of the estimated parameters for cell 10. MSE as function of ideality factor and diode saturation current (a), and MSE as function of the ideality factor and series resistance (b).
Figure 6.
Mean Squared Error (MSE) behavior as function of the estimated parameters for cell 10. MSE as function of ideality factor and diode saturation current (a), and MSE as function of the ideality factor and series resistance (b).


Table 1.
Electrical performance of perovskite solar cells.
| Cell | Area (cm2) | Efficiency (%) | Fill Factors (FF) | Voc (V) | J (mA/cm2) |
|---|---|---|---|---|---|
| 1 | 1.000 | 4.674 | 0.674 | 0.878 | 7.889 |
| 2 | 1.000 | 4.683 | 0.328 | 0.776 | 18.376 |
| 3 | 1.000 | 4.622 | 0.344 | 0.789 | 17.044 |
| 4 | 1.000 | 5.024 | 0.331 | 0.850 | 17.858 |
| 5 | 1.200 | 10.684 | 0.598 | 0.947 | 18.866 |
| 6 | 1.500 | 9.813 | 0.638 | 0.992 | 15.508 |
| 7 | 1.350 | 10.458 | 0.652 | 1.021 | 15.722 |
| 8 | 1.000 | 12.188 | 0.671 | 1.010 | 17.978 |
| 9 | 1.000 | 10.948 | 0.668 | 1.011 | 16.215 |
| 10 | 1.000 | 9.349 | 0.592 | 0.968 | 16.306 |
| 11 | 1.000 | 9.408 | 0.642 | 0.990 | 14.811 |
Table 2.
Common assumptions in exact methods.
| No. | Assumptions | Implications |
|---|---|---|
| 1 | Neglect | |
| 2 | Neglect | |
| 3 | ||
| 4 | ||
| 5 | ||
| 6 | Neglect | |
| 7 | ||
| 8 | ||
| 9 | Neglect | |
| 10 | Neglect | |
| 11 |
Table 3.
Common exact methods and their assumptions (Assumptions numbered according to Table 2).
Table 3.
Common exact methods and their assumptions (Assumptions numbered according to Table 2).
| References | Assumptions | ||||||||||
|---|---|---|---|---|---|---|---|---|---|---|---|
| 1 | 2 | 3 | 4 | 5 | 6 | 7 | 8 | 9 | 10 | 11 | |
| [42] | X | X | X | X | X | ||||||
| [43] | X | X | X | ||||||||
| [44] | X | X | |||||||||
| [17] | X | X | X | X | X | X | |||||
| [45,46] | X | X | X | X | |||||||
Table 4.
One-Diode parameters for cell 1.
| Method | Error | Iph (mA/cm2) | Io (µA/cm2) | n | Rs (Ω·cm2) | Rsh (Ω·cm2) |
|---|---|---|---|---|---|---|
| [42] | 2.329 × 10⁻⁴ | 7.865 | 23.127 | 6.262 | −13.138 | 3623.148 |
| [43] | 2.326 × 10⁻⁴ | 7.848 | 17.834 | 5.997 | −10.588 | 3633.737 |
| [44,51] | 3.681 × 10⁻⁹ | 7.902 | 0.0288 | 2.743 | 5.980 | 3617.168 |
| [17] | 2.152 × 10⁻⁴ | 7.837 | 0.041 | 6.935 | −14.638 | 3623.148 |
| [45] | 3.056 × 10⁻⁴ | 7.872 | 3.471 | 4.720 | −7.912 | 3631.061 |
| [46] | 4.262 × 10⁻⁶ | 7.893 | 1.681 | 4.312 | 1.855 | 3621.293 |
| GA | 4.803 × 10⁻¹⁰ | 7.899 | 0.023 | 2.697 | 6.443 | 3392.119 |
Table 5.
One-diode parameters for Perovskite solar cells.
| Cell | Error | Iph (mA/cm2) | Io (nA) | n | Rs (Ω·cm2) | Rsh (Ω·cm2) |
|---|---|---|---|---|---|---|
| 1 | 4.803 × 10⁻¹⁰ | 7.899 | 0.023 | 2.697 | 6.443 | 3392.119 |
| 2 | 7.208 × 10⁻¹⁰ | 18.509 | 12,943.355 | 5.014 | 0.460 | 59.020 |
| 3 | 7.833 × 10⁻⁹ | 17.160 | 3088.873 | 4.100 | 0.200 | 67.629 |
| 4 | 1.102 × 10⁻⁹ | 17.933 | 1401.235 | 4.057 | 0.200 | 64.984 |
| 5 | 1.784 × 10⁻⁹ | 0.019 | 0.331 | 2.074 | 9.648 | 586.058 |
| 6 | 1.176 × 10⁻⁹ | 15.662 | 0.238 | 2.151 | 9.981 | 1195.976 |
| 7 | 9.913 × 10⁻⁹ | 15.852 | 0.240 | 2.216 | 9.661 | 1491.744 |
| 8 | 5.195 × 10⁻⁹ | 18.051 | 5.993 × 10⁻⁵ | 1.486 | 9.747 | 3184.295 |
| 9 | 2.060 × 10⁻⁹ | 16.263 | 3.976 × 10⁻³ | 1.780 | 9.979 | 3951.715 |
| 10 | 4.199 × 10⁻¹⁰ | 16.581 | 39.718 | 2.949 | 5.514 | 352.362 |
| 11 | 3.974 × 10⁻⁹ | 15.061 | 0.002 | 1.705 | 11.318 | 828.667 |
© 2018 by the authors. Licensee MDPI, Basel, Switzerland. This article is an open access article distributed under the terms and conditions of the Creative Commons Attribution (CC BY) license (http://creativecommons.org/licenses/by/4.0/).
Share and Cite
MDPI and ACS Style
Velilla, E.; Cano, J.B.; Jimenez, K.; Valencia, J.; Ramirez, D.; Jaramillo, F. Numerical Analysis to Determine Reliable One-Diode Model Parameters for Perovskite Solar Cells. Energies 2018, 11, 1963. https://doi.org/10.3390/en11081963
AMA Style
Velilla E, Cano JB, Jimenez K, Valencia J, Ramirez D, Jaramillo F. Numerical Analysis to Determine Reliable One-Diode Model Parameters for Perovskite Solar Cells. Energies. 2018; 11(8):1963. https://doi.org/10.3390/en11081963
Chicago/Turabian StyleVelilla, Esteban, Juan Bernardo Cano, Keony Jimenez, Jaime Valencia, Daniel Ramirez, and Franklin Jaramillo. 2018. "Numerical Analysis to Determine Reliable One-Diode Model Parameters for Perovskite Solar Cells" Energies 11, no. 8: 1963. https://doi.org/10.3390/en11081963
Note that from the first issue of 2016, this journal uses article numbers instead of page numbers. See further details here.