Possible Interactions and Interferences of Copper, Chromium, and Arsenic during the Gasification of Contaminated Waste Wood †


1
School of Water, Energy, and Environment, Cranfield University, Cranfield MK43 0AL, UK
2
Department of Chemistry, College of Science, University of Baghdad, Baghdad 10071, Iraq
*
Author to whom correspondence should be addressed.
†
This paper is an extended version of our paper published in the 9th International Renewable Energy Congress (IREC), Hammamet, Tunisia, 20–22 March 2018.
Energies 2018, 11(8), 1966; https://doi.org/10.3390/en11081966
Submission received: 3 July 2018
/
Revised: 25 July 2018
/
Accepted: 25 July 2018
/
Published: 28 July 2018
(This article belongs to the Special Issue Biomass Chars: Elaboration, Characterization and Applications Ⅱ)
Abstract
:A considerable proportion (about 64%) of biomass energy is produced from woody biomass (wood and its wastes). However, waste wood (WW) is very often contaminated with metal(loid) elements at concentrations leading to toxicity emissions and damages to facilities during thermal conversion. Therefore, procedures for preventing and/or alleviating the negative impacts of these elements require further development, particularly by providing informative and supportive information regarding the phase transformations of the metal(loid)s during thermal conversion processes. Although it is well known that phase transformation depends on different factors such as elements’ vaporization characteristics, operational conditions, and process configuration; however, the influences of reaction atmosphere composition in terms of interactions and interferences are rarely addressed. In response, since Cu, Cr, and As (CCA-elements) are the most regulated elements in woody biomass, this paper aims to explore the possible interactions and interferences among CCA-elements themselves and with Ca, Na, S, Cl, Fe, and Ni from reaction atmosphere composition perspectives during the gasification of contaminated WW. To do so, thermodynamic equilibrium calculations were performed for Boudouard reaction (BR) and partial combustion reaction (PCR) with temperature ranges of 0–1300 °C and 0–1800 °C, respectively, and both reactions were simulated under pressure conditions of 1, 20, and 40 atm. Refinement of the occurred interactions and interferences reveals that Ni-As interactions generate dominant species As2Ni5 and As8Ni11, which increase the solid–gaseous transformation temperature of As. Moreover, the interactions between Ca and Cr predominantly form C3Cr7; whereas the absence of Ca leads to Cr2Na2O4 causing instability in the Cr phase transformation.
1. Introduction
Waste wood (WW) is the term used for wood material that has previously been used for various purposes and is now being treated as a waste material; in the context of this study the waste wood is being utilized for energy production [1]. It comprises a wide variety of wood materials primarily from industrial and commercial activities and from construction and demolition operations [2,3]. Since it is collected from diverse sources, WW may contain both physical and chemical contaminants [1,4]. Physical contaminates can simply be separated by sorting or using mechanical techniques. However, the majority of chemical contaminants are usually linked to the metal(loid) elements contained in wood that has been treated with preservatives, paintings, coatings, and other related activities, and, of course, mechanical separation is not applicable.
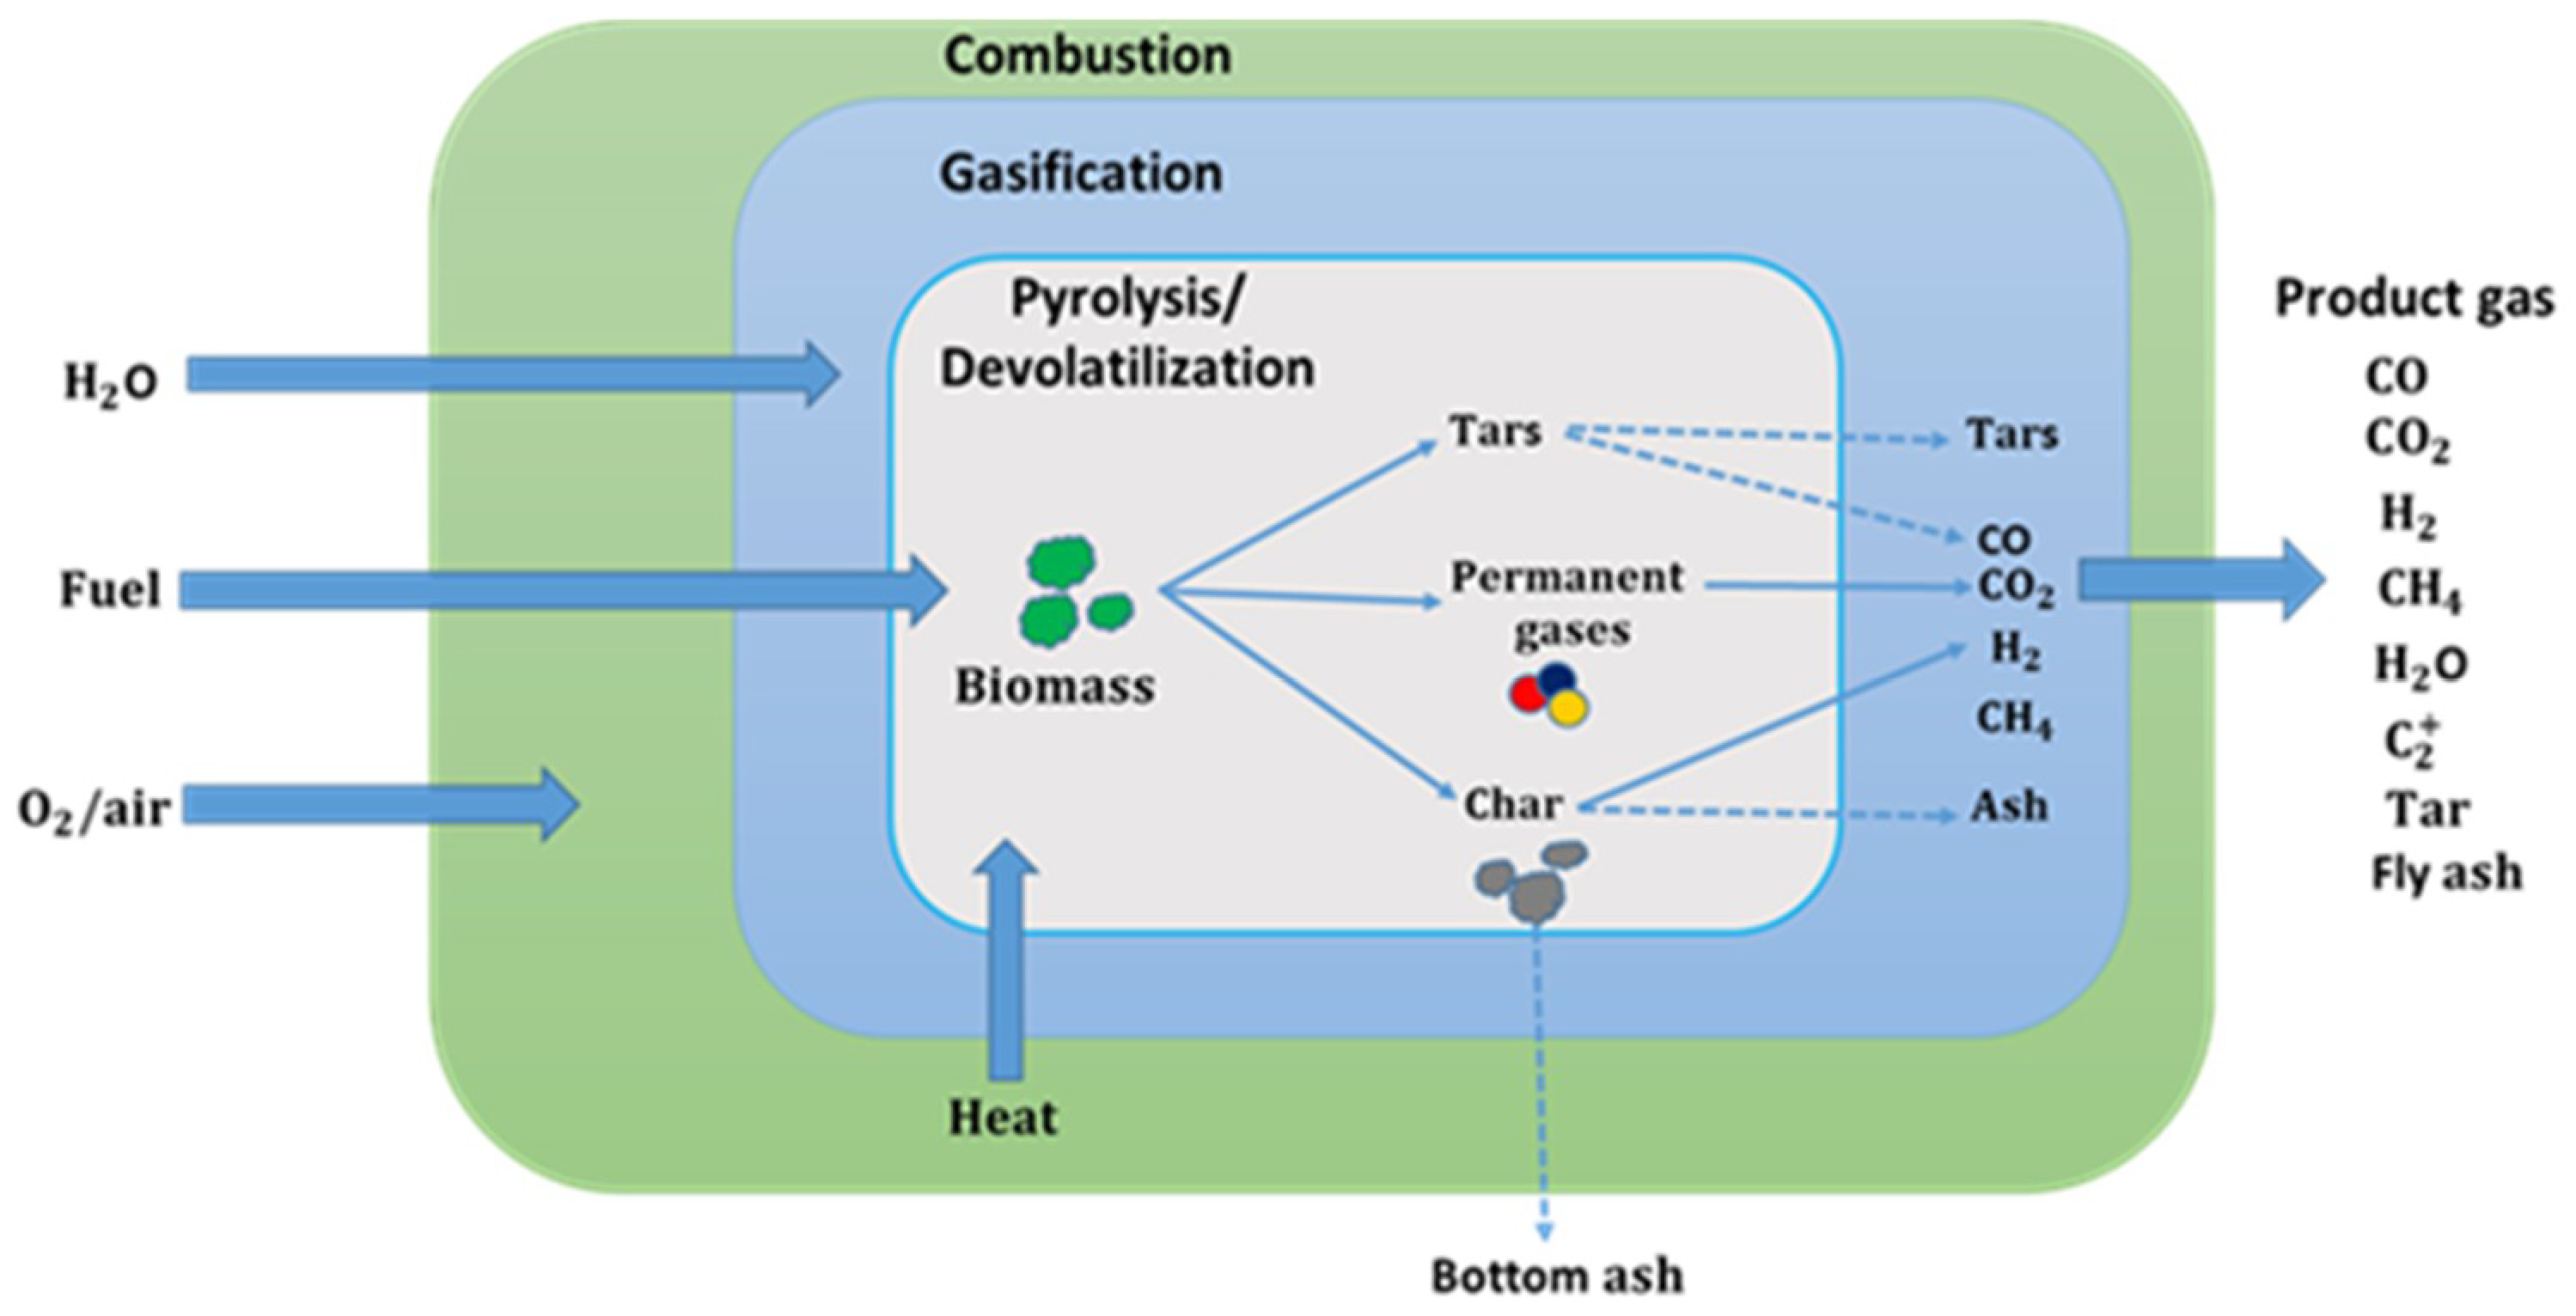
Essentially, gasification process involves the conversion of solid carbonaceous fuels into combustible gases composed of a mixture of N2, H2O, CH4, H2, CO2, CO, and very small quantities of low molecular weight hydrocarbons and contaminants including ash, tar, and carbon particles [5,6]. In general, biomass gasification consists of four processing steps: drying, pyrolysis of dried biomass particles (de-volatilization), partial oxidation of pyrolysis gases and/or char, and char gasification (reduction) [7], as depicted in Figure 1 [8]. Technically, gasification is an exothermic partial oxidation of biomass operating at high temperatures between 800 and 1300 °C with the presence of gasifying mediums such as carbon dioxide, steam, and air (or a mixture of air and steam) [7,9,10,11]. Further, the compositions and properties of the gasification products vary according to the operational conditions, gasifier type, and biomass materials.
Currently, because of its efficiency and flexibility [12], gasification is vastly employed for generating renewable energy and waste disposal. However, when conducting gasification, metal(loid)s in biomass can cause severe human health and environmental problems as well as significant technical damages when they present at high concentrations. Hence, to avoid and/or limit the risks of metal(loid) elements, the transformation behaviours of these elements across the different phases require further investigating.
A range of studies [13,14,15,16,17] have focused on the distribution of the metal(loid)s between gaseous and solid phases during gasification. These studies report that the partitioning of metal(loid) elements can be directly influenced by a combination of several factors such as feedstock characteristics, operational conditions, and process agents. In fact, phase transformation temperatures of metal(loid)s cannot be accurately determined using traditional analytical tools/instruments because the generated species cannot be easily identified, and hence measured. As such, the mass distribution of metal(loid) elements during gasification is a quite complex problem. Fortunately, thermodynamic equilibrium modelling based on Gibbs energy minimization has effectively been used for yielding the best predictions of the behaviours of metal(loid) elements, and in turn allowing for precise evaluation of the speciation during the thermochemical processes [18,19,20,21,22,23,24,25].
Jiang et al. [18] studied the solid–gaseous transition of Zn, Pb, Ni, Mn, Mg, Fe, Cu, Cr, Co, Cd, As, and Al in five biomass samples during typical gasification scenarios. This study reports that the most volatilized elements are As, Cd, Pb, and Zn, whereas Cu, Co, Ni, and Mn are moderately volatilized, and the phase transformation temperatures of Mg, Fe, Cr, and Al are > 1200 °C. Froment et al. [19] assessed the volatilization and condensation of certain elements in woody biomass during gasification with temperatures ranging from 500 to 1500 °C, and pressure conditions from 1 to 10 bar. The calculation results showed that Zn, Pb, Se, Sb, S, N, Hg, F, Cd, and Cl completely volatilized as either elemental or species, whereas, Ca, Si, Al, P, Cu, Mn, Ti, Fe, Cr, Mg, and Ba remained as oxides in the condensed phase, except copper which condensed as As. Kramb et al. [20] modelled the behavior of As during the gasification of CCA-treated wood, and reported that about 99.6% of As can be captured. Thompson and Argent [21] categorized the trace elements in a PRENLFO gasifier into “virtually immobile (Cr, Ba, Ni, V), somewhat mobile (Mo, Be, Cu), mobile (Sb, B) and almost totally mobilized (As, Cd, Pb, Sn, Zn)”. Kilgallon et al. [22] investigated the impacts of both pressure conditions and chlorine/sulphur on element phase transitions. Reed et al. [23] reported the speciation prediction of Cd, As, B, Co, Be, Pb, Cu, Sb, V, Sn, and Zn in fuel gas from a gasifier. They explicitly partitioned these elements into three groups: condensed phase (Cu, Be, V, Zn and Co; at ), gas phase (As without Ni, B without Ca, Sb, and Sn), and condensed phase (As with Ni, B with Ca, Cd, and Pb; at ). Liu et al. [24] also reported the speciation of Ni, As, Pb, Cd, Se, and Sb during underground coal gasification with specific agent injection and pressure. A study by Bradshaw et al. [25] showed that the elements Hg, As, Pb, Sb, Cd, Sn, Se, and Te, and alkali metals remained in fuel gas, and the species of Pb, Sb, and Cd can pass through the path of fuel gas forming surface deposits.
Although the modelling of phase transformation yields beneficial information (e.g., elemental vaporization and condensation, optimized operational conditions) about the distribution of metal(loid) elements, factors including the interactions and interferences among these elements cannot be ignored. In particular, metal(loid)s can interact and/or interfere, leading to the generation of new species, which may induce remarkable influence on the volatilization of metal(loid)s. At present, to the best of the authors’ knowledge, there has been no single study towards the assessment of occurred interferences between metal(loid)s during thermochemical processes. In fact, only a study by K. Svoboda [26] investigated the instantaneous interferences of both HF and HCl on H2S sorption. Also, two studies evaluated the effect of interactions on elemental behaviour during coal combustion. Contreras et al. [27] evaluated the interactions between Cd, As, Sb, and Hg, and pointed out that some species can be dominant under specific conditions. For example, As-Cd interaction forms , which reduces the concentration of gaseous oxides. Yan et al. [28] showed that interactions among Se, Hg, and As lead to the generation of and as dominant species under reduced conditions.
In this paper, thermodynamic equilibrium calculations were carried out to explore the possible interactions and interferences between Cu, Cr, and As (CCA-elements) themselves and with Ca, Na, S, Cl, Fe, and Ni in contaminated WW during two reactions of gasification: Boudouard reaction (BR) and partial combustion reaction (PCR). The calculations were performed using MTDATA software (Version 5.10, NPL, London, UK) to predict the phase transformation temperatures and speciation of the considered metal(loid)s. Moreover, contaminated WW samples with complete composition data were selected from the ECN PHYLLIS2 database [29] for the modelling.
2. Thermodynamic Equilibrium Modelling
Thermodynamic equilibrium modellings for Boudouard reaction (BR) and partial combustion reaction (PCR) were carried out using the multiphase module of the MTDATA software coupled with the Scientific Group Thermodata Europe (SGTE) database. With each modelling, the calculations were conducted to study the effects of the occurred interactions and interferences on the fate of the CCA-elements as consequence of different contents of CCA-elements and of Ca, Na, S, Cl, Fe, and Ni in WW samples.
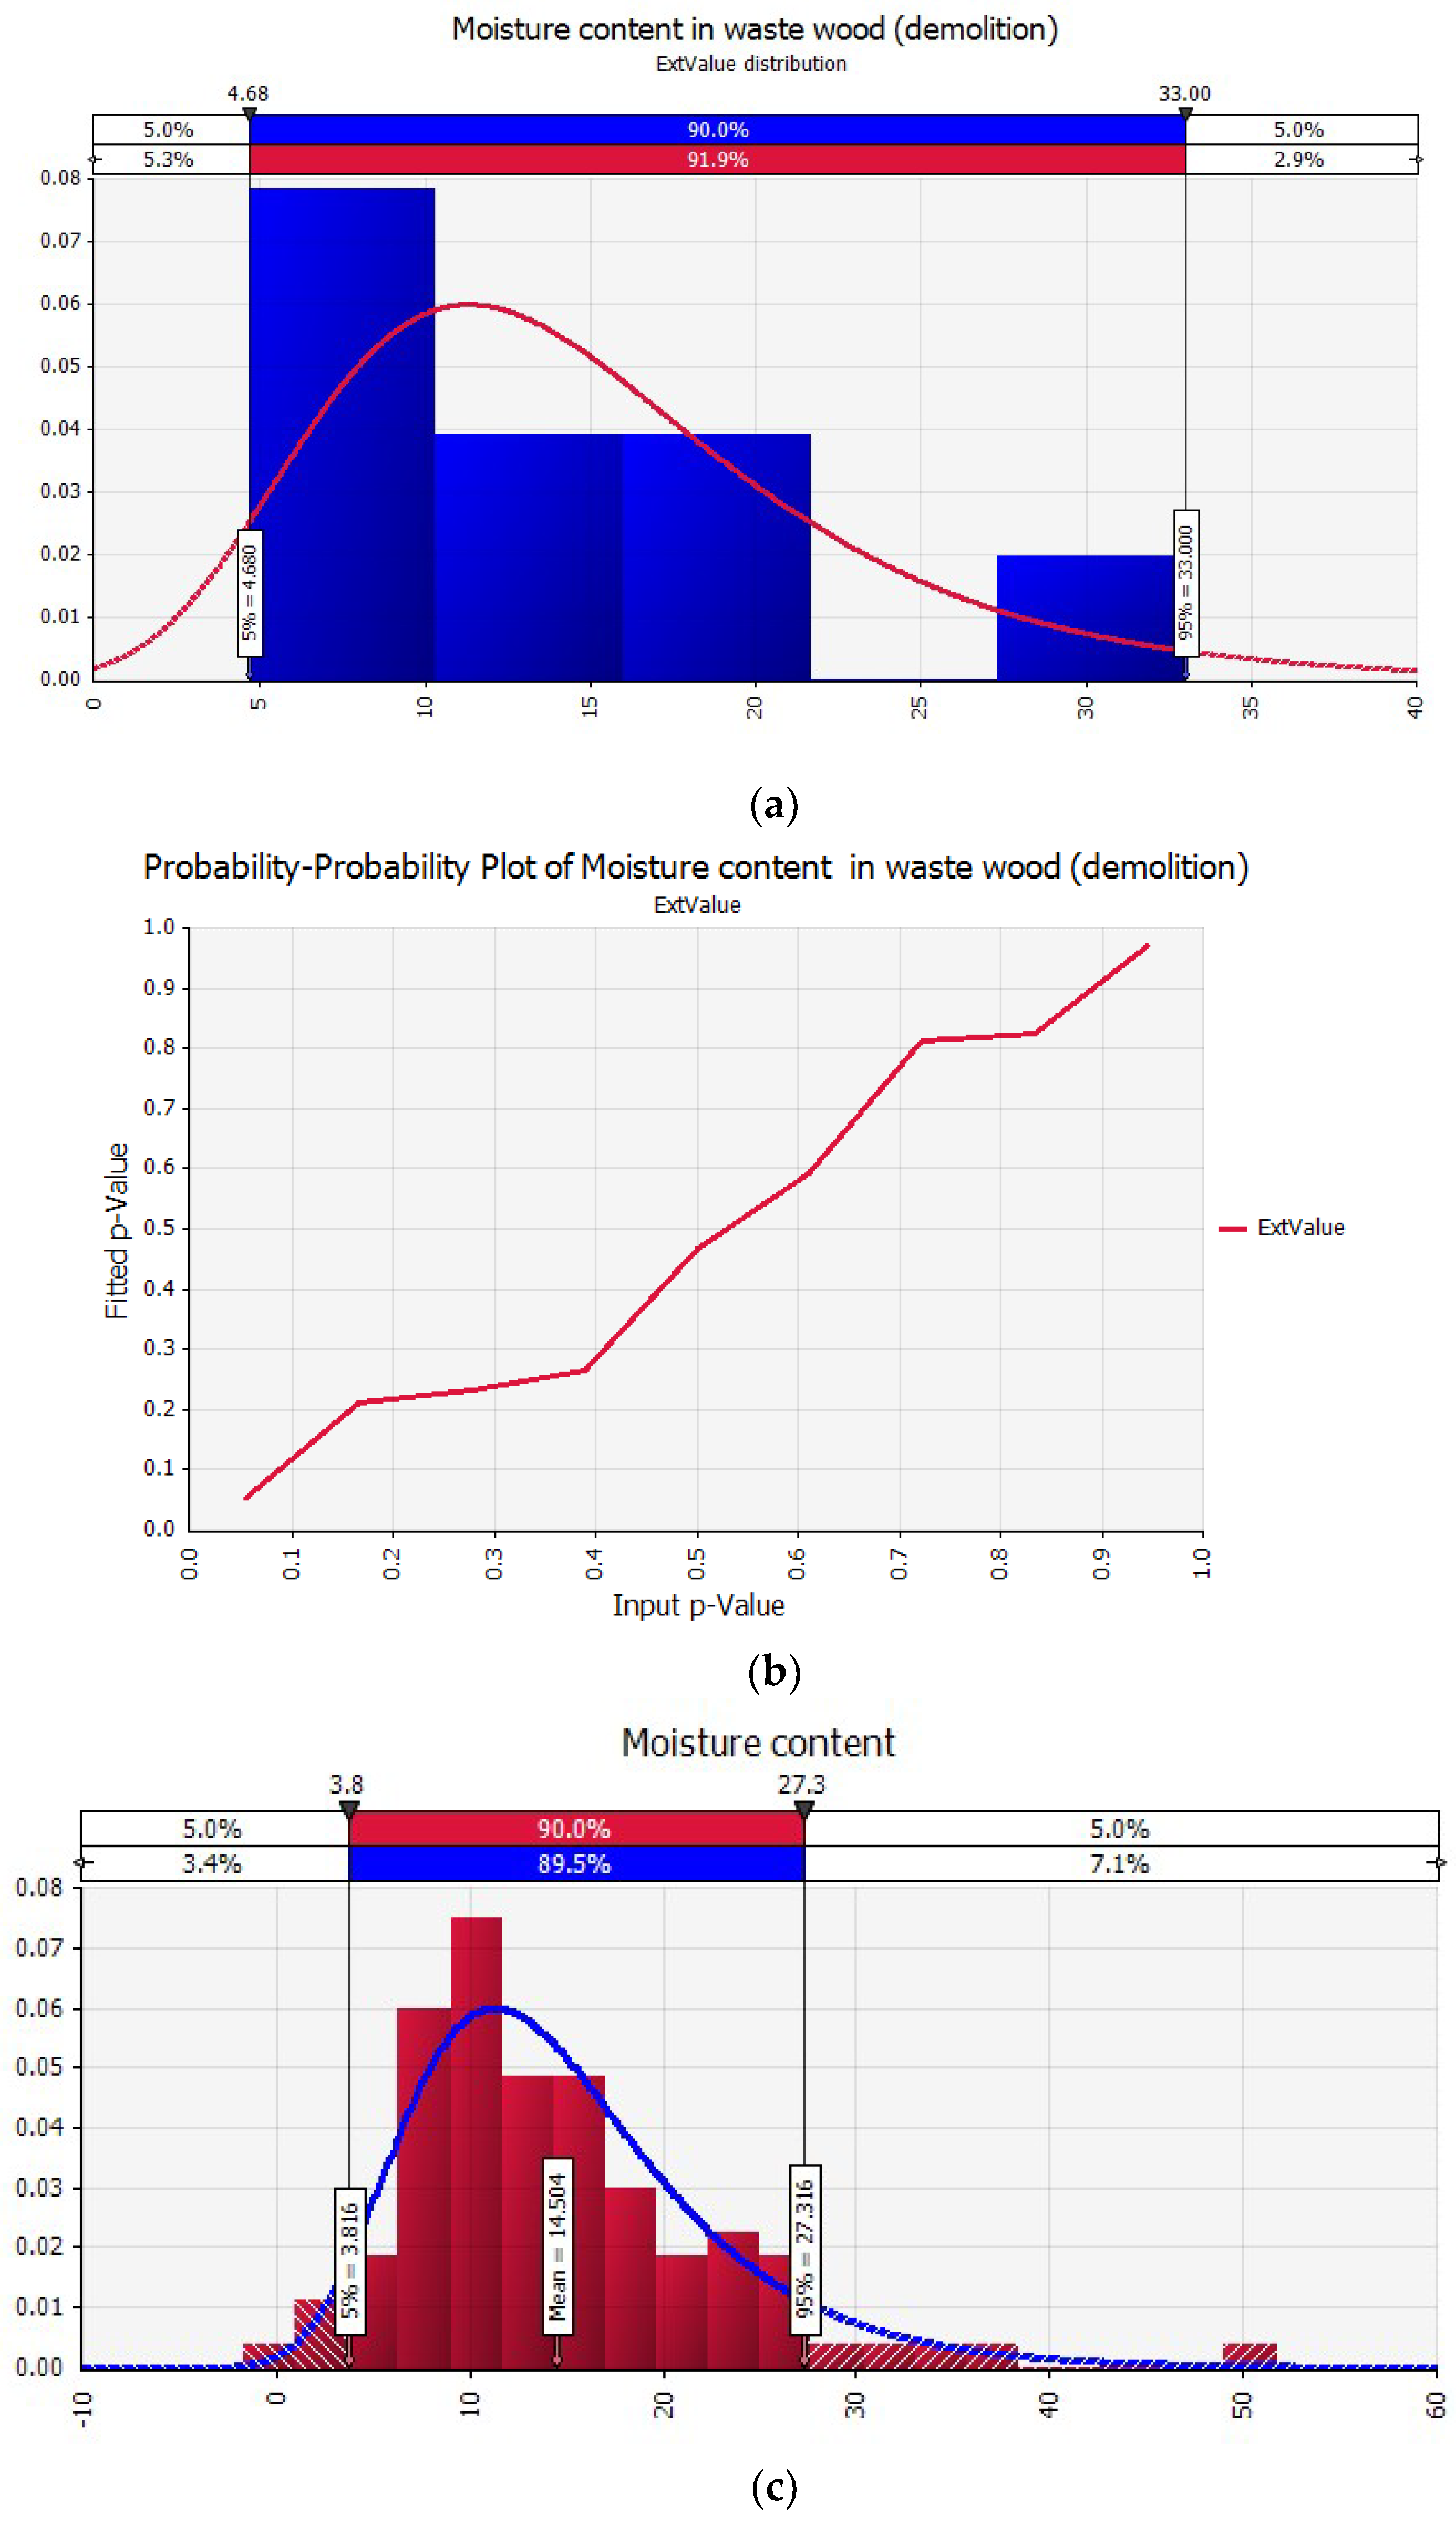
For model simulations, a primary search of the SGTE database was carried out to reveal the relevant species of CCA-elements. A complete list of the adopted species are given in Table 1. The best fit probability distributions of the composition data of the selected WW samples (#2712, #679, #1779, #1364, #871, #1448, #3498, #2901, #2900) [29] are estimated through the @Risk analysis simulation package (Version 6.1, Palisade Corp., Ithaca, NY, USA), and the estimation results are exhibited in Table 2. As an illustrative example, the statistical analysis of the moisture content is demonstrated in Figure 2. The elements to be introduced to the MTDATA were grouped into major elements (Ar, C, N, O, and H) and minor elements (As, Cr, Cu, Co, Cl, Ca, Ni, S, Na, and Fe). Note that the mass ranges of the minor elements, Table 3, were assumed inconsistent with the information provided by the ECN PHYLLIS2 database [29] concerning the contaminated woody biomass.
Moreover, the operational conditions and process agents for each reaction are presented in Table 4, in which the required oxygen for PCR and the required carbon dioxide for BR are determined using Equation (1) [30] and Equation (2) [7], respectively, as follows:
Note that the air composition (under standard dry at atmospheric pressure) consists of 1.28% Ar, 23.2% O2, 0.046% CO2, and 75.47% N2. Biomass feed rates for both reactions were calculated by means of the higher heating value () from Equation (3) [30].
3. Results and Discussion
3.1. Under Partial Combustion Reaction (PCR)
3.1.1. Equilibrium Composition of CCA-Elements
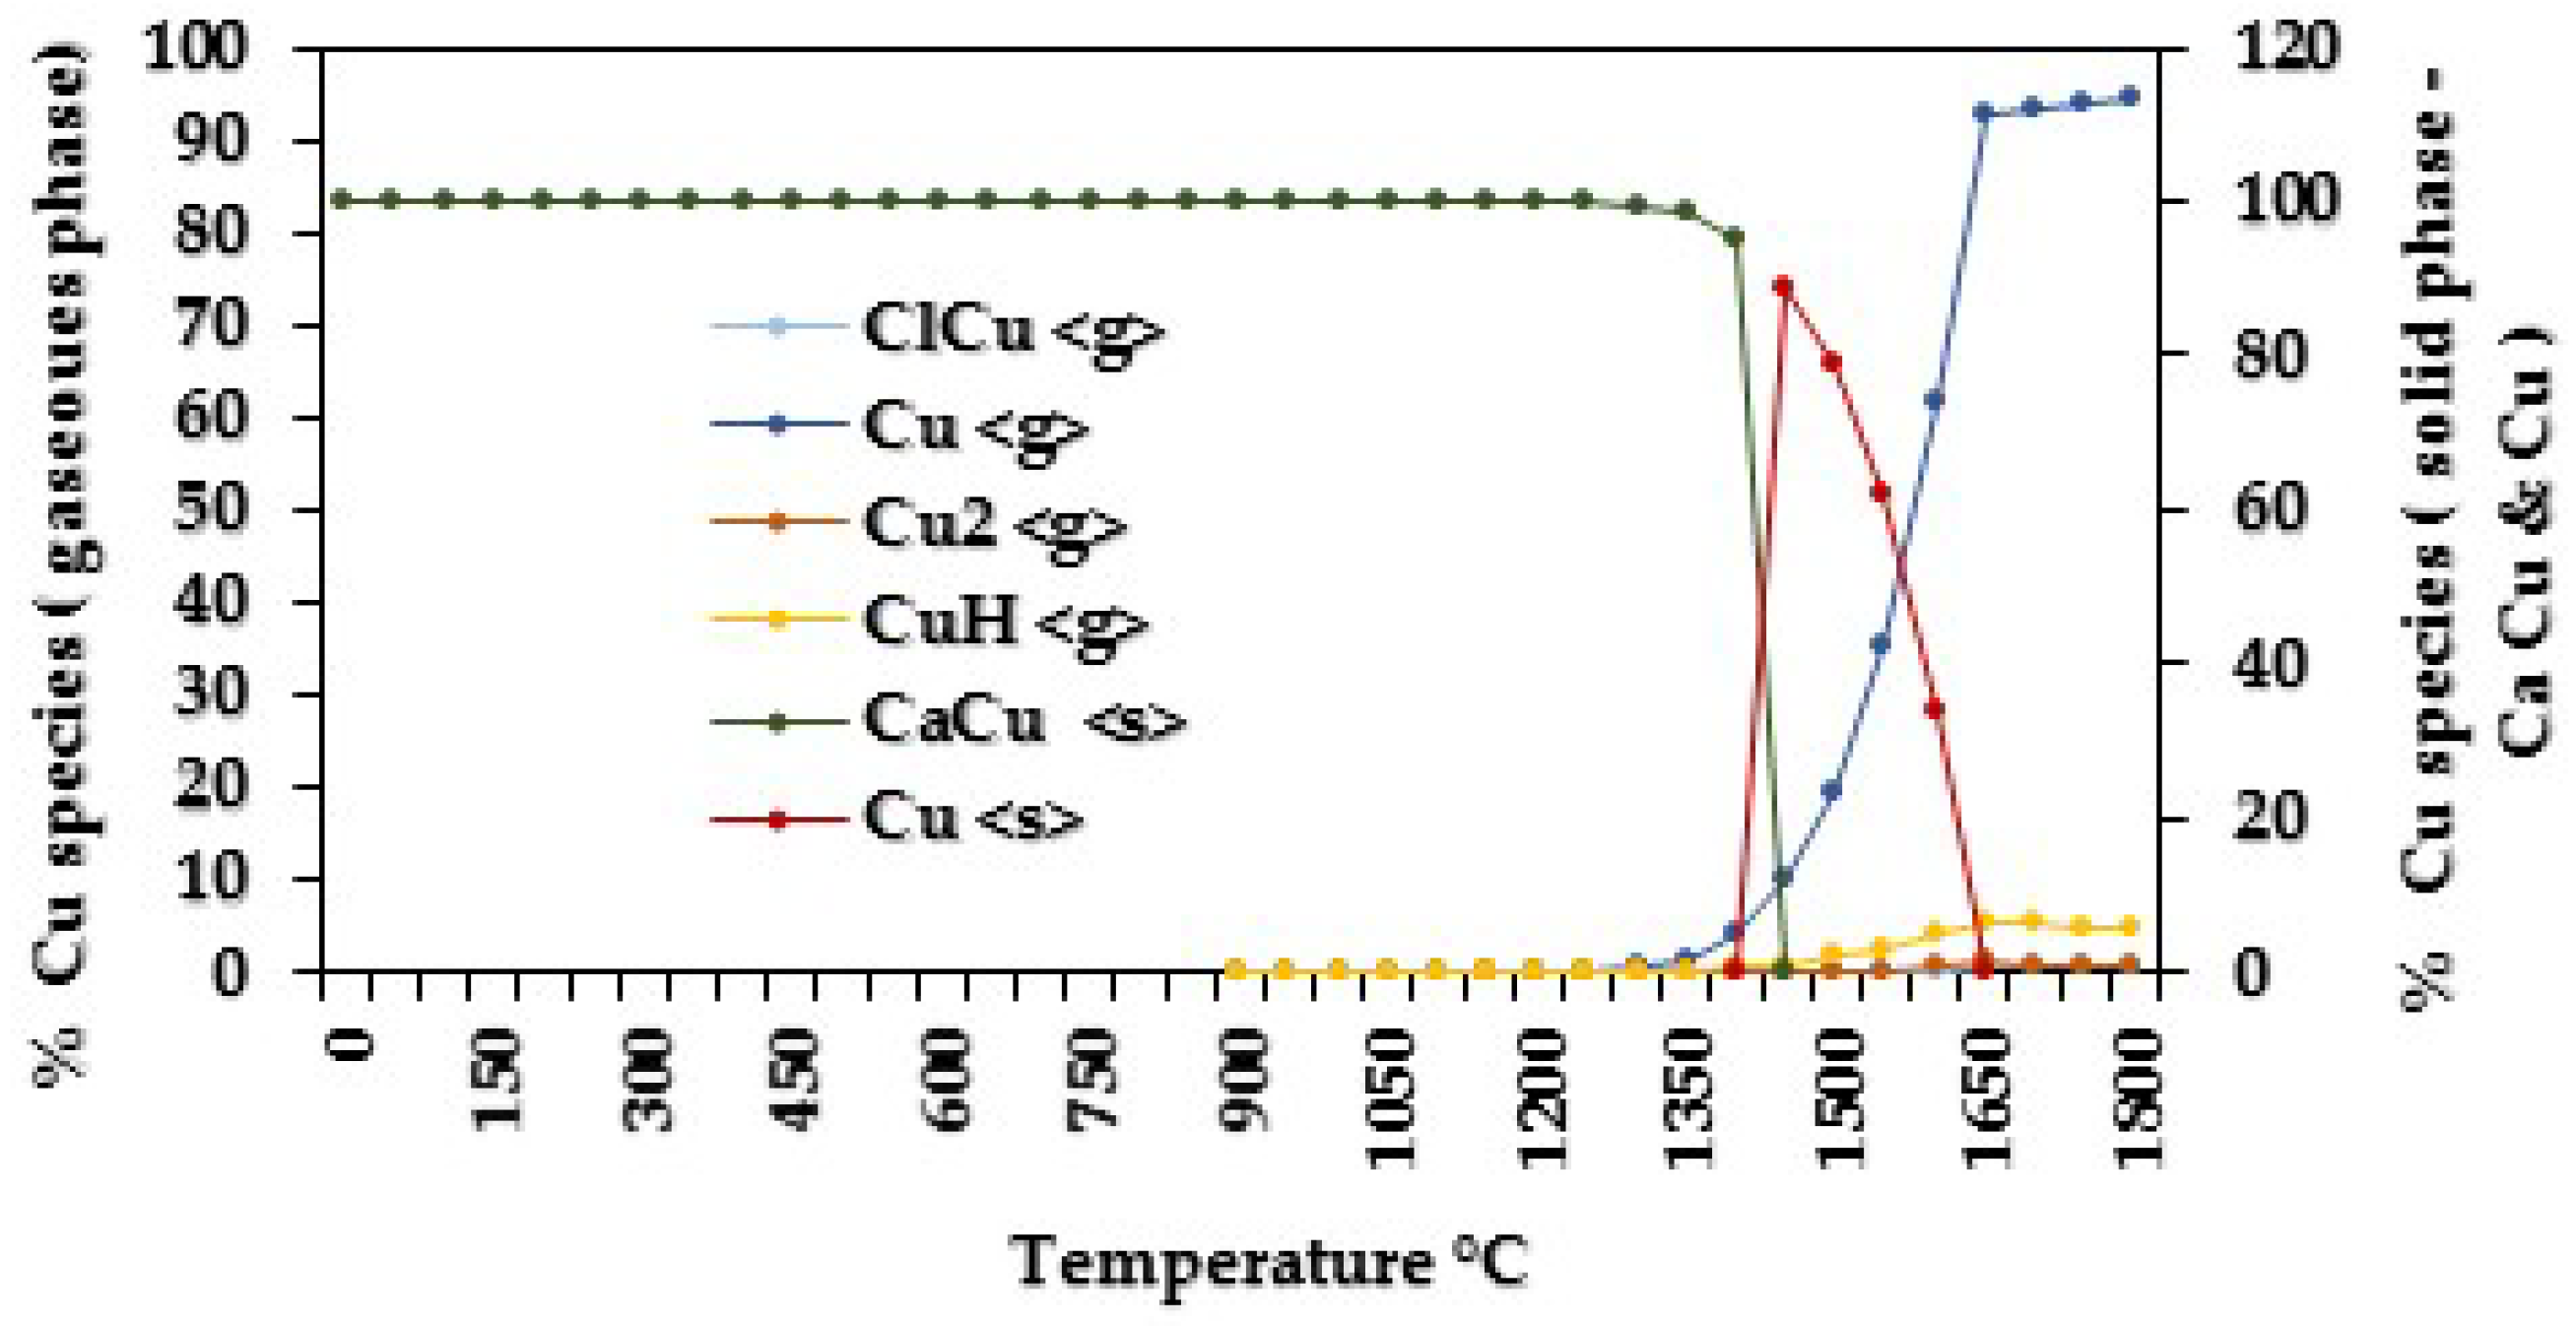
Initially, the modelling of PCR was based on composition data in Table 2 (the mean values) and process parameters of PCR in Table 4 in order to predict the equilibrium partitioning of the CCA-elements. The simulation results show that, at temperatures ≤1350 °C, about 100% of Cu remained in solid phase as a dominant species of CaCu resulting from Ca-Cu interaction (Figure 3). When the temperature increases from 1350 to 1800 °C, new gaseous species CuH (0.47–4.49%), Cu2 (0.02–0.43%), and CuCl (5.5 × 10⁻³–5.544 × 10⁻¹%) are formed due to Cu-Cl and Cu-H interactions. At temperatures between 1450 and 1600 °C, Cu is proportionally distributed as elemental between gaseous phase (4.29–94.52%) and solid phase (88.84–33.57%).
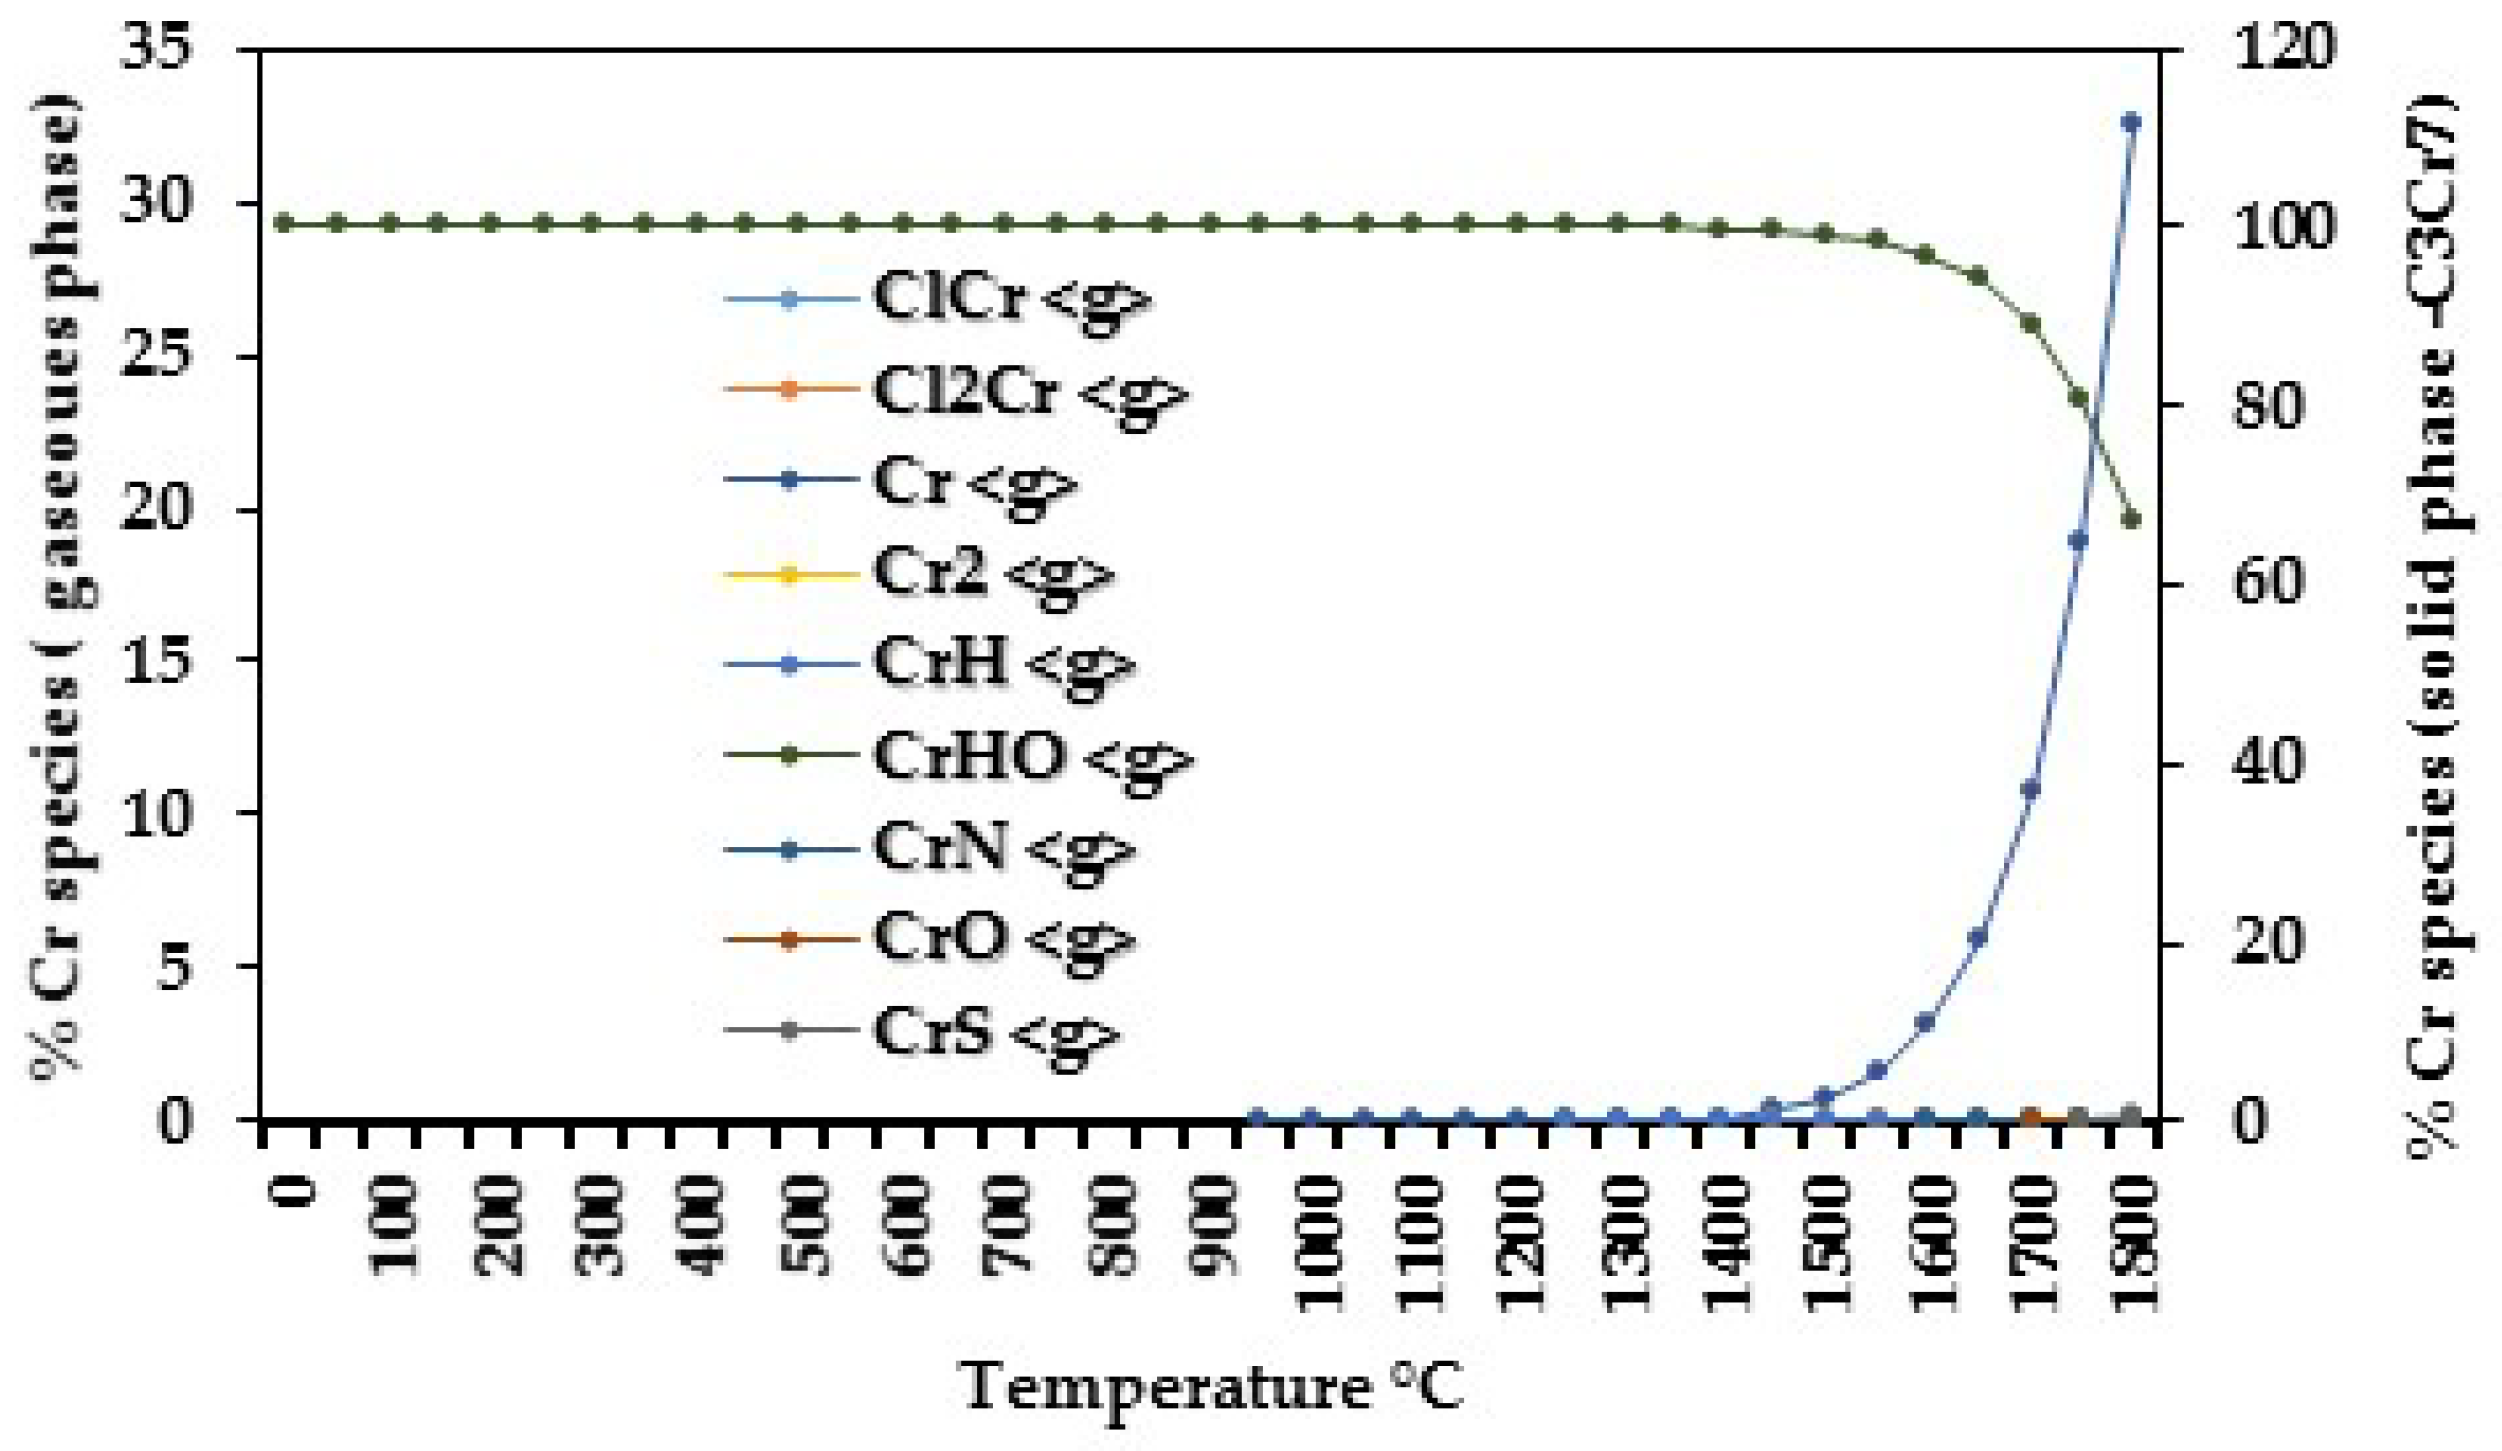
The predicated distribution of Cr is shown in Figure 4. Obviously, at temperatures ≤1550 °C, Cr remained in solid phase as C3Cr7 (100%), and this was mainly due to C-Cr interaction. Additionally, at temperatures between 1550 and 1800 °C, the mass percentage of C3Cr7 decreased from 100% to 67.34%, while at the same time it was released as elemental Cr (3.16–32.48%) and as a new set of gaseous species generated by Cr-Cl, Cr- H, Cr- N, and Cr-O interactions; the total mass percentage of these gaseous species was less than 0.2%.
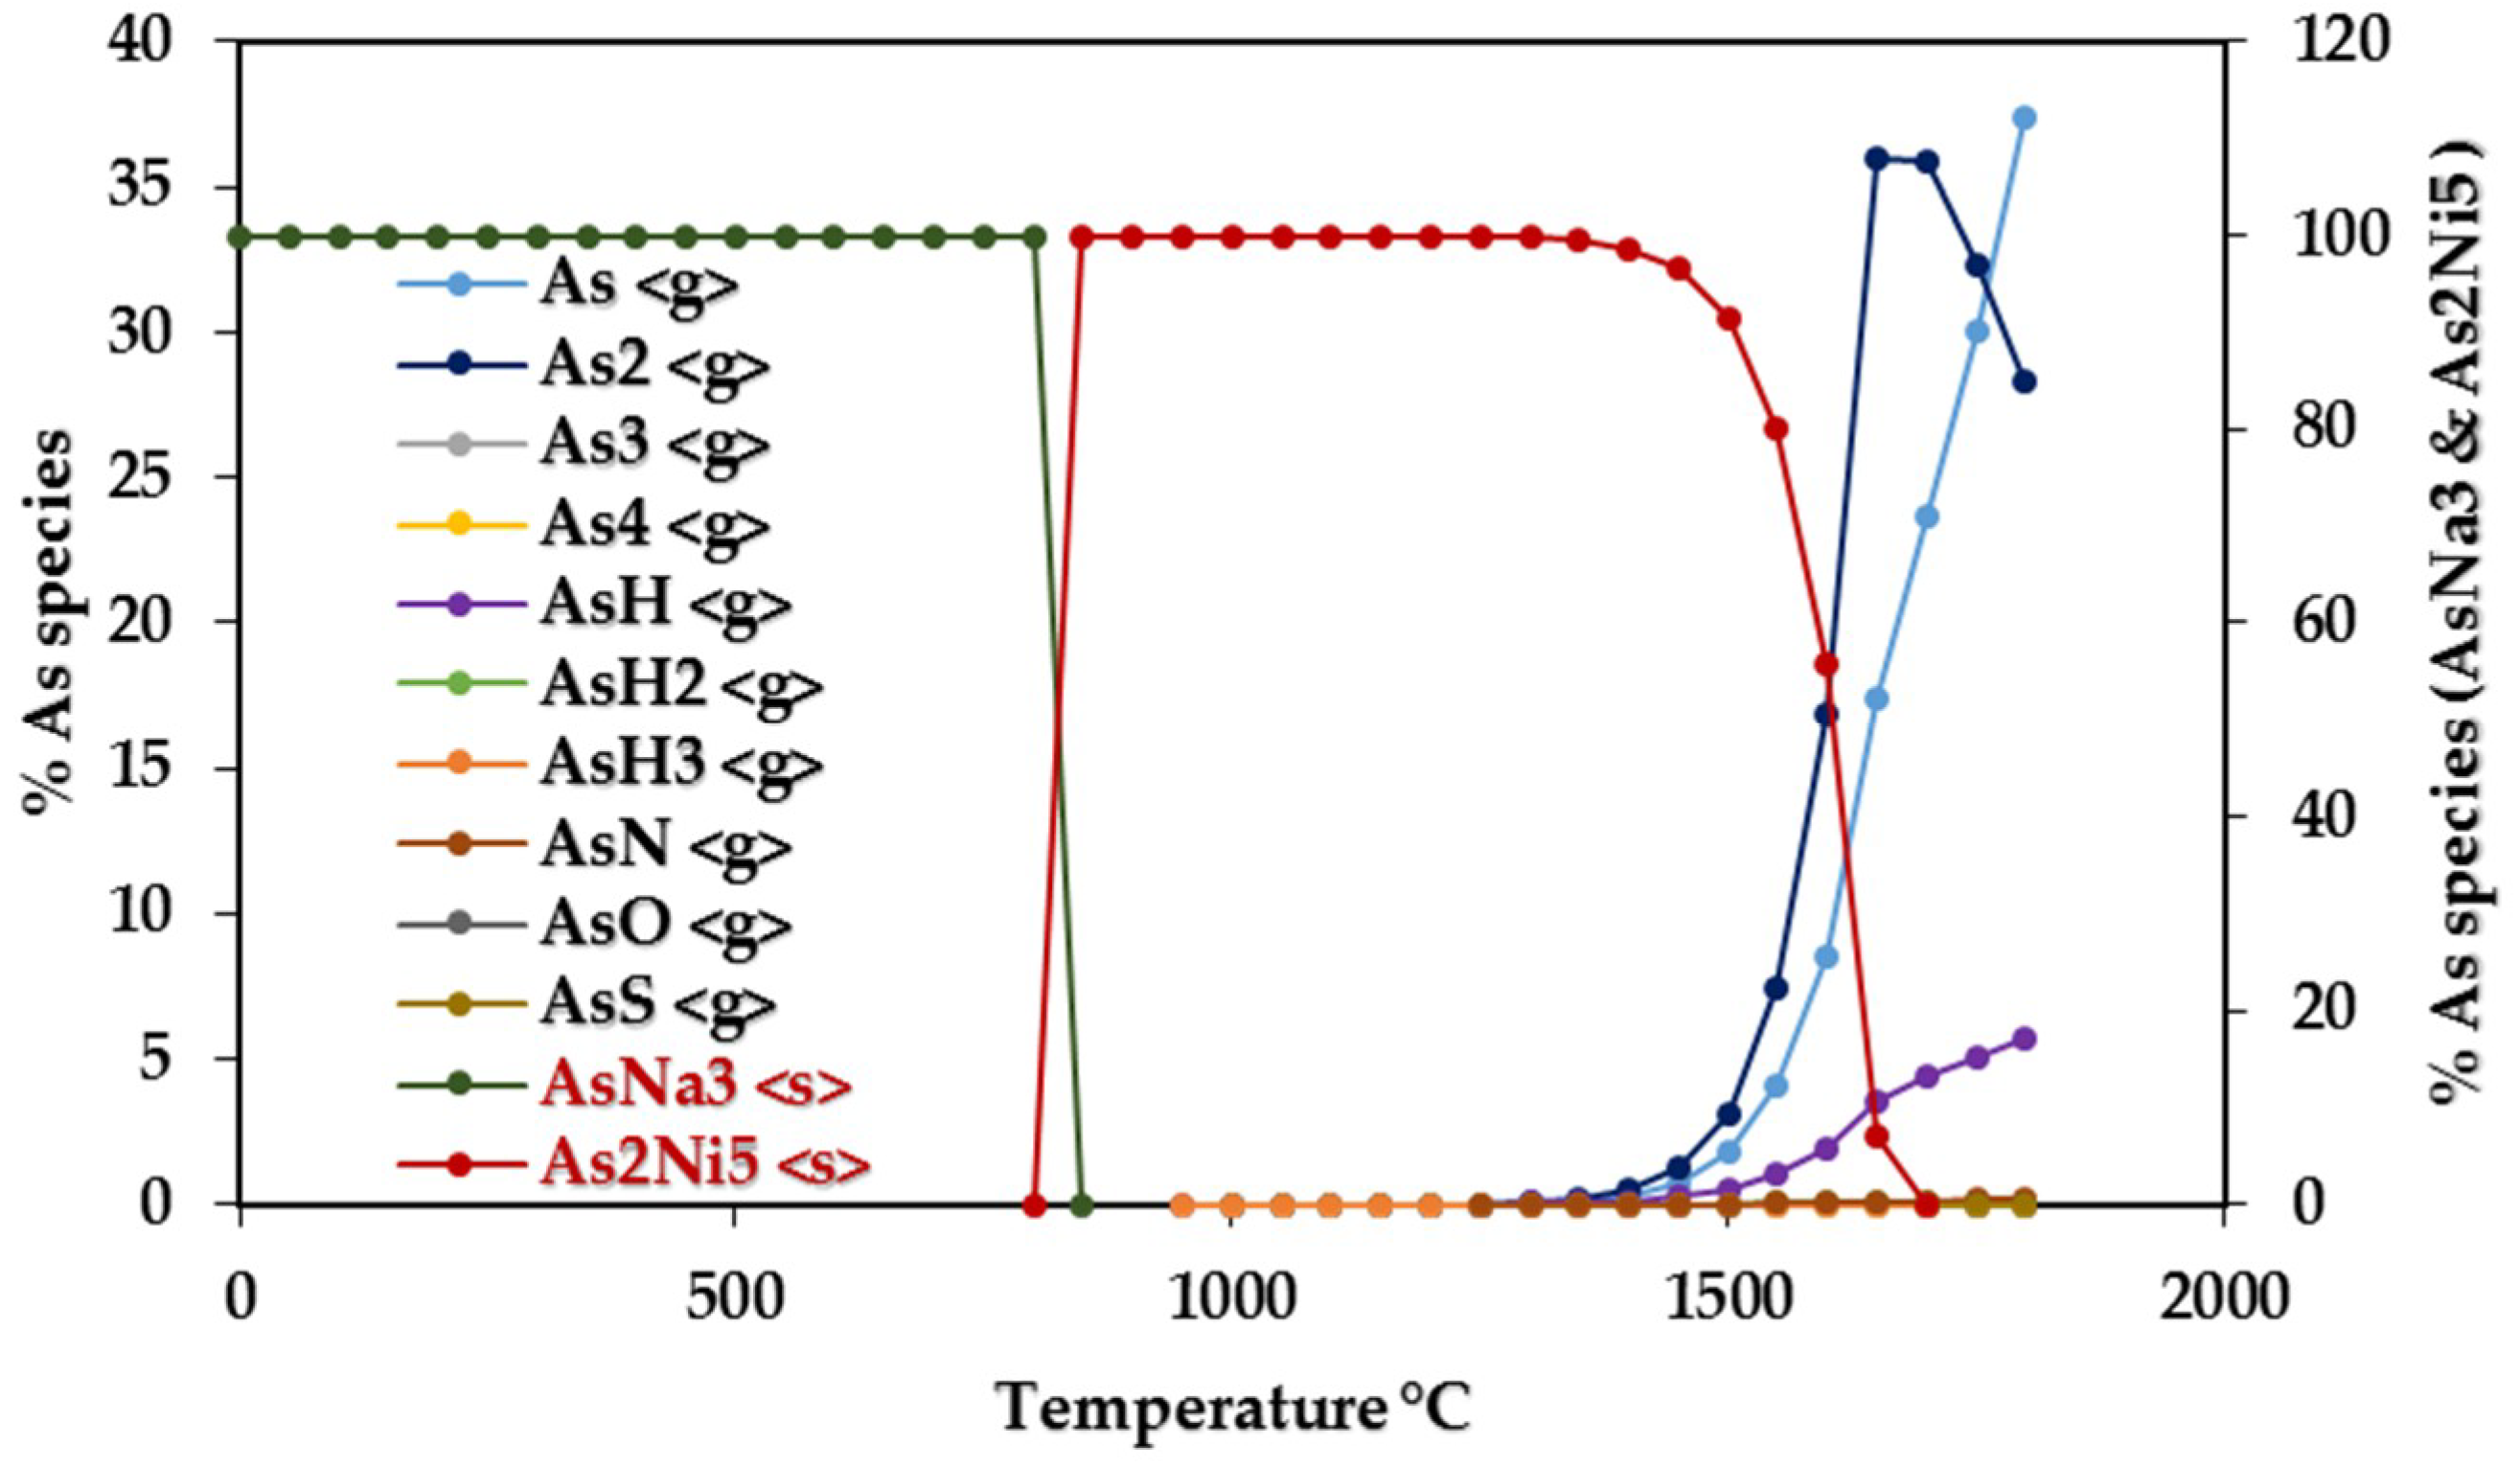
Figure 5 shows the equilibrium distribution of As. It is clear that at temperatures ≤1400 °C, As is predicated as stable solid species AsNa3 (100%) and As2Ni5 (99.99–99.15%) as consequence of As-Na interaction and As-Ni interaction, respectively. As the temperature increases from 1400 to 1800 °C, the mass percentage of As decreases rapidly in solid phase, and it reforms as new gaseous species predominately by interactions. Among them, the dominant ones are As2 (1.90–46.00%), AsH (0.24–7.13%), and As (5–46.55%). Indeed, AsH is generated by As-H interaction.
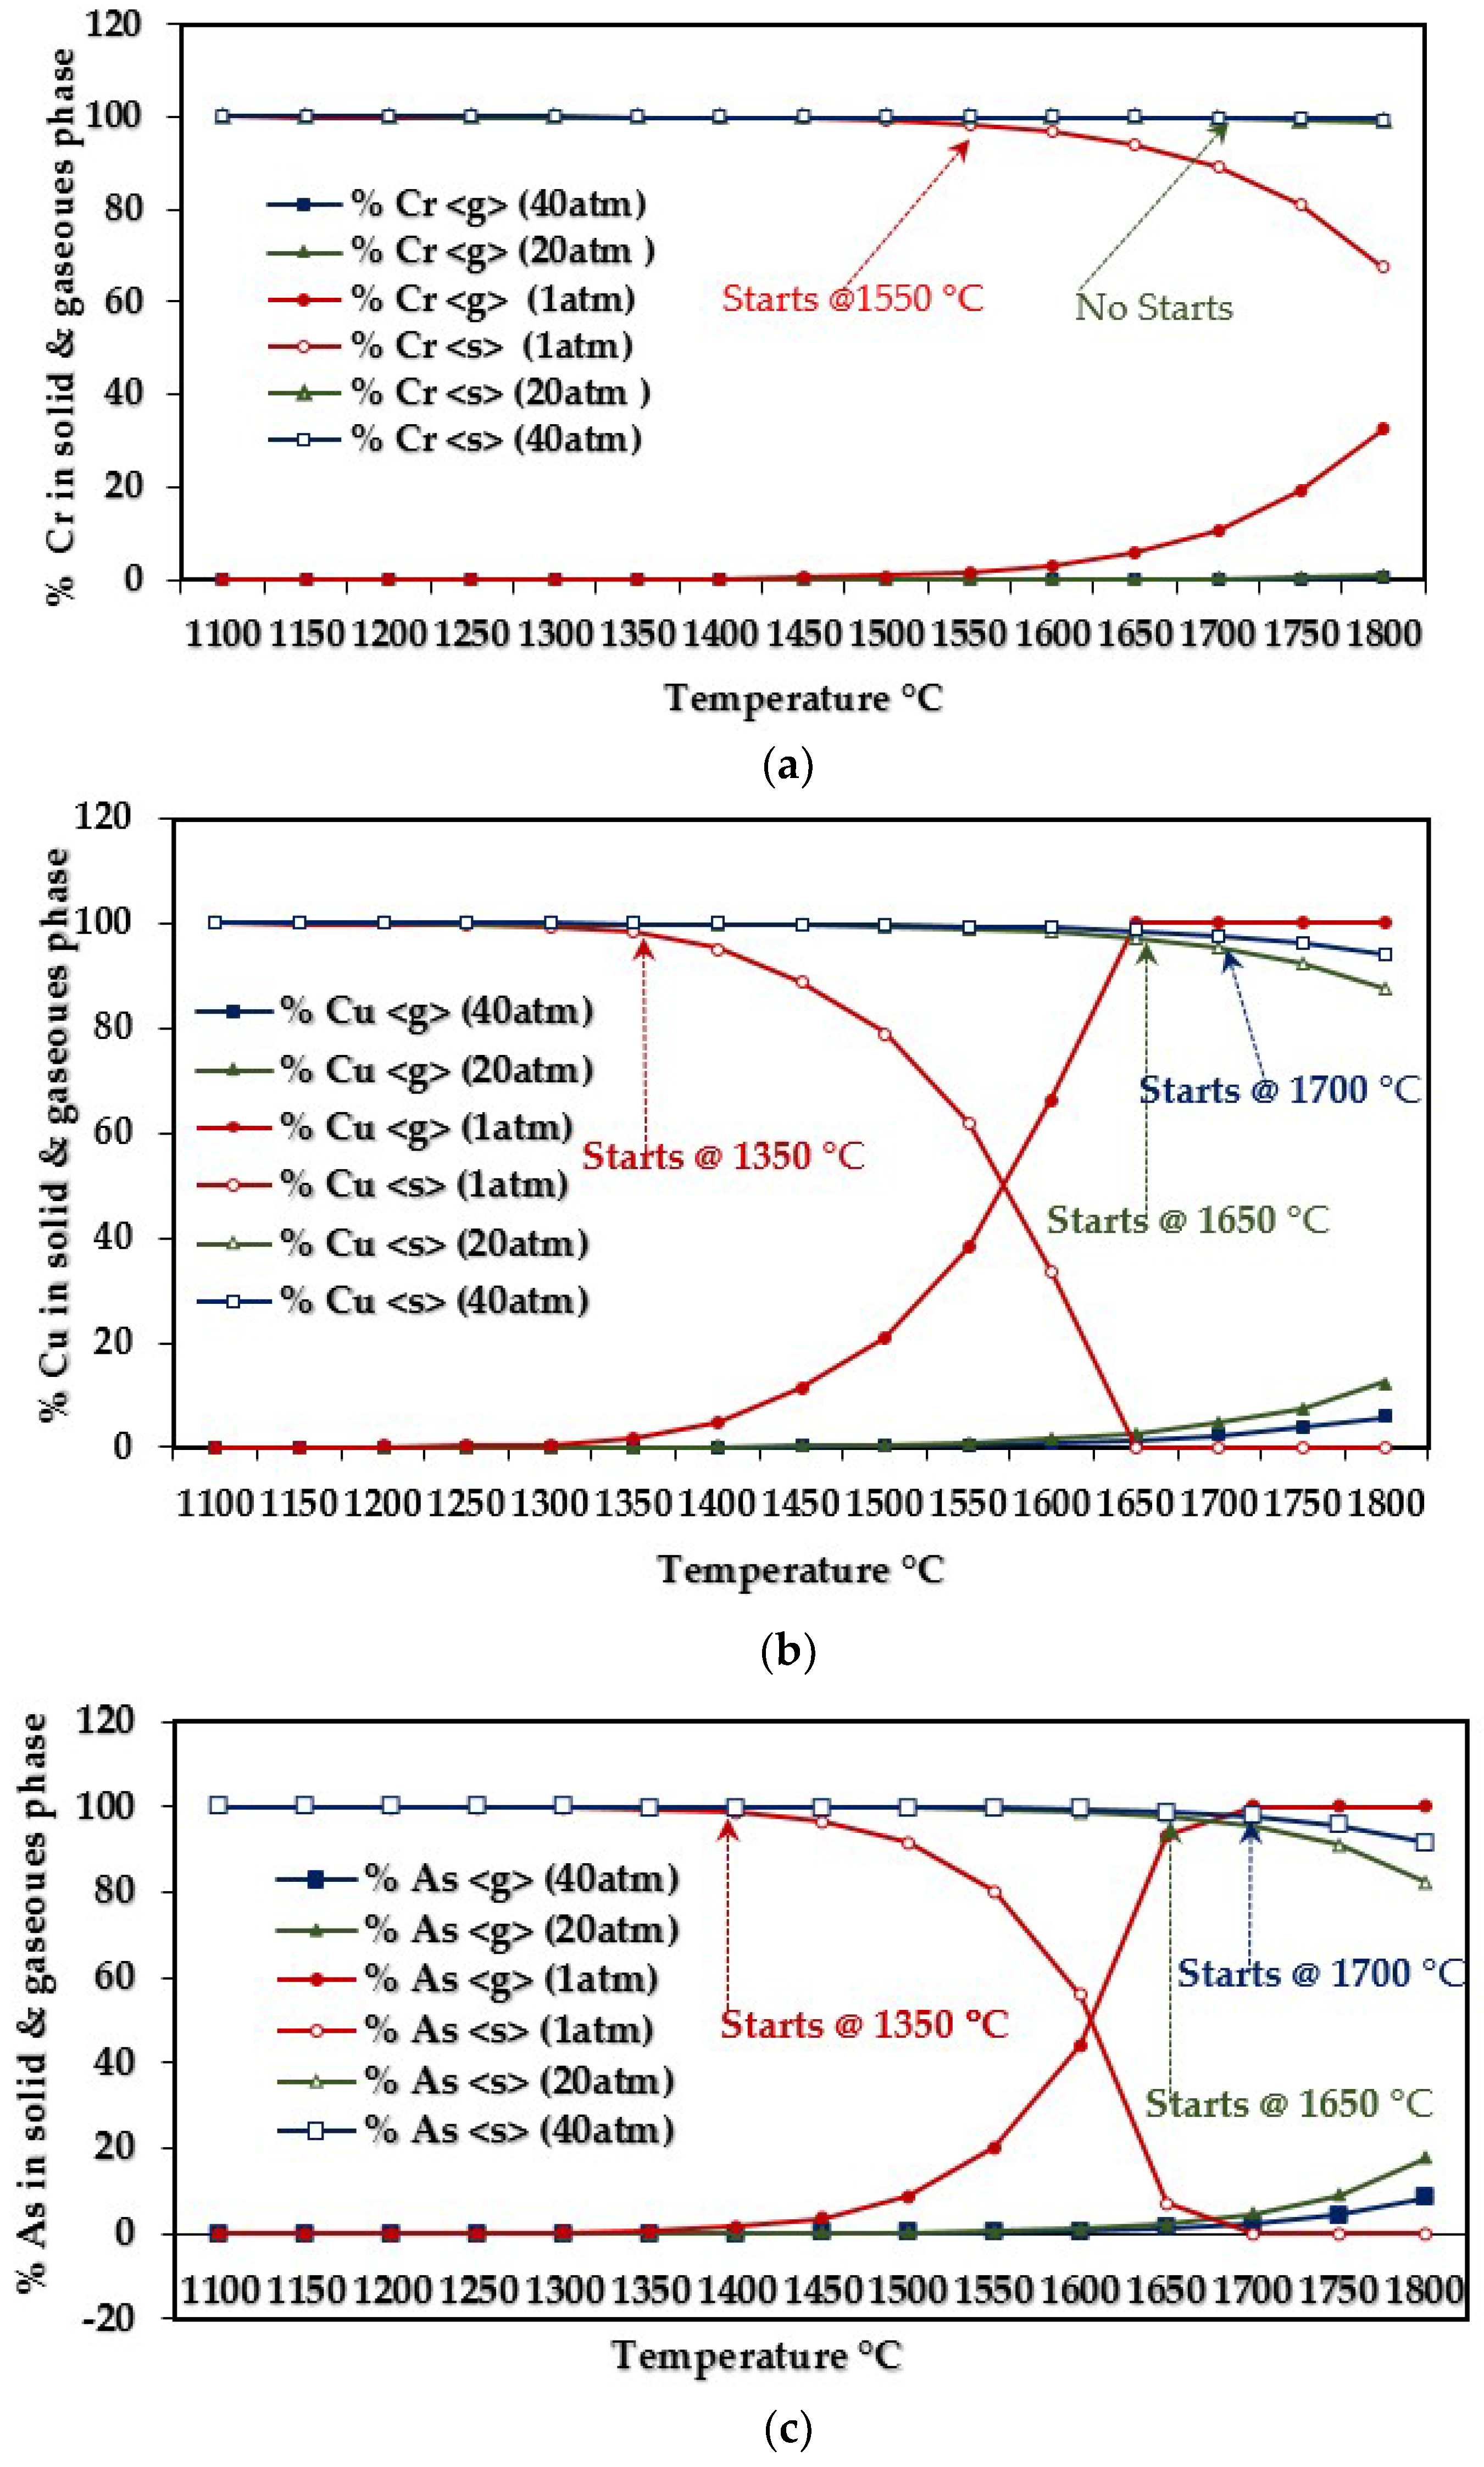
To highlight the influence of increased pressure conditions on phase transition temperatures of CCA-elements, the reaction pressure was set to 20 atm and to 40 atm. Not surprisingly, Cr remained completely in condensed phase under both pressures, as shown in Figure 6a. Whereas, under 20 atm, the phase transformation temperatures of Cu and As increased by 300 and 250 °C, respectively, compared to those under 1 atm. Also, under 40 atm, the phase transformation temperatures of Cu and As, respectively, increased by 350 and 300 °C compared to those predicated under 1 atm, as depicted in Figure 6b,c.
3.1.2. Influence of Elemental Contents
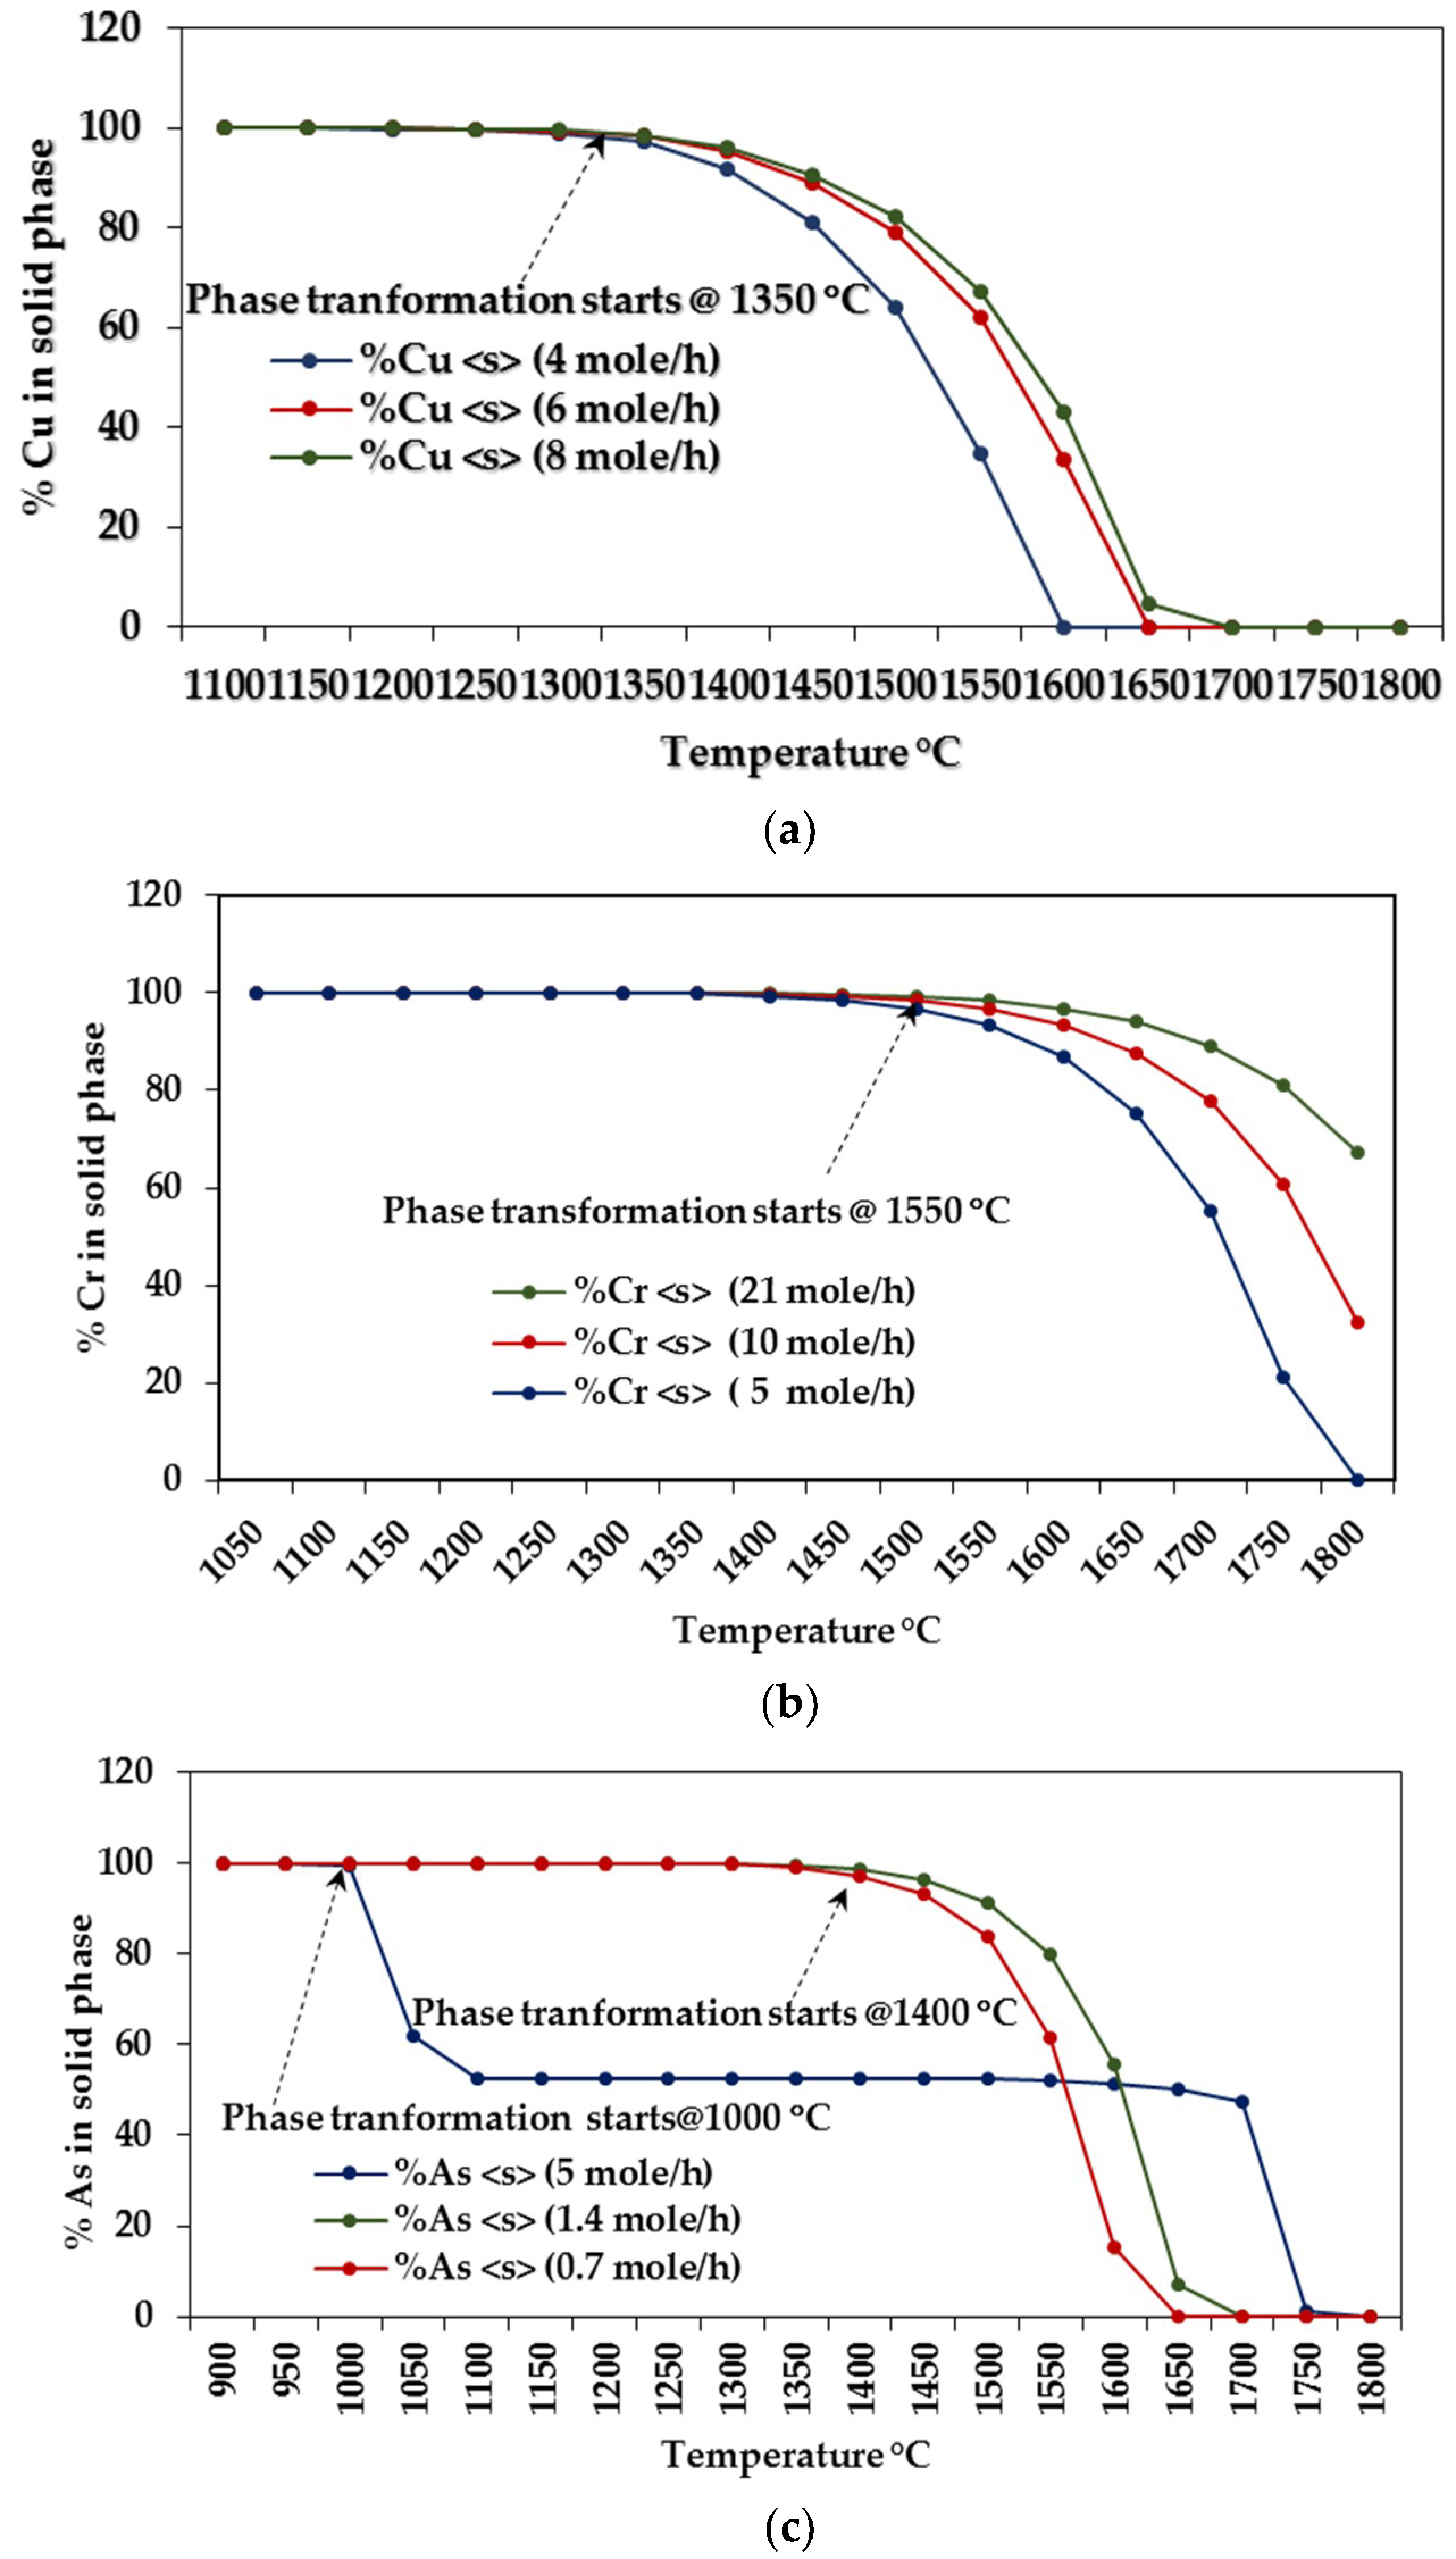
Since the elemental content is one of the most important factors that directly affects species formation, different element content in WW samples were simulated to identify the possible interactions and interferences in terms of speciation during PCR, such that the element concentration were introduced to the model as presented in Table 3. Note here that the interactions and interferences that lead to appreciable effects on elemental phase transformation temperature and species formation were ranked as significant.
Influences on CCA-elements
In this case, the concentrations of each CCA-elements were individually changed. The simulation results show that the CCA-elements contents exhibit almost no influence on their phase transformation temperatures, but only concentration shifts are observed as shown in Figure 7a–c. Nevertheless, an exception is that when As concentration is relatively high (5 mole/h), its solid–gaseous transformation temperature decreased by 400 °C because the Ni contained becomes less than the limit to interact with As, and hence captures 100% of the As. Additionally, As2Ni5 (solid) and AsN (gaseous) are the dominant species of As.
Influences of Ca, Na, S, Cl, Fe, and Ni on CCA-element
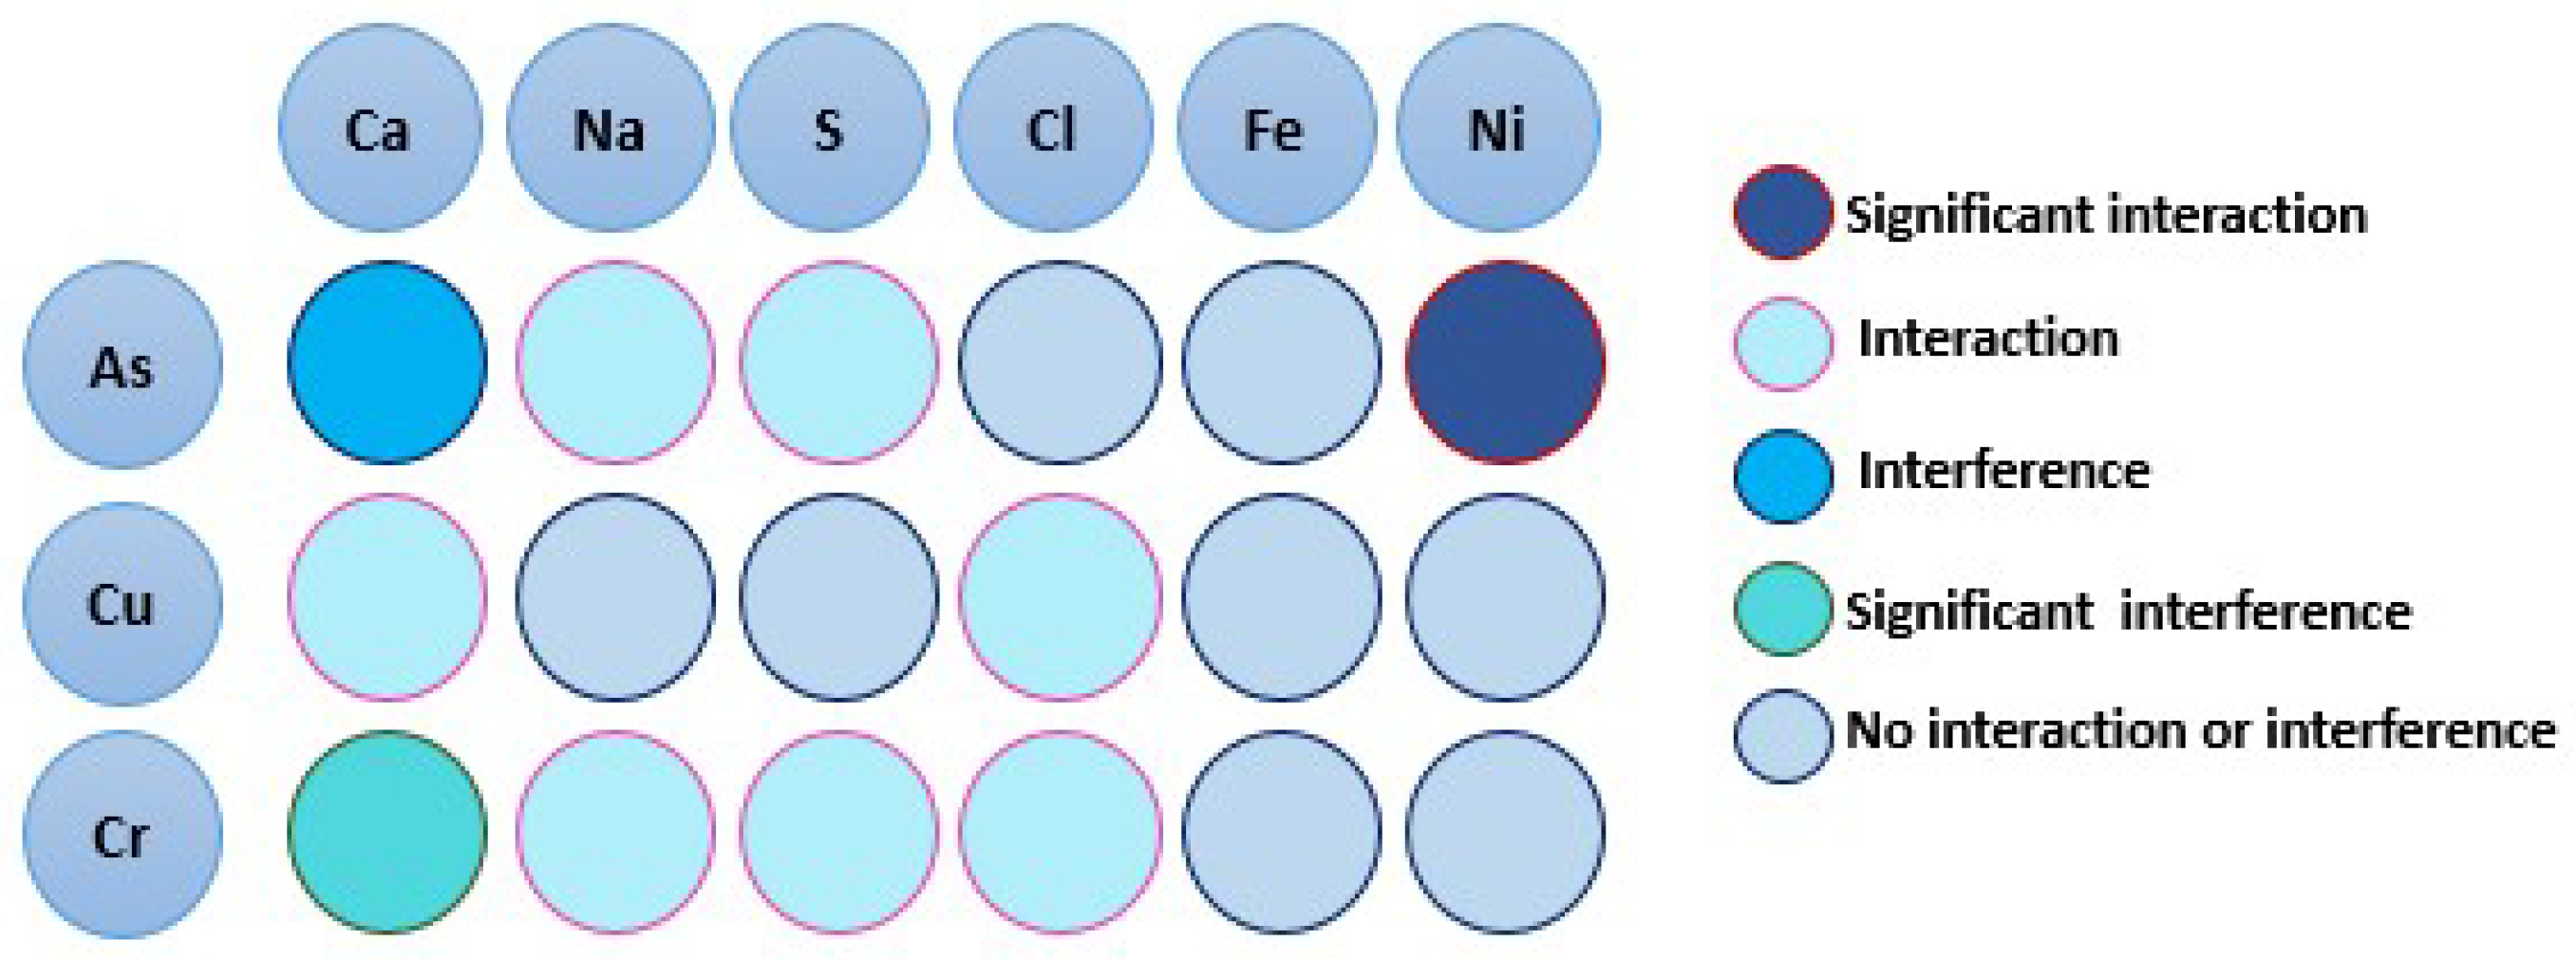
An illustration of the occurred interactions and interferences between CCA-elements and individual presence/absence of each of the elements Ca, Na, S, Cl, Fe and Ni are given in Figure 8. Note that, in all the simulations, the CCA-elements concentrations were kept fixed (as listed in Table 2) while the concentrations of other minor elements were considered as in Table 3.
1. Copper
As presented in Figure 8, Cu interacts with Ca and Cl; however, all Cl-Cu interactions release only a single gaseous species—ClCu. The solid and gaseous species formed by Ca-Cu interactions are listed in Table 5. The analysis shows that the dominant species in solid phase are CaCu, CaCu and CaCu5, and CaCu when Ca is present, respectively at concentrations of 250, 500, and 1000 mole/h. On the other hand, the presence of Ca at low concentrations would not be sufficient to interact with Cu; alternatively, it interacts with O and Cr, forming CaCr2O4 and CaO, respectively. Further, it is noted that the volatilization of Cu is not affected by the various concentrations of Ca, which is similar to Cl-Cu interactions.
2. Chromium
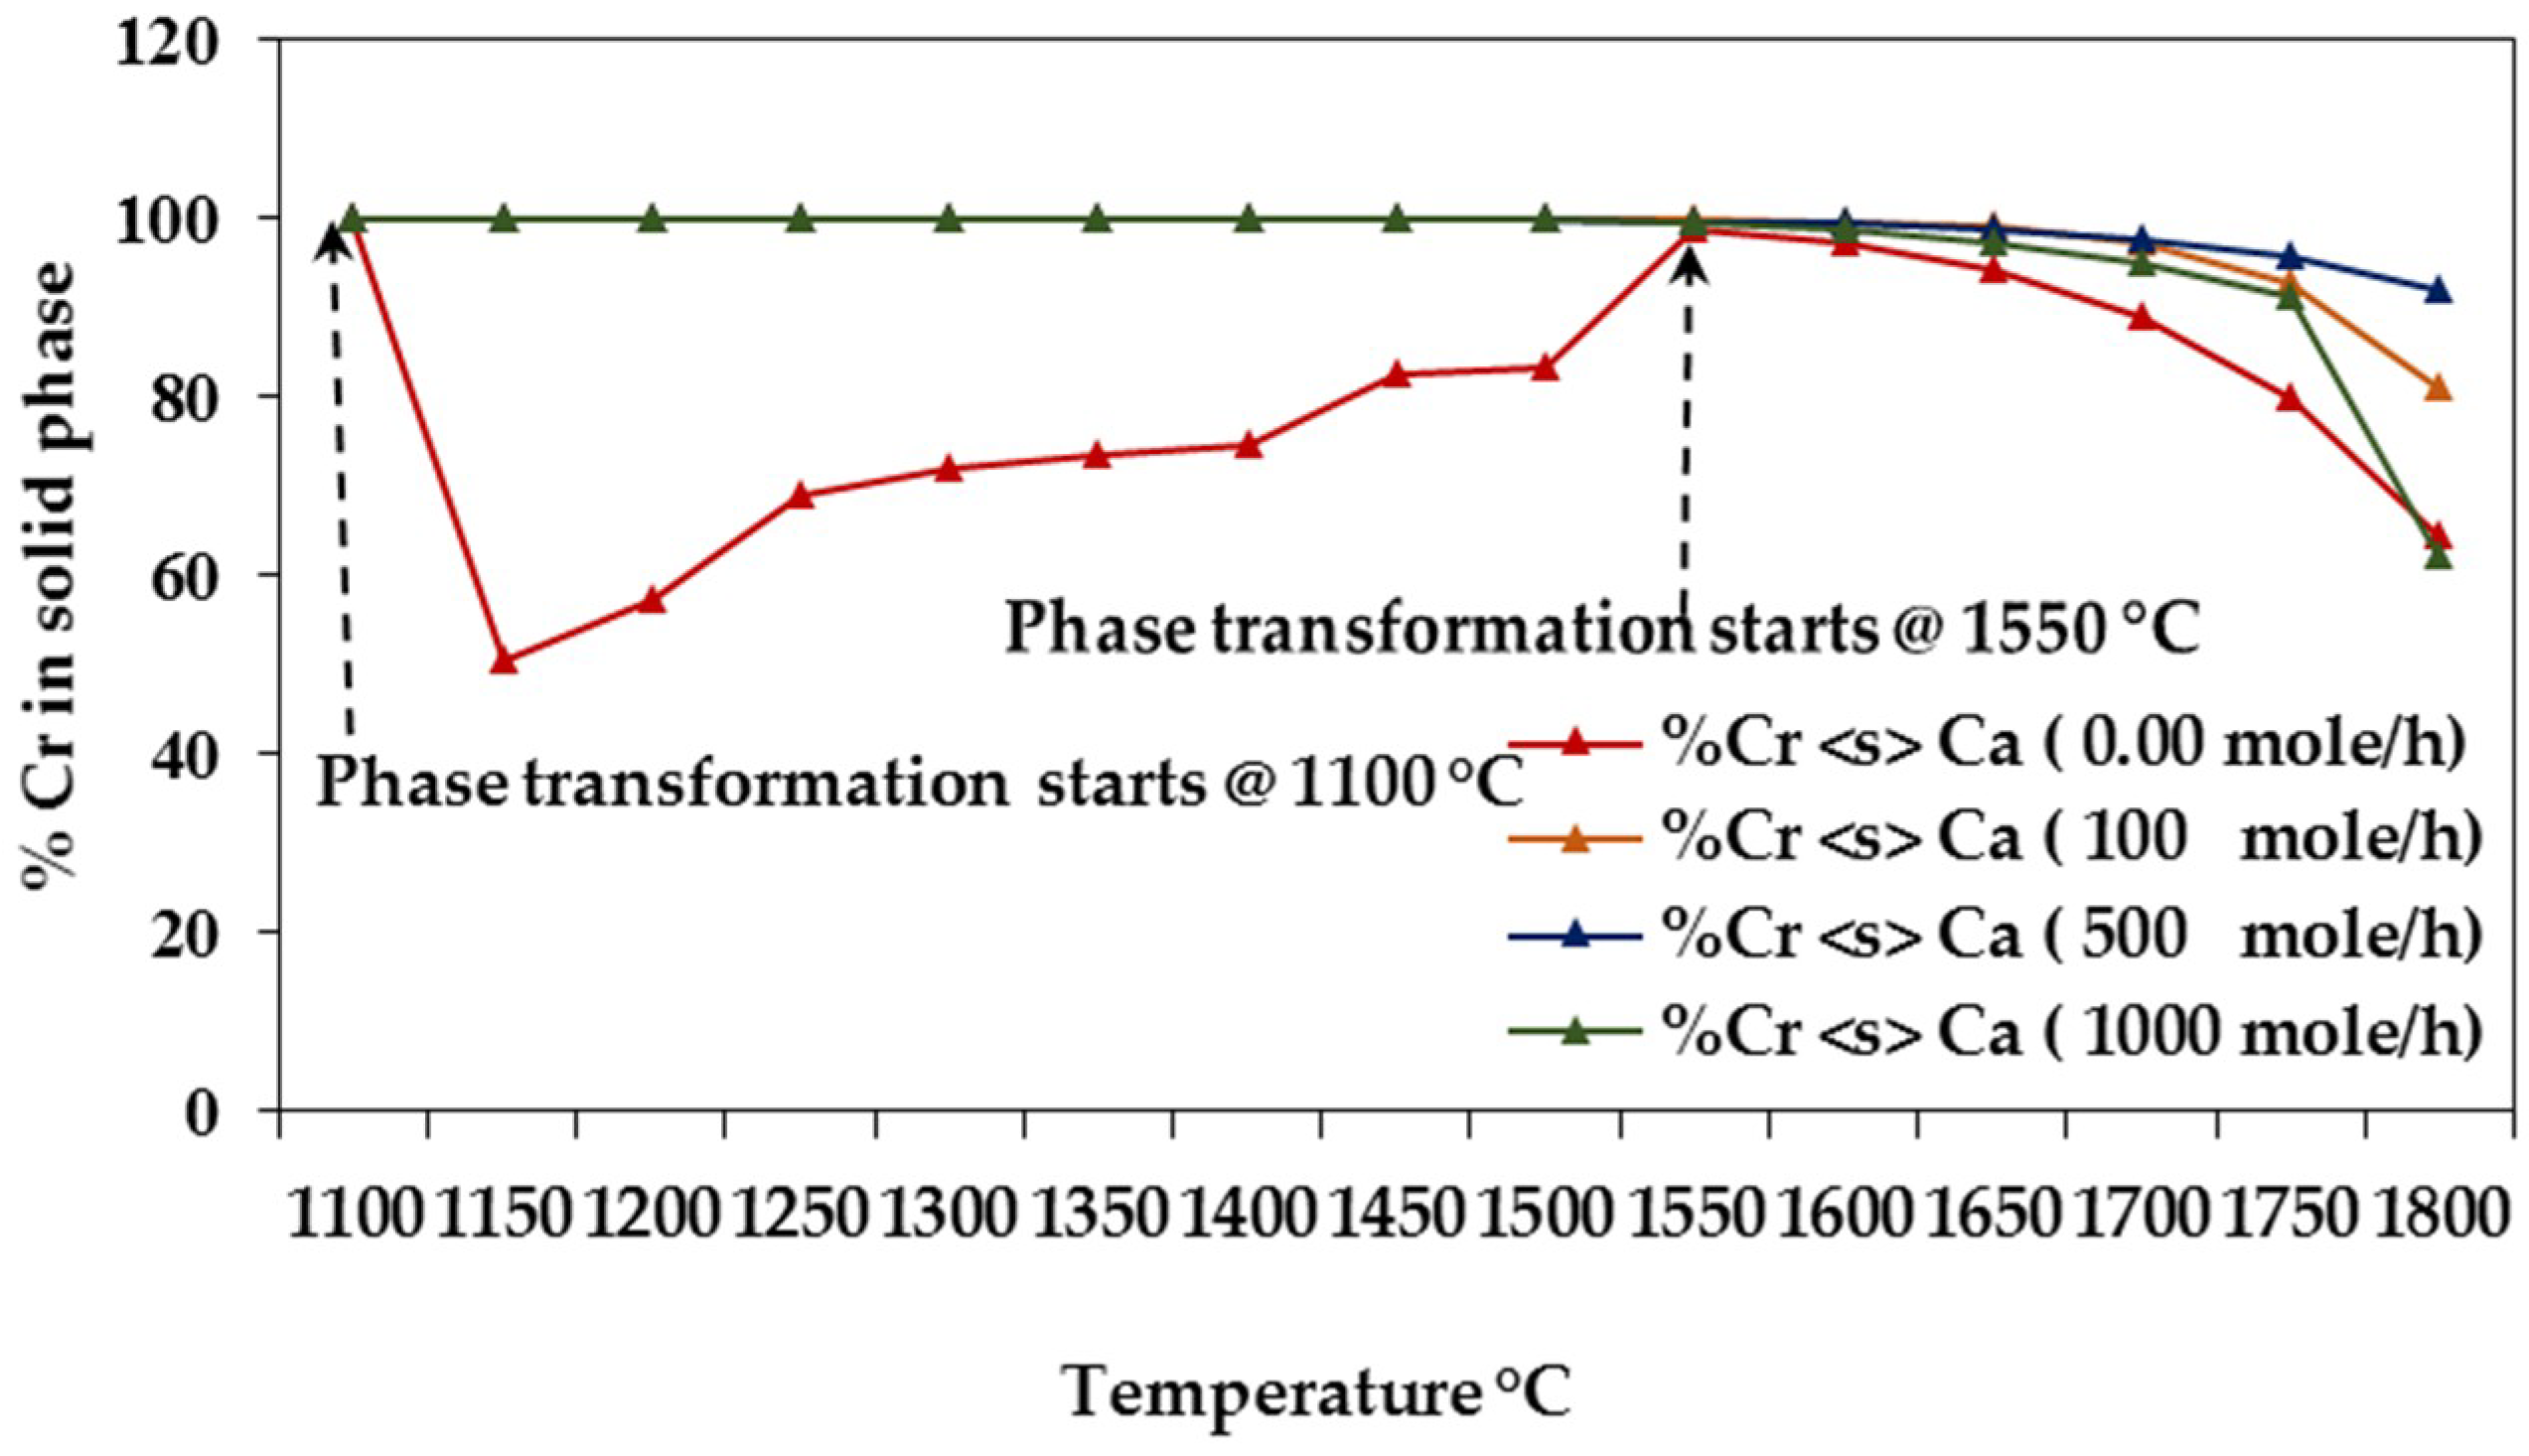
The analysis reveals that Ca plays an important role in Cr distribution across the solid and gaseous phases (Figure 9 and Table 6). That is, Na and Cr interact only when the concentration of Ca is ≤100 mole/h, leading to the formation of instable solid specie Cr2Na2O4 between 1100 and 1550 °C. CaCr2O4 (solid) is the most likely to be generated by Ca-Cr interactions when Ca is present at 100 mole/h, thereby about 100% of Cr remains in solid phase at temperatures ≤1550 °C. As the Ca content increases (> 100 mole/h), Ca-Cr interferences and C-Cr interactions take place simultaneously, forming C2Cr3 and C3Cr7 in solid phase at temperatures up to 1550 °C. A most apparent observation in this case is the concentration shift in gaseous phase of Cr.
Other interactions, specifically, S-Cr and Cl-Cr interactions, exhibit no influence on Cr volatilization and solely yield gaseous species CrS, ClCr and Cl2Cr, respectively.
3. Arsenic
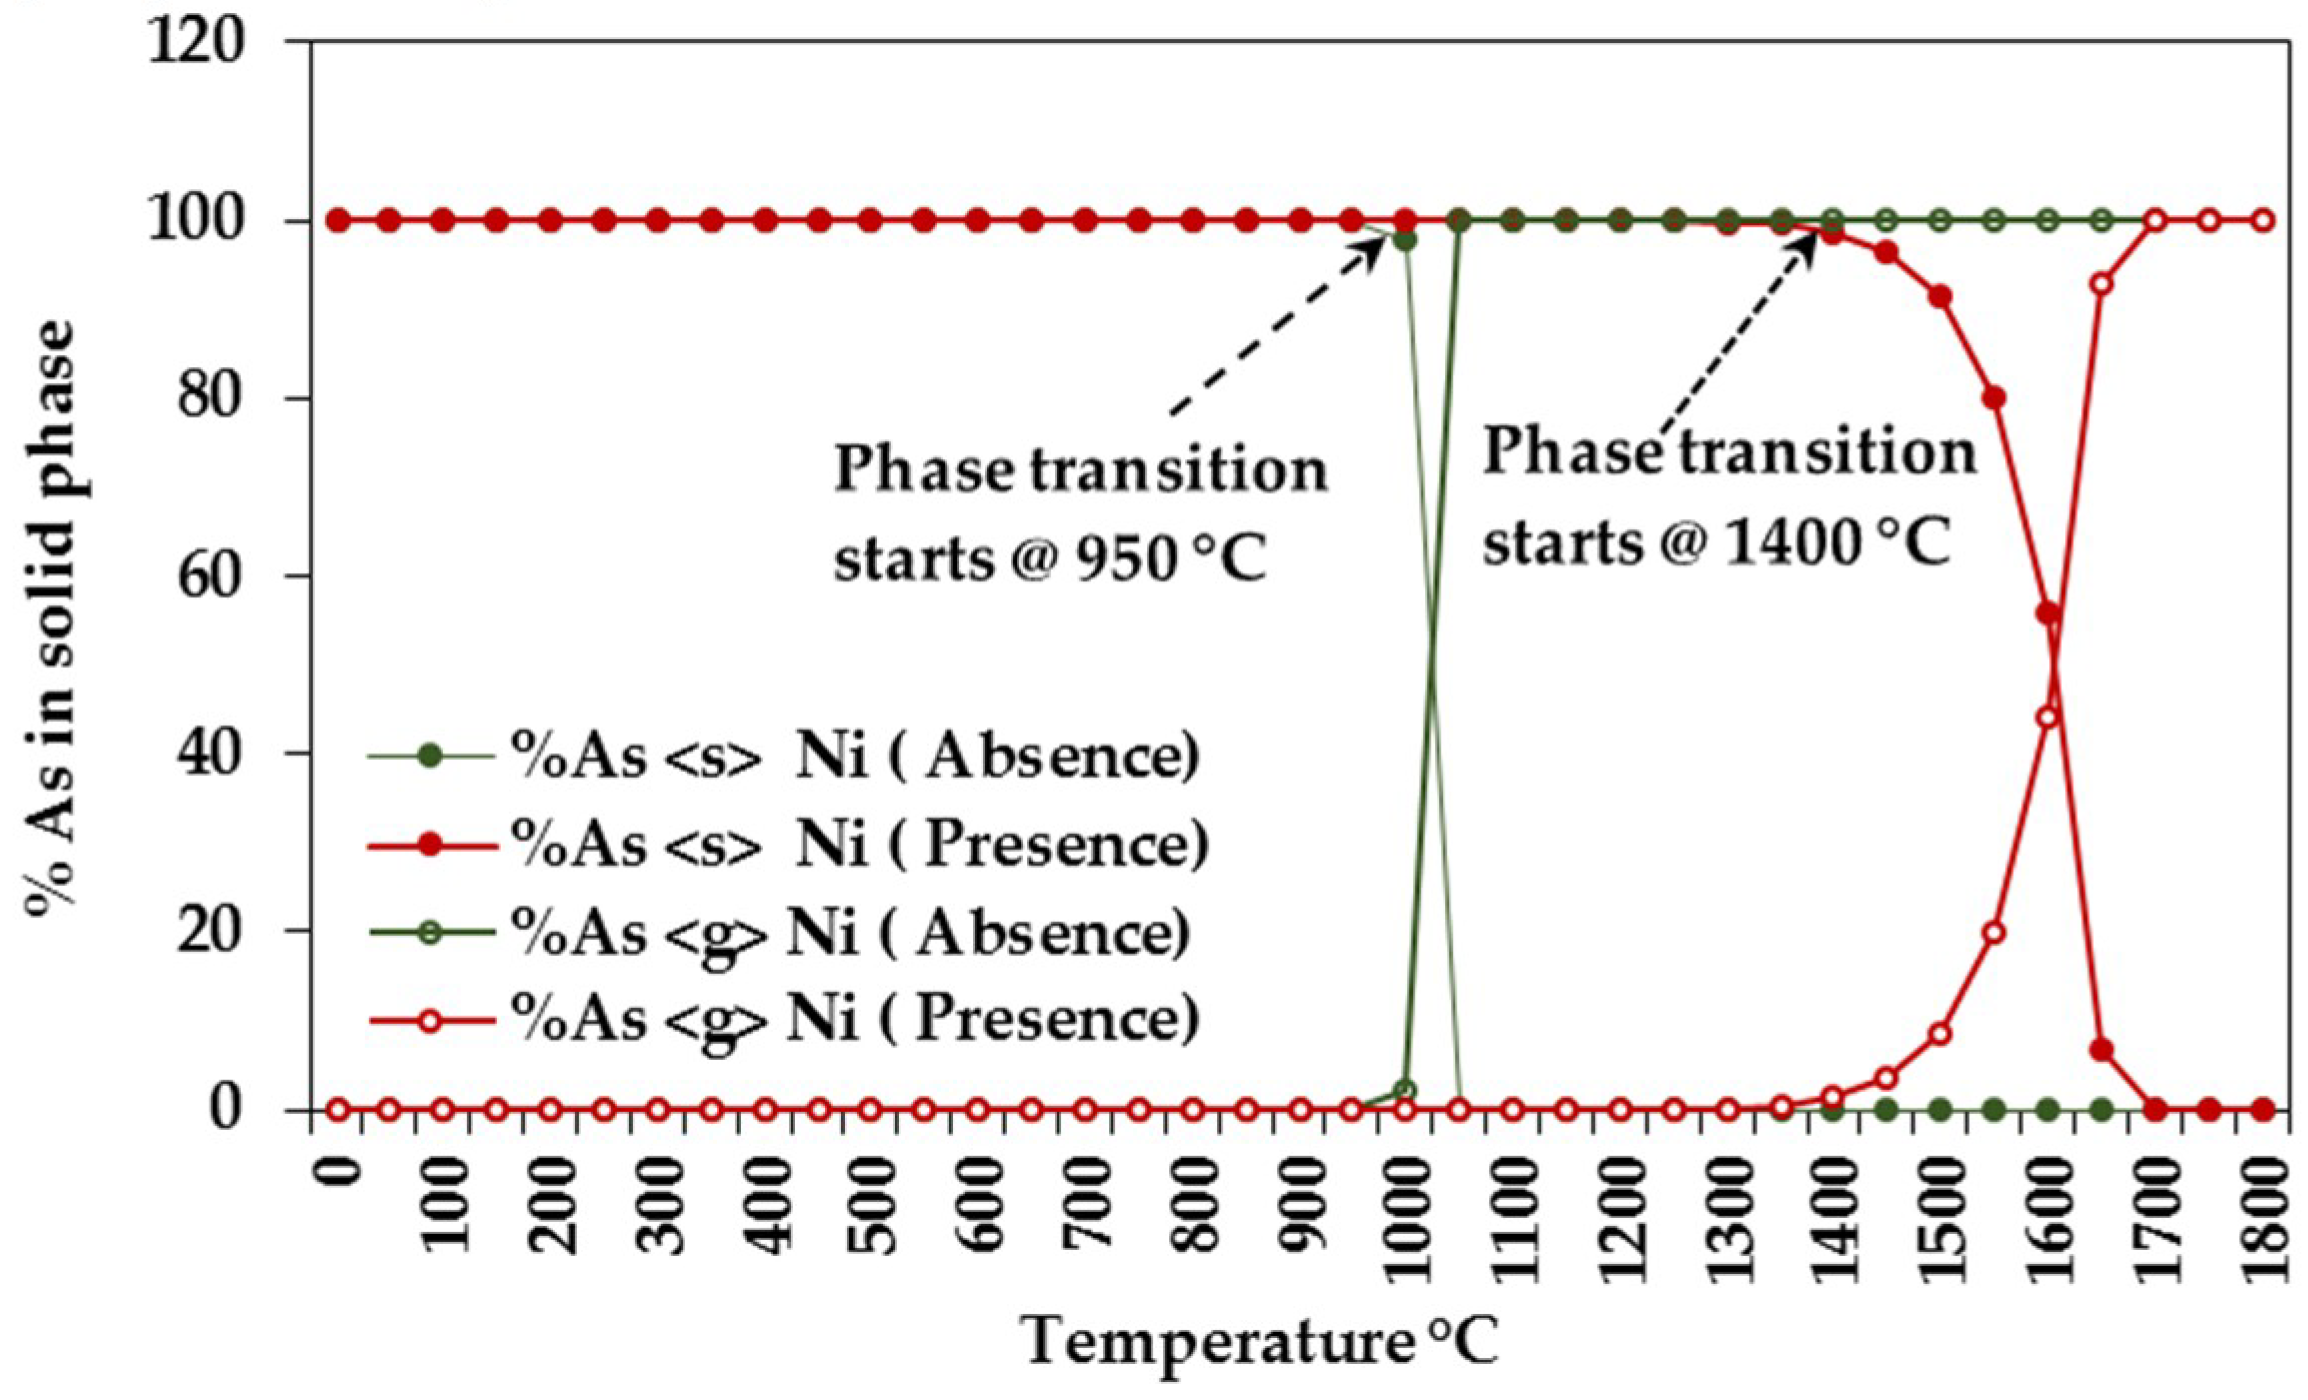
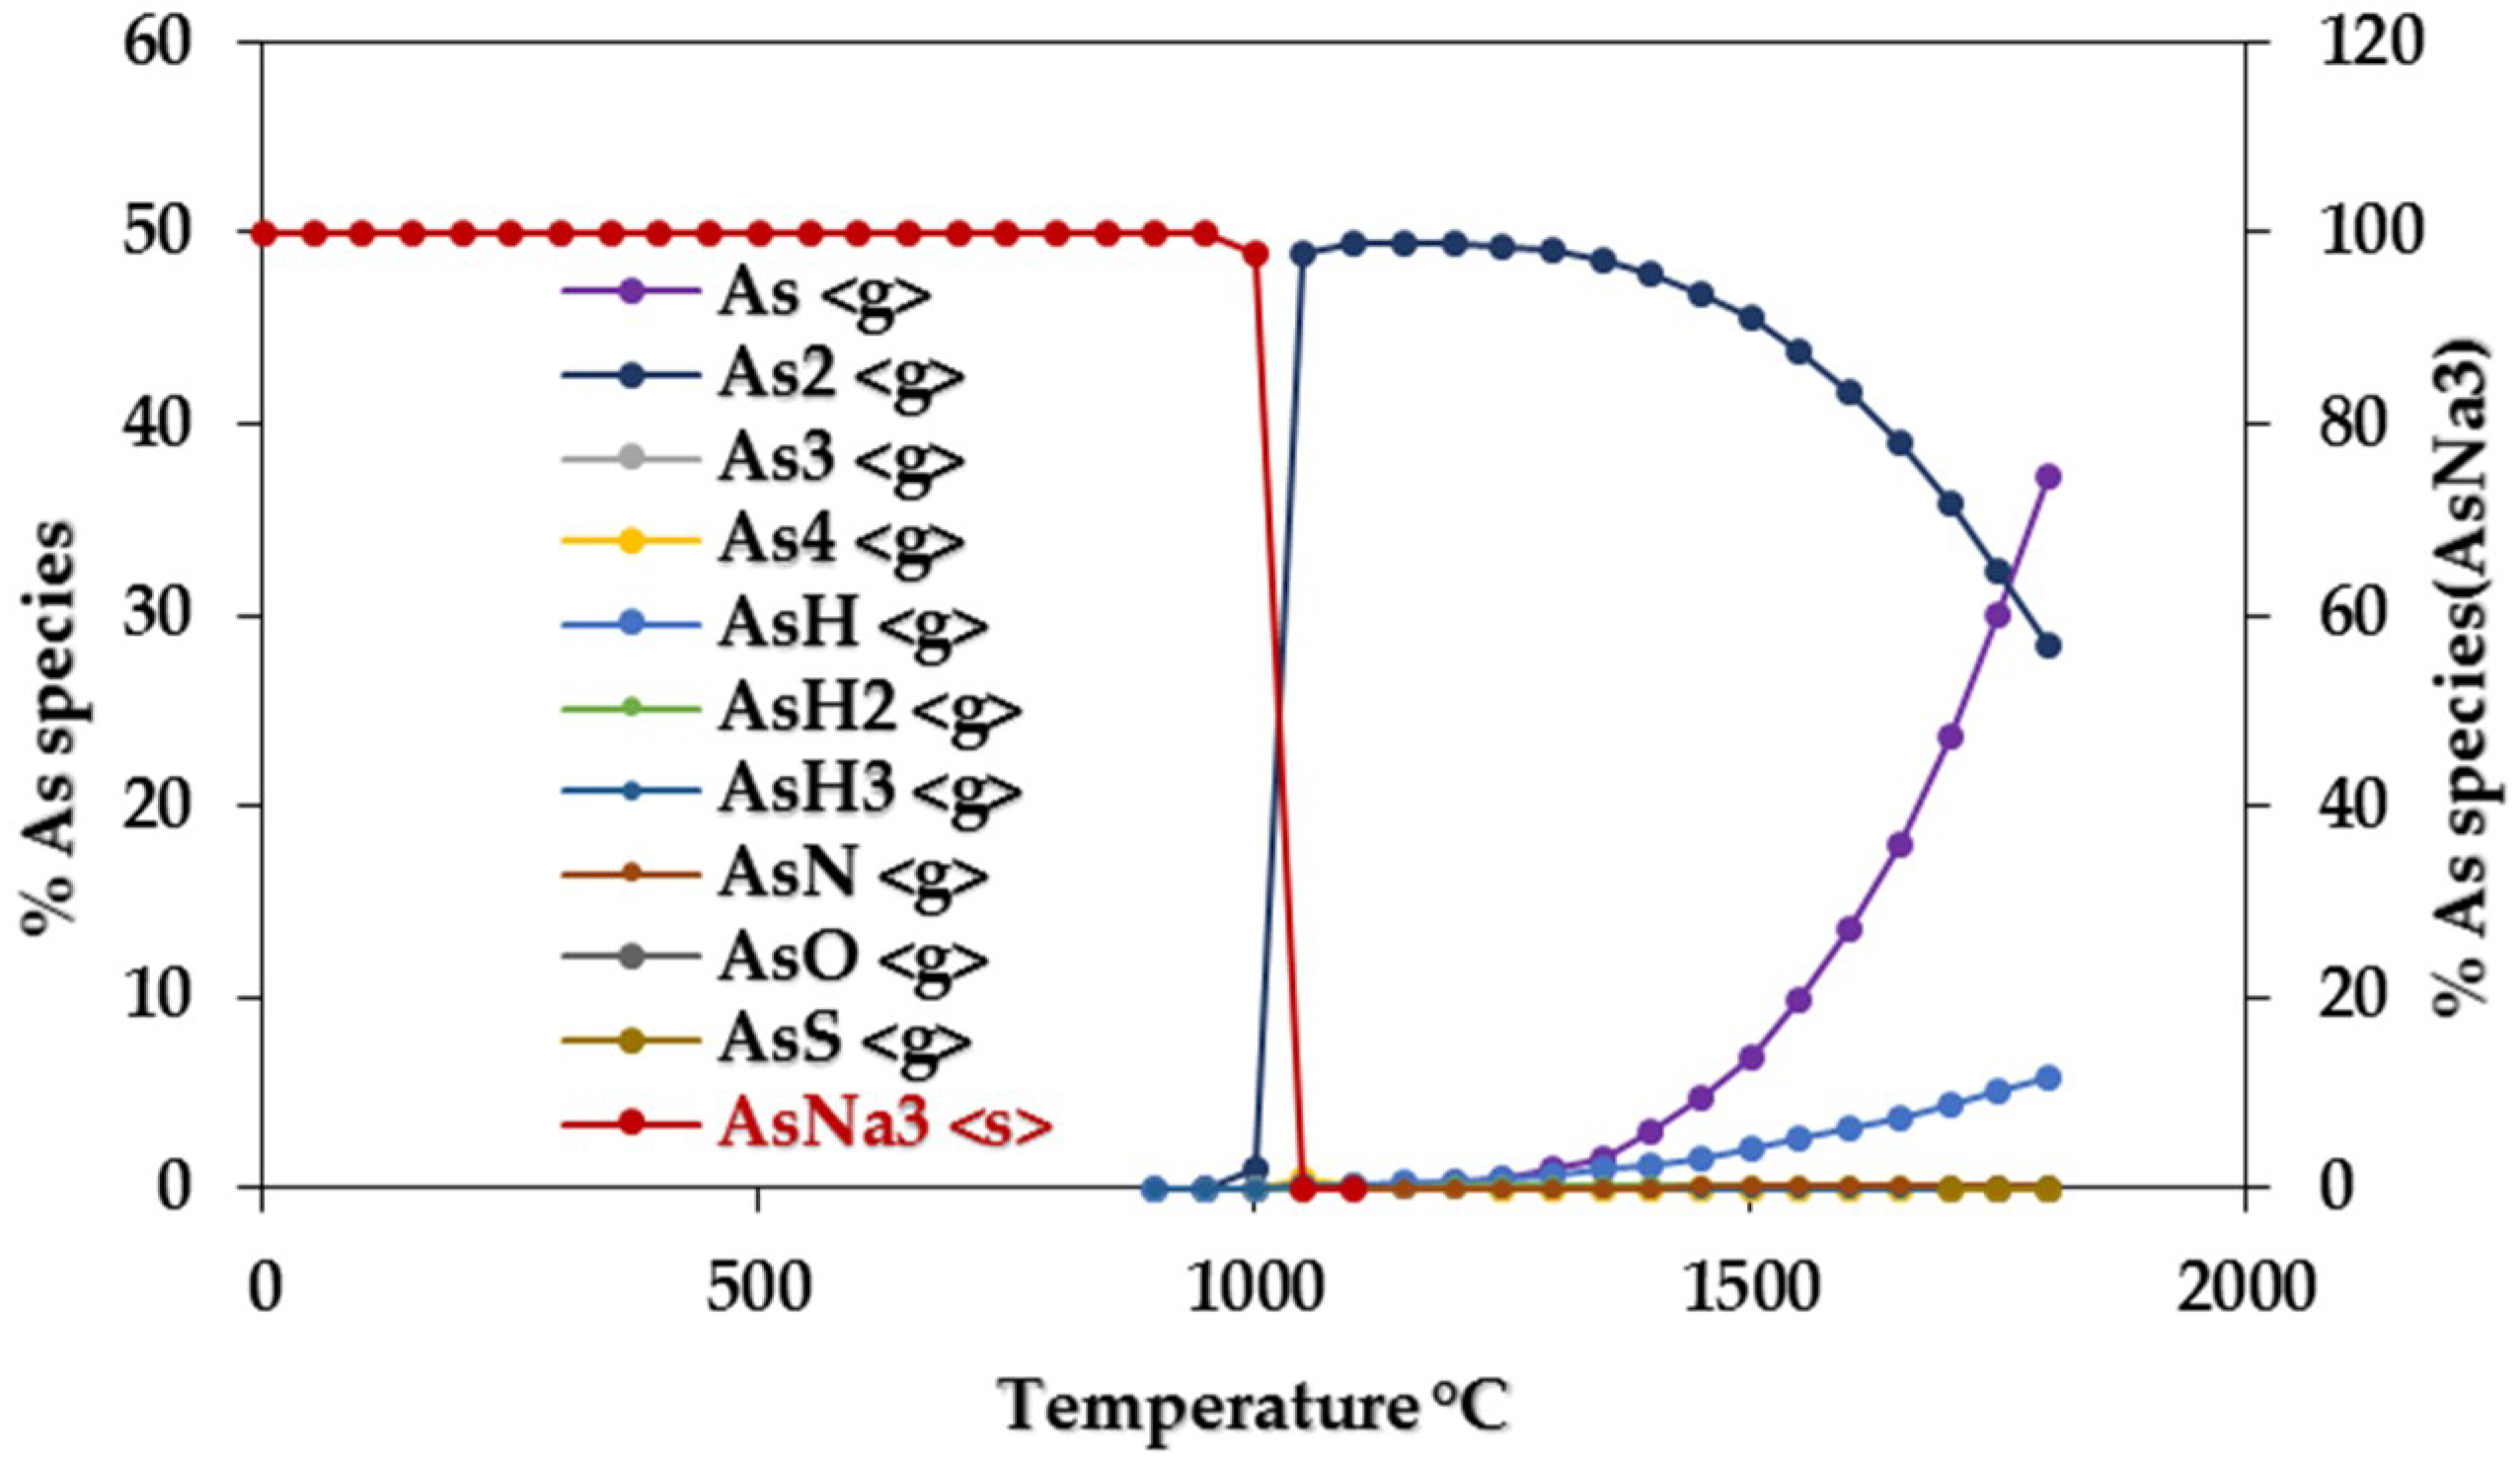
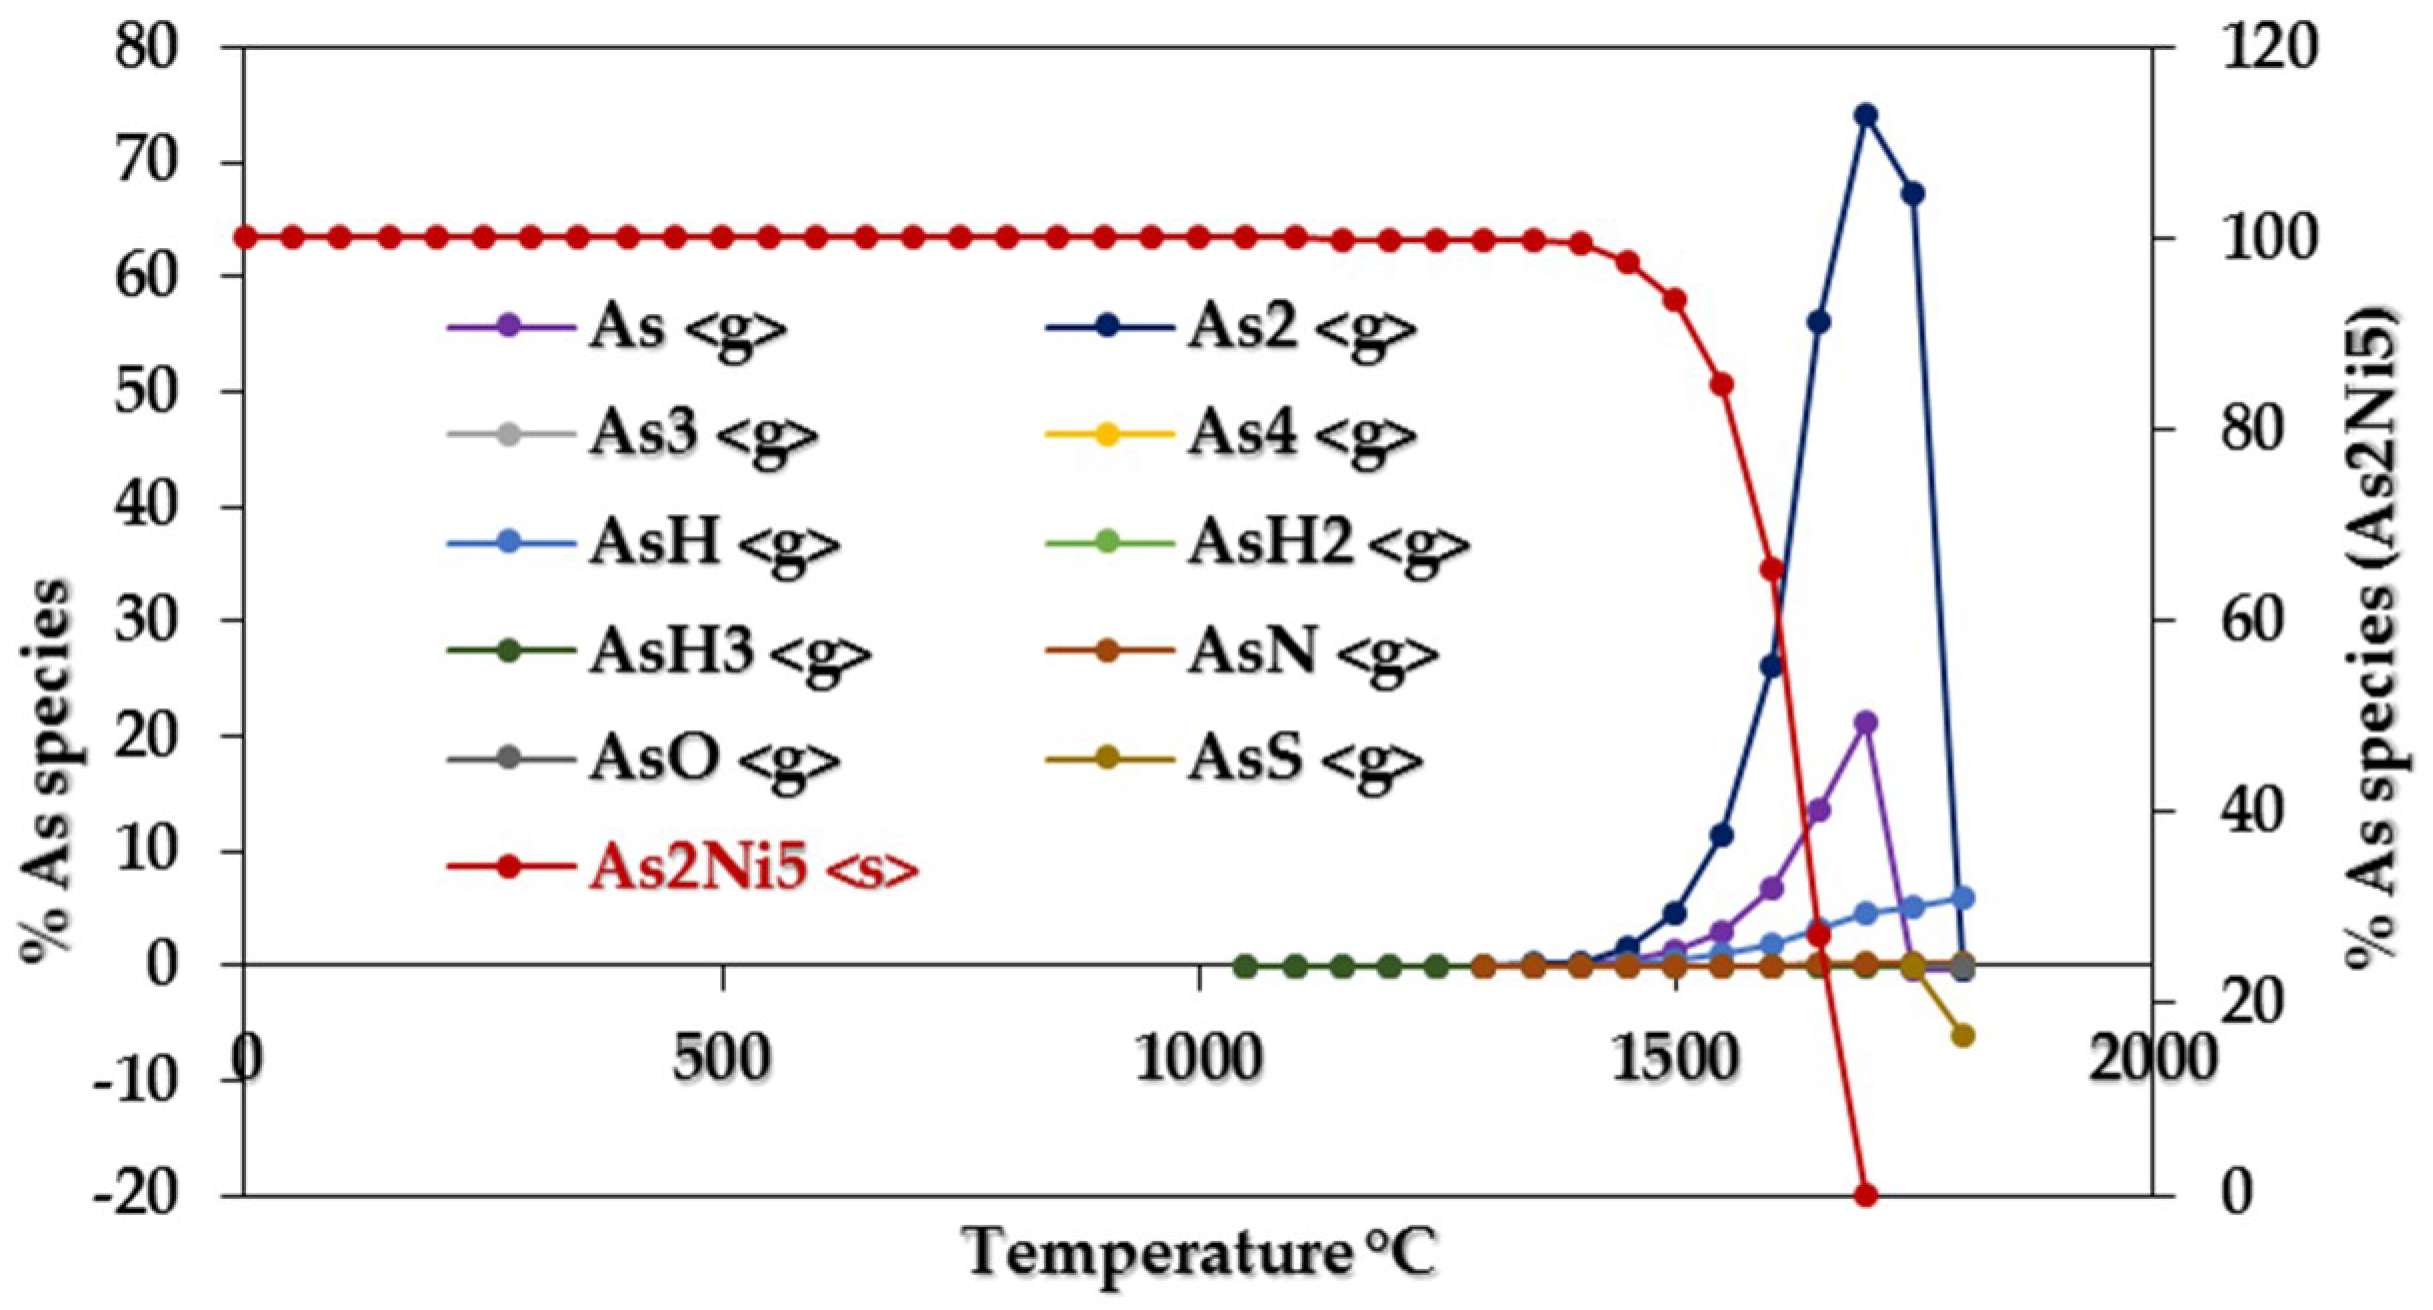
When Ni content is present at various concentrations, all Ni-As interactions generate solid specie As2Ni5, by which the phase transformation temperature of As (Figure 10) increases to about 450 °C. In contrast, the absence of Ni leads to the formation of As2 (gaseous) and AsNa3 (solid) as dominant species, as shown in Figure 11. Similarly, Na-As interactions yield AsNa3. While the absence of Na shows no influence on the As phase formation; it enhances Ni to capture As, generating As2Ni5 (100–99.15%) up to 1400 °C, as illustrated in Figure 12. Also, S tends to interact with As, yielding, at very low mass percentage, gaseous specie AsS between 1750 and 1800 °C.
Assessing CCA-elements Reactivity
All the minor elements were introduced to the model at the same concentration (0.25 mole/h) to assess the reactivity of the CCA-elements. In this case, the resulted speciation of CCA-elements are demonstrated in Figure 13a–c.
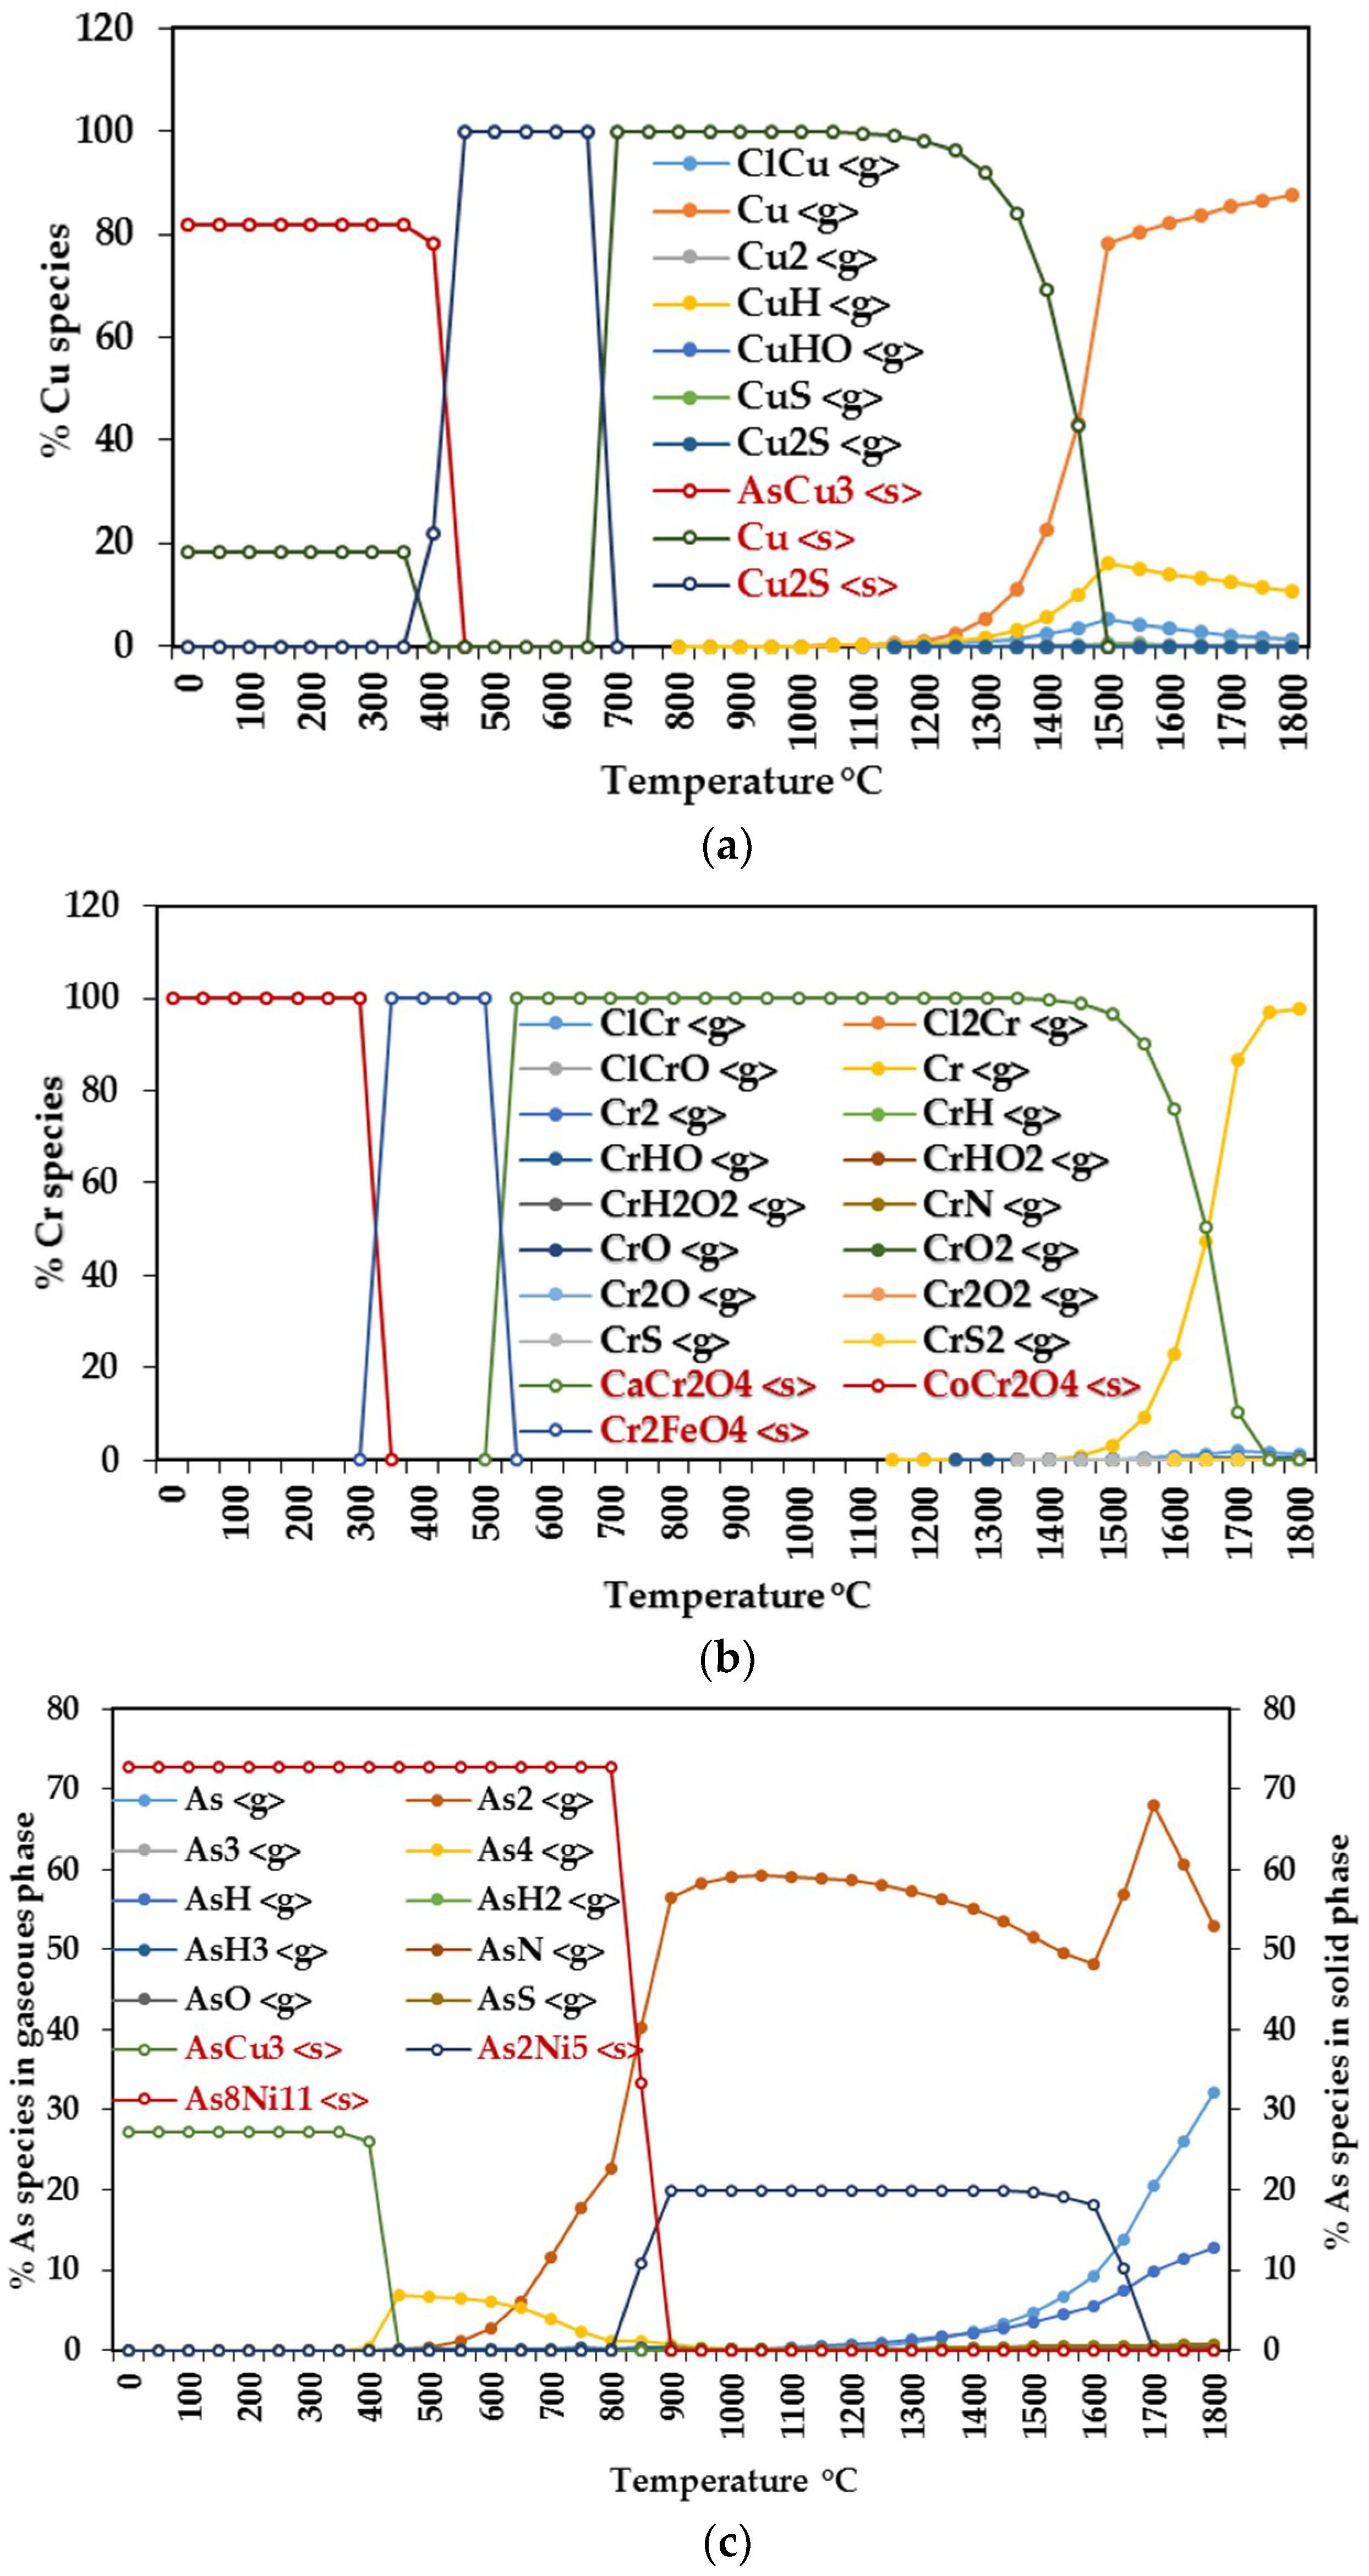
As can be seen in Figure 13a, the behavior of Cu between 0 and 700 °C indicates that Cu interacts favorably with As and S, forming the solid species AsCu3 (81.89–78.24%) and Cu2S (100%), respectively. At temperatures above 700 °C, Cu is redistributed as elemental and a set of gaseous species, and its phase transformation temperature becomes 1200 °C, which is less than about 11% of that obtained with equilibrium composition (Figure 3). The predictive calculations, as shown in Figure 13b, originate the Cr solid species CoCr2O4 (100% between 0–300 °C), Cr2FeO4 (100% between 350–500 °C), and CaCr2O4 (100% between 550–1450 °C) to the Co-O-Cr, Fe-O-Cr, and Ca-O-Cr interactions, respectively. Figure 13c shows As species formation. Intuitively, AsCu3 (27.27% between 0–400 °C) and As8Ni11 (72.73% between 0–800°C) are the most probable solid species from Cu-As and Ni-As interactions, respectively.
In this view, the distribution profiles of CCA-elements during gasification offer important trend towards their emissions control. More specifically, the presence of Ni and S enhances As and Cu capture in ash, respectively. Also, Cu and As interactions cause both of them to remain in solid phase, and the elements Ca, Co, and Fe are favored to Cr retention.
3.2. Under Boudouard Reaction (BR)
The modelling of BR was carried out using the composition data and BR process parameters, respectively, as reported in Table 2 and Table 4. The simulation scenarios were considered similar to those for the case of PCR. On the whole, the obtained results were similar to those observed with the PCR model, except that at equilibrium partitioning, about 99.99% of the CCA-elements remained in solid phase at temperatures less than 1300 °C; also no gaseous species were formed under pressure conditions of 20 and 40 atm. Table 7 demonstrates the phase and species formation of CCA-elements at equilibrium composition under 1 atm.
4. Conclusion
This paper introduces two predictive models for PCR and BR to understand the behavior of CCA-elements in terms of interactions and interferences during the gasification of contaminated WW. The refinement of the predicated results from PCR modelling indicates that most of the occurred Ni-As interactions led to about 100% of As remaining in solid phase at temperatures less than 1400 °C. It also indicates that Ca-Cr interferences form solid specie C3Cr7, but the absence of Ca causes instability in Cr distribution at temperatures from 1100 to 1550 °C. Whereas Co-O-Cr, Fe-O-Cr, and Ca-O-Cr interactions reduced the Cr volatilization as consequence of the generated solid species CoCr2O4, Cr2FeO4, and CaCr2O4, respectively. Most importantly, in both PCR and BR, the presence of Na and or Ni played a vital role for As remaining in solid phase at temperatures ≤800 °C. Eventually, these modellings are valuable for mitigating the negative impacts of toxicity emissions associated with CCA-elements; particularly, by systematically blending different types of contaminated WW prior to gasification.
Author Contributions
All authors contributed to this work. S.B.A.: Writing—Original Draft Preparation; S.T.W. and Y.J.: Supervision and Guidance.
Acknowledgments
The authors would like to thank Cranfield University for the facilities provided to carry out this work.
Conflicts of Interest
The authors declare no conflict of interest.
References
- Edo, M.; Björn, E.; Persson, P.E.; Jansson, S. Assessment of chemical and material contamination in waste wood fuels-A case study ranging over nine years. Waste Manag. 2016, 49, 311–319. [Google Scholar] [CrossRef] [PubMed]
- Brown, M.; Kearley, V. Role of wood waste as source of biomass fuel in the UK. Energy Mater. 2009, 4, 162–165. [Google Scholar] [CrossRef]
- Department for Environment, Food and Rural Affairs. Wood Waste: A Short Review of Recent Research; Department for Environment, Food and Rural Affairs: London, UK, 2012.
- Vassilev, S.V.; Baxter, D.; Andersen, L.K.; Vassileva, C.G. An overview of the chemical composition of biomass. Fuel 2010, 89, 913–933. [Google Scholar] [CrossRef] [Green Version]
- Kamińska-Pietrzak, N.; Smoliński, A. Selected Environmental Aspects of Gasification and Co-Gasification of Various Types of Waste. J. Sustain. Min. 2013, 12, 6–13. [Google Scholar] [CrossRef]
- Couto, N.; Rouboa, A.; Silva, V.; Monteiro, E.; Bouziane, K. Influence of the biomass gasification processes on the final composition of syngas. Energy Procedia 2013, 36, 596–606. [Google Scholar] [CrossRef]
- Pandey, A.; Bhaskar, T.; Stöcker, M.; Sukumaran, R. Recent Advances in ThermoChemical Conversion of Biomass; Elsevier: New York, NY, USA, 2015. [Google Scholar]
- Gomez-Barea, A.; Leckner, B. Modeling of biomass gasification in fluidized bed. Prog. Energy Combust. Sci. 2010, 36, 444–509. [Google Scholar] [CrossRef]
- James, R.; Arthur, M.; Yuan, W.; Boyette, M.D. The effect of biomass physical properties on top-lit updraft gasification of woodchips. Energies 2016, 9, 283. [Google Scholar] [CrossRef]
- González-Vázquez, M.P.; García, R.; Pevida, C.; Rubiera, F. Optimization of a bubbling fluidized bed plant for low-temperature gasification of biomass. Energies 2017, 10, 306. [Google Scholar] [CrossRef]
- Tanger, P.; Field, J.L.; Jahn, C.E.; DeFoort, M.W.; Leach, J.E. Biomass for thermochemical conversion: targets and challenges. Front. Plant Sci. 2013, 4, 218. [Google Scholar] [CrossRef] [PubMed]
- Tripathi, M.; Sahu, J.N.; Ganesan, P. Effect of process parameters on production of biochar from biomass waste through pyrolysis: A review. Renew. Sustain. Energy Rev. 2016, 55, 467–481. [Google Scholar] [CrossRef]
- Vervaeke, P.; Tack, F.M.G.; Navez, F.; Martin, J.; Verloo, M.G.; Lust, N. Fate of heavy metals during fixed bed downdraft gasification of willow wood harvested from contaminated sites. Biomass Bioenergy 2006, 30, 58–65. [Google Scholar] [CrossRef]
- Šyc, M.; Pohořelý, M.; Jeremiáš, M.; Vosecký, M.; Kameníková, P.; Skoblia, S.; Svoboda, K.; Punčochář, M. Behavior of heavy metals in steam fluidized bed gasification of contaminated biomass. Energy Fuels 2011, 25, 2284–2291. [Google Scholar] [CrossRef]
- Tafur-Marinos, J.A.; Ginepro, M.; Pastero, L.; Torazzo, A.; Paschetta, E.; Fabbri, D.; Zelano, V. Comparison of inorganic constituents in bottom and fly residues from pelletised wood pyro-gasification. Fuel 2014, 119, 157–162. [Google Scholar] [CrossRef]
- Zhou, X.; Liu, W.; Zhang, P.; Wu, W. Study on Heavy Metals Conversion Characteristics During Refused Derived Fuel Gasification Process. Procedia Environ. Sci. 2016, 31, 514–519. [Google Scholar] [CrossRef]
- Wu, M.H.; Lin, C.L.; Zeng, W.Y. Effect of waste incineration and gasification processes on heavy metal distribution. Fuel Process. Technol. 2014, 125, 67–72. [Google Scholar] [CrossRef]
- Jiang, Y.; Ameh, A.; Lei, M.; Duan, L.; Longhurst, P. Solid–gaseous phase transformation of elemental contaminants during the gasification of biomass. Sci. Total Environ. 2016, 563–564, 724–730. [Google Scholar] [CrossRef] [PubMed] [Green Version]
- Froment, K.; Defoort, F.; Bertrand, C.; Seiler, J.M.; Berjonneau, J.; Poirier, J. Thermodynamic equilibrium calculations of the volatilization and condensation of inorganics during wood gasification. Fuel 2013, 107, 269–281. [Google Scholar] [CrossRef]
- Kramb, J.; Konttinen, J.; Backman, R.; Salo, K.; Roberts, M. Elimination of arsenic-containing emissions from gasification of chromated copper arsenate wood. Fuel 2016, 181, 319–324. [Google Scholar] [CrossRef]
- Thompson, D.; Argent, B.B. Prediction of the distribution of trace elements between the product streams of the Prenflo gasifier and comparison with reported data. Fuel 2002, 81, 555–570. [Google Scholar] [CrossRef]
- Kilgallon, P.J.; Simms, N.J.; Oakey, J.E. Fate of trace contaminants from biomass fuels in gasification systems. Mater. Adv. Power Eng. 2002, 21, 903–912. [Google Scholar]
- Reed, G.P.; Dugwell, D.R.; Kandiyoti, R. Control of trace elements in a gasifier hot gas filter: A comparison with predictions from a thermodynamic equilibrium model. Energy Fuels 2001, 15, 1480–1487. [Google Scholar] [CrossRef]
- Liu, S.; Wang, Y.; Yu, L.; Oakey, J. Thermodynamic equilibrium study of trace element transformation during underground coal gasification. Fuel Process. Technol. 2006, 87, 209–215. [Google Scholar] [CrossRef]
- Bradshaw, A.; Simms, N.J.; Nicholls, J.R. Passage of trace metal contaminants through hot gas paths of gas turbines burning biomass and waste-fuels. Fuel 2008, 87, 3529–3536. [Google Scholar] [CrossRef]
- Svoboda, K.; Leitner, J.; Havlica, J.; Hartman, M.; Pohořelý, M.; Brynda, J.; Šyc, M.; Chyou, Y.P.; Chen, P.C. Thermodynamic aspects of gasification derived syngas desulfurization, removal of hydrogen halides and regeneration of spent sorbents based on La2O3/La2O2CO3 and cerium oxides. Fuel 2017, 197, 277–289. [Google Scholar] [CrossRef]
- Contreras, M.L.; Arostegui, J.M.; Armesto, L. Arsenic interactions during co-combustion processes based on thermodynamic equilibrium calculations. Fuel 2009, 88, 539–546. [Google Scholar] [CrossRef]
- Yan, R.; Gauthier, D.; Flamant, G. Possible interactions between As, Se, and Hg during coal combustion. Combust. Flame 2000, 120, 49–60. [Google Scholar] [CrossRef]
- Energy Research Centre of the Netherlands. Available online: https://www.ecn.nl/phyllis2/ (accessed on 20 March 2017).
- Prabir, B. Biomass Gasification, Pyrolysis, and Torrefaction Practical Design and Theory, 2nd ed; Academic Press: Cambridge, MA, USA, 30 July 2013. [Google Scholar]
Figure 1.
Schematic of the processes in a typical gasifier.

Figure 2.
(a) Probability distribution of moisture content; (b) p-value; and (c) interval confidence of probability distribution.
Figure 2.
(a) Probability distribution of moisture content; (b) p-value; and (c) interval confidence of probability distribution.

Figure 3.
Speciation of copper.

Figure 4.
Speciation of chromium.

Figure 5.
Speciation of arsenic.

Figure 6.
Cu, Cr, and As (CCA-elements) solid/gaseous transitions under 1, 20, and 40 atm: (a) chromium; (b) copper; (c) arsenic.
Figure 6.
Cu, Cr, and As (CCA-elements) solid/gaseous transitions under 1, 20, and 40 atm: (a) chromium; (b) copper; (c) arsenic.

Figure 7.
Resulting phase transformations of CCA-elements by changing the concentrations of each element individually: (a) copper; (b) chromium; (c) arsenic.
Figure 7.
Resulting phase transformations of CCA-elements by changing the concentrations of each element individually: (a) copper; (b) chromium; (c) arsenic.

Figure 8.
Interactions and interferences between the CCA-elements and each of Ca, Na, S, Cl, Fe, and Ni.
Figure 8.
Interactions and interferences between the CCA-elements and each of Ca, Na, S, Cl, Fe, and Ni.

Figure 9.
Effects of Ca on Cr phase formation.

Figure 10.
Arsenic distribution according to the presence/absence of Ni.

Figure 11.
Arsenic speciation in the absence of Ni.

Figure 12.
Arsenic speciation in the absence of Na.

Figure 13.
Speciation of CCA-elements when all minor elements are present at the same concentrations: (a) copper; (b) chromium; (c) arsenic.
Figure 13.
Speciation of CCA-elements when all minor elements are present at the same concentrations: (a) copper; (b) chromium; (c) arsenic.


Table 1.
The selected Cu, Cr, and As (CCA-elements) species.
| Species | As | Cr | Cu |
|---|---|---|---|
| Gaseous | As4O10, AsS, As4S4AsH2, AsH3, As4O8, As, As2, AsN, AsO, AsO2, AsCl3, AsH, As4O6, As4O7, As3, As4O9. | ClCr, CrHO, CrHO2CrHO3, CrH2O2, CrH2O3, Cl4Cr, Cl5Cr, Cl6Cr, ClCrO, CrH2O4, CrH3O3, Cl4CrO, Cr, Cr2, CrH, CrH3O4, CrH4O4, Cl2Cr, Cl3Cr, CrO2, CrO3, Cr2O, ClCrO2, Cl2CrO, Cl2CrO2, Cl3CrO, CrS2, CrH4O5, CrN, CrO, Cr2O2, Cr2O3, CrS. | Cl5Cu5, Cu, Cl3Cu3, Cl4Cu2, CuO, CuS, ClCu, Cu2S, Cu2, CuH, CuHO, Cl2Cu, Cl2Cu2, Cl4Cu4. |
| Liquid | AsCL3, As4S4. | - | - |
| Solid | As, As2Cu3O8, As2Fe3O, As2S2, AsNa3, AsCu3, As2Ca3O8, As2Co3O8, AsNa3O4, AsNi, As2Ni5, As8Ni11, AsCrO4, As2Cr3O8, AsS, AsCu3O4, As2Ni3O8, As2O5, As2S3, AsFeO4. | AsCrO4, Cl3Cr, CoCr2O4, Cr, Cr2O12S3, CrS, CaCrO3, CaCr2O4, Cl2Cr, Cr2O3, Cr5O12, Cr8O21, CrNa2O4, Cr2Na2O4, As2Cr3O8, C2Cr3, C3Cr7, C6Cr23, C6CrO6, Cr2FeO4, CrN, Cr2N, Cr2NiO4, CrO2, CrO3. | CuH6O7S, CuH10O9S, CuO, Cu2O, CuO4S, Cu2O4S, Cu2O5S, CuS, Cu2S, AsCu3, AsCu3O4, As2Cu3O8, CCuN, CCuO3, CaCu, Ca2CuO3, ClCu, Cl2Cu, Cu, CuFeO2, CuFe2O4, Cu2Fe2O4, CuFeS2, Cu5FeS4, CaCu5, Ca2Cu, CaCu2O3, CuH2O2, CuH2O5S. |
Table 2.
Statistical analysis results of the composition data.
| Composition | Min | Mean | Max | 5% | 95% |
|---|---|---|---|---|---|
| Moisture content (Ar) (%) | 4.68 | 14.86 | 33 | 3.82 | 27.31 |
| Ash content (Ar) (%) | 0.79 | 12.09 | 70.41 | 0.843 | 48.54 |
| Carbon (C) (Dry) (%) | 43.31 | 46.55 | 49.8 | 42.84 | 50.24 |
| Hydrogen (H) (Dry) (%) | 5.26 | 5.69 | 5.93 | 5.26 | 5.95 |
| Nitrogen (N) (Dry) (%) | 0.19 | 1.06 | 1.93 | 0.069 | 2.04 |
| Oxygen (O) (Dry) (%) | 37.13 | 40.57 | 55.79 | 37.3 | 47.34 |
| Sulphur (S) (Dry) (%) | 0.03 | 0.09 | 0.18 | 0.02489 | 0.176 |
| Chlorine (Cl) (Dry) (mg/kg) | 113 | 556.49 | 1000 | 48.19 | 1077.8 |
| Copper (Cu) (Dry) (mg/kg) | 4.8 | 63.64 | 385 | 5.04 | 286.8 |
| Nickel (Ni) (Dry) (mg/kg) | 2.8 | 15.69 | 46 | 2.19 | 43.99 |
| Arsenic (As) (Dry) (mg/kg) | 1.3 | 5.5 | 13 | 1.35 | 35.45 |
| Cobalt (Co) (Dry) (mg/kg) | 0.8 | 4.88 | 25 | 84% | 21.92 |
| Chromium (Cr) (Dry) (mg/kg) | 21 | 30.2 | 37 | 21.73 | 36.87 |
| Sodium (Na) (Dry) (mg/kg) | 210 | 703.92 | 1613 | 162.0 | 1645.5 |
| Calcium (Ca) (Dry) (mg/kg) | 2200 | 4061.41 | 6537 | 2247.0 | 8959.29 |
| Iron (Fe) (Dry) (mg/kg) | 340.3 | 655.96 | 1082 | 348.16 | 2037.09 |
Table 3.
Mass ranges of minor elements.
| Element | Concentration (mole/h) | Element | Concentration (mole/h) | Element | Concentration (mole/h) |
|---|---|---|---|---|---|
| As | 0, 0.7, 1.4, 5 | Ca | 0, 100, 250, 500, 1000 | Ni | 0, 5, 10, 20 |
| Cu | 0, 4, 6, 8 | Cl | 0, l0, 50, 100 | Na | 0, 100, 200, 500 |
| Cr | 0, 5, 10, 21 | Fe | 0, 50, 100, 500 | S | 0, 0.05, 0.1, 0.2 |
Table 4.
Operational parameters and gasification agents for partial combustion reaction (PCR) and Boudouard reaction (BR).
Table 4.
Operational parameters and gasification agents for partial combustion reaction (PCR) and Boudouard reaction (BR).
| Parameter | PCR | BR |
|---|---|---|
| Temperature range (°C) | 0–1800 | 0–1300 |
| Pressure (atm) | 1 | 1 |
| Equivalence ratio (kg/h) | 0.2 | 0 |
| Biomass rate (m3/h) | 3.59 | 3.59 |
| Air rate (m3/h) | 0.72 | - |
| Steam rate | 1.44 | - |
| Steam/Air | 2:1 | - |
| CO2 | - | 1.19 |
| CO2/Biomass | - | 1:3 |
Table 5.
Calcium-copper interactions during PCR.
| Ca Concentration (mole/h) | Species | Temperature Range (°C) |
|---|---|---|
| 100 | Cu <s> | 0–800 |
| Cu <s>, Cu <g>, CuH <g> | 850–950 | |
| Cu <s>, ClCu <g>, Cu <g>, CuH <g> | 1000–1800 | |
| 250 | CaCu <s> | 0–800 |
| Cu <g>, CuH <g>, CaCu <s> | 850–1150 | |
| ClCu <g>, Cu <g>, Cu2 <g>, CuH <g>, CaCu <s> | 1350–1800 | |
| 500 | CaCu <s>, CaCu5 <s> | 0–800 |
| Cu, Cu <g>, CuH <g> | 850–950 | |
| Cu <g>, CuH <g>, CaCu <s> | 1000–1150 | |
| ClCu <g>, Cu <g>, Cu2 <g>, CuH <g>, CaCu <s> | 1250–1800 | |
| 1000 | CaCu <s> | 0–800 |
| Cu <g>, CuH <g>, CaCu <s> | 850–950 | |
| Cu <g>, CuH <g>, CaCu <s> | 1000–1150 | |
| ClCu <g>, Cu <g>, Cu2 <g>, CuH <g>, CaCu <s> | 1250–1800 |
Table 6.
Chromium-calcium interactions.
| Ca Concentration (mole/h) | Species | Temperature Range (°C) |
|---|---|---|
| 0 | Cr2Na2O4 <s> | 0–300 |
| C2Cr3 <s>, Cr2Na2O4 <s> | 350–400 | |
| Cr2Na2O4 <s> | 450–600 | |
| Cr <g>, C2Cr3 <s>, Cr2Na2O4 <s> | 650–1200 | |
| ClCr <g>, Cl2Cr <g>, Cr <g>, CrHO <g>, CrS <g>, C2Cr3 <s>, Cr <s>, C3Cr7 <s>, C6Cr23 <s> | 1250–1800 | |
| 100 | C2Cr3 <s>, CaCr2O4 <s>, CrN <s>, Cr2Na2O4 <s> | 0–300 |
| C2Cr3 <s>, Cr2Na2O4 <s> | 350–400 | |
| C2Cr3 <s>, CaCr2O4 <s> | 450–600 | |
| ClCr <g>, Cr <g>, C2Cr3 <s>, CaCr2O4 <s> | 650–1200 | |
| ClCr <g>, Cl2Cr <g>, Cr<g>, C2Cr3 <s> | 1250–1800 | |
| 250–500 | C2Cr3 <s> | 0–300 |
| C2Cr3 <s>, C3Cr7 <s> | 350–600 | |
| C3Cr7 <s> | 650–1200 | |
| C2Cr3 <s>, ClCr <g>, Cl2Cr <g>, Cr <g>, CrH <g>, C3Cr7 <s>, CrO <g>, CrS <g>, CrN <g> | 1250–1800 | |
| 10000 | C3Cr7 <s> | 0–600 |
| Cr <g>, C3Cr7 <s> | 650–1200 | |
| ClCr <g>, Cl2Cr <g>, Cr <g>, CrH <g>, CrO <g>, CrS <g>, CrN <g>, C3Cr7 <s> | 1250–1800 |
Table 7.
Phase transformations and speciation of the CCA-elements.
| Elements | Solid Phase | Temperature (°C) | Gaseous Phase | Temperature (°C) |
|---|---|---|---|---|
| Cr | C3Cr7 | 0–1300 | Cr | 1000–1300 |
| CrCl | 1250–1300 | |||
| CrH | 1300 | |||
| Cu | CaCu | 0–1300 | Cu, CuH | 900–1300 |
| Cu2, ClCu | 1150–1300 | |||
| As | AsNa3 | 0–800 | As, As2, AsH, AsH2 | 1150–1300 |
| As2Ni5 | 850–1300 | AsH3 | 1150–1300 |
© 2018 by the authors. Licensee MDPI, Basel, Switzerland. This article is an open access article distributed under the terms and conditions of the Creative Commons Attribution (CC BY) license (http://creativecommons.org/licenses/by/4.0/).
Share and Cite
MDPI and ACS Style
Al-Badri, S.B.; Jiang, Y.; Wagland, S.T. Possible Interactions and Interferences of Copper, Chromium, and Arsenic during the Gasification of Contaminated Waste Wood. Energies 2018, 11, 1966. https://doi.org/10.3390/en11081966
AMA Style
Al-Badri SB, Jiang Y, Wagland ST. Possible Interactions and Interferences of Copper, Chromium, and Arsenic during the Gasification of Contaminated Waste Wood. Energies. 2018; 11(8):1966. https://doi.org/10.3390/en11081966
Chicago/Turabian StyleAl-Badri, Shurooq Badri, Ying Jiang, and Stuart Thomas Wagland. 2018. "Possible Interactions and Interferences of Copper, Chromium, and Arsenic during the Gasification of Contaminated Waste Wood" Energies 11, no. 8: 1966. https://doi.org/10.3390/en11081966
Note that from the first issue of 2016, this journal uses article numbers instead of page numbers. See further details here.