A Rough Multi-Criteria Decision-Making Approach for Sustainable Supplier Selection under Vague Environment

1
School of Economics and Management, Beihang University, Beijing 100191, China
2
School of Information Engineering, Handan University, Handan 056005, China
3
Beijing Key Laboratory of Emergency Support Simulation Technologies for City Operations, Beihang University, Beijing 100191, China
4
School of Mechanical Engineering, Shanghai Jiao Tong University, Shanghai 200240, China
*
Author to whom correspondence should be addressed.
Sustainability 2018, 10(8), 2622; https://doi.org/10.3390/su10082622
Submission received: 13 June 2018
/
Revised: 11 July 2018
/
Accepted: 23 July 2018
/
Published: 26 July 2018
Abstract
:With the growing awareness of environmental and social issues, sustainable supply chain management (SSCM) has received considerable attention both in academia and industry. Supplier selection plays an important role in the successful implementation of sustainable supply chain management, because it can influence the performance of SSCM. Sustainable supplier selection is a typical multi-criteria decision-making problem involving subjectivity and vagueness. Although some previous researches of supplier selection use fuzzy approaches to deal with vague information, it has been criticized for requiring much priori information and inflexibility in manipulating vagueness. Moreover, the previous methods often omit the environmental and social evaluation criteria in the supplier selection. To manipulate these problems, a new approach based on the rough set theory and ELECTRE (ELimination Et Choix Traduisant la REalité) is developed in this paper. The novel approach integrates the strength of rough set theory in handling vagueness without much priori information and the merit of ELECTRE in modeling multi-criteria decision-making problem. Finally, a case study of sustainable supplier selection for solar air-conditioner manufacturer is provided to demonstrate the application and potential of the approach.
1. Introduction
Manufacturing companies today cannot ignore sustainability concerns in their business because of increased environmental awareness and ecological pressures from markets and various stakeholders [1,2,3]. Sustainable supplier selection is critical to enhance supply chain performance and competitive advantage [4]. This is because suppliers play an important role in implementing sustainable supply chain management (SSCM) practices and in achieving social, environmental and economic goals [5]. In this respect, sustainable supplier selection based on the sustainability criteria (economic, environmental and social) is a critical strategic decision for SSCM [6,7] and it requires to be further explored methodically to help achieve sustainability of the whole supply chain.
Although many researchers explore the topic of supplier selection, the study on the sustainable supplier selection is still in the early stage. Most studies of sustainable supplier selection have only focused on the economic and environmental aspects of sustainability. The social aspect of sustainability is often omitted in the decision–making for supplier selection. Besides, the problem of supplier selection is a typical multi-criteria decision-making (MCDM) problem. The decision makers always need to make trade-offs between conflicting criteria to select the most suitable supplier. It is difficult to obtain accurate judgments of decision makers in the process of supplier evaluation, because supplier selection involves large amount of linguistic information and subjective expert knowledge that are usually imprecise, vague or even inconsistent. To deal with this problem, fuzzy methods are often used to select suppliers. However, the fuzzy methods need much priori information (e.g., pre-set fuzzy membership function) which may increase the workload of decision makers [8,9]. The previous approaches also lack a flexible mechanism to deal with the subjective evaluations of experts [10,11].
Therefore, to manipulate the above problems in sustainable supplier selection, this paper proposes a novel integrated group decision method based on the ELECTRE (ELimination Et Choix Traduisant la REalité) approach and rough set theory in vague environments. Different with methods based on the compensating accumulation principle (e.g., TOPSIS(Technique for Order Preference by Similarity to an Ideal Solution)), the ELECTRE method is based on a precedence relation and it can meet different evaluation requirements by defining undifferentiated threshold, strict superior threshold and rejection threshold and thus, it has stronger flexibility in decision–making of supplier selection. Furthermore, the rough number originated from the rough set theory can flexibly reflect the uncertainty in decision–making process of supplier selection and it does not require much priori information. In this respect, the proposed novel approach integrates the merit of ELECTRE in modeling multi-criteria decision-making problem and the strength of rough set theory in handling vagueness without much priori information.
The paper is organized as follows: Section 2 presents a literature review of supplier selection, ELECTRE method and rough set. Section 3 develops an integrated rough ELECTRE method for sustainable supplier selection. In the Section 4, a case study of sustainable supplier selection for solar air-conditioner manufacturer is used to validate the feasibility and effectiveness of the method and a comparative analysis is also conducted in this section. In Section 5, conclusions and future research directions are presented.
2. Literature Review
2.1. Evaluation Criteria for Sustainable Supplier Selection
Supplier selection decisions are important for most of manufacturing firms, because a right supplier can effectively improve the economic benefit of the manufacturing firm [12,13]. In the past, economic criteria are usually used for supplier selection. The environment and social criteria are often overlooked. However, with the development of sustainable supply chain management (SSCM), both the researchers and practitioners are paying more attention to environment criteria and social criteria in supplier selection [14]. They find it is important to incorporating the social and environment criteria into the supplier selection process [15,16]. This paper summarizes the sustainable supplier selection criteria from the economic, environment and social aspects. The details of the recognized sustainable supplier selection criteria with their sources and descriptions are summarized in Table 1.
2.2. The Methods of Sustainable Supplier Selection
Selecting the right suppliers to set up optimal supplier networks can help to reduce purchasing costs and increase the efficiency of the procurement logistics process [28]. Supplier selection is a multi-criteria decision-making problem. There are some papers concerning sustainable (or green) suppliers. Dai and Blackhurst (2012) integrate Analytical Hierarchy Process (AHP) with Quality Function Deployment (QFD) for sustainable supplier selection [18]. The approach consists of four stages, that is, linking customer requirements with the firm’s sustainability strategy, determining the sustainable purchasing competitive priority, determining evaluation criteria of sustainable supplier and evaluating the sustainable suppliers. Hsu and Hu (2009) develop a method for selecting suppliers with emphasis on issues of hazardous substance management based on Analytic Network Process (ANP) [29]. Liu and Hai (2005) provide a method called voting analytic hierarchy process for supplier selection [30]. Although AHP/ANP methods are more popular in the field of the supplier selection, they are always used to determine the relative importance weightings of criteria and sub-factors merely. They need to be integrated with other decision–making techniques. Besides, due to the number of pairwise comparisons that need to be made, the number of supplier selections is practically limited in the AHP/ANP-based supplier selection methods. Moreover, the conventional AHP/ANP methods do not consider the vagueness of decision–making information.
To manipulate the increasing number of the suppliers, data envelopment analysis (DEA) is a prevalent approach used in supplier selection. This is because DEA can easily handle huge number of suppliers with little managerial input and output required. Kuo et al. (2012) present a green supplier selection method using an analysis network process as well as data envelopment analysis (DEA) [31]. ANP which is able to consider the interdependency between criteria releases the constraint of DEA that the users cannot set up criteria weight preferences. Wu and Blackhurst (2009) propose an augmented DEA approach for supplier evaluation and selection [32]. Sevkli et al. (2007) develop a new supplier selection method by embedding the DEA approach into AHP methodology [33]. They conclude that the integrated method outperforms the conventional AHP method for supplier selection. However, DEA-based supplier selection methods have some drawbacks. The practitioners may be confused with input and output criteria. Besides, DEA is a linear programming to measure the relative efficiencies of homogenous decision–making units (DMUs). An efficient supplier generating more outputs while requiring less input may be not an effective supplier. Furthermore, the conventional DEA also does not consider the subjectivity and vagueness in the decision–making process.
Beside the multi-criteria decision–making method, some researchers use heuristic optimization approaches to select proper suppliers. Basnet and Leung (2005) develop an incapacitated mixed linear integer programming which minimizes the aggregate purchasing, ordering and holding costs subject to demand satisfaction [34]. They solve the problem with an enumerative search algorithm and a heuristic procedure. Veres et al. (2017) propose a heuristic method for optimizing supply chain including intelligent transportation systems (ITS) based vehicles for transportation operations problems [35]. To solve the multi-product multi-period inventory lot sizing with supplier selection problem, Cárdenas-Barrón et al. (2015) propose a heuristic algorithm based on reduce and optimize approach (ROA) and a new valid inequality [36]. Unfortunately, the heuristic optimization approaches omit the vagueness and subjectivity in the decision–making, which may lead to inaccurate results of supplier selection.
In order to deal with the imprecise or vague nature of linguistic assessment in evaluation and selection of suppliers, fuzzy set theory is introduced into the conventional approaches. Considering time pressure and lack of expertise in sustainable supplier selection, Büyüközkan and Çifçi (2011) developed a method based on fuzzy analytic network process within group decision-making schema under incomplete preference relations [37]. To manipulate the subjectivity of decision makers’ evaluations, Amindoust et al. (2012) develop a new ranking method on the basis of fuzzy inference system (FIS) for sustainable supplier selection problem [6]. Azadnia et al. (2015) developed an integrated method based on rule-based weighted fuzzy approach [38], fuzzy analytical hierarchy process and multi-objective mathematical programming for sustainable supplier selection and order allocation. Grisi et al. (2010) propose a fuzzy AHP method for green supplier selection using a seven-step approach [39]. Fuzzy logic is used to overcome uncertainty caused by human qualitative judgments. ELECTRE (ELimination Et Choix Traduisant la REalité) methods are able to make a successful assessment of each alternative based on knowledge of the concordance and discordance sets for all pairs of alternatives. They are often used to select right suppliers [40]. Thus, Sevkli (2010) proposes a fuzzy ELECTRE for supplier selection [41]. Although the fuzzy methods can deal with the imprecise or vague nature of linguistic assessment, it requires priori information (e.g., pre-set membership function). Moreover, the fuzzy methods always convert linguistic variables into fuzzy numbers with fixed intervals. Therefore, computation results usually do not exactly match initial linguistic terms, which easily cause loss of information and lack of precision in the final results.
Although these methods have brought great insights to supplier selection literature, most of them lack flexible mechanisms to handle the subjectivity and the vagueness of decision makers’ assessments. Although some fuzzy methods of supplier selection (e.g., fuzzy ELECTRE) consider the vagueness in decision–making information, they require much priori information (e.g., pre-set fuzzy membership function) which consumes much time and effort of managers. Moreover, the previous fuzzy approaches use fuzzy number with fixed interval to indicate the uncertainty, which cannot identify the changes in decision makers’ judgments. For those reasons, there is a clear need for a new formal decision support methodology for the sustainable supplier selection under vague environment.
3. The Proposed Method
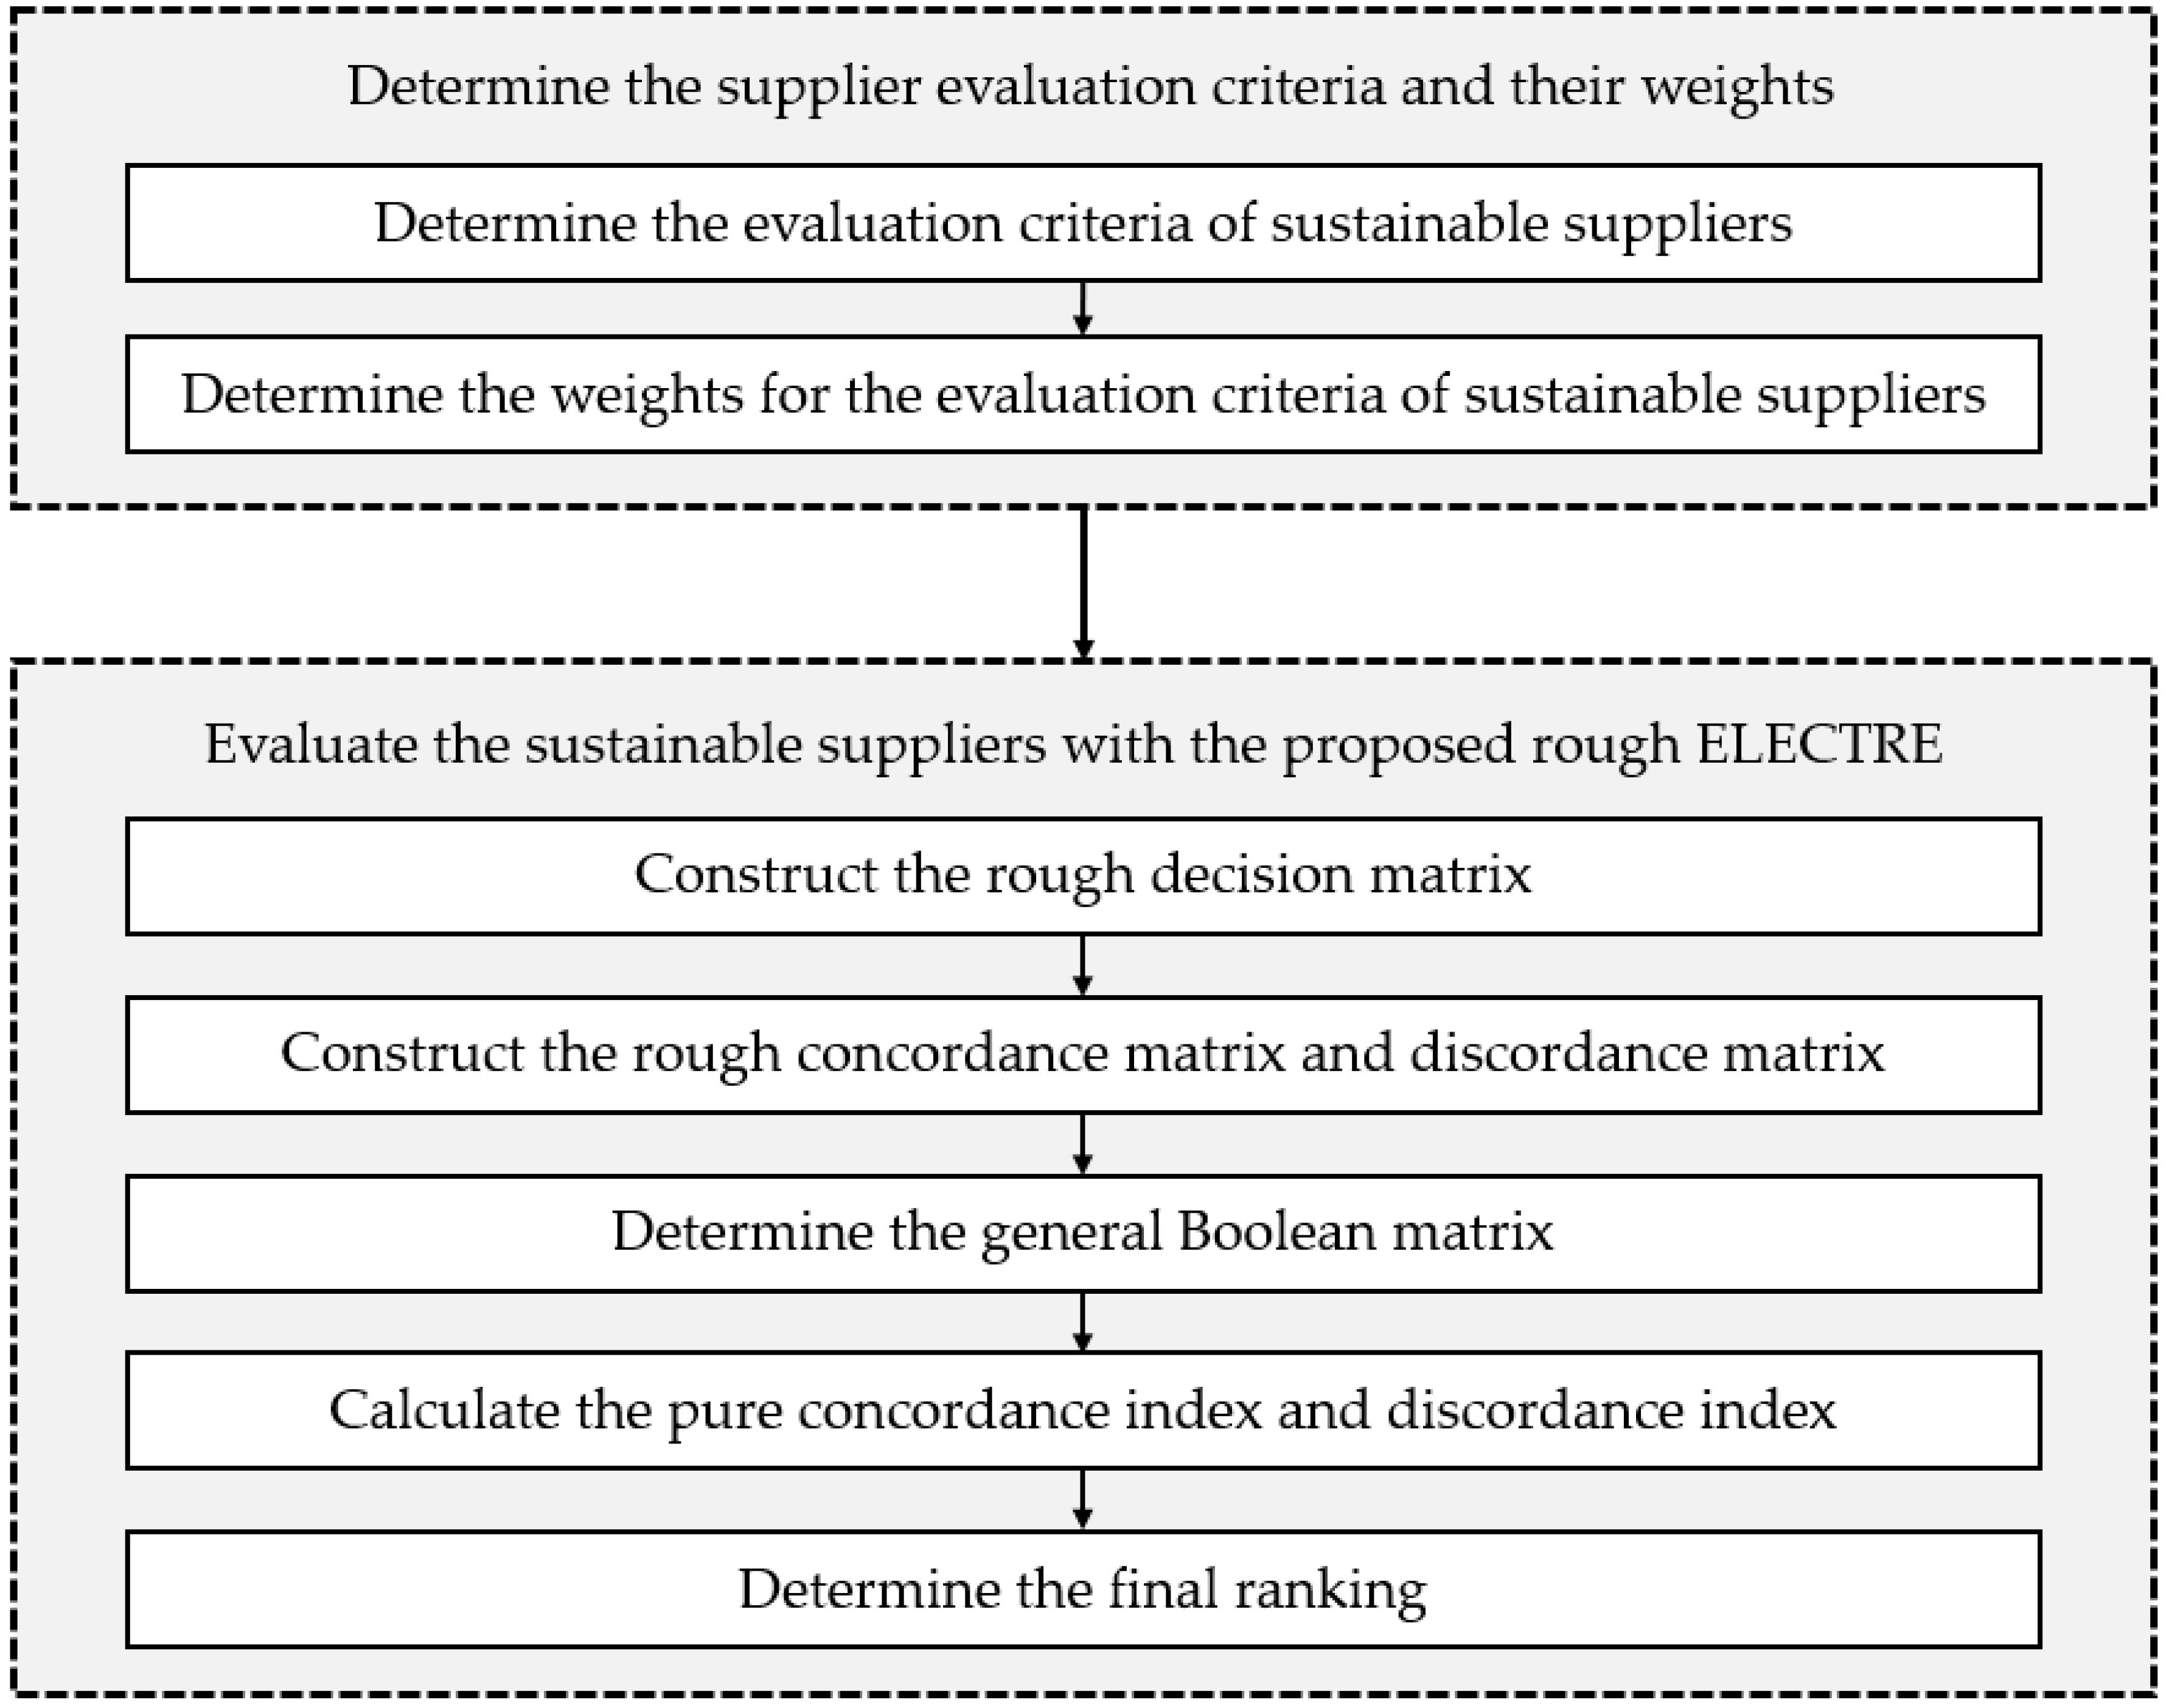
The main objective of this paper is to propose an integrated method for sustainable supplier selection based on rough set theory and ELECTRE. Besides, vagueness manipulation is also considered in the proposed approach. A flowchart of the proposed approach is shown in Figure 1.
3.1. Determine the Supplier Evaluation Criteria and Their Weights
Step 1: determine the evaluation criteria of sustainable suppliers
First of all, a panel of expert who are knowledgeable about supplier selection is established. The group has k decision-makers (i.e., ) who are responsible for determining and the ranking each criterion (i.e., ). For the sustainable supplier selection, three aspects we should take into consideration. They are economic criteria, environmental criteria and social criteria.
Step 2: determine the weights for the evaluation criteria of sustainable suppliers
Experts have their own individual experience and knowledge. Therefore, they may have different cognitive vagueness for alternatives and criteria. Let us assume a judgment set with h ordered judgments, in the manner of . Let be a random judgment in the set and is defined as the distance of , where . The lower approximation and the upper approximation of the judgment can be identified as follows.
Lower approximation set:
Upper approximation set:
where and are the elements of the lower approximation set and the upper approximation set of respectively and m and n are the number of elements in the two sets respectively.
For different criteria, experts might give different weights. Use indicate the weight of jth criterion with kth expert.
With the Formulas (1)–(5)
where and are the elements of the lower approximation set and the upper approximation set of respectively and m and n are the number of elements in the two sets respectively.
We could get the weight of each criterion .
3.2. Evaluate the Sustainable Suppliers with the Proposed Rough ELECTRE
Step 1: Construct the rough decision matrix
Apart from the decision for the weight of criteria, the experts should give the assessment of the alternatives with consideration of all the criteria. Let’s use to represent the kth expert scores on jth criterion in ith alternative. The following is the scoring matrix. Aggregate all the scoring matrix.
Determine the rough matrix with expert ratings.
where and are the elements of the lower approximation set and the upper approximation set of respectively and m and n are the number of elements in the two sets respectively.
Then, we normalize the rough decision matrix with the weight of criteria.
Step 2: Construct the rough concordance matrix and discordance matrix
In this step, we construct some field for the comparison among all the alternatives. We compare different alternatives in two aspects. One is the concordance and the other is the discordance. Construct the concordance and discordance matrices.
represents the areas that alternative is better than alternative and represents the areas that alternative is worse than alternative .
By means of the calculation, we could get the rough concordance matrix and discordance matrix .
Step 3: Determine the general Boolean matrix
After we get the concordance matrix and discordance matrix, we should determine the threshold value. Using it to transform the matrix into Boolean matrix. First, we calculate the mean of the all factors in matrix and matrix .
Compare the factors in matrix with and the factors in matrix with . According the result of the comparison, we get the concordance Boolean matrix and discordance Boolean matrix .
Then we could construct the general Boolean matrix .
According to the above calculations, we could get the general Boolean matrix. It is a basis for the ranking of the alternatives. If , that means alternative is better than alternative .
Step 4: Calculate the pure concordance index and discordance index
By the Boolean general matrix, we could get part relations between all alternatives. Since if , we know that alternative is better than alternative . But if and we could not infer the relationship of alternative and alternative from other alternatives, then we do not know which is better. In order to get a rank of all the alternatives, we bring into pure concordance index and discordance index .
Before calculating the pure index, we should transform rough interval into definite number. Song et al. (2017) has proposed this method. We use represents the calculation of changing rough interval into definite number [14].
The calculation includes the following procedures.
(1) Normalization
where and are the lower limit and the upper limit of the rough number respectively; and are the normalized form of and respectively.
(2) Determine the total normalized definite value by
(3) Compute the final definite value form for by
Therefore, we can use this method to calculate the concordance index and discordance index.
Step 5: Determine the final ranking
According to the , we can get a priority in concordance. The bigger value of the higher place the alternative would get. We use for the ranking in concordance. The same we can get the priority in discordance by . But on the contrary, the smaller value of the higher place the alternative would get. We use for the ranking in discordance. The final ranking is calculated as follows:
is the final rank of all the alternatives.
4. Case Study
In this section, in order to validate the applicability and effectiveness of the proposed method, we use an example to illustrate. We assume that there is a manufacturing company. For the purpose of choosing a good supplier, they set up a panel of 4 experts. The experts come from various departments including purchasing, quality and production and planning who are involved in the supplier selection process. And there are 8 suppliers for selection.
4.1. Implementation
4.1.1. Determine the Supplier Evaluation Criteria and Their Weights
Step 1: determine the evaluation criteria of sustainable suppliers
First of all, the experts make a decision of the criteria. In addition to economic criteria, environmental criteria and social criteria should also be considered for the sustainable supplier selection. These criteria consist of three parts, we use C1~10 to represent these ten criteria. They are Economic criteria including quality (C1), response (C2) and cost (C3); Environmental criteria including environmental management system (C4), carbon emission & resource consumption (C5), design for the environment (C6), Green image (C7); Social criteria including product liability (C8), employee right and welfare (C9), social commitment (C10). The detailed introduction is shown in Table 1. We use A1~8 to represent alternatives, E1~4 to represent experts.
Step 2: determine the weights for the evaluation criteria of sustainable suppliers
After the decision of criteria, experts should evaluate the weight of each criterion. The experts give their evaluation to the criteria in the Table 2. Firstly, we convert the grades which experts give to criteria into rough number. Take criterion C1 for example.
According to the Equations (6)–(13) in Section 3,
- ,
- ,
- ,
- ,
- ,
- ,
- ,
- ,
- ,
The same as the other criteria, following the same procedure, we can get the importance degree of all the criteria in Table 3.
4.1.2. Evaluate the Sustainable Suppliers with the Proposed Rough ELECTRE
Step 1: Construct the rough decision matrix
Different expert might hold different view for alternatives and criteria because of their personal experience and knowledge. And the true information is just contained in the cognitive vagueness. According to the evaluation towards the alternatives from the experts, we could get the rough number of each alternative. We take the data for criterion 1 in Table 4 for example.
According to the Equations (17)–(26), we use for the cth expert’s evaluation towards alternative b in criterion a. We can get the rough matrix in Table 5.
Then, we normalize the rough matrix. According to the Equations (27)–(30). We can get the result in Table 6.
Step 2: Construct the rough concordance matrix and discordance matrix
In this step, we construct the concordance and discordance matrices according to the normalized rough decision matrix. For the construct of the concordance matrix, we take alternative1 and alternative 2 for example. At the first, we should find in which criterion A1 performs better than A2, that means the score in certain criterion, A1 is higher than A2.
According to the Table 6, we could find in criterion 1, 2, 9, A1 performs better than A2. Add up all these weights of the criteria. We could get the value of in the concordance matrix. And we can get the concordance matrix in Table 7 by repeat these procedures.
For the construct of the discordance matrix. First of all, we find the criterion which A2 is better than A1. And we could find that they are criterion 3, 4, 5, 6, 7, 8, 10. Then we find the biggest distance in these criteria. Using it divide the biggest distance between A1 and A2. We can get the value of . Repeating these procedures and we can get the discordance matrix in Table 8.
Step 3: Determine the general Boolean matrix
Based on concordance and discordance matrix, we construct the concordance Boolean and discordance Boolean matrices. Calculate the concordance index and discordance index. Follow the Equations (37)–(41).
According to the Equation (42), we could get the general matrix in Table 11.
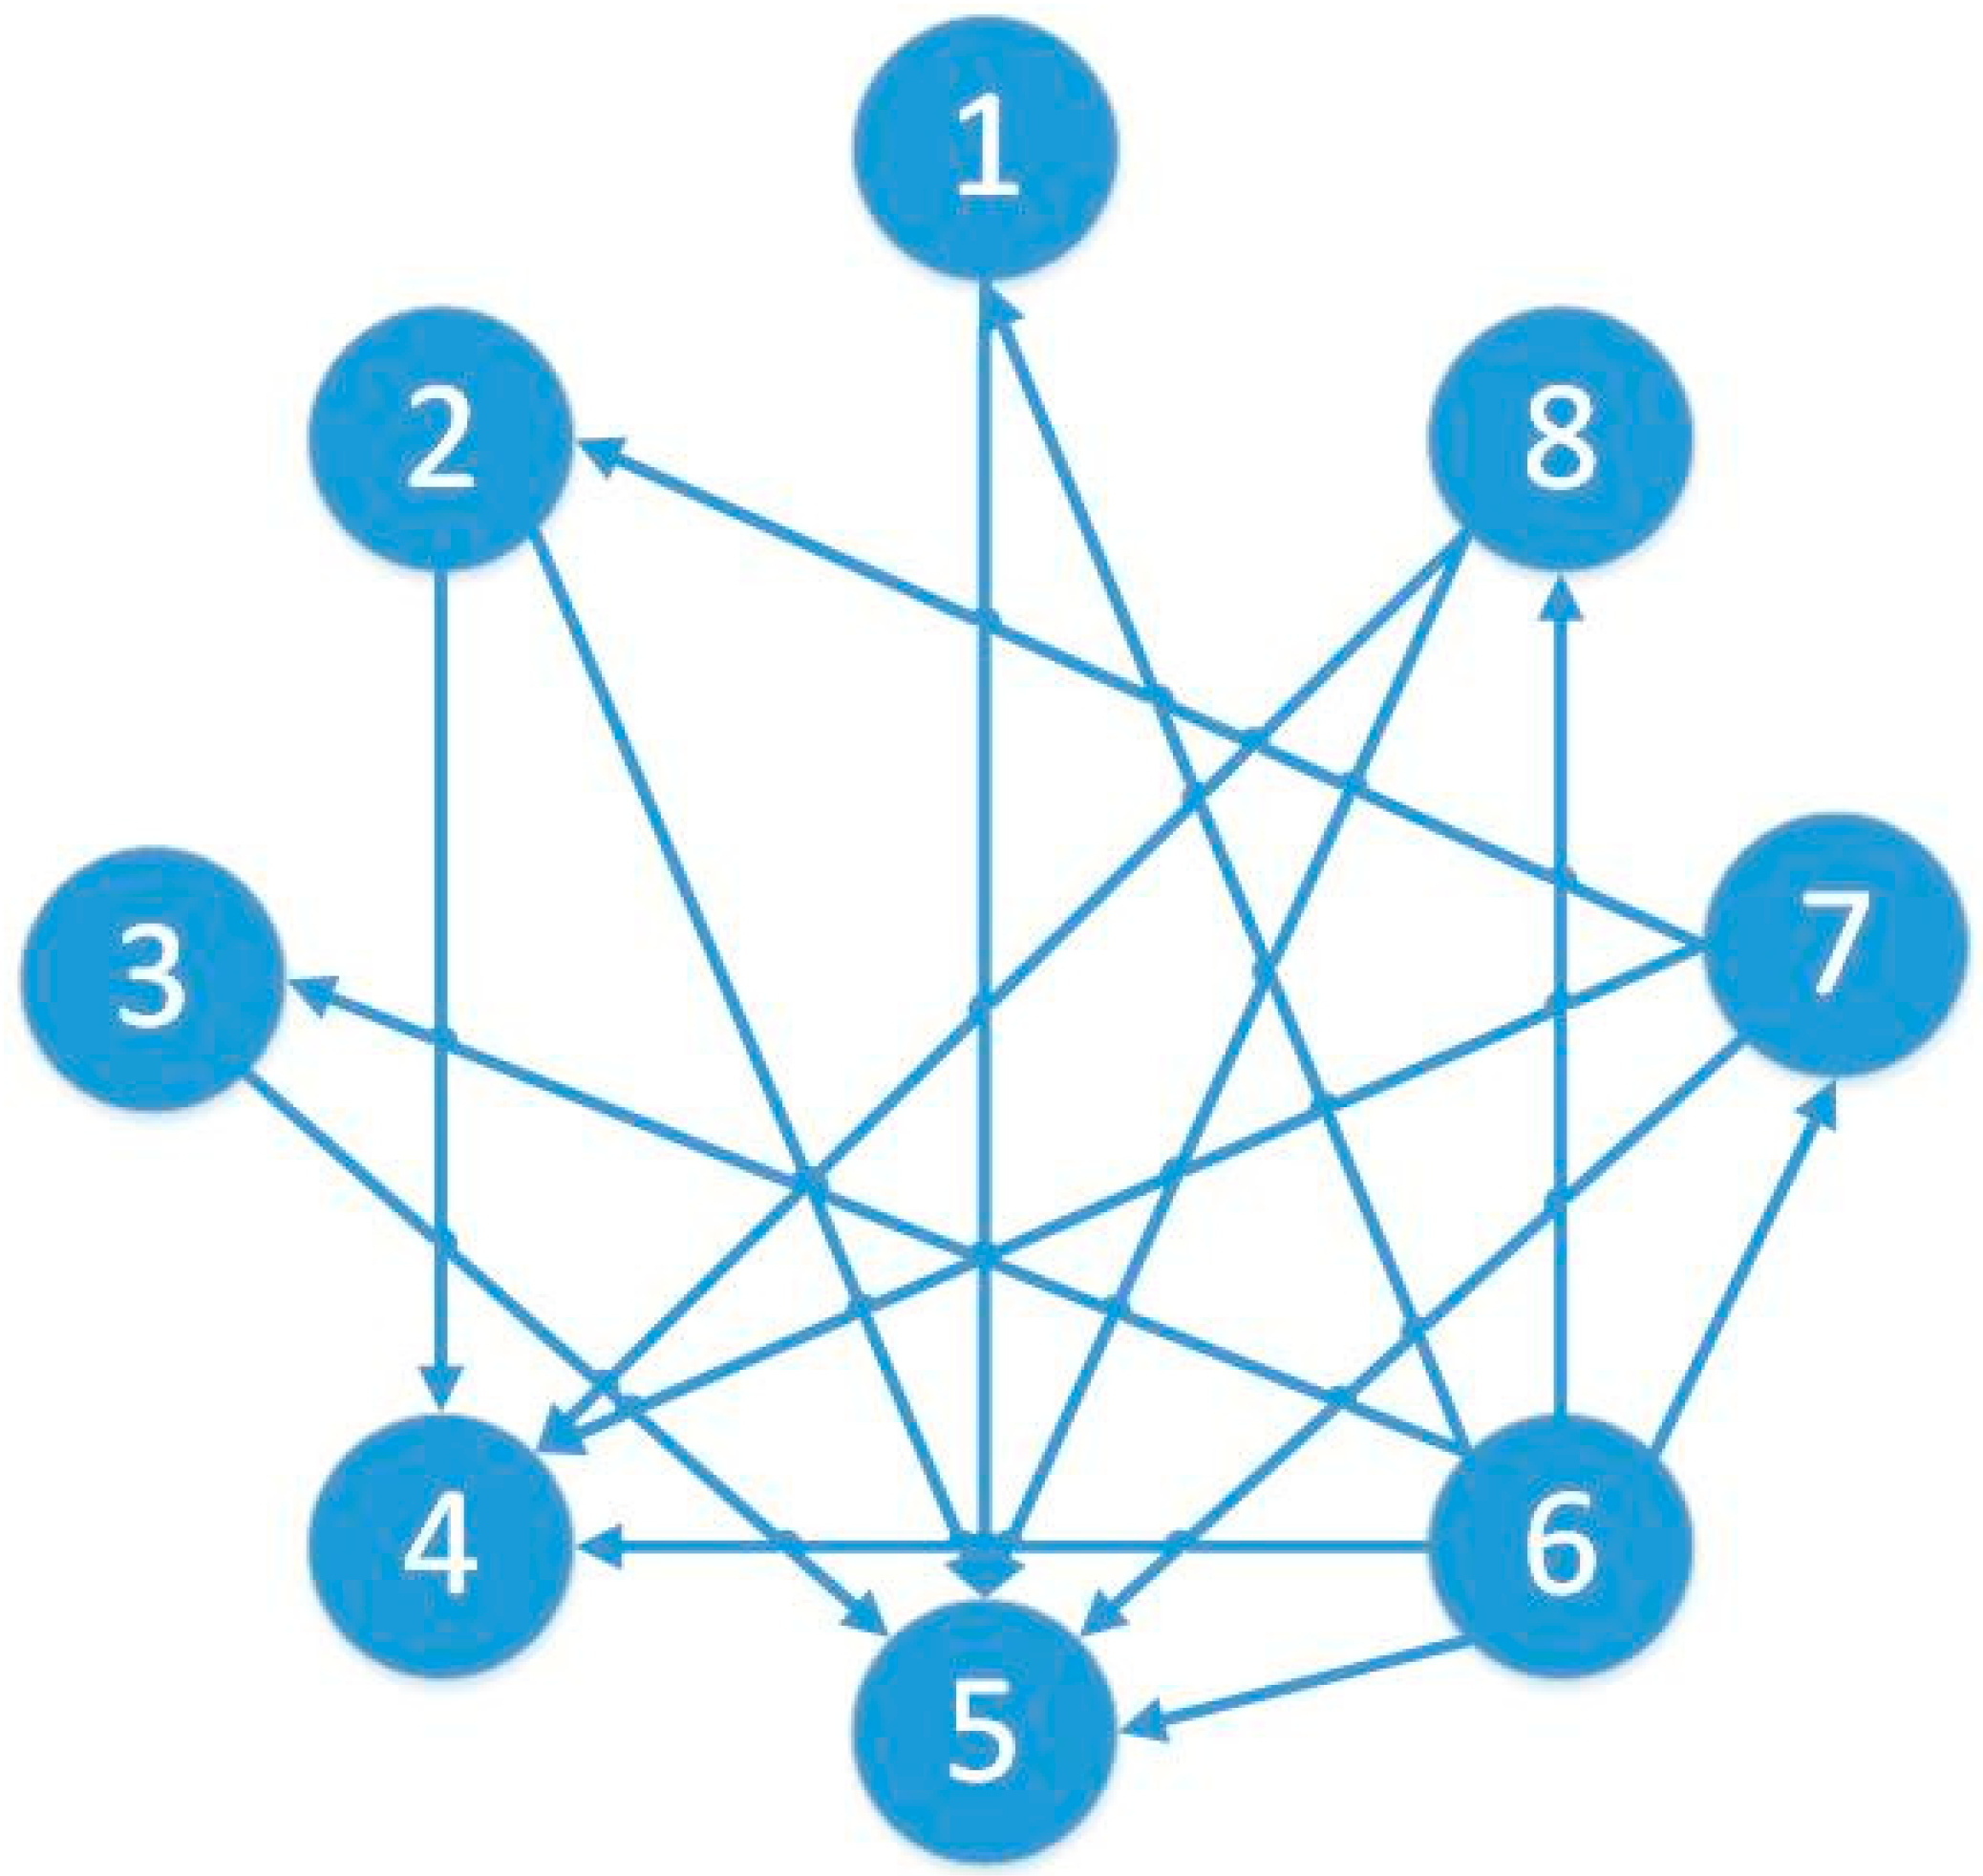
And following the general matrix, we could draw the priority picture like Figure 2.
We use ‘>’ indicating better, then we could find that A1 > A5; A2 > {A4, A5}; A3 > A5; A6 > {A1, A2, A3, A4, A5, A7, A8}; A7 > {A2, A4, A5}; A8 > {A4, A5}. That’s some relation between all the alternatives.
But we cannot have a rank of all the alternatives just though this figure. Like we do not know is A4 better than A5 or A5 better than A4 or they are the same. So, we bring in the concept of the pure concordance index and discordance index.
Step 4: Calculate the pure concordance index and discordance index
Before we calculate the pure concordance index and discordance index, we should convert the rough concordance matrix into definite number matrix. According to the Equations (44)–(48). We can get the result in Table 12.
Then we could calculate the pure concordance index and discordance index of each alternative and the result is in Table 13.
Step 5: Determine the final ranking
According to the pure concordance index and discordance index, we could get the ranking of each supplier in concordance and discordance aspects. With the Equation (51), we could get the final ranking of all the suppliers in Table 14.
From Table 14, we could see that priority is: A6 > A1 > {A2, A3, A7} > A8 > {A4, A5}.
4.2. Comparisons and Discussion
To further validate the effectiveness and strengths of the approach proposed in this paper, we make a comparison analysis.
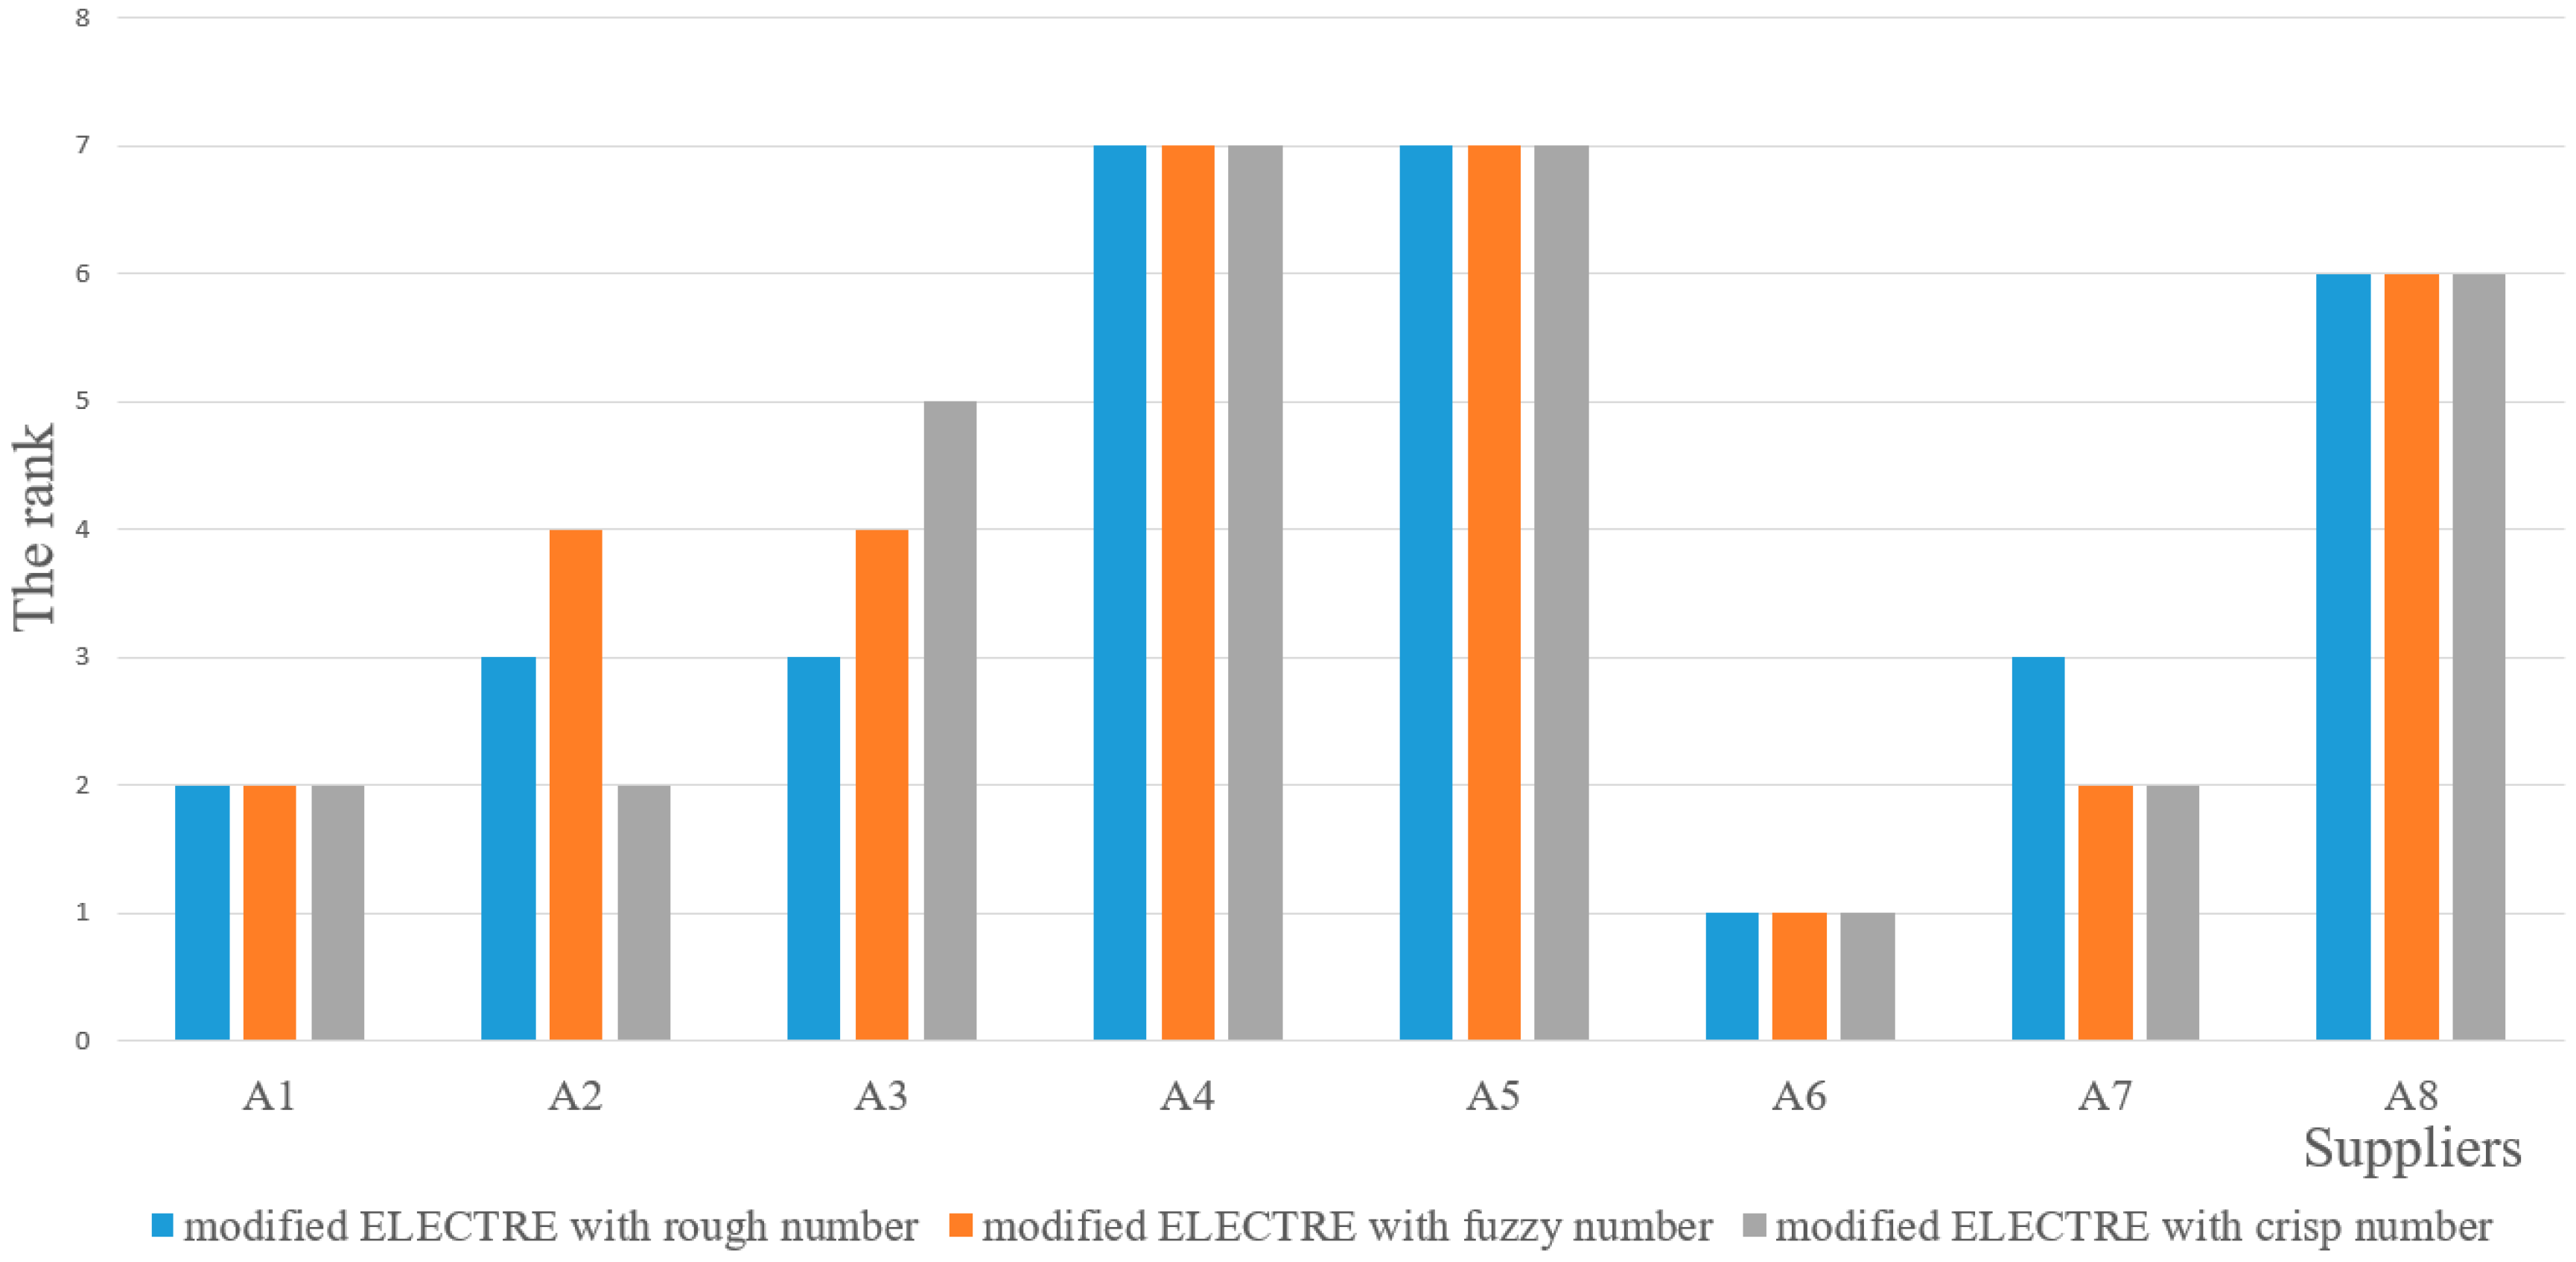
The comparison is conducted between the modified ELECTRE method with rough number (the rough ELECTRE), fuzzy number (the fuzzy ELECTRE) and crisp number (the conventional ELECTRE). The results are presented in Figure 3. From the Figure 3, we can see the rank of A2, A3 and A7 are different with each other in the three methods. In the process of supplier selection, the top three candidates are critical for the consideration. Different rankings will influence in the final performance of supply chain.
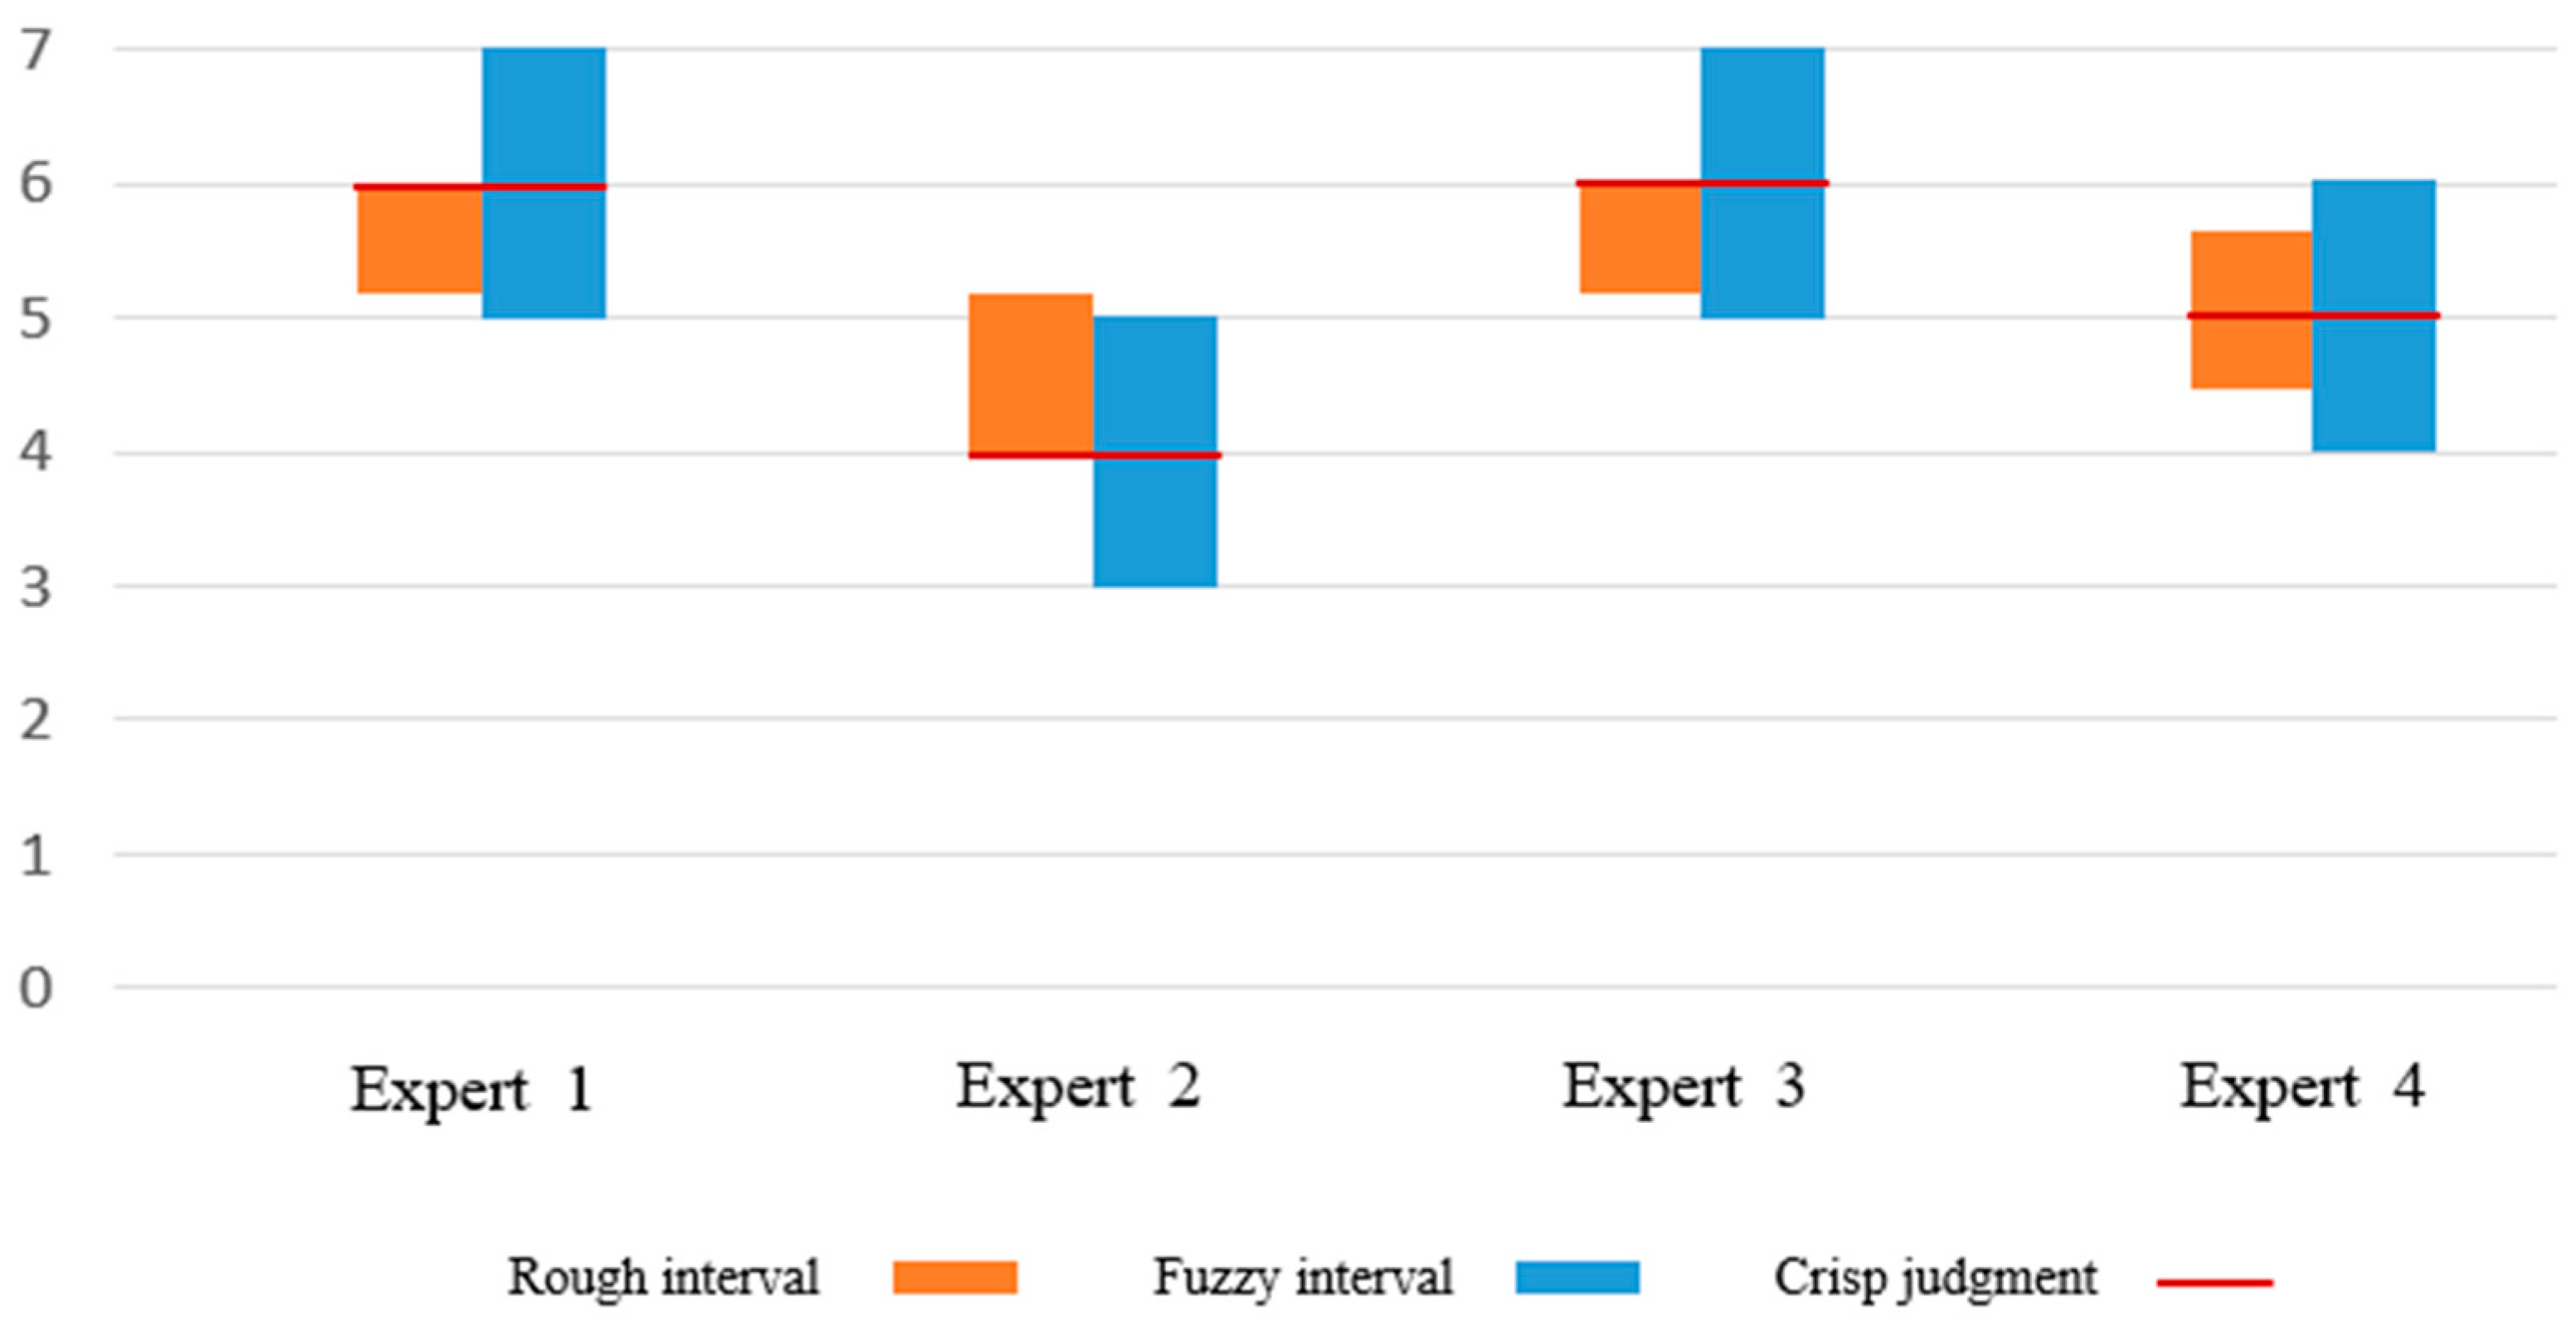
The fuzzy methods of supplier selection (e.g., methods in [39,41]) often use the fuzzy number with fixed interval to deal with the uncertainty in supplier selection, which will cause information lost in decision–making process. Different with the fuzzy methods, the proposed approach uses the rough number with flexible interval to describe the uncertainty and it does not require to subjectively set the fuzzy membership function in advance. The rough number can flexibly reflect the change of the experts’ preference. For example, if one expert provides the scores of 6, 4, 6, 5. It then can be converted to fuzzy intervals of [5, 7], [3, 5], [5, 7] and [4, 6], all of which have fixed interval of 2. But the proposed approach transforms the original scores into the flexible rough intervals of [5.18, 6], [4, 5.18], [5.18, 6] and [4.47, 5.65], which are shown in Figure 4. If the experts change their evaluations into 3, 4, 6, 4, the fuzzy intervals will change into [2, 4], [3, 5], [5, 7], [3, 5], while the rough ELECTRE transform the original scores into [3, 4.12], [3.63, 4.58], [4.12, 6] and [3.36, 4.58]. Obviously, the boundary of the fuzzy interval has no alteration with the change of the experts’ change in the fuzzy ELECTRE. On the other hand, the rough ELECTRE can identify the changes of expert preferences, which will make the final ranking more accurate and reasonable.
Moreover, compared with the traditional ELECTRE method (e.g., the ELECTRE method used by Bırgün and Cıhan (2010) [40]), the proposed method provides the rank of all the alternatives. In the traditional ELECTRE method, we can only get partial relationships among alternatives. This will hinder the managers to directly identify the best supplier. As shown in Figure 2, there is no direct or indirect relationship between A7 and A3, so we do not know whether A7 performs better than A3 or not. However, we can get all the relationships in the proposed method based on the calculation of pure concordance index and discordance index. All the ranks of the suppliers can be provided in the proposed approach. This is obviously more practical and reasonable than the conventional ELECTRE method (e.g., the ELECTRE method in [40]). Moreover, different with most of AHP/ANP-based methods [29,30] and DEA approaches [31,32], the proposed rough ELECTRE method considers the uncertainty in decision–making process, which makes the final ranking results of suppliers more accurate.
Theoretically, this study develops a rough multi-criteria decision-making approach for sustainable supplier selection considering vagueness and subjectivity. The novel approach integrates the strength of rough set theory in handling vagueness without much priori information and the merit of ELECTRE in modeling multi-criteria decision-making problem. The comparisons between the proposed method, the conventional ELECTRE and the fuzzy ELECTRE reveal that the rough ELECTRE performs better than the conventional ELECTRE and the fuzzy ELECTRE in dealing with vague and imprecise information. Besides, this research contributes to modeling the problem of supplier selection based on the economic, environmental and social aspects. The social aspects are often omitted in the previous supplier selection methods. Practically, this method provides an effective method to identify the right suppliers to achieve the success of the sustainable supply chain management. It also provides a standardized procedure for managers in sustainable supplier selection.
5. Conclusions
To manipulate the vagueness in sustainable supplier selection, a new approach based on the rough set theory and ELECTRE is developed in this paper. The novel approach integrates both the strength of rough set theory in handling vagueness and the merit of ELECTRE in modeling multi-criteria decision-making problem. A case study of sustainable supplier selection for solar air-conditioner manufacturer is provided to demonstrate the application and potential of the approach. In sum, this proposed method has the following features:
First, this study considers the social sustainability in the supplier selection, which is often omitted in the previous literature. This research contributes to modeling the problem of supplier selection decision within the context of a sustainable supply chain management based on the Triple Bottom Line (TBL) concept (economic, environmental and social aspects). The sustainability criteria in this study are generic and can be used for sustainable supplier selection in different industries.
Second, the proposed rough ELECTRE method can flexibly reflect the uncertainty in decision–making without much priori information. Different with the previous fuzzy methods, the proposed approach utilizes the lower and upper approximations to describe uncertainty and it does not require the pre-set fuzzy membership function, which will reduce the decision–making burdens of managers.
Third, the proposed approach can identify the preference changes of decision makers with flexible rough intervals. Due to the flexible uncertainty mechanism, the rough number is more sensitive than fuzzy number to the preference changes of decision makers, which makes the final ranking results more accurate.
Fourth, different with the conventional ELECTRE revealing partial ranking orders, the proposed rough ELECTRE method can provide full ranking order of all the alternatives. This is especially useful for managers to get a comprehensive view of suppliers and make reasonable decision–making in supplier selection.
Although the proposed method has some merits in sustainable supplier selection, it also has several ameliorable aspects which may serve as implications for further study. To make the ranking results more accurate, it would be favorable for future research to take decision makers’ weighs, objective criteria weights and subjective criteria weights into consideration. To handle huge number of suppliers, the proposed rough ELECTRE method will be integrated with DEA method with little managerial input and output required. Moreover, a computerized tool based on the proposed approach will be developed to reduce the computation burdens of managers. Besides, more testing work is necessitated to gain external validity.
Author Contributions
Conceptualization, S.J. and W.S.; Methodology, W.S.; Validation, H.L. and S.J.; Resources, X.M.; Writing-Original Draft Preparation, H.L.; Writing-Review & Editing, X.M.
Funding
The work described in this paper was supported by the National Natural Science Foundation of China (Grant No. 71501006 and 71632003), the Technical Research Foundation (JSZL2016601A004), the Open Project of Henan Key Laboratory of Intelligent Manufacturing of Mechanical Equipment, Zhengzhou University of Light Industry (No. IM201801), and the Fundamental Research Funds for the Central Universities.
Acknowledgments
The authors would like to thank the editor and the anonymous reviewers for their helpful comments and suggestions on the drafts of this paper.
Conflicts of Interest
The authors declare no conflict of interest.
Abbreviations
The following abbreviations are used in this manuscript:
| ith decision-maker | |
| ith criterion for supplier selection | |
| ith expert | |
| ith alternative | |
| judgement set | |
| judgement of ith expert | |
| lower approximation set of , which contains the elements that smaller than pi in set | |
| upper approximation set of , which contains the elements that bigger than pi in set | |
| maximum distance of set | |
| rough interval corresponding to | |
| lower approximation of | |
| upper approximation of | |
| elements of | |
| elements of | |
| weight of jth criterion with kth expert | |
| lower approximation of | |
| upper approximation of | |
| lower approximation of the weight of jth criterion | |
| upper approximation of the weight of jth criterion | |
| kth expert’s judgement on jth criterion in ith alternative | |
| scoring matrix for kth expert | |
| Set of | |
| rough interval corresponding to after normalized | |
| rough scoring matrix | |
| concordance matrix | |
| discordance matrix | |
| concordance index | |
| discordance index | |
| concordance Boolean matrix | |
| discordance Boolean matrix | |
| general Boolean matrix | |
| pure concordance index | |
| pure discordance index | |
| SSCM | Sustainable supply chain management |
| ELECTRE | ELimination Et Choix Traduisant la Realité |
| MCDM | Multi-criteria decision-making |
| EMS | Environmental management system |
| TOPSIS | Technique for Order Preference by Similarity to an Ideal Solution |
| AHP | Analytical Hierarchy Process |
| ANP | Analytical Network Process |
| DEA | Data Envelopment Analysis |
| QFD | Quality Function Deployment |
References
- Ma, L.; Song, W.; Zhou, Y. Modeling enablers of environmentally conscious manufacturing strategy: An integrated method. Sustainability 2018, 10, 2284. [Google Scholar] [CrossRef]
- Song, W.; Sakao, T. An environmentally conscious PSS recommendation method based on users’ vague ratings: A rough multi-criteria approach. J. Clean. Prod. 2018, 172, 1592–1606. [Google Scholar] [CrossRef]
- Song, W.; Sakao, T. A customization-oriented framework for design of sustainable product/service system. J. Clean. Prod. 2017, 140, 1672–1685. [Google Scholar] [CrossRef]
- Brandenburg, M.; Govindan, K.; Sarkis, J.; Seuring, S. Quantitative models for sustainable supply chain management: Developments and directions. Eur. J. Oper. Res. 2014, 233, 299–312. [Google Scholar] [CrossRef]
- Govindan, K.; Khodaverdi, R.; Jafarian, A. A fuzzy multi criteria approach for measuring sustainability performance of a supplier based on triple bottom line approach. J. Clean. Prod. 2013, 47, 345–354. [Google Scholar]
- Amindoust, A.; Ahmed, S.; Saghafinia, A.; Bahreininejad, A. Sustainable supplier selection: A ranking model based on fuzzy inference system. Appl. Soft. Comput. 2012, 12, 1668–1677. [Google Scholar] [CrossRef]
- Song, W.; Ming, X.; Han, Y.; Wu, Z. A rough set approach for evaluating vague customer requirement of industrial product-service system. Int. J. Prod. Res. 2013, 51, 6681–6701. [Google Scholar] [CrossRef]
- Song, W.; Ming, X.; Han, Y. Prioritising technical attributes in QFD under vague environment: A rough-grey relational analysis approach. Int. J. Prod. Res. 2014, 52, 5528–5545. [Google Scholar] [CrossRef]
- Song, W.; Ming, X.; Wu, Z.; Zhu, B. A rough TOPSIS approach for failure mode and effects analysis in uncertain environments. Qual. Reliab. Eng. Int. 2014, 30, 473–486. [Google Scholar] [CrossRef]
- Song, W.; Ming, X.; Xu, Z. Risk evaluation of customer integration in new product development under uncertainty. Comput. Ind. Eng. 2013, 65, 402–412. [Google Scholar] [CrossRef]
- Song, W.; Ming, X.; Wu, Z. An integrated rough number-based approach to design concept evaluation under subjective environments. J. Eng. Des. 2013, 24, 320–341. [Google Scholar] [CrossRef]
- Carter, C.R.; Liane Easton, P. Sustainable supply chain management: Evolution and future directions. Int. J. Phys. Distrib. Logist. Manag. 2011, 41, 46–62. [Google Scholar] [CrossRef]
- Ageron, B.; Gunasekaran, A.; Spalanzani, A. Sustainable supply management: An empirical study. Int. J. Prod. Econ. 2012, 140, 168–182. [Google Scholar] [CrossRef]
- Song, W.Y.; Xu, Z.T.; Liu, H.C. Developing sustainable supplier selection criteria for solar air-conditioner manufacturer: An integrated approach. Renew. Sustain. Energy Rev. 2017, 79, 1461–1471. [Google Scholar] [CrossRef]
- Li, J.; Fang, H.; Song, W. Sustainability evaluation via variable precision rough set approach: A photovoltaic module supplier case study. J. Clean. Prod. 2018, 192, 751–765. [Google Scholar] [CrossRef]
- Song, W.; Ming, X.; Liu, H. Identifying critical risk factors of sustainable supply chain management: A rough strength-relation analysis method. J. Clean. Prod. 2017, 143, 100–115. [Google Scholar] [CrossRef]
- Lee, A.H.I.; Kang, H.Y.; Hsu, C.F.; Hung, H.C. A green supplier selection model for high-tech industry. Expert. Syst. Appl. 2009, 36, 7917–7927. [Google Scholar] [CrossRef]
- Dai, J.; Blackhurst, J. A four-phase AHP-QFD approach for supplier assessment: A sustainability perspective. Int. J. Prod. Res. 2012, 50, 5474–5490. [Google Scholar] [CrossRef]
- Ho, W.; Xu, X.W.; Dey, P.K. Multi-criteria decision making approaches for supplier evaluation and selection: A literature review. Eur. J. Oper. Res. 2010, 202, 16–24. [Google Scholar] [CrossRef]
- Khalili, N.R.; Duecker, S. Application of multi-criteria decision analysis in design of sustainable environmental management system framework. J. Clean. Prod. 2013, 47, 188–198. [Google Scholar] [CrossRef]
- Gurel, O.; Acar, A.Z.; Onden, I.; Gumus, I. Determinants of the green supplier selection. Proc. Soc. Behav. Sci. 2015, 181, 131–139. [Google Scholar] [CrossRef]
- Zhang, Y.; Tao, F.; Laili, Y.J.; Hou, B.C.; Lv, L.; Zhang, L. Green partner selection in virtual enterprise based on Pareto genetic algorithms. Int. J. Adv. Manuf. Technol. 2013, 67, 2109–2125. [Google Scholar] [CrossRef]
- Galankashi, M.R.; Chegeni, A.; Soleimanynanadegany, A.; Memari, A.; Anjomshoae, A.; Helmi, S.A.; Dargi, A. Prioritizing Green Supplier Selection Criteria using Fuzzy Analytical Network Process. Procedia CIRP 2015, 26, 689–694. [Google Scholar] [CrossRef]
- Bai, C.G.; Sarkis, J. Green supplier development: Analytical evaluation using rough set theory. J. Clean. Prod. 2010, 18, 1200–1210. [Google Scholar] [CrossRef]
- Keskin, G.A.; İlhan, S.; Őzkan, C. The Fuzzy ART algorithm: A categorization method for supplier evaluation and selection. Expert. Syst. Appl. 2010, 137, 1235–1240. [Google Scholar] [CrossRef]
- Bai, C.G.; Sarkis, J. Integrating sustainability into supplier selection with grey system and rough set methodologies. Int. J. Prod. Econ. 2010, 124, 251–264. [Google Scholar] [CrossRef]
- Nikolaou, I.E.; Evangelinos, K.I.; Allan, S. A reverse logistics social responsibility evaluation framework based on the triple bottom line approach. J. Clean. Prod. 2013, 56, 173–184. [Google Scholar] [CrossRef]
- Nagy, G.; Tóth, Á.B.; Illés, B.; Glistau, E. Analysis of supply chain efficiency in blending technologies. Veh. Autom. Eng. 2018, 2, 280–291. [Google Scholar]
- Hsu, C.W.; Hu, A.H. Applying hazardous substance management to supplier selection using analytic network process. J. Clean. Prod. 2009, 17, 255–264. [Google Scholar] [CrossRef]
- Liu, F.H.F.; Hai, H.L. The voting analytic hierarchy process method for selecting supplier. Int. J. Prod. Econ. 2005, 97, 308–317. [Google Scholar] [CrossRef]
- Kuo, R.J.; Lin, Y.J. Supplier selection using analytic network process and data envelopment analysis. Int. J. Prod. Res. 2012, 50, 2852–2863. [Google Scholar] [CrossRef]
- Wu, T.; Blackhurst, J. Supplier evaluation and selection: An augmented DEA approach. Int. J. Prod. Res. 2009, 47, 4593–4608. [Google Scholar] [CrossRef]
- Sevkli, M.; Lenny Koh, S.C.; Zaim, S.; Demirbag, M.; Tatoglu, E. An application of data envelopment analytic hierarchy process for supplier selection: A case study of BEKO in Turkey. Int. J. Prod. Res. 2007, 45, 1973–2003. [Google Scholar] [CrossRef]
- Basnet, C.; Leung, J.M. Inventory lot-sizing with supplier selection. Comput. Oper. Res. 2005, 32, 1–14. [Google Scholar] [CrossRef] [Green Version]
- Veres, P.; Bányai, T.; Illés, B. Intelligent transportation systems to support production logistics. Veh. Autom. Eng. 2017, 245–256. [Google Scholar] [CrossRef]
- Cárdenas-Barrón, L.E.; González-Velarde, J.L.; Treviño-Garza, G. A new approach to solve the multi-product multi-period inventory lot sizing with supplier selection problem. Comput. Oper. Res. 2015, 64, 225–232. [Google Scholar] [CrossRef]
- Büyüközkan, G.; Çifçi, G. A novel fuzzy multi-criteria decision framework for sustainable supplier selection with incomplete information. Comput. Ind. 2011, 62, 164–174. [Google Scholar] [CrossRef]
- Azadnia, A.H.; Saman, M.Z.M.; Wong, K.Y. Sustainable supplier selection and order lot-sizing: An integrated multi-objective decision-making process. Int. J. Prod. Res. 2015, 53, 383–408. [Google Scholar] [CrossRef]
- Grisi, R.M.; Guerra, L.; Naviglio, G. Supplier Performance Evaluation for Green Supply Chain Management; Springer: Berlin/Heidelberg, Germany, 2010; pp. 149–163. [Google Scholar]
- Bırgün, S.; Cıhan, E. Supplier selection process using ELECTRE method. In Proceedings of the 2010 International Conference on Intelligent Systems and Knowledge Engineering (ISKE), Hangzhou, China, 15–16 November 2010; pp. 634–639. [Google Scholar]
- Sevkli, M. An application of the fuzzy ELECTRE method for supplier selection. Int. J. Prod. Res. 2010, 48, 3393–3405. [Google Scholar] [CrossRef]
Figure 1.
The framework of rough ELimination Et Choix Traduisant la REalité (ELECTRE).

Figure 2.
The relations of alternatives in conventional ELECTRE.

Figure 3.
The rank of different methods.

Figure 4.
Different vagueness manipulations for judgements on alternative one of criterion one.


Table 1.
Sustainable supplier selection criteria.
| Sustainable Supplier Selection Criteria | Descriptions |
|---|---|
| Economic criteria | |
| Quality [17,18] | Product quality and reliability level guaranteed by supplier. |
| Response [5] | The ability for timely response, completing orders on time and reliable delivery. |
| Cost [19] | Purchasing cost, holding cost, ordering cost and supplier’s bidding price of the product. |
| Environmental criteria | |
| Environmental management system (EMS) [20,21] | A set of systematic processes and practices reducing environmental impacts. |
| Carbon emission & resource consumption [22,23] | Greenhouse gas emissions in producing, transporting, using and recycling the product and the resource (e.g., energy, power and water) consumption of the company. |
| Design for the environment [14,24] | Design reducing the overall impact of a product, process or service on human health and environment. |
| Green image [17] | The image of company in the green aspect, which can be improved by adopting environmental friendly products or implementing ‘green’ program. It can affect the purchasing trend of customers, market share and the relationship with stakeholders. |
| Social criteria | |
| Product liability [25] | Being responsible for customer health and safety, providing products and services with high quality and advertising based on real information. |
| Employee right and welfare [26,27] | Treating employee with dignity and respect and maintaining a culture of security, nondiscrimination and equality. Paying to employee shall comply with all applicable wage laws. |
| Social commitment [27] | Involving in local community, education, job creation, healthcare and social investment. |
Table 2.
The grade of each criterion.
| E1 | E2 | E3 | E4 | |
|---|---|---|---|---|
| C1 | 4 | 5 | 4 | 6 |
| C2 | 3 | 6 | 4 | 4 |
| C3 | 6 | 7 | 5 | 7 |
| C4 | 5 | 5 | 5 | 6 |
| C5 | 6 | 4 | 6 | 5 |
| C6 | 6 | 6 | 5 | 5 |
| C7 | 4 | 4 | 3 | 5 |
| C8 | 4 | 3 | 2 | 4 |
| C9 | 6 | 6 | 6 | 7 |
| C10 | 7 | 4 | 5 | 4 |
Table 3.
The importance of all the criteria.
| Rough Importance | |
|---|---|
| W1 | [4.24, 5.18] |
| W2 | [3.57, 4.77] |
| W3 | [5.69, 6.70] |
| W4 | [5.06, 5.42] |
| W5 | [4.68, 5.70] |
| W6 | [5.23, 5.73] |
| W7 | [3.53, 4.37] |
| W8 | [2.63, 3.67] |
| W9 | [6.06, 6.42] |
| W10 | [4.28, 5.60] |
Table 4.
The evaluation for alternative under the criterion 1.
| E1 | E2 | E3 | E4 | ||
|---|---|---|---|---|---|
| C1 | A1 | 6 | 4 | 6 | 5 |
| A2 | 4 | 3 | 4 | 2 | |
| A3 | 5 | 4 | 6 | 3 | |
| A4 | 4 | 5 | 5 | 5 | |
| A5 | 3 | 5 | 3 | 4 | |
| A6 | 6 | 6 | 4 | 6 | |
| A7 | 7 | 6 | 5 | 7 | |
| A8 | 5 | 4 | 3 | 5 |
Table 5.
The rough matrix.
| C1 | C2 | C3 | ... | C10 | |
|---|---|---|---|---|---|
| A1 | [4.68, 5.70] | [5.23, 5.73] | [4.24, 5.18] | … | [3.66, 4.69] |
| A2 | [2.63, 3.67] | [3.66, 4.69] | [5.11, 5.79] | … | [4.68, 5.70] |
| A3 | [3.65, 5.15] | [2.22, 3.13] | [4.68, 5.70] | … | [4.67, 6.17] |
| A4 | [4.53, 4.93] | [5.54, 5.93] | [3.23, 4.16] | … | [4.68, 5.70] |
| A5 | [3.23, 4.16] | [4.54, 5.38] | [4.24, 5.18] | … | [3.96, 5.29] |
| A6 | [5.02, 5.85] | [5.69, 6.70] | [6.06, 6.42] | … | [4.68, 5.70] |
| A7 | [5.69, 6.70] | [4.68, 5.70] | [5.23, 5.73] | … | [5.02, 5.85] |
| A8 | [3.66, 4.69] | [4.06, 4.41] | [3.53, 4.37] | … | [4.24, 5.18] |
Note: not all of the data are provided in Table 5 due to the space limitation.
Table 6.
The normalized weighted decision matrix.
| C1 | C2 | C3 | … | C10 | |
|---|---|---|---|---|---|
| A1 | [0.57, 0.85] | [0.58, 0.86] | [0.56, 0.81] | … | [0.45, 0.76] |
| A2 | [0.32, 0.55] | [0.41, 0.70] | [0.68, 0.90] | … | [0.58, 0.92] |
| A3 | [0.45, 0.77] | [0.25, 0.47] | [0.62, 0.89] | … | [0.58, 1.00] |
| A4 | [0.55, 0.74] | [0.62, 0.89] | [0.43, 0.65] | … | [0.58, 0.92] |
| A5 | [0.39, 0.62] | [0.51, 0.80] | [0.56, 0.81] | … | [0.49, 0.86] |
| A6 | [0.61, 0.87] | [0.64, 1.00] | [0.80, 1.00] | … | [0.58, 0.92] |
| A7 | [0.69, 1.00] | [0.52, 0.85] | [0.69, 0.89] | … | [0.62, 0.95] |
| A8 | [0.45, 0.70] | [0.45, 0.66] | [0.47, 0.68] | … | [0.53, 0.84] |
Table 7.
The concordance matrix.
| A1 | A2 | A3 | … | A8 | |
|---|---|---|---|---|---|
| A1 | - | [13.87, 16.37] | [11.35, 14.32] | … | [27.43, 32.48] |
| A2 | [31.11, 37.19] | - | [25.17, 30.63] | … | [22.89, 27.12] |
| A3 | [33.63, 39.23] | [19.81, 22.93] | - | … | [28.13, 33.30] |
| A4 | [7.85, 10.37] | [13.87, 16.37] | [7.81, 9.95] | … | [12.09, 15.55] |
| A5 | [7.81, 9.97] | [11.35, 14.32] | [7.11, 9.14] | … | [20.67, 25.25] |
| A6 | [29.01, 35.71] | [22.20, 26.74] | [24.73, 30.11] | … | [25.47, 31.34] |
| A7 | [19.27, 22.89] | [23.84, 28.67] | [17.04, 21.03] | … | [17.78, 22.25] |
| A8 | [17.55, 21.08] | [22.09, 26.44] | [16.85, 20.25] | … | - |
Table 8.
The discordance matrix.
| A1 | A2 | A3 | A4 | A5 | A6 | A7 | A8 | |
|---|---|---|---|---|---|---|---|---|
| A1 | - | 1.00 | 0.53 | 0.90 | 0.20 | 1.00 | 0.88 | 1.00 |
| A2 | 0.85 | - | 1.00 | 0.49 | 0.27 | 1.00 | 1.00 | 0.97 |
| A3 | 1.00 | 0.64 | - | 1.00 | 0.64 | 1.00 | 1.00 | 1.00 |
| A4 | 1.00 | 1.00 | 0.73 | - | 0.65 | 1.00 | 1.00 | 1.00 |
| A5 | 1.00 | 1.00 | 1.00 | 1.00 | - | 1.00 | 1.00 | 1.00 |
| A6 | 0.46 | 0.37 | 0.43 | 0.00 | 0.22 | - | 0.32 | 0.27 |
| A7 | 1.00 | 0.71 | 0.88 | 0.37 | 0.55 | 1.00 | - | 0.82 |
| A8 | 0.93 | 1.00 | 0.91 | 0.68 | 0.32 | 1.00 | 1.00 | - |
Table 9.
The concordance Boolean matrix.
| A1 | A2 | A3 | A4 | A5 | A6 | A7 | A8 | |
|---|---|---|---|---|---|---|---|---|
| A1 | - | 0 | 0 | 1 | 1 | 0 | 1 | 1 |
| A2 | 1 | - | 1 | 1 | 1 | 1 | 0 | 1 |
| A3 | 1 | 0 | - | 1 | 1 | 0 | 1 | 1 |
| A4 | 0 | 0 | 0 | - | 0 | 0 | 0 | 0 |
| A5 | 0 | 0 | 0 | 1 | - | 0 | 0 | 0 |
| A6 | 1 | 0 | 1 | 1 | 1 | - | 1 | 1 |
| A7 | 0 | 1 | 0 | 1 | 1 | 0 | - | 0 |
| A8 | 0 | 0 | 0 | 1 | 1 | 0 | 1 | - |
Table 10.
The discordance Boolean matrix.
| A1 | A2 | A3 | A4 | A5 | A6 | A7 | A8 | |
|---|---|---|---|---|---|---|---|---|
| A1 | - | 0 | 1 | 0 | 1 | 0 | 0 | 0 |
| A2 | 0 | - | 0 | 1 | 1 | 0 | 0 | 0 |
| A3 | 0 | 1 | - | 0 | 1 | 0 | 0 | 0 |
| A4 | 0 | 0 | 1 | - | 1 | 0 | 0 | 0 |
| A5 | 0 | 0 | 0 | 0 | - | 0 | 0 | 0 |
| A6 | 1 | 1 | 1 | 1 | 1 | - | 1 | 1 |
| A7 | 0 | 1 | 0 | 1 | 1 | 0 | - | 0 |
| A8 | 0 | 0 | 0 | 1 | 1 | 0 | 0 | - |
Table 11.
The general matrix.
| A1 | A2 | A3 | A4 | A5 | A6 | A7 | A8 | |
|---|---|---|---|---|---|---|---|---|
| A1 | - | 0 | 0 | 0 | 1 | 0 | 0 | 0 |
| A2 | 0 | - | 0 | 1 | 1 | 0 | 0 | 0 |
| A3 | 0 | 0 | - | 0 | 1 | 0 | 0 | 0 |
| A4 | 0 | 0 | 0 | - | 0 | 0 | 0 | 0 |
| A5 | 0 | 0 | 0 | 0 | - | 0 | 0 | 0 |
| A6 | 1 | 0 | 1 | 1 | 1 | - | 1 | 1 |
| A7 | 0 | 1 | 0 | 1 | 1 | 0 | - | 0 |
| A8 | 0 | 0 | 0 | 1 | 1 | 0 | 0 | - |
Table 12.
The definite number concordance matrix.
| A1 | A2 | A3 | A4 | A5 | A6 | A7 | A8 | |
|---|---|---|---|---|---|---|---|---|
| A1 | - | 14.50 | 12.16 | 40.77 | 42.17 | 17.01 | 28.50 | 31.35 |
| A2 | 35.87 | - | 29.60 | 33.42 | 37.34 | 26.20 | 22.47 | 25.39 |
| A3 | 38.39 | 21.58 | - | 41.08 | 43.11 | 22.63 | 30.90 | 32.29 |
| A4 | 8.04 | 14.50 | 8.05 | - | 18.63 | 4.35 | 17.60 | 12.58 |
| A5 | 7.95 | 11.78 | 7.27 | 27.71 | - | 9.09 | 16.55 | 23.00 |
| A6 | 33.91 | 25.40 | 29.01 | 46.10 | 41.68 | - | 35.78 | 29.64 |
| A7 | 20.83 | 27.62 | 19.06 | 29.21 | 31.53 | 15.08 | - | 19.55 |
| A8 | 18.89 | 25.12 | 18.51 | 35.07 | 25.65 | 21.43 | 29.69 | - |
Table 13.
The pure concordance index and discordance index of each supplier.
| A1 | 22.58 | −0.75 |
| A2 | 69.80 | −0.15 |
| A3 | 106.31 | 0.81 |
| A4 | −169.60 | 1.93 |
| A5 | −136.74 | 4.16 |
| A6 | 125.73 | −4.92 |
| A7 | −18.63 | −0.87 |
| A8 | 0.57 | −0.21 |
Table 14.
The final ranking of all the suppliers.
| A1 | 4 | 3 | 2 |
| A2 | 3 | 5 | 3 |
| A3 | 2 | 6 | 3 |
| A4 | 8 | 7 | 7 |
| A5 | 7 | 8 | 7 |
| A6 | 1 | 1 | 1 |
| A7 | 6 | 2 | 3 |
| A8 | 5 | 4 | 6 |
© 2018 by the authors. Licensee MDPI, Basel, Switzerland. This article is an open access article distributed under the terms and conditions of the Creative Commons Attribution (CC BY) license (http://creativecommons.org/licenses/by/4.0/).
Share and Cite
MDPI and ACS Style
Lu, H.; Jiang, S.; Song, W.; Ming, X. A Rough Multi-Criteria Decision-Making Approach for Sustainable Supplier Selection under Vague Environment. Sustainability 2018, 10, 2622. https://doi.org/10.3390/su10082622
AMA Style
Lu H, Jiang S, Song W, Ming X. A Rough Multi-Criteria Decision-Making Approach for Sustainable Supplier Selection under Vague Environment. Sustainability. 2018; 10(8):2622. https://doi.org/10.3390/su10082622
Chicago/Turabian StyleLu, Huiyun, Shaojun Jiang, Wenyan Song, and Xinguo Ming. 2018. "A Rough Multi-Criteria Decision-Making Approach for Sustainable Supplier Selection under Vague Environment" Sustainability 10, no. 8: 2622. https://doi.org/10.3390/su10082622
Note that from the first issue of 2016, this journal uses article numbers instead of page numbers. See further details here.