Impacts of Low-Carbon Fuel Standards in Transportation on the Electricity Market


1
Faculty of Engineering, University of Porto (FEUP), 4200-465 Porto, Portugal
2
Department of Electrical and Electronic Engineering, Federal University of Santa Catarina (UFSC), Florianópolis 88040-900, Brazil
*
Author to whom correspondence should be addressed.
Energies 2018, 11(8), 1943; https://doi.org/10.3390/en11081943
Submission received: 25 May 2018
/
Revised: 29 June 2018
/
Accepted: 16 July 2018
/
Published: 26 July 2018
(This article belongs to the Section A: Sustainable Energy)
Abstract
:Electric Vehicles (EVs) are increasing the interdependence of transportation policies and the electricity market dimension. In this paper, an Electricity Market Model with Electric Vehicles (EMMEV) was developed, exploiting an agent-based model that analyzes how carbon reduction policy in transportation may increase the number of Electric Vehicles and how that would influence electricity price. Agents are Energy Service Providers (ESCOs) which can distribute fuels and their objective is to maximize their profit. In this paper, the EMMEV is used to analyze the impacts of the Low-Carbon Fuel Standard (LCFS), a performance-based policy instrument, on electricity prices and EV sales volume. The agents in EMMEV are regulated parties in LCFS should meet a certain Carbon Intensity (CI) target for their distributed fuel. In case they cannot meet the target, they should buy credits to compensate for their shortfall and if they exceed it, they can sell their excess. The results, considering the assumptions and limitations of the model, show that the banking strategy of the agents contributing in the LCFS might have negative impact on penetration of EVs, unless there is a regular Credit Clearance to trade credits. It is also shown that the electricity price, as a result of implementing the LCFS and increasing number of EVs, has increased between 2% and 3% depending on banking strategy.
1. Introduction
The most important global agreement addressing climate change was signed in Paris in 2016 under the United Nations Framework Convention on Climate Change [1] dealing with the mitigation of Greenhouse Gas (GHG) emissions starting in the year 2020. This agreement indicates the global commitment (195 courtiers signed the Paris Agreement) to address the severe global consequences related to climate change. By means of this agreement, the global average temperature should be held below 2 °C and a pathway for GHG emissions and climate-resilient development should be designed [1].
Almost a quarter (23%) of global energy-related GHG emissions are from the transport sector [2] and it is the fastest growing sector for emissions [3]. In addition, around 35% of the fossil fuels in the world are consumed in the transport sector [4]. Therefore, design and implementation of transportation policies to decrease emissions is of high importance in order to comply with the Paris Agreement [5].
Sustainable transportation and the electrification of the transportation sector are highly interrelated and it is shown that in general, electrification of transport can lead to lower carbon emissions in transportation [6]. On the other hand, support schemes promoting different sustainable transportation are preferably to be local and based on Life Cycle Analysis (LCA). In Fazeli and Leal [7], based on LCA, it is shown that, in most of the cases, electrification of the transport sector can lead to lower carbon emissions. Based on the above studies, it is assumed in this paper that the electrification of the transport sector can lead to lower emissions.
Electric mobility support programs include policies that subsidize the higher purchase price of Electric Vehicles (EVs) and promote the installation of charging infrastructure [8,9]. These policies will eventually increase the number of EVs on the roads and increase electricity consumption [10,11] and will impact electricity markets as single platforms for electricity trade. This research contributes to the field by increasing the understanding of the intersection between electric mobility programs and the electricity market.
The main objective of this paper is, therefore, to bring understanding on how Low-Carbon Fuel Standard (LCFS), a performance-based policy instrument to accelerate transition to low-carbon fuel in transportation, can influence the structure and prices of the electricity market as well as EV sales. This is performed by modelling LCFS and the electricity market, and the hypothesis of the model is that sustainable transportation support polices will increase the number of electric vehicles and this will increase demand for electricity, which is expected to increase the electricity price [12].
EMMEV stands for Electricity Market Model with Electric Vehicles and, under the framework of this research, is an agent-based model developed by the authors to study the above research questions. In this paper, Electric Vehicles refer to vehicles with grid charging capability including Plug-in Hybrid Electric Vehicles and Battery Electric Vehicles. EMMEV is a platform that allows the testing of different policies for increasing the number of Electric Vehicles and charging infrastructure. Throughout this paper, the LCFS is chosen as a low-carbon transportation support policy in order to investigate the impact on electricity price and EV sales.
The Low-Carbon Fuel Standard (LCFS) [13] is one of the regulatory measures for increasing the share of low-carbon fuels in the transportation sector. The LCFS regulates the fossil carbon content of different fuels to reduce carbon emissions. It is a performance-based policy which aims to decrease the CI (Carbon Intensity) of transportation fuels. This has been implemented in California. For a description and discussion of its implementation, please see Farrell and Sperling [14] and Yeh, Sperling [13].
In this paper, first, the main concepts related to EMMEV are described. Thereafter, the structure of EMMEV is explained. A test system for testing the impact of the LCFS on the electricity market is introduced in Section 4. The results and discussions are presented in Section 5. Finally, in Section 6, a summary and conclusions are presented.
2. Background and Review of Relevant Concepts
The Electricity Market with Electric Vehicles (EMMEV) consists of two submodels. The first submodel is the electricity market model and the second is a model for the Low-Carbon Fuel Standard. In this section, the two submodels are described.
2.1. Electricity Market
Electricity is a commodity that does not behave like regular commodities [15]. The first difference is, unlike other commodities, electricity cannot be stored and needs to be consumed as it is produced. Secondly, the supply at each time needs to exactly meet the demand. The third difference is that the (relatively small-scale) storage capability and transfer of electricity is subject to major losses. All above-mentioned differences have made the structure of the electricity market unique, since traders cannot store a large percentage of the commodity.
There is a fourth difference which makes the trading structure of electricity even more unique: electricity is becoming a dominant energy carrier and is entering other energy sectors such as transportation [16]. Thus, there might be mutual influences between the electricity market structure and transportation policies.
An electricity market is a market for trading electricity and related services. The market is mainly cleared at partial time spans (usually one hour) and all the agents participating in the market are subjected to the same price (the pool price) unless the agents have bilateral contracts. The regulated parties in the market are generation units, which need to bid into the market the amount of energy that they can generate for each hour and the corresponding prices per unit of energy. On the other hand, there are retailers who buy electricity on an hourly basis. The demand is usually quite inelastic, however, new regulations and products (such as load disaggregation products such as Bidgley [17]) are designed to increase the responsiveness and bring flexibility to the demand side [18].
In order to guarantee a secure supply of electricity, there are three markets with different time regimes within the electricity market: the spot market, power regulation, and the automatic reserve [19]. The spot market (also called load settlement) is an hourly price settlement which leads to a uniform price for all regulated parties in a specific area. The additional balancing requirements which cannot be met in the spot market, due to unexpected demand changes within an hour, are regulated in the power regulation market. This occurs within minutes or seconds. The automatic reserve serves the need to balance the demand and supply within fractions of a second. There are some generation units with very fast response times which can enter this mode and balance the load very quickly [18,19] . In this paper, the spot market of the electricity market is modelled in the first submodel within EMMEV.
2.2. Low Carbon Fuel Standard
The transition to low-carbon transportation fuels is becoming increasingly important and needs a fast change. However, introduction of low-carbon fuels in transportation is hindered by limitations and problems including reduced investments, barriers in technology development and energy industries [20], other forms of technological and market inertia delaying investments in deployment and Research and Development (R&D) [21], cartel pricing, and the failure of markets to assign a price to greenhouse gas (GHG) emissions [13].
Various policies are adopted to overcome these market failures and barriers, ranging from regulatory measures, such as emissions regulations and fuel economy standards, to financial levers such as tax reductions, rebates, and feebate schemes [22]. There are other policies, such as waivers for parking places and tolls, and specifying separate driving lanes for EV drivers. Each has different advantages and disadvantages [23,24].
Among the regulatory measures, the LCFS is a performance-based policy designed to accelerate the transition to low-carbon transportation fuels by stimulating innovation and investment in new fuels and technologies. The LCFS aims to provide a durable policy framework that will stimulate innovation and technological development. Since 2007, the LCFS policy has been adopted in California, Oregon, the European Union (Fuel Quality Directive, FQD), and British Columbia (Renewable and Low-Carbon Fuel Requirement Regulation, RLCFRR) [25,26,27].
The LCFS is based on credit trading, with the intent of harnessing market forces and providing industry with flexibility to optimize their incentives. To assure that emissions are regulated effectively, life-cycle measurements of GHG emissions are used.
The LCFS is a hybrid of a regulatory and market policy instrument. It does not include mandates for any fuel or technology and as such does not attempt to pick winners or losers. Instead, it defines an average emissions intensity standard—measured in grams CO2 equivalent per megajoule of fuel energy (gCO2e/MJ)—that all energy providers must achieve across all fuels they provide. Many options exist for meeting the standard. Regulated parties are free to employ any combination of strategies that suits their circumstances and perspectives, including the purchase of credits from other companies.
There is an instrument similar to the LCFS concerning renewable electricity generation called the Renewables Certificate Market (RCM). RCM was implemented in 2002 through the RPS (Renewable Portfolio Standard) in California [28] as well as in Sweden in 2003 called “elcertifikatmarknad”. Norway joined Sweden in 2012 and they created the “nordiska elcertifikatmarknad” [29]. The main goal of this market is to promote electricity generation from renewable resources [30,31]. RCM has been compared with the LCFS in Table 1.
Both the LCFS and RCM aim to reduce GHG emissions. The target of RCM is the electricity generation sector while the LCFS aims to reduce GHG emissions in the transportation sector. The regulated parties in RCM are generation units and the electricity consumers. However, in the LCFS, the regulated parties are fuel distributors in the transportation sector.
In the RCM, each regulated party can receive one certificate for each MWh of electricity generated from renewable resources. Certain electricity consumers and electricity retailers are obliged to buy certificates based on the amount of electricity they consume. In the LCFS, the regulated parties can sell more low-carbon fuels, or purchase LCFS credits from other regulated parties, low-carbon fuel producers, or other regulated parties. The LCFS defines an average emissions intensity standard that all energy providers must achieve across all fuels they provide.
2.2.1. Operation of Low-Carbon Fuel Standard
The compositions of the vehicle’s fleet (gasoline, diesel, or electric vehicles) and how fast the market can make a transition to alternative fuels/vehicle technologies determine the market share of the fuel. The LCFS provides incentives for fuels with lower intensities, but does not guarantee a higher (or the highest) market share. In the California LCFS, the target is a 10% reduction in overall CI by 2020 [32].
In each year, the regulated parties in LCFS must meet a certain CI target for the fuel they are distributing. In case the regulated parties cannot meet their target, they need to buy credits. On the other hand, if the regulated parties exceed the target, they can sell their credits. The structure and mechanism for credit trade in LCFS is described in the next sections [33,34].
All companies which provide fuel to end users in the transportation sector can choose to be regulated parties in the LCFS. The only obligated regulated parties in the LCFS are baseline fuel producers (i.e., petroleum fuel providers). All regulated parties are indirectly mandated to reduce GHG emissions by reforming their fuel supply. In EMMEV, it is assumed that the regulated parties are biofuel providers, gasoline providers, and Energy Service Companies which provide EV aggregation services. When it comes to EV aggregation services, utilities and Energy Service Providers (ESCOs) have the same behaviors.
2.2.2. Calculation of Credit/Deficit
The LCFS credits are calculated based on a Low-Carbon Fuel Standard defined by regulators each year and expressed in gCO2e/MJ. All the regulated parties are evaluated based on a target to be eligible to get the LCFS credits (have credit) or obliged to buy the LCFS credits (have deficit). In order to calculate the number of the LCFS credits each regulated party receives, the following steps should be followed [33]. First, the energy (MJ) of the sold transportation fuel by each regulated party is calculated. The conversion factors from liter (in case of liquid fuels) or kWh (in case of electricity fuel) are available by regulators. MJ of each fuel is calculated as following:
and for EVs:
In the second step, the Energy Economy Ratio (EER) is considered. The EER aims to account for differences in energy efficiency for vehicles. The EER for gasoline is 1 and 3.4 for electric vehicles, since the electric engine is more efficient than the combustion engine.
The third step is to calculate the difference between the LCFS target of each specific year and the CI of the fuel sold. If the regulated party has not met its CI target, it is producing a deficit and is obliged to buy the LCFS credit. In case of exceeding the target, the regulated party is producing credit and is eligible to receive the LCFS credit.
The fourth and last step is to convert the credit/deficit into grams of CO2 equivalent. Credit/deficit are expressed in terms of greenhouse gas emissions volumes, where credits indicate the emissions saved by selling a low-carbon fuel compared to selling a fuel that exactly meets the low-carbon fuel standard for that year. The tons of CO2 are calculated as following:
The final number shows the number of deficit/credit that each regulated party will get for the fuel sold at each year.
2.2.3. Electricity in the LCFS
In California, under the new regulations, new regulated parties are introduced in the market in which electricity used as a transportation fuel can generate the LCFS credits. These regulated parties are Electric Vehicle Service Providers (EVSP) for public charging, Electric Vehicle (EV) fleet operators, battery switch station owners, site hosts of private access EV charging equipment at businesses or workplace, transit agencies operating a fixed guideway system or electric buses, and the Electrical Distribution System Operators (DSO) for residential charging. These regulated parties, in general, are the ESCOs which are in charge of EVs charging and providing EV charging services [35]. Utilities and ESCOs have the same behaviors when they provide EV aggregation services.
Low-carbon fuels that meet the CI target of 2020 are exempted from the LCFS. This means that entities that are providers of these fuels do not have obligations under the LCFS and can thus choose not to join the LCFS program. However, if they decide to participate in the LCFS, they can gain the LCFS credits and trade them in the structure of the LCFS [35]. In EMMEV, it is assumed that the agents with electricity as fuel for transportation decide to participate in the LCFS.
2.2.4. Trading in the LCFS
At the end of a compliance period (one year for most of the LCFS programs), each regulated party must retire a sufficient number of credits to meet the obligation of the compliance period. The regulator normally sets a maximum price at the beginning of each year ($200 for each credit in California) [34]. The regulated parties in the LCFS can trade their LCFS credits in one of the following markets:
- Ongoing LCFS Credit Market
- Credit Clearance Market
In the ongoing LCFS Credit Market, the regulated parties can trade their credits through bilateral contracts any time during the compliance period. This is similar to a forward contract in the electricity market [36]. There is normally a low risk in those contracts.
If the regulated parties do not have contracts in the ongoing LCFS Credit Market or there are overall credit shortfalls and the regulated parties reported net credit deficits at the end of the reporting period, the regulator will set up a clearance market to enforce the selling and trading of credits for regulated parties. Credits acquired for this purpose are defined as “Clearance Market” credits [34,35]. The Credit Clearance Market does not happen frequently; if all parties are complying, there is no need for it.
3. What is EMMEV?
The EMMEV is an agent-based model platform developed to analyze the effects of low-carbon transportation policies on the electricity market. In this paper, EMMEV is used to study the effects of the LCFS on the electricity market. The agents are Energy Service Companies (ESCOs) and it is assumed that the ESCOs in EMMEV can provide power generation, electricity retailing, and EV aggregation as energy services. When it comes to EV aggregation services and retailing, utilities and ESCOs have the same behaviors. Regarding power generation, there are exception cases where ESCOs own small power generation units but utilities are the ones which can own and operate larger generation units. ESCOs in this research are the mother company in which all the businesses (retail, generation, or EV aggregation) are performed in separate companies due to unbundling. This happens in reality when holding companies such as German utility (E.ON) or Energias de Portugal (EDP) perform all the activities.
3.1. About Modelling
Modelling is the art of simplification to describe a limited part of our complex nature (or a socio-technical system). Models support researchers and generally human beings to overcome our limited success in understanding our complex nature.
Relative to humans’ understanding, nature is extremely complex. This complexity is known to human beings from very early ages. Therefore, there is no other way than relying on modelling to study the incidents in nature. This is done in two ways: statistics or dynamics [37].
Statistics is well established for modelling, while dynamics for modelling, despite its older history, is less mature regarding model development, since it requires more computational capability that has only more recently been available [37,38]. In this paper, a socio-technical system in the intersection of the LCFS and electricity market is modelled using agent-based modelling (to be described in the next section).
3.2. Agent-Based Modelling
The modeling tool used in this paper is an agent-based model (ABM) [39,40]. An ABM is composed of several agents. The agents can have the inherent properties of flexible autonomy, reactivity, proactiveness, and social ability [41,42].
ABM can be considered under the more generic terms of Multi Agent Systems (MAS) which simply describe various computational instruments following an agent-based approach [42]. MAS comprises also the domain of (distributed) artificial intelligence and agent-based control systems which aim to design autonomous (software) agents and implement them in real-world cases (in the sense of designing and configuring systems in practice). In contrast, ABM specifically deals with the computational representation of Complex Adaptive Systems within their boundaries. ABM is also used for studying economically motivated relationships also known as agent-based computational economics (ACE) [40], which is the main focus in this paper.
3.3. EMMEV: An Agent-Based Model
As mentioned above, EMMEV consists of two submodels: the electricity market model and the Low-Carbon Fuel Standard model. There are two layers in the model: the agent layer, which is the core of the modelling, and a geographical layer, which addresses different geographical locations for different case studies. EMMEV studies the interactions of agents for 15 consecutive years (2016–2030). Regardless of all the number of languages, frameworks, developed environments, and platforms published during the last decade in the literature, implementing agent-based modelling is still a complex task, which, in general, is coded by using middleware as RePast [43]. The RePast system is a Java-based middleware for the development of trivial agent platforms and agent models. It was developed at the University of Chicago’s Social Science Research Computing division and is derived from the Swarm simulation toolkit. RePast offers a set of reusable Java Bean components, along with several flexible interconnection methods to combine those components, and thus create software agents. Furthermore, RePast uses the base of the Knowledge Query and Manipulation Language (KQML) to promote communications among agents inside the platform. KQML provides the basis for the most widely-used agent communication language (ACL), and over the last years it has been extended, modified, and standardized by Foundation Intelligent Physical Agents (FIPA) [44]. Agents use KQML to send performatives to indicate the action that another agent should take on its behalf. Another major meaning of the KQML is the use of ontologies to ensure that two agents communicating in the same language can correctly interpret statements in that language. The main reason for the choice of RePast is due to the Java Bean technology, which has allowed new computational features to developers to reap the benefits of rapid application development in Java by assembling predefined software components.
The agents in the model are ESCOs and they are profit-maximizing entities. The profit for each agent is calculated as below:
The revenue of each ESCO has three sources:
The revenue from generation is set by the spot price of electricity and the amount of generated electricity. The revenue from retailing is also dependent on the price scheme offered to the end consumers and the amount of consumption at each hour. The EV aggregation is the revenue from the sale of electricity to EV owners. The agents can make different profits by offering different price patterns to EV owners. The ESCOs will have some revenue from the LCFS market by selling their LCFS credit. The costs associated to ESCOs are defined as the following:
The electricity generation costs, cost for buying electricity for retailing, and cost for buying electricity for EVs are the main costs of ESCOs. The agents are assumed to be independent entities which deal with each other under the same condition in the electricity market and the LCFS market.
It is also assumed that the agents interact with each other in a market environment based on the following four rules:
- The agents provide the same service.
- All agents are price takers—they cannot control the market price unless by banking strategy.
- All agents have a relatively balanced market share.
- Users have complete information about the service.
The agents have the possibility to bank the credits which they received from the LCFS [13]. Based on these assumptions, two scenarios are created. In the first scenario, it is assumed that all the agents are cash constrained, which means that they sell their credit by the end of each year to generate cash to operate their business. The second scenario is the case in which agent number 2 (one randomly chosen agent) banks the credits and sells them every 5 years under the assumption that they will influence the market, increase prices, and gain more profit. This might not happen in the real world with a well-functioning LCFS. However, in case the program is not well designed, then the described shortfall might occur. One of the solutions to avoid this scenario could be to define a limit on how much credits each market play can bank in each specific time or controlling credit liquidity in the market.
Agents which are eligible to receive credits in the LCFS market can sell their credits and gain some profit. In EMMEV, this profit is meant to be spent on the charging infrastructure and subsidize the sales of EVs. In Sierzchula, Bakker [9], it is claimed that each $1000 increase in financial incentives would cause a country's EV market share to increase by 0.06%. However, the investment in charging infrastructure could be more beneficial to increase the number of EVs; each additional station per 100,000 residents would increase its EV market share by 0.12% [9] and this has been used as elasticity in this research. In this paper, EMMEV is tested by assuming that the profit from the LCFS is spent in charging infrastructures. In future, EMMEV can be used to investigate different other scenarios, such as spending LCFS revenue for rebates for EVs.
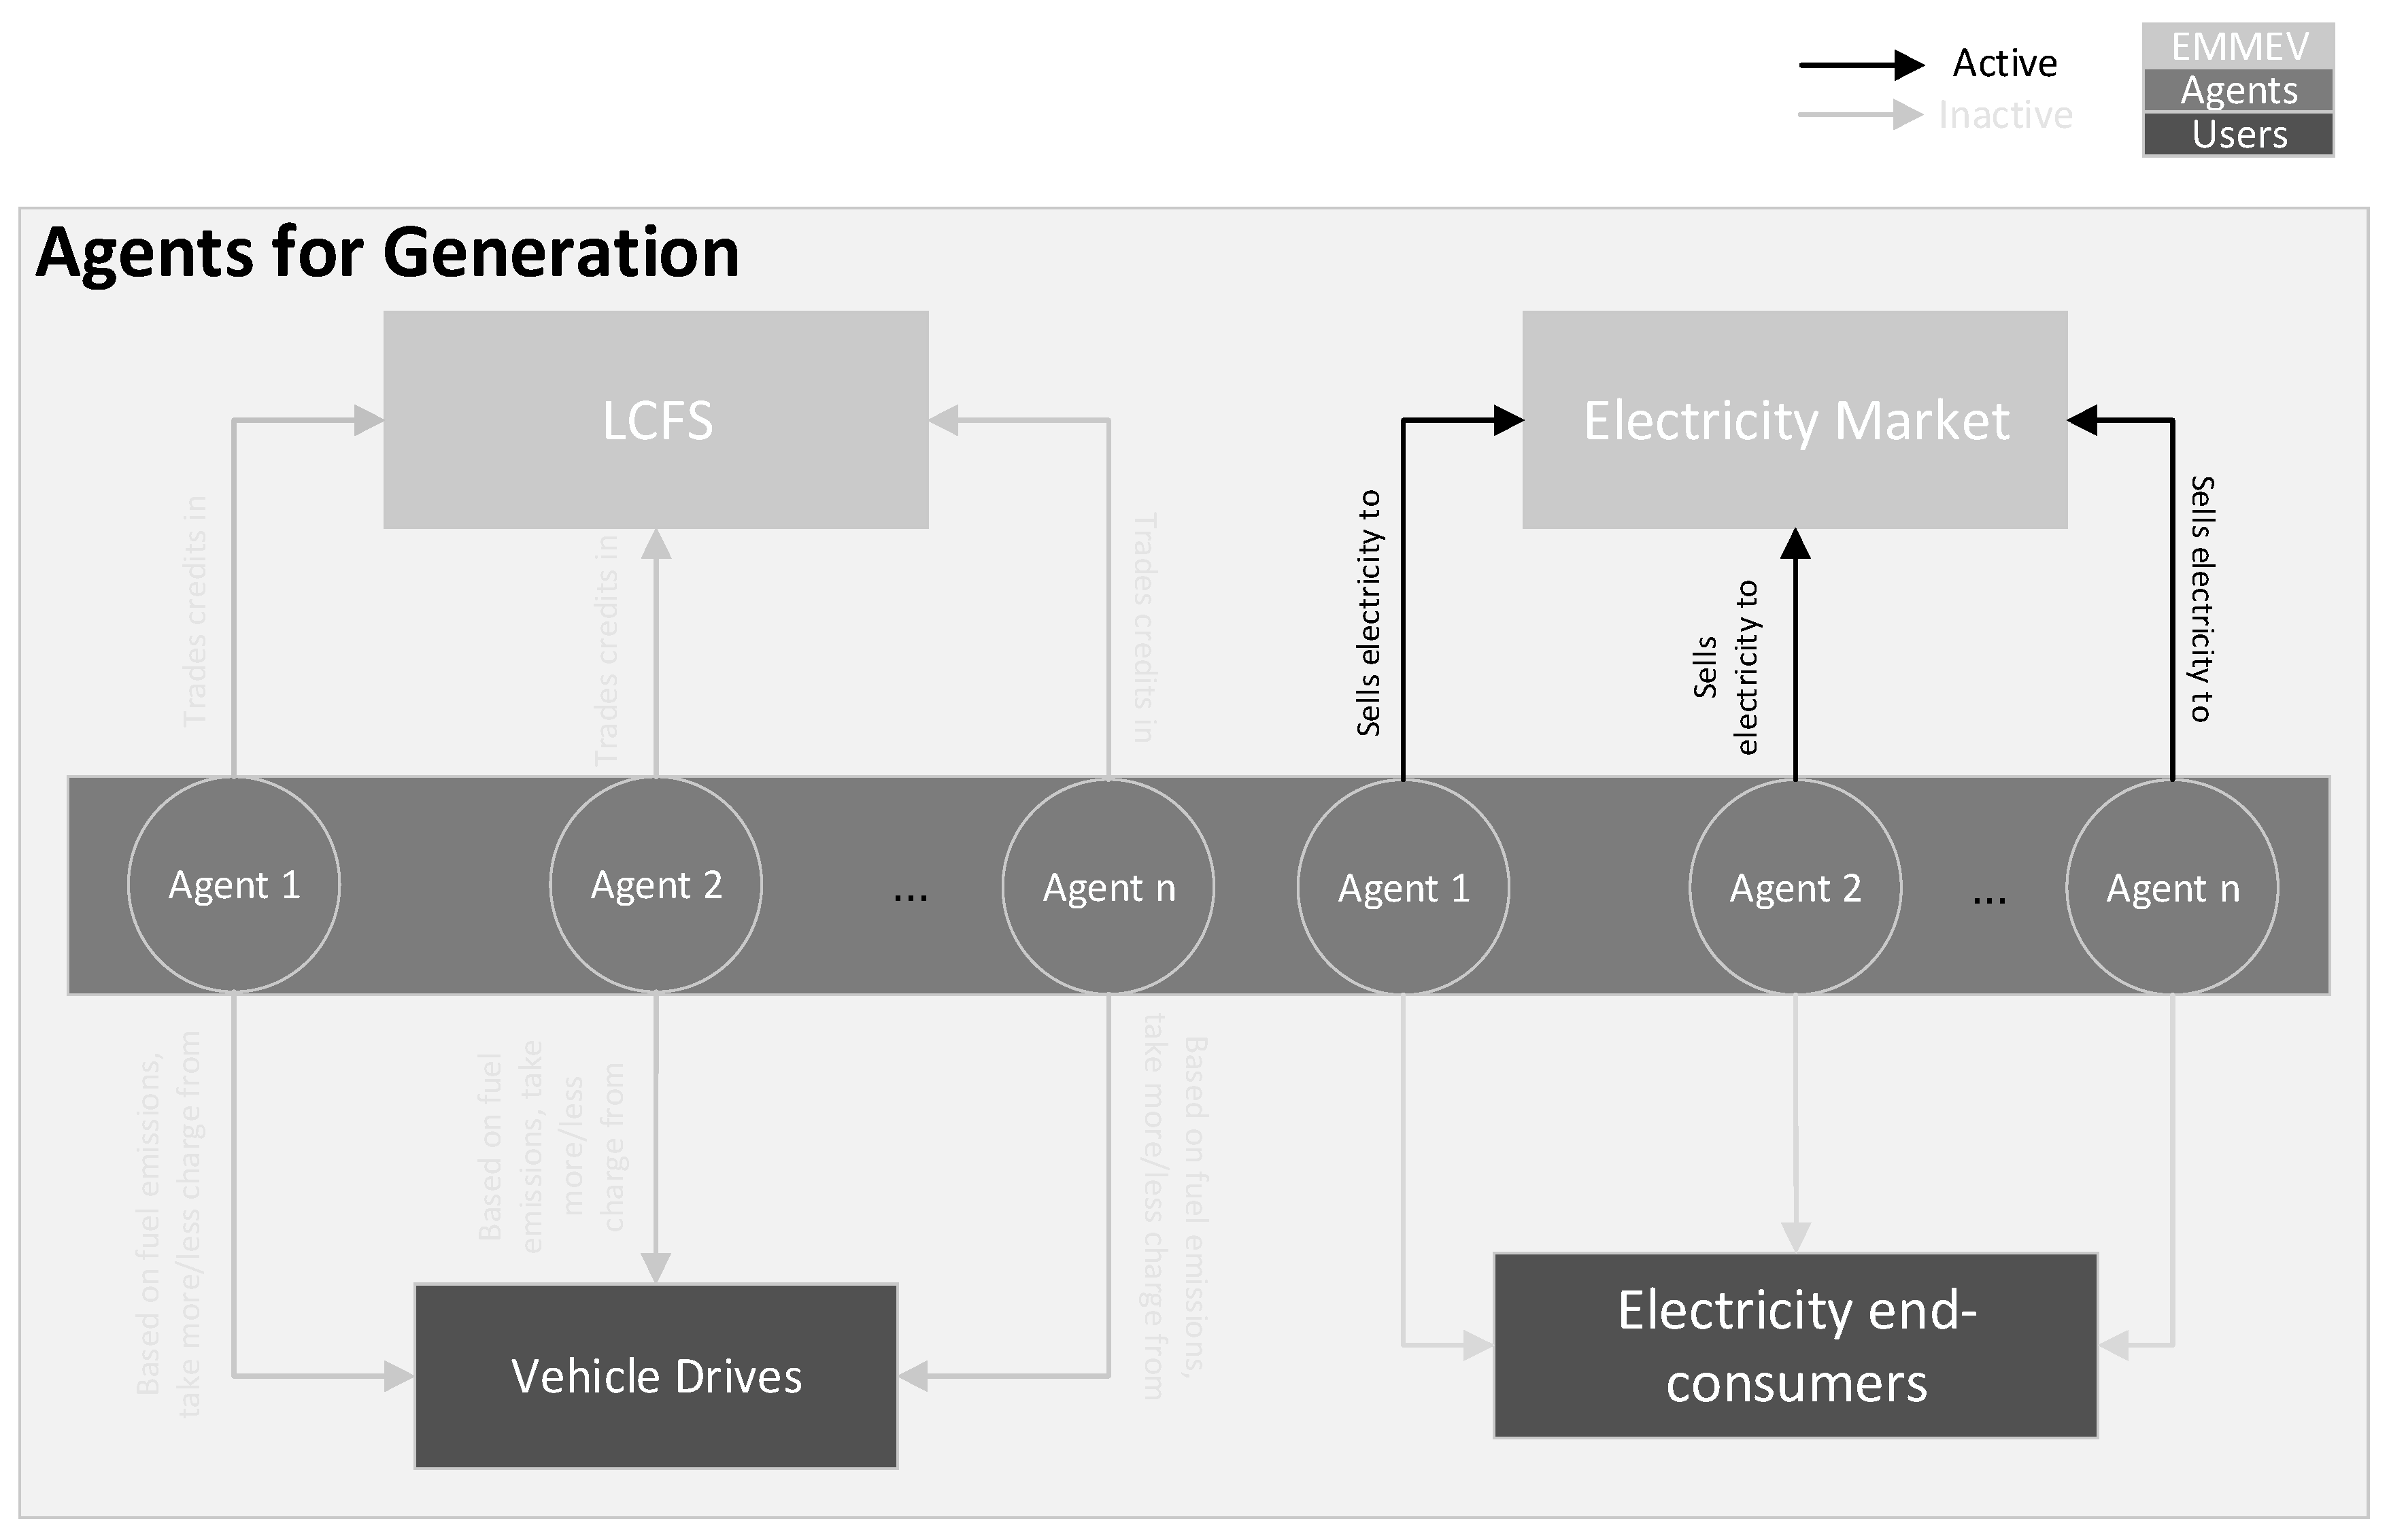
In each of the three revenue cases (generation, retailing and EV aggregation, and LCFS), the agents interact differently. In Figure 1, the interaction of agents in generation is shown.
As shown in the above figure (the black lines are the focus areas and gray is not meant to be focused on and will be described in the next figures), the agents sell their generated electricity in the electricity market. It is assumed that the agents have balanced share of market and cannot influence prices. The electricity prices are set by passing the demand curve through the generation curve at each hour.
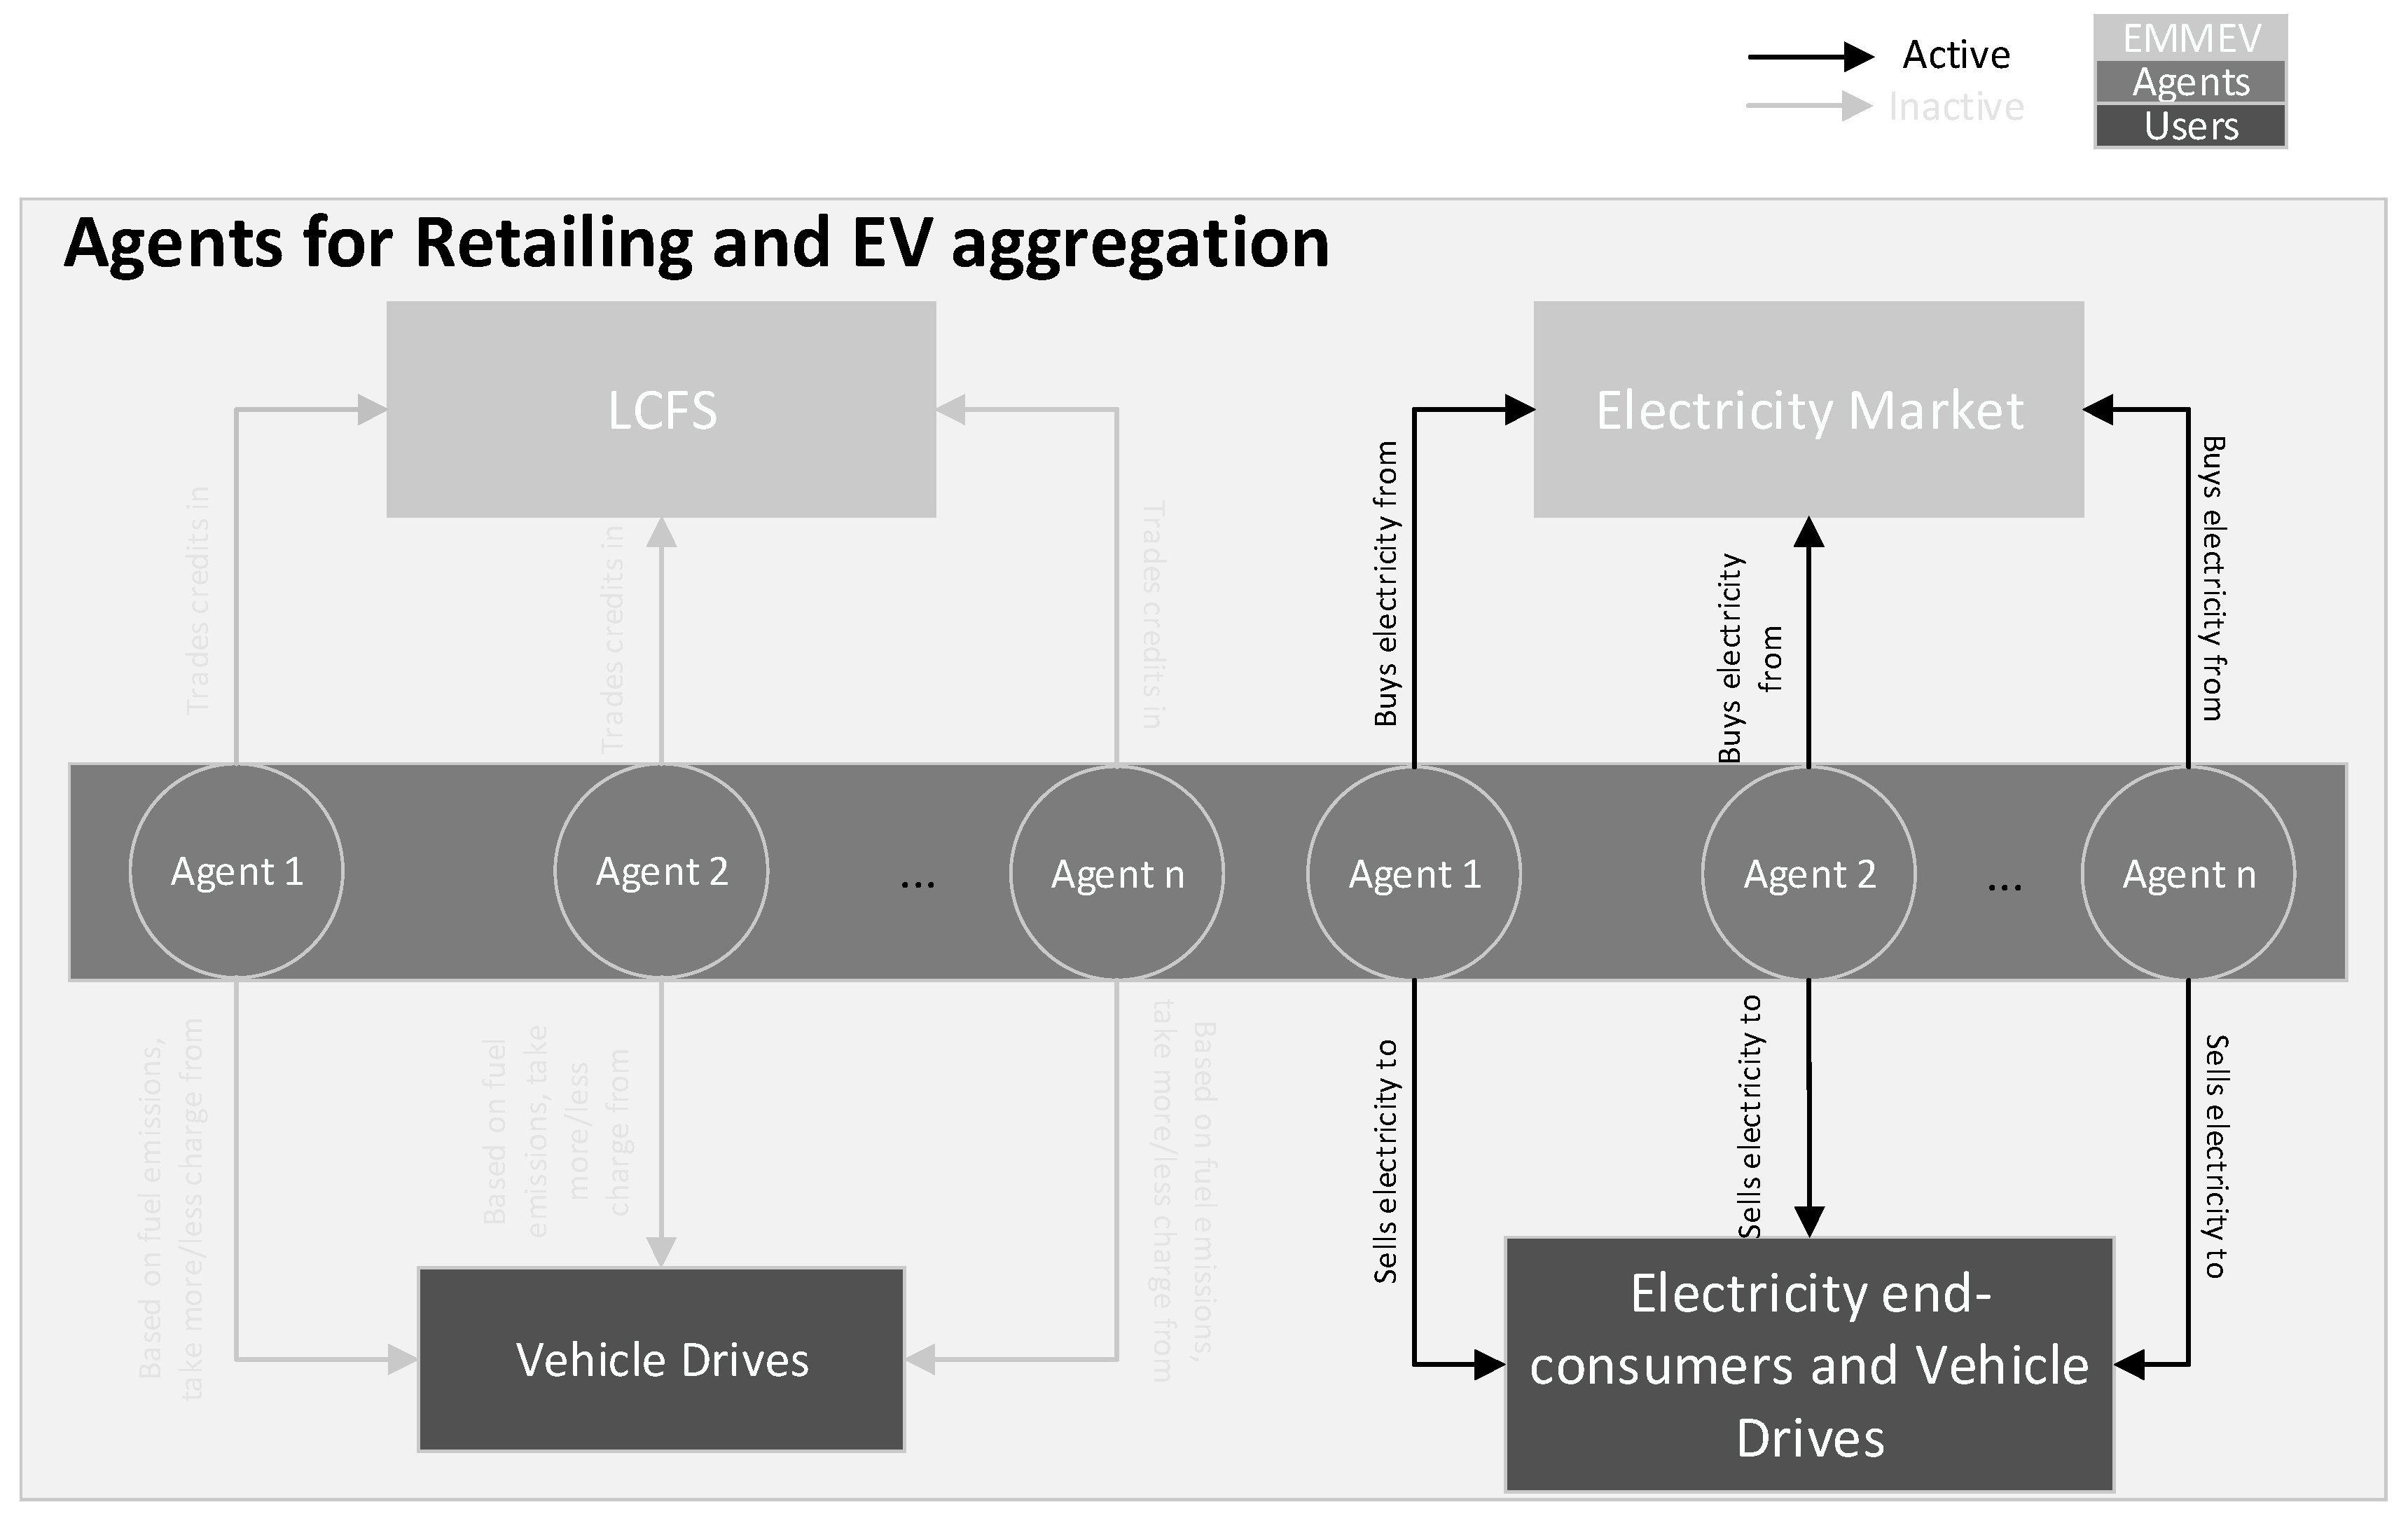
Retailing and EV aggregation create similar agents’ interactions, as it is shown in Figure 2.
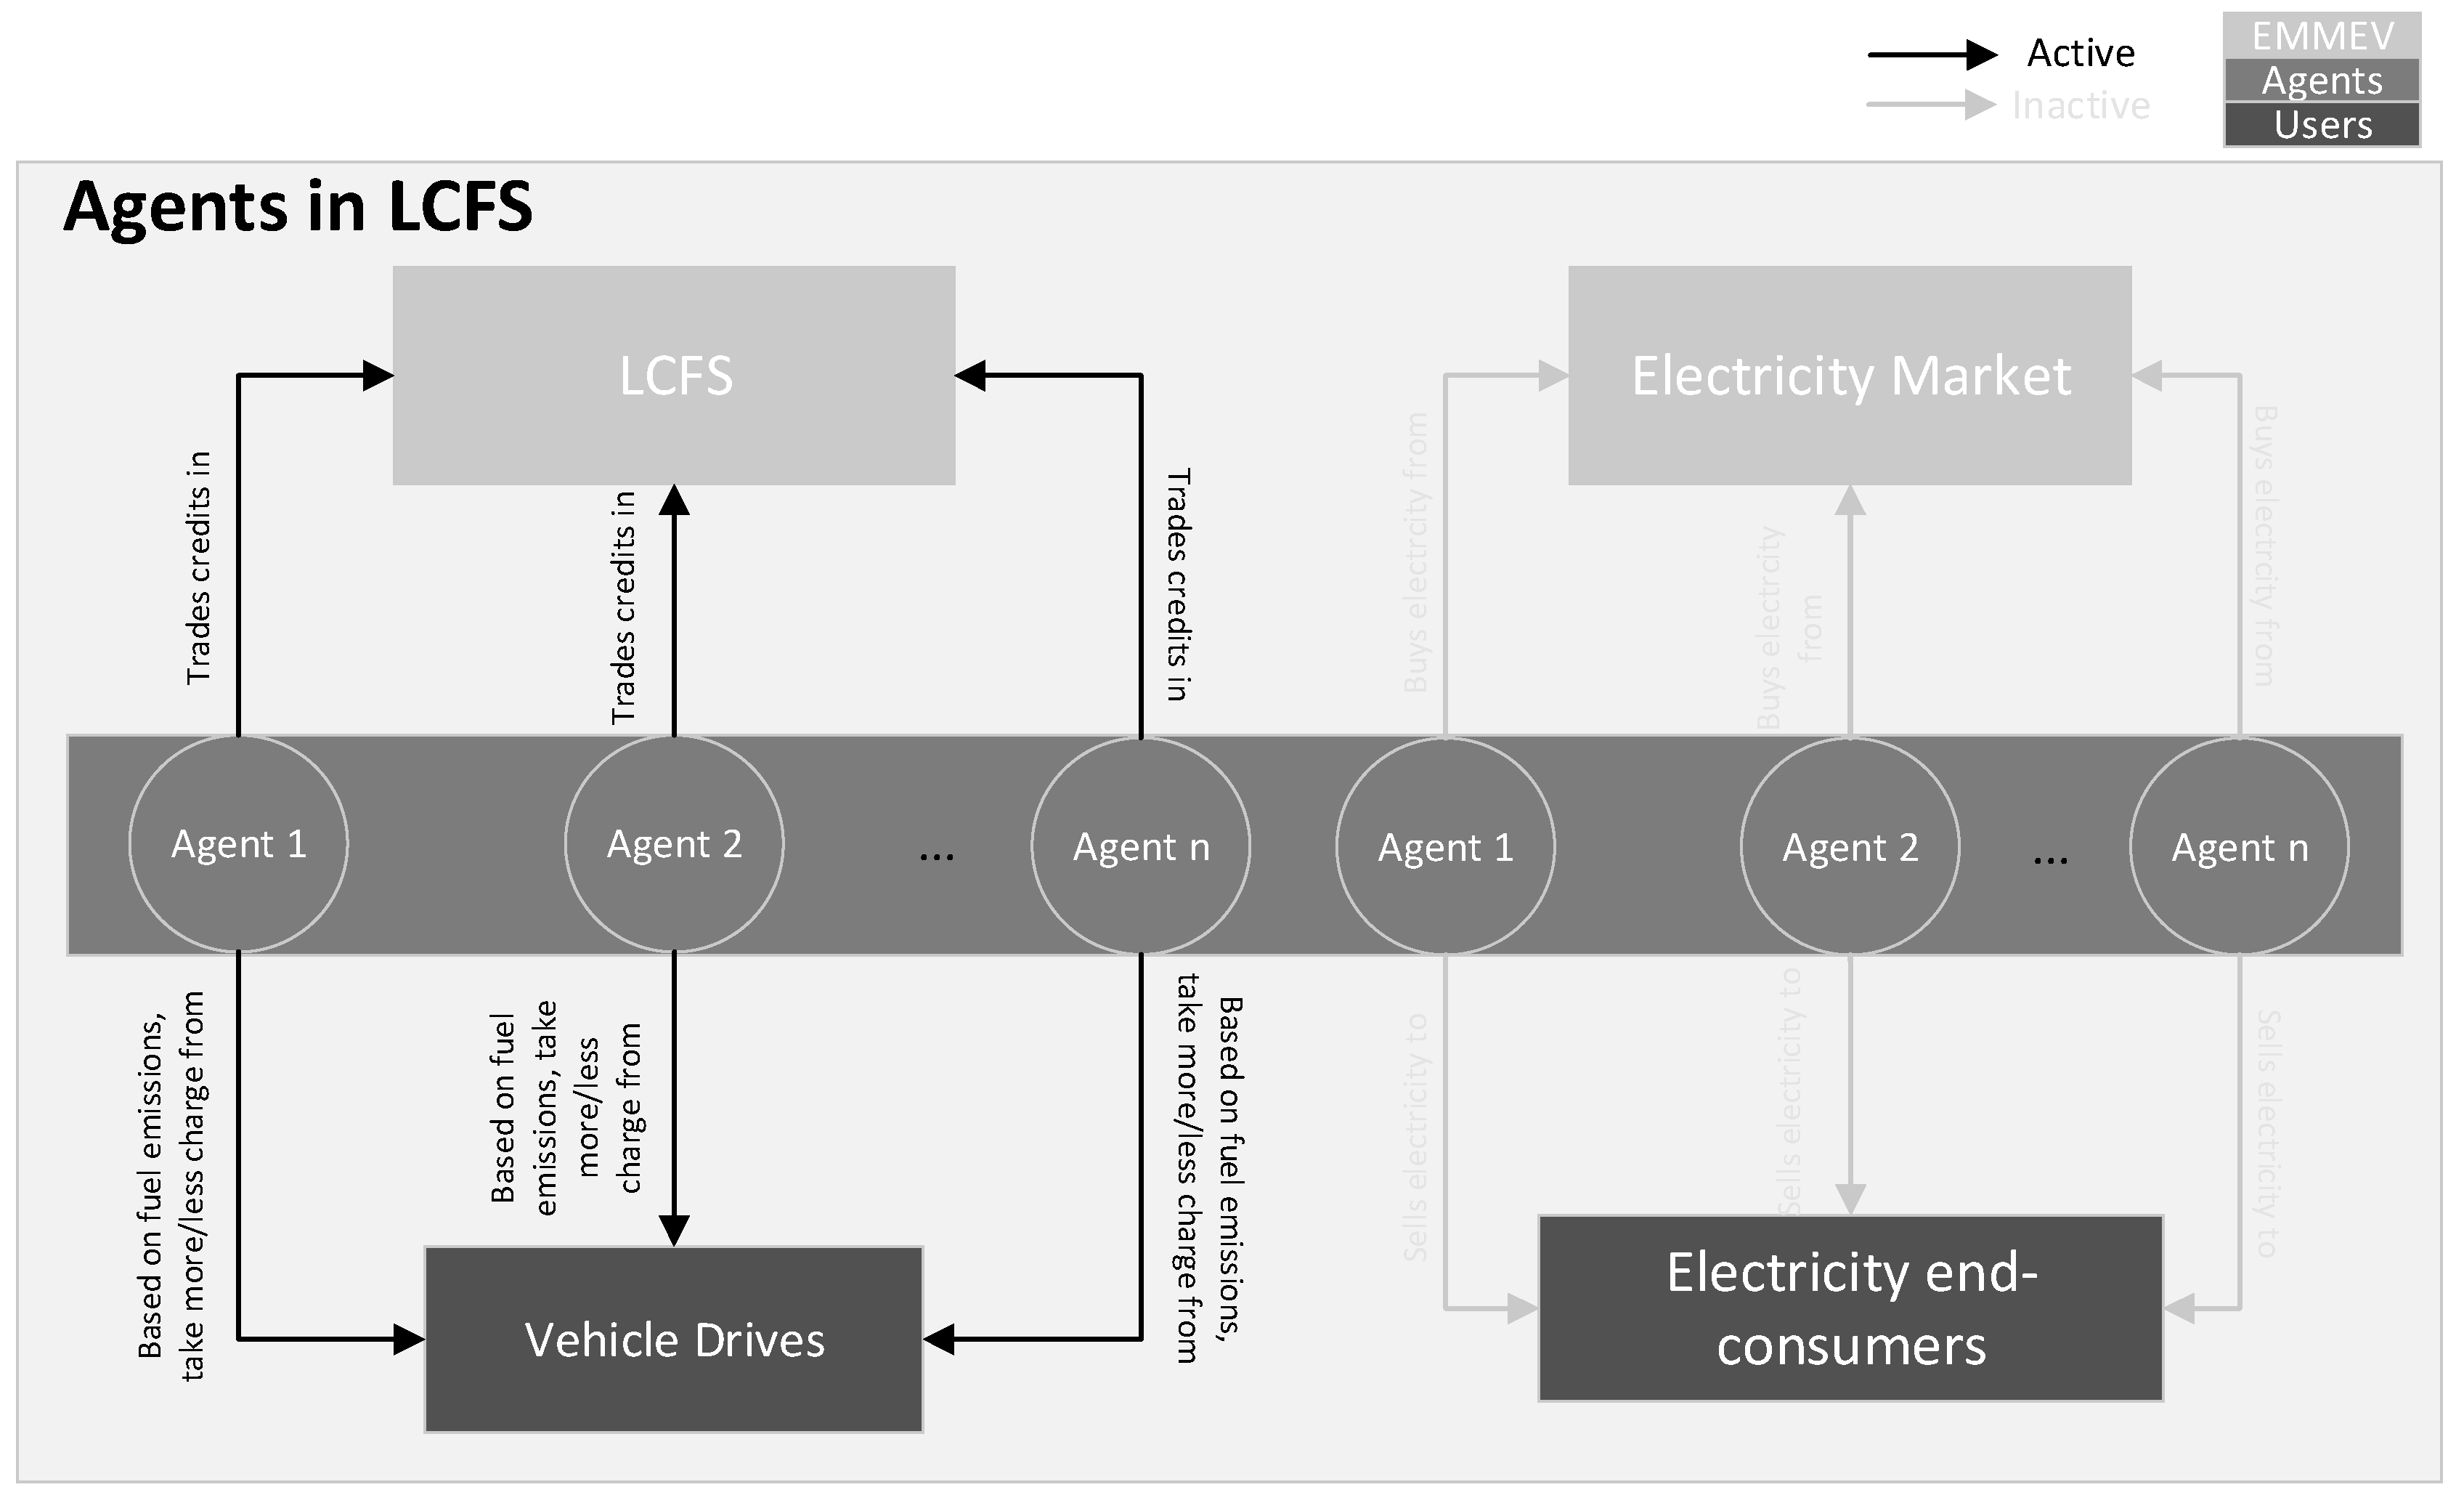
In this energy service, the agents buy their electricity from the electricity market and sell it to the end users. This is valid for the electricity to be sold for any industrial, commercial, and residential application as well as for EVs to charge their batteries. The agents also interact in the LCFS part of EMMEV. This has been visualized in Figure 3.
In this service, the agents interact in the LCFS market to trade their credits. The agents also charge the vehicle drivers less or more based on the emissions from each specific fuel sold and the credit they get for each specific fuel.
For simplicity, it is assumed that there is a single electricity market in the model, serving two countries. By assumption, each country is divided into two regions, with different electricity prices due to line congestion between the regions.
Models such as EMMEV create an understanding in this complex, interrelated, and multidisciplinary area. This understanding serves the regulators and policy makers to guide the transportation toward low-carbon alternatives.
4. Test System
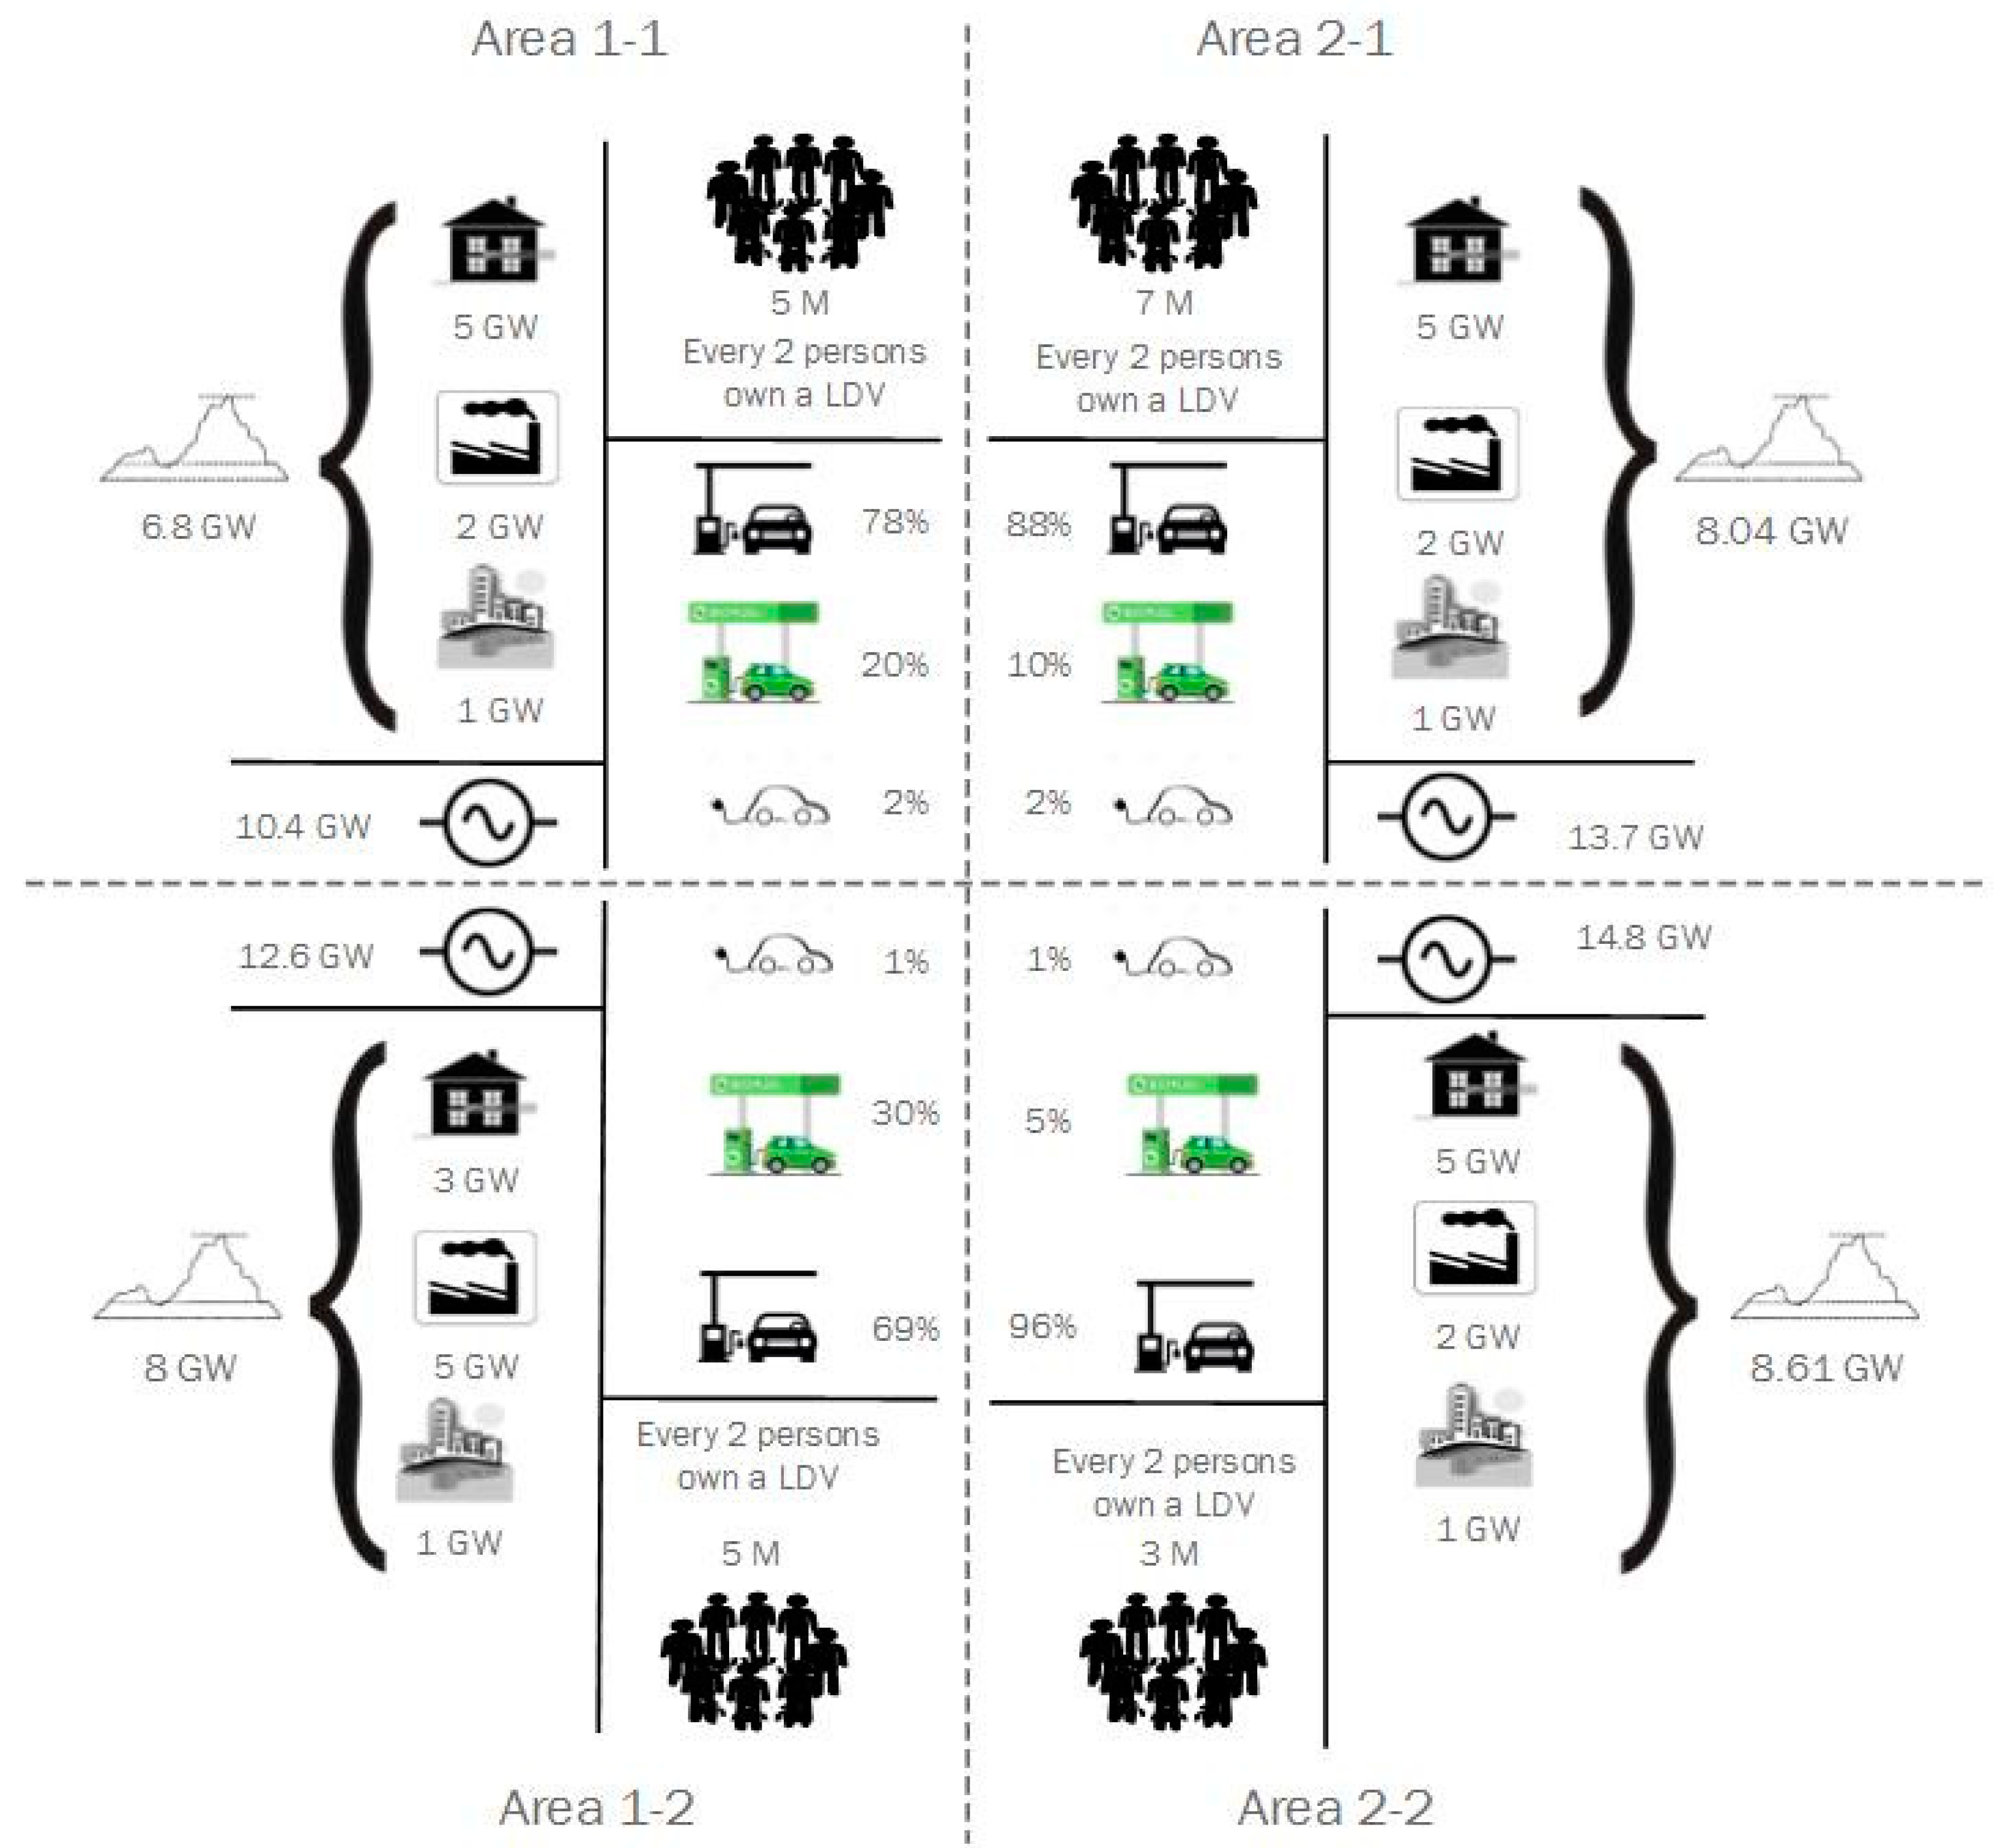
EMMEV has been tested in a simulated market with two fictitious countries. The population of these countries are assumed to be very similar and both countries have taken serious measures for both renewable electricity generation and e-mobility. In each country, it is assumed that there are two price regions, as shown in Figure 4.
In the figure above, four areas in the electricity market are depicted. In each area, the peak load and how the peak load is divided between residential, industrial, and commercial loads are presented. On the lower part for each area, the total generation capacity is shown. Then, the population and the number of vehicles per person are shown. Finally, the percentage share of each type of vehicle, electric, biofuel, or regular gasoline, is depicted for each area.
The parameters used in the test system are described in Table 2. The table is a summary of the parameters used for modelling purpose. It is shown whether each parameter is based on an assumption or if it is taken from other references (the reference is shown) or if the parameters are derived from other assumptions or referenced parameters.
Considering the complexity of such systems, the above-mentioned parameters are limited to our current capacity to model the system. However, there are more parameters, such as demographic information about the population (such as age, gender, and wealth), changes in electricity consumption per person and consequently in peak electricity consumption, and variation in electricity generation from each resource, which have influences on the model but are not considered for the sake of simplicity.
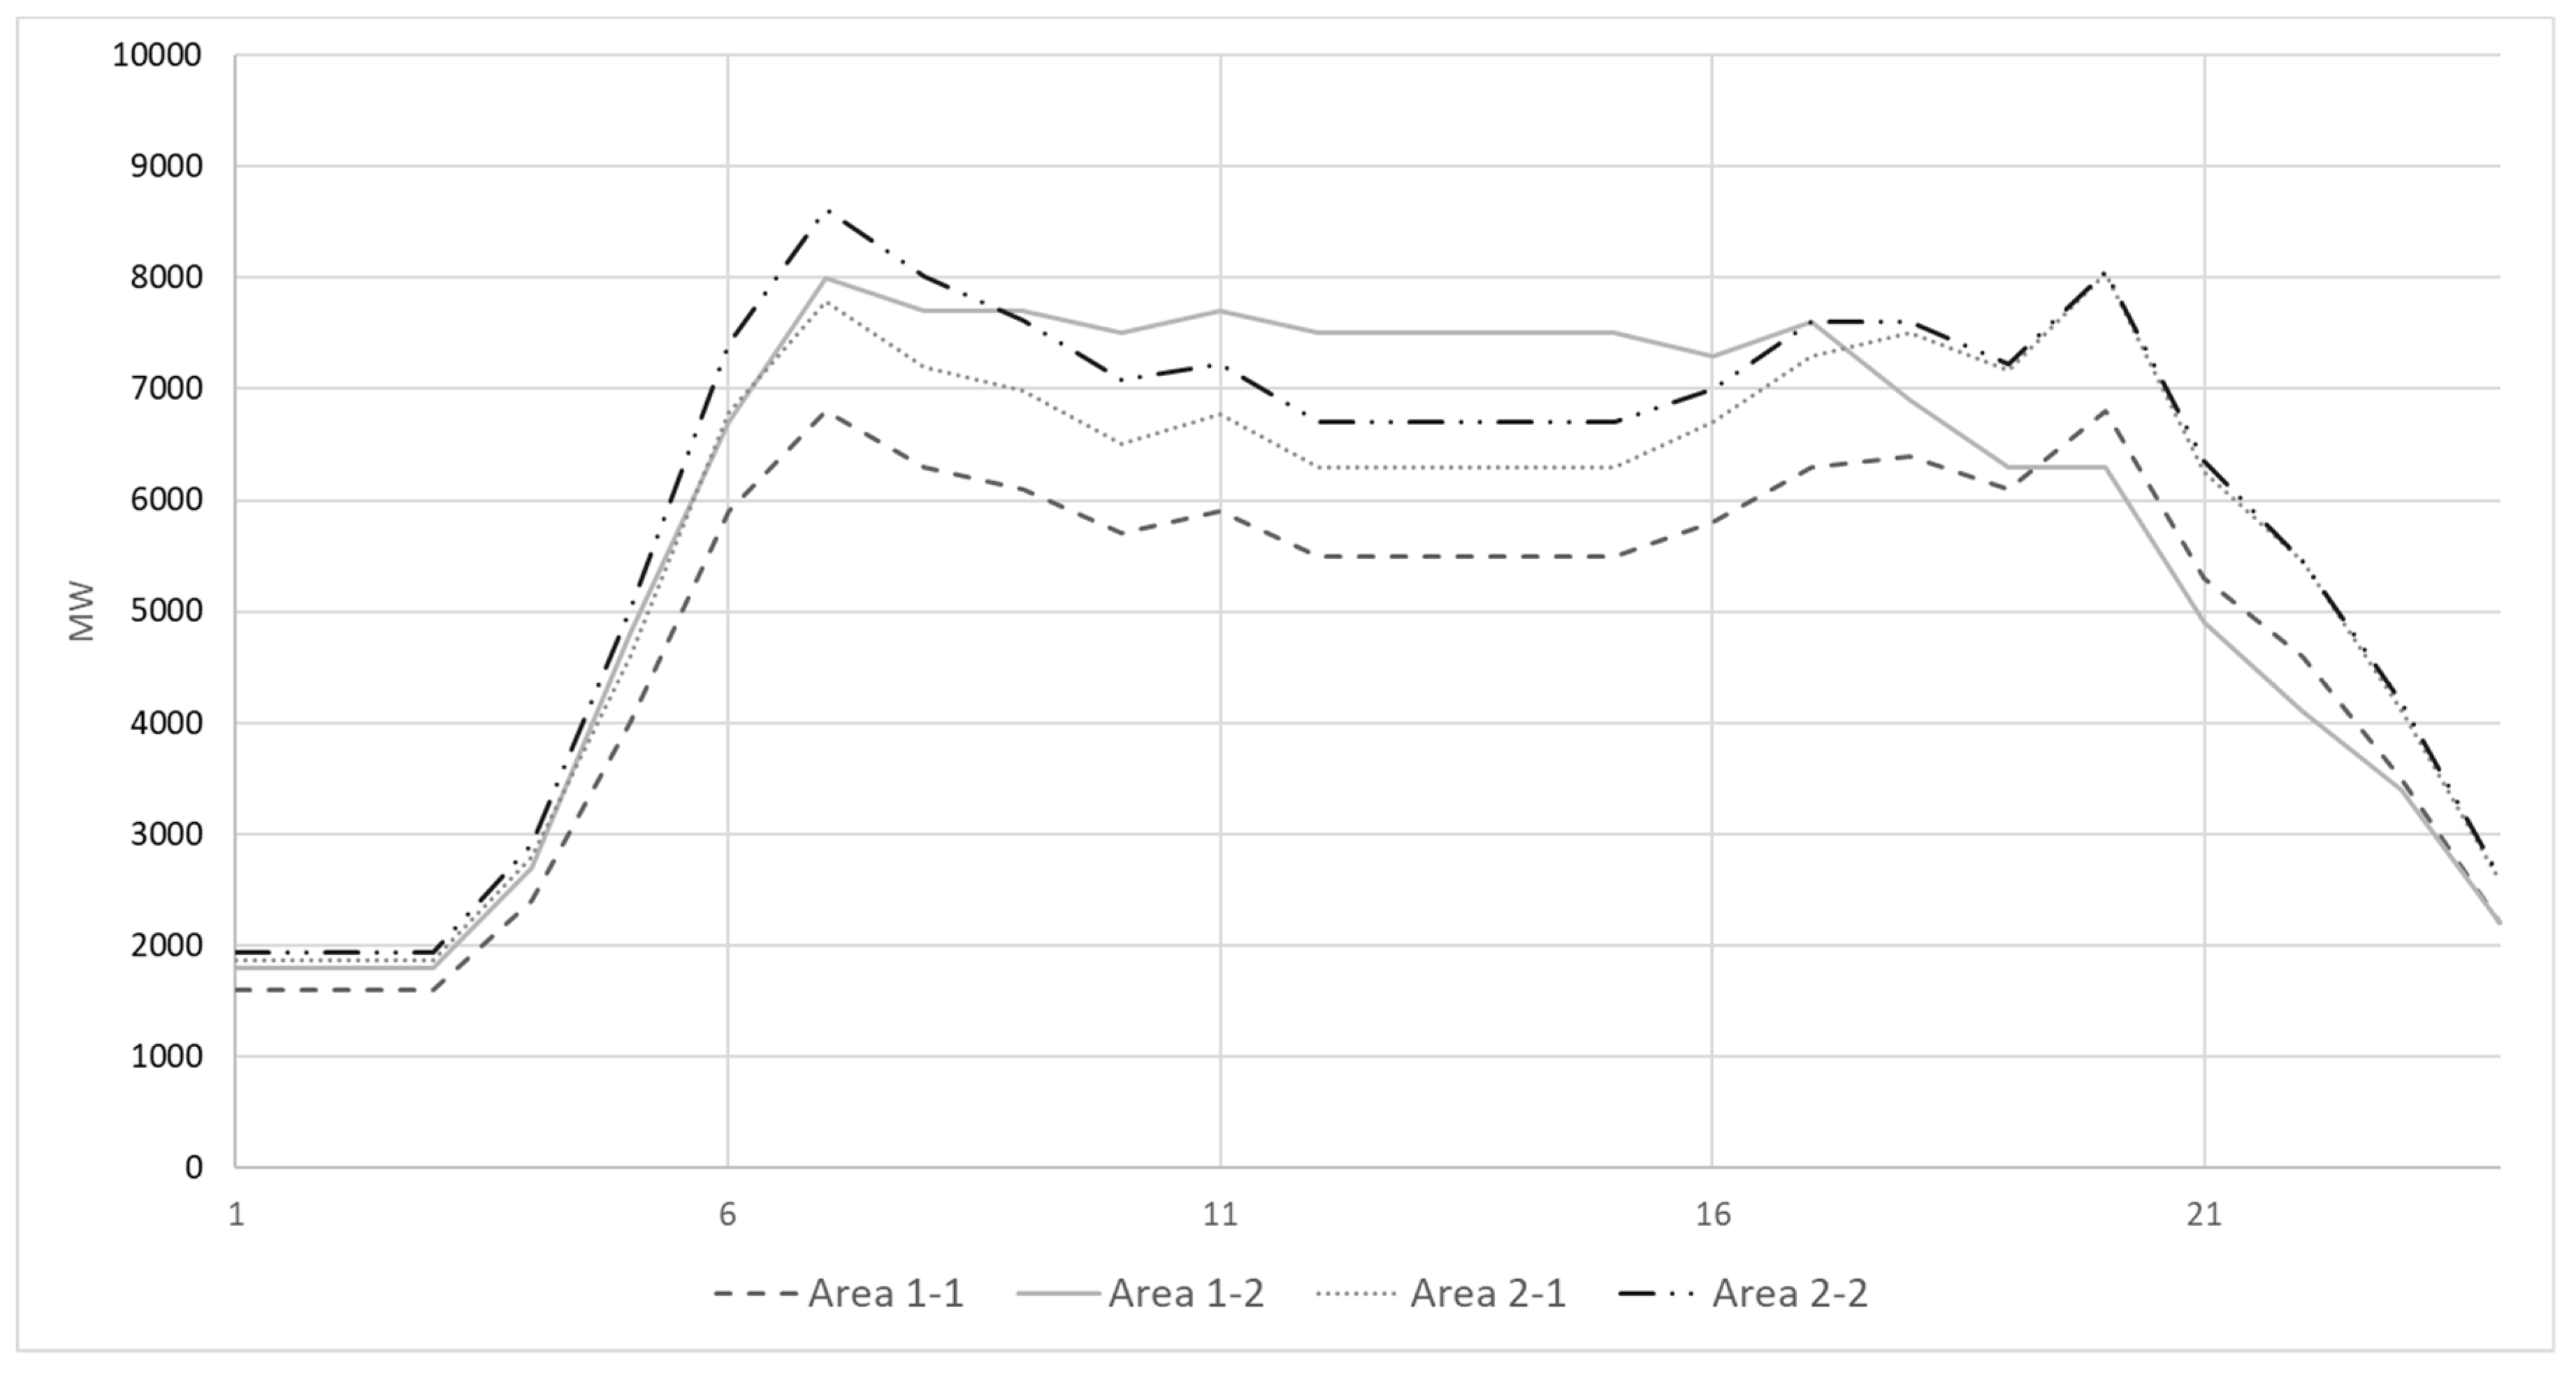
There are three types of loads in the market: residential, industrial, and commercial. It is assumed that all the individual loads follow the same pattern depending on their type, as shown in Figure 5.
In the system, there are 5 agents and their market shares are summarized in Table 3.
The agents are ESCOs which can own generation units and provide EV aggregation services. In Figure 4, the size of the generation units owned by each agent is shown. The generation units are of different types: hydro, thermal, solar, and wind generation units. The primary share of the market from EV aggregation services is also shown in Table 3. This share can be changed by different strategies that each agent can take in the LCFS market.
The EVs in this simulation environment have a battery capacity of 8 kWh with a charging power of 3 kW/h. The battery capacity and charging power are fairly low in comparison with existing electric vehicles. However, due to lower penetration of EVs, this can be still a valid assumption [45].
There are three fuel types in the test system, which are described in Table 4.
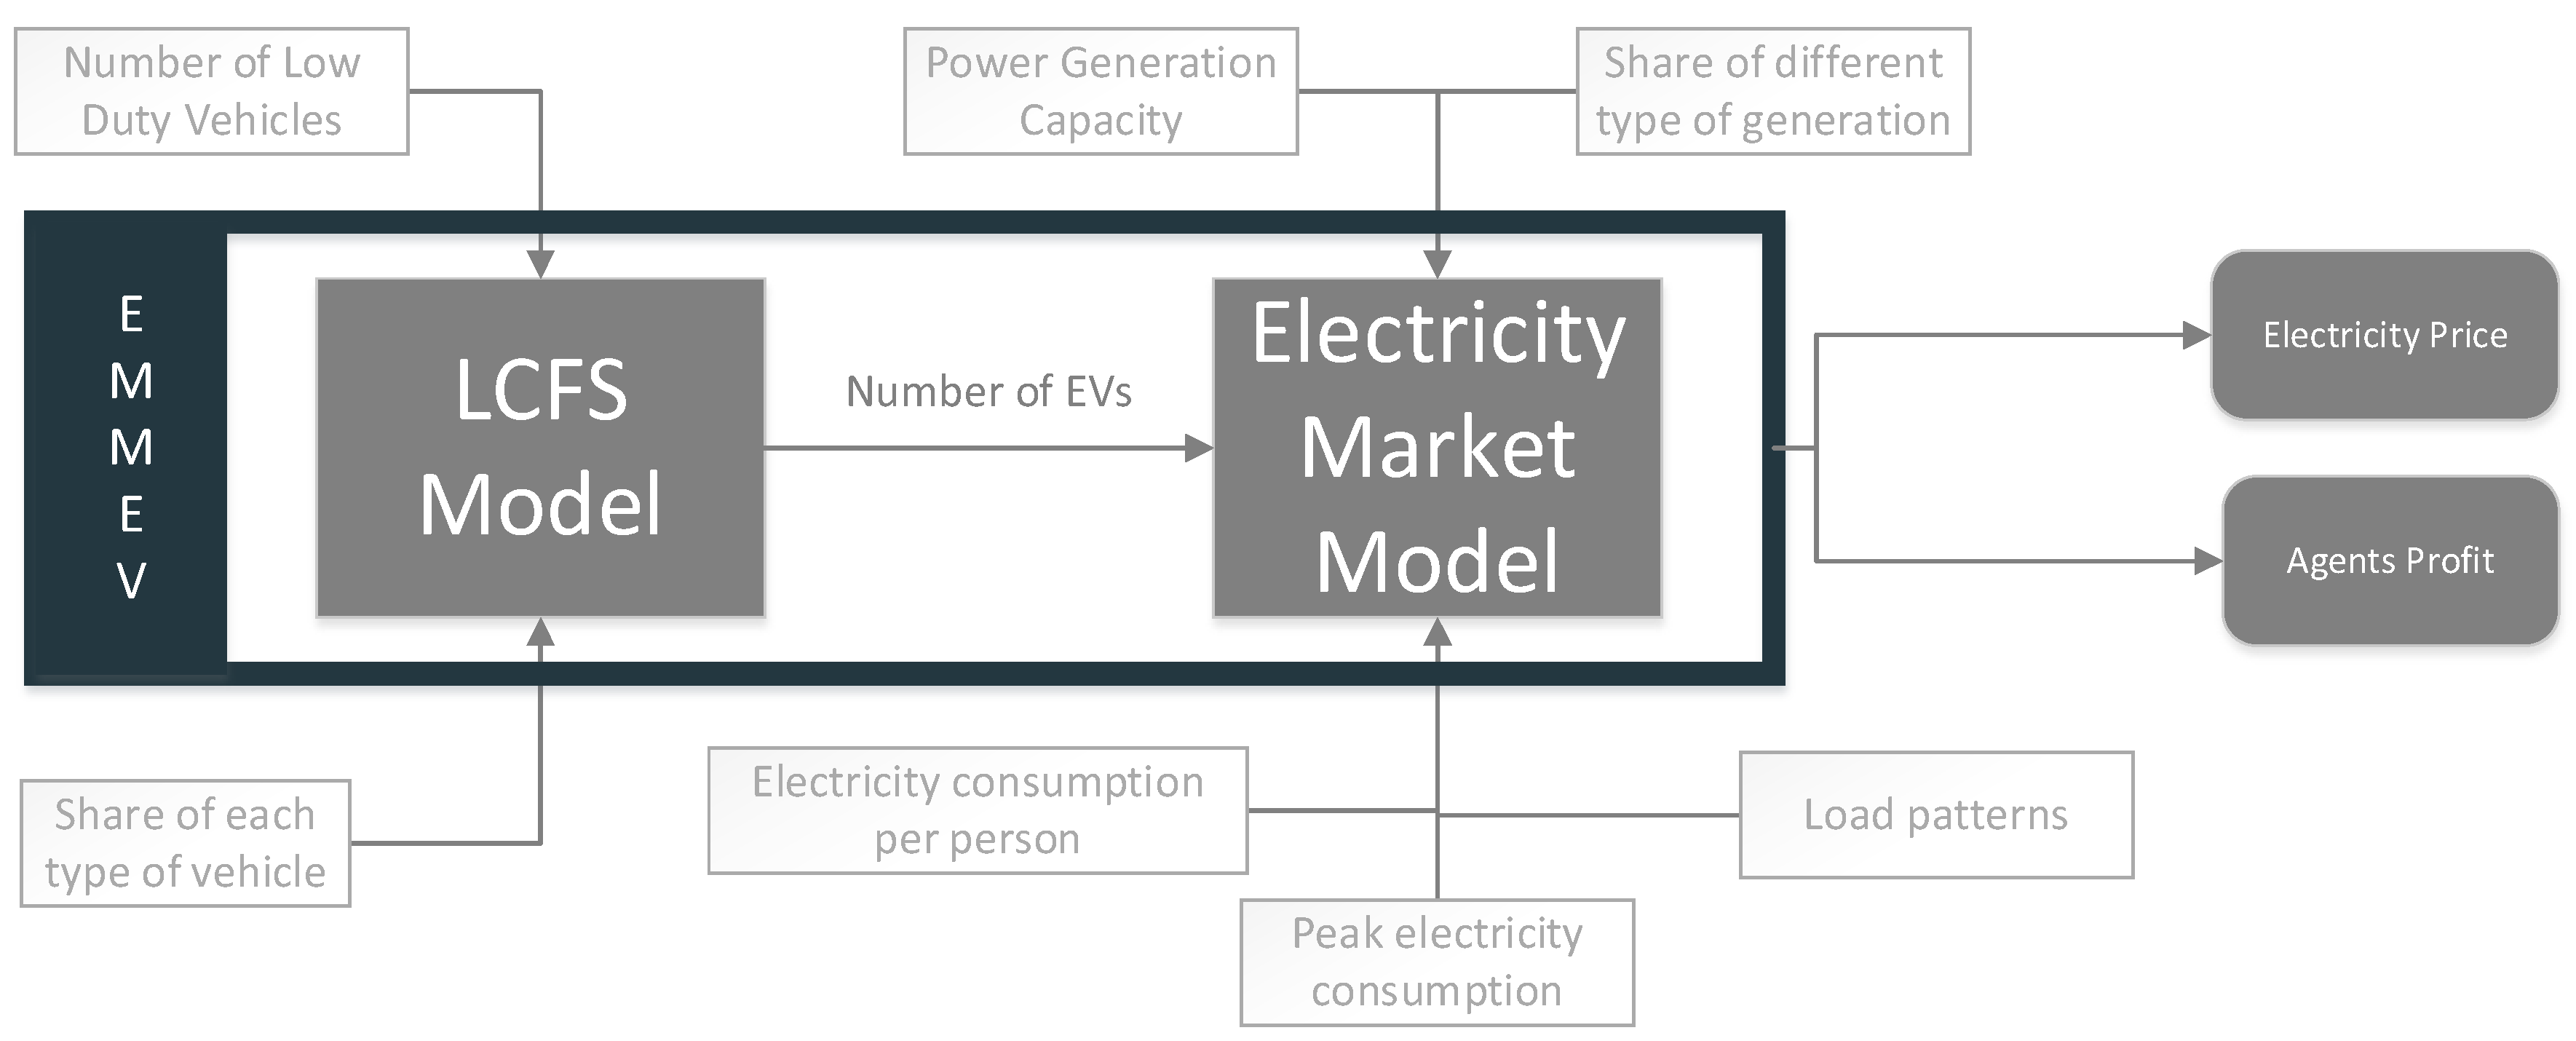
The target is to decrease emissions from transportation by 10% by the end of 2030 starting from 2016. Based on this target, the number of electric vehicles which are needed to reach that target is set. LCFS is set to reach a target and EMMEV has been studied how effectively LCFS can reach that target. The increase in the number of EVs will eventually influence the electricity price. The process which EMMEV follows to get the outputs are visualized in Figure 6.
In this process, the number of EVs, the output from the LCFS model, is an input to electricity market. Therefore, the number of EVs will influence the electricity price, which is discussed and analyzed in the next section of this paper.
5. Results and Discussions
The agents can sell their credits in the Ongoing Credit Market or Credit Clearing Market as described in Section 2. If regulated parties do not have contracts in the ongoing LCFS Credit Market or there are overall credit shortfalls and the regulated parties reported net credit deficits at the end of the reporting period, then a Credit Clearing Market will occur. Therefore, it is assumed that all the credits are sold in the Ongoing Credit Market.
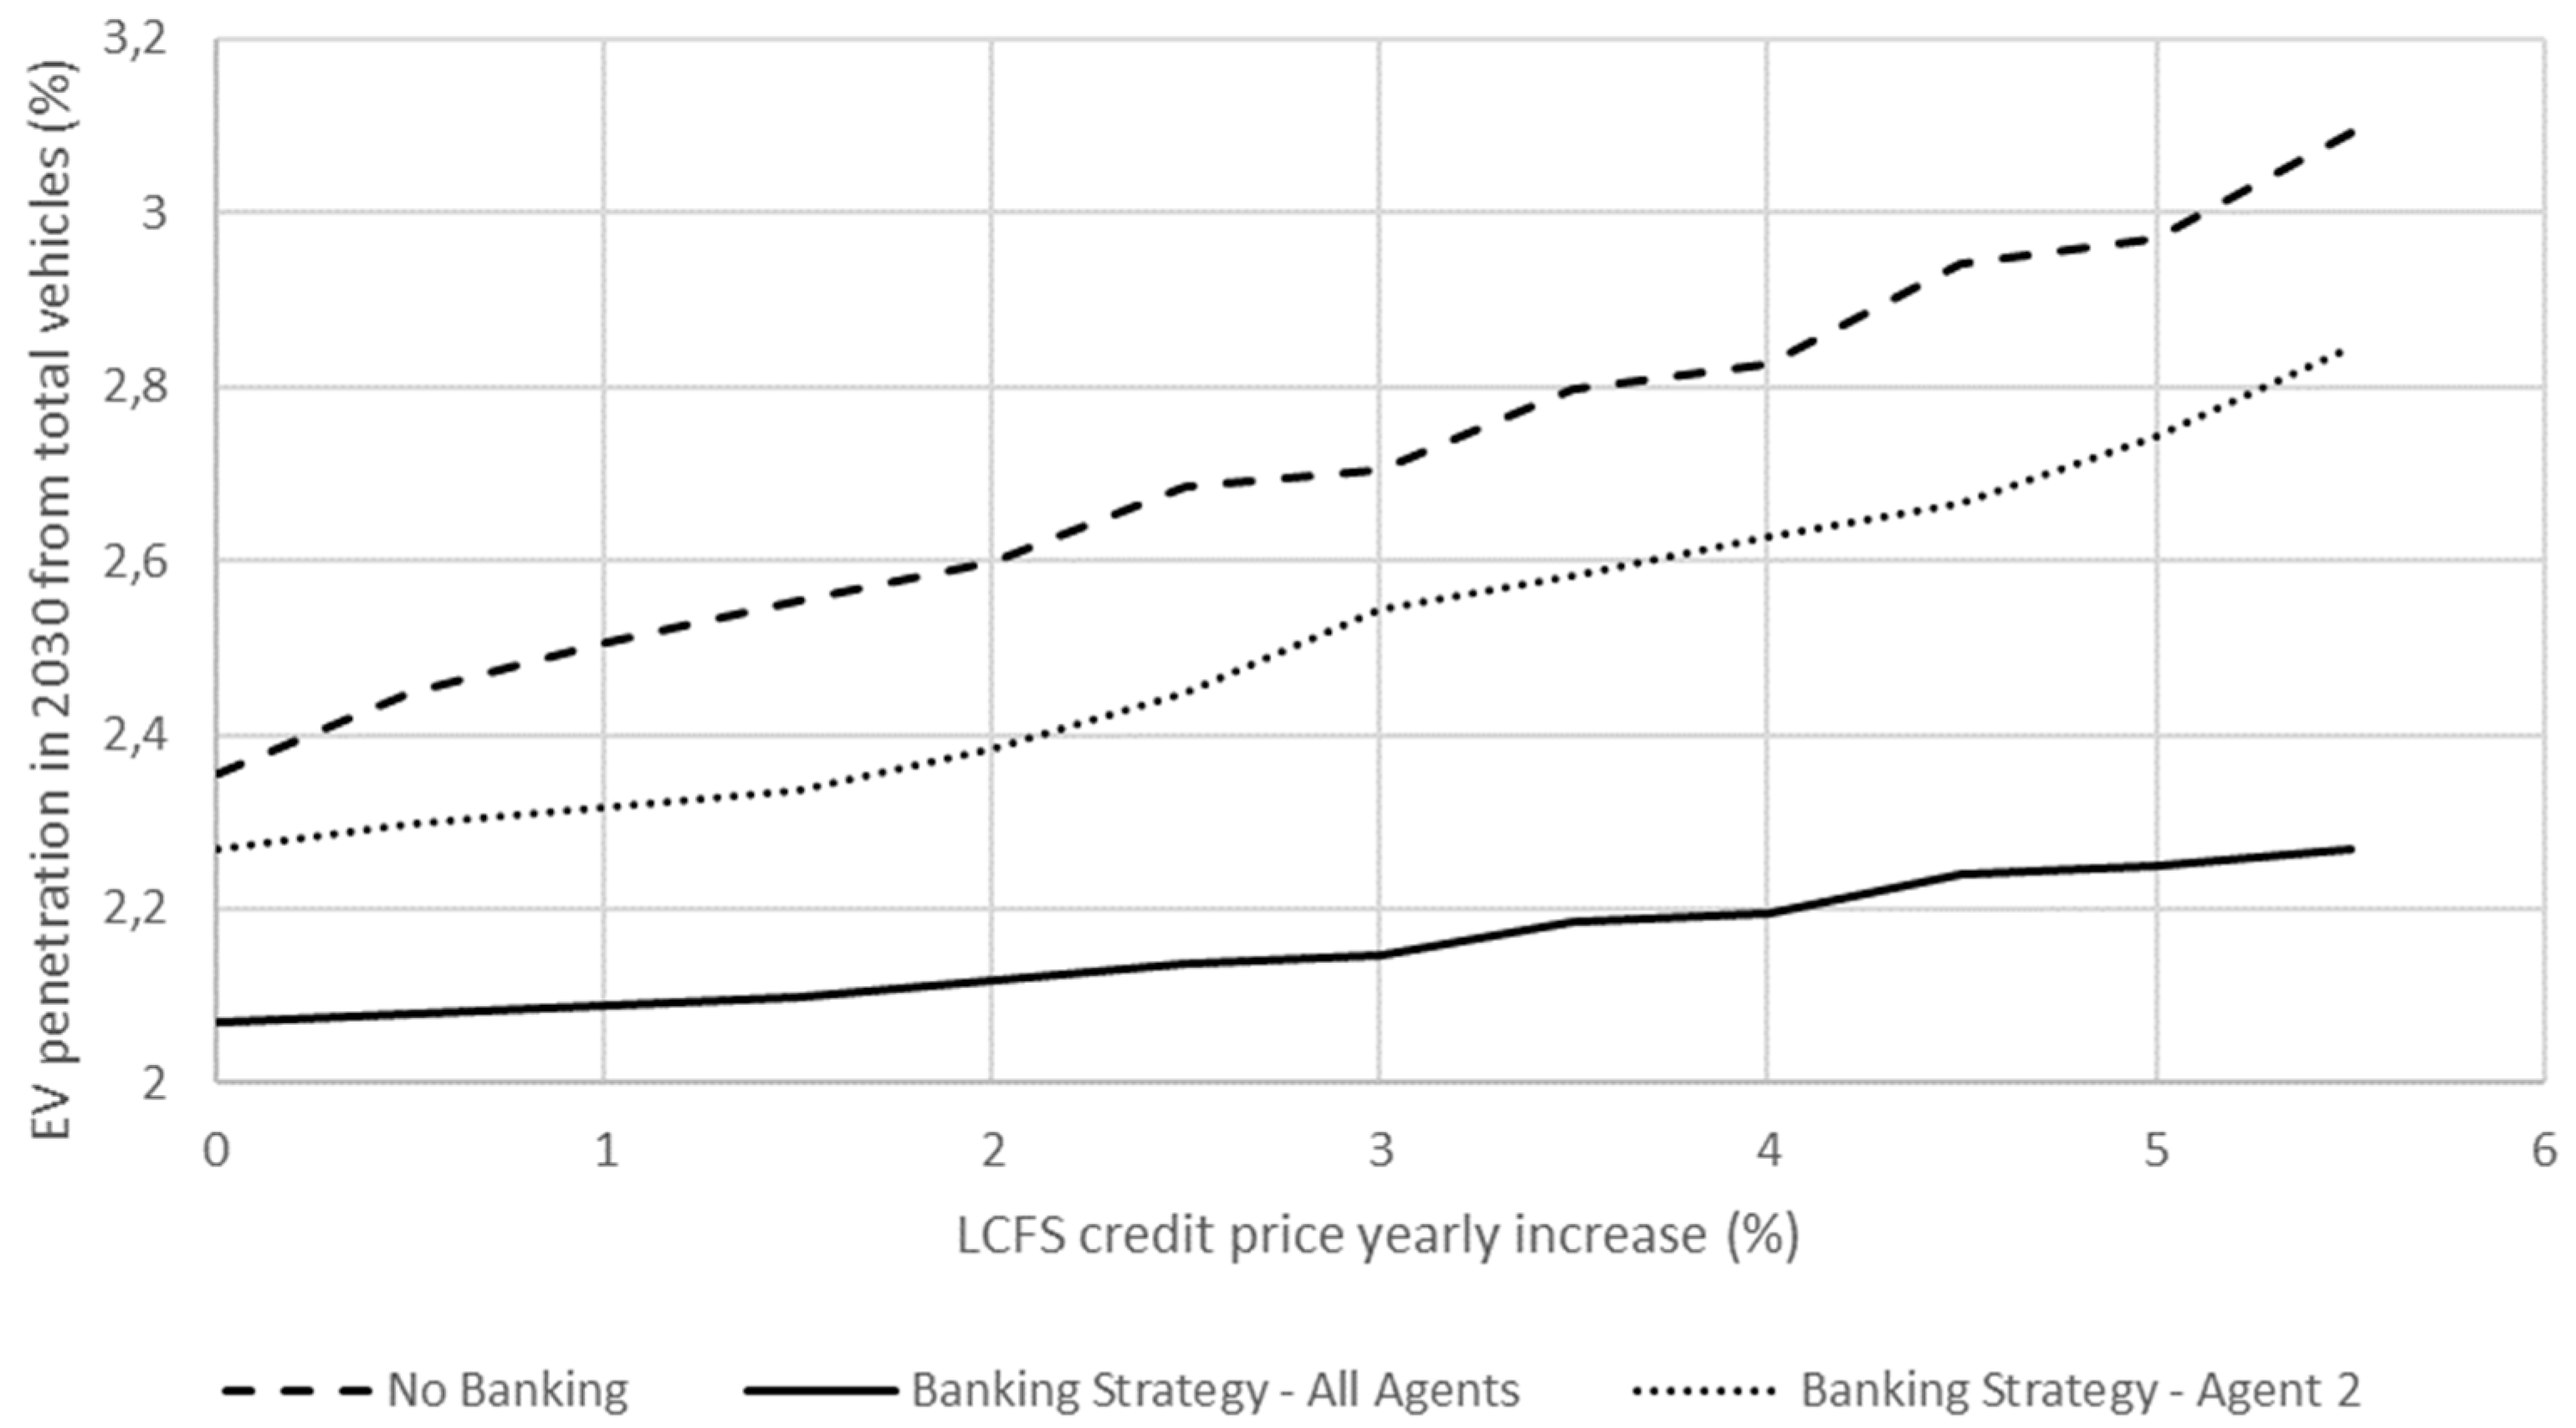
As described above, the regulators in the LCFS program set a maximum price for credits each year. This price will increase each year based on inflation and other economic parameters [34]. As shown in Figure 4, the initial percentage of EVs in each area is between 1% and 2% and the total EV penetration is 1.58%. As shown in Figure 7, the price of credits increases between 0 to 5.5% and the final penetration of EVs (in percent) is depicted.
In the above figure, banking strategy is shown to have a negative influence on EV penetration. This is because the market is not cleared often enough to give enough liquidity of credits to increase EV penetration. The more agents bank their credits, the lower the liquidity reducing the penetration rate of EVs.
In the LCFS market, the agents mainly trade their credits in the ongoing LCFS credit market, which is a forward market with bilateral agreements. As a drawback to EMMEV and in general in LCFS, the Credit Clearance Market happens rarely, since this requires a widespread market (which is not the case in EMMEV) and if that happens more frequently, it will help the credit price competitiveness and more competition among the agents.
Electricity Prices
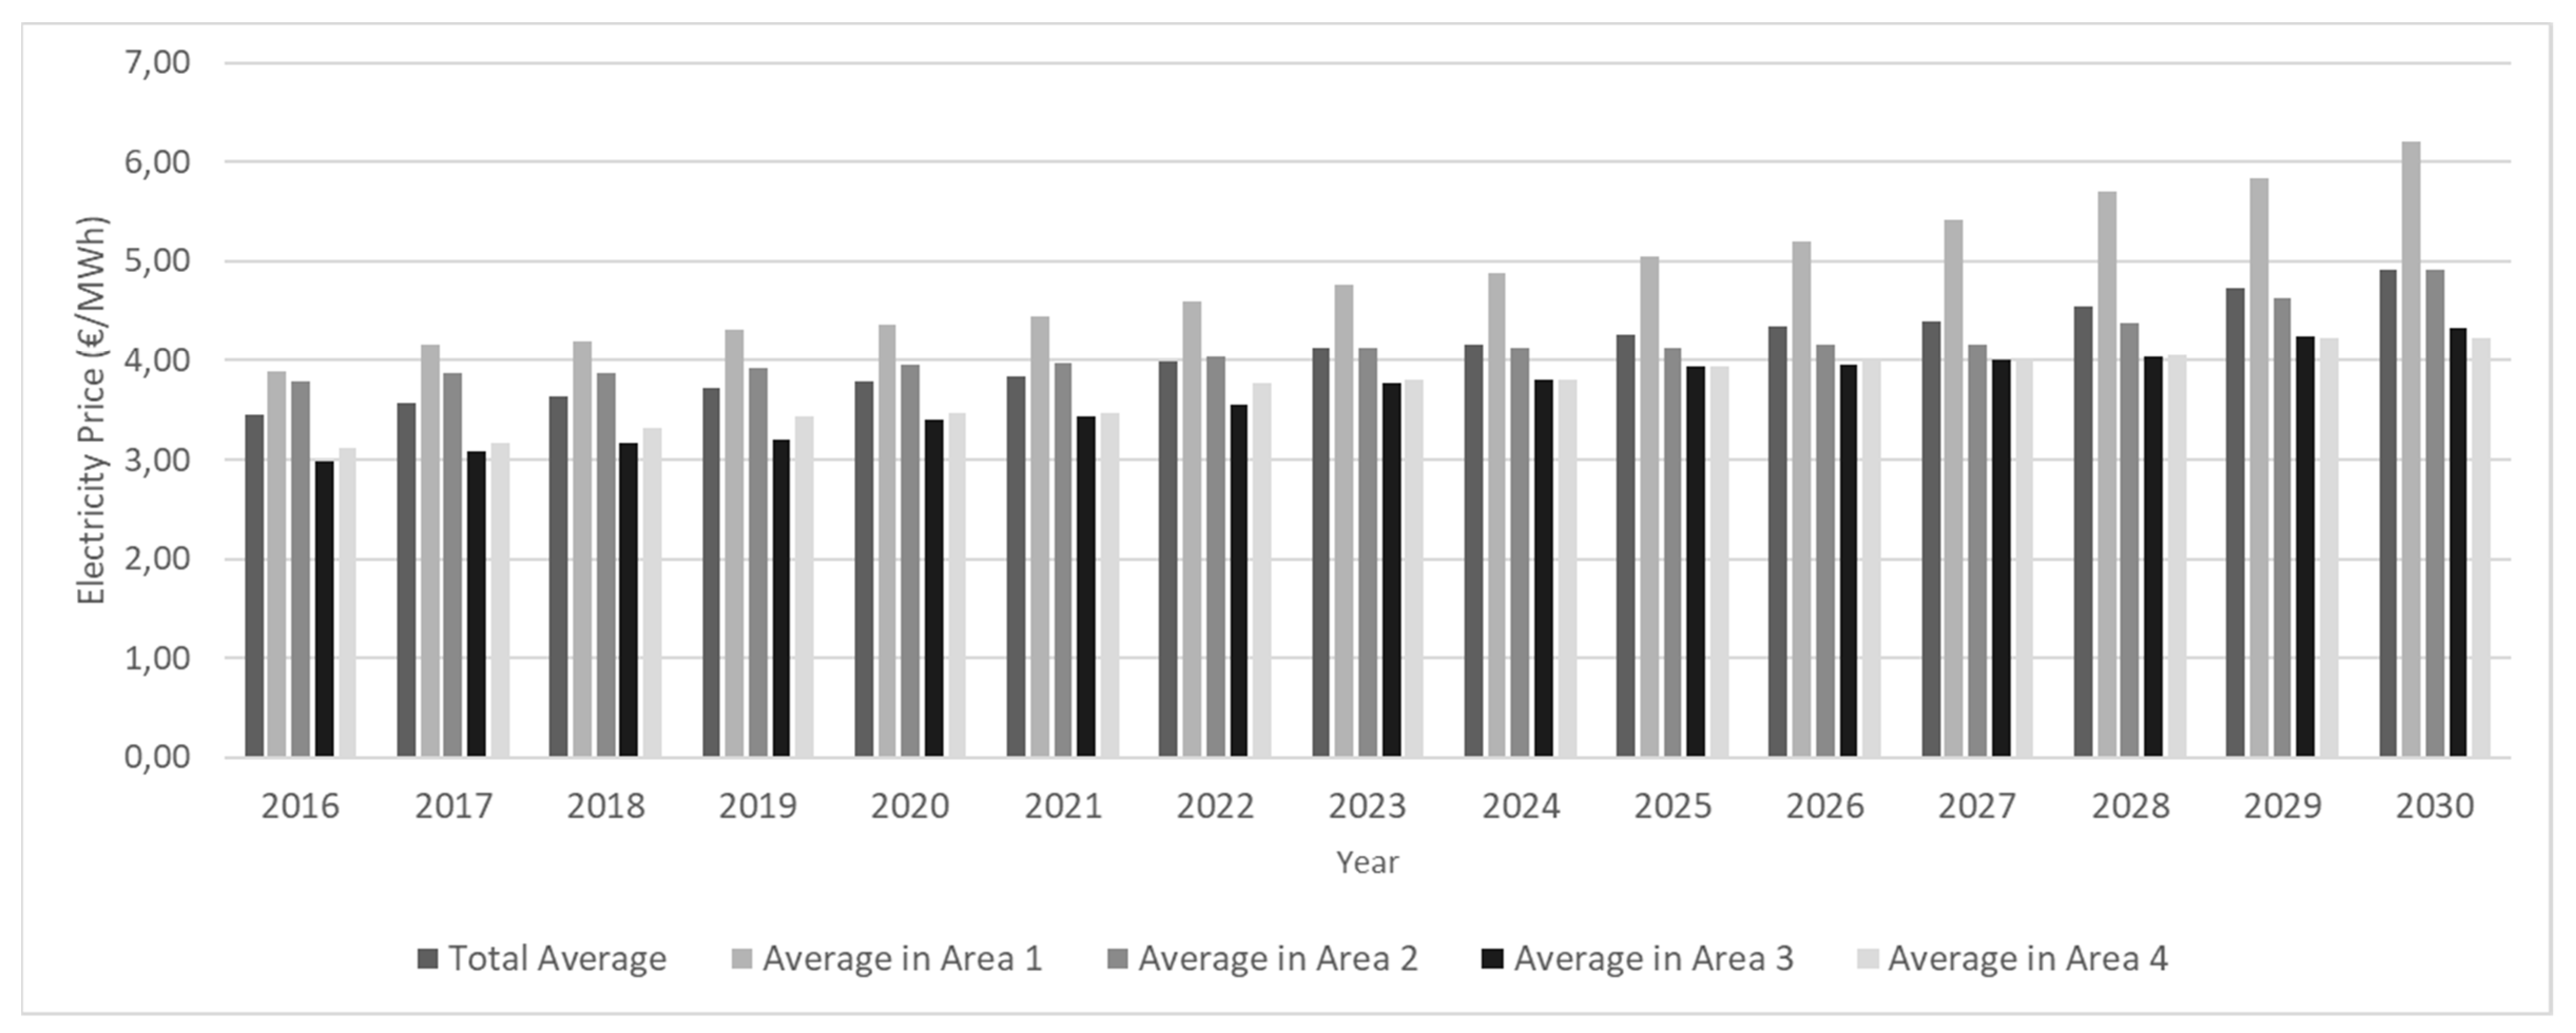
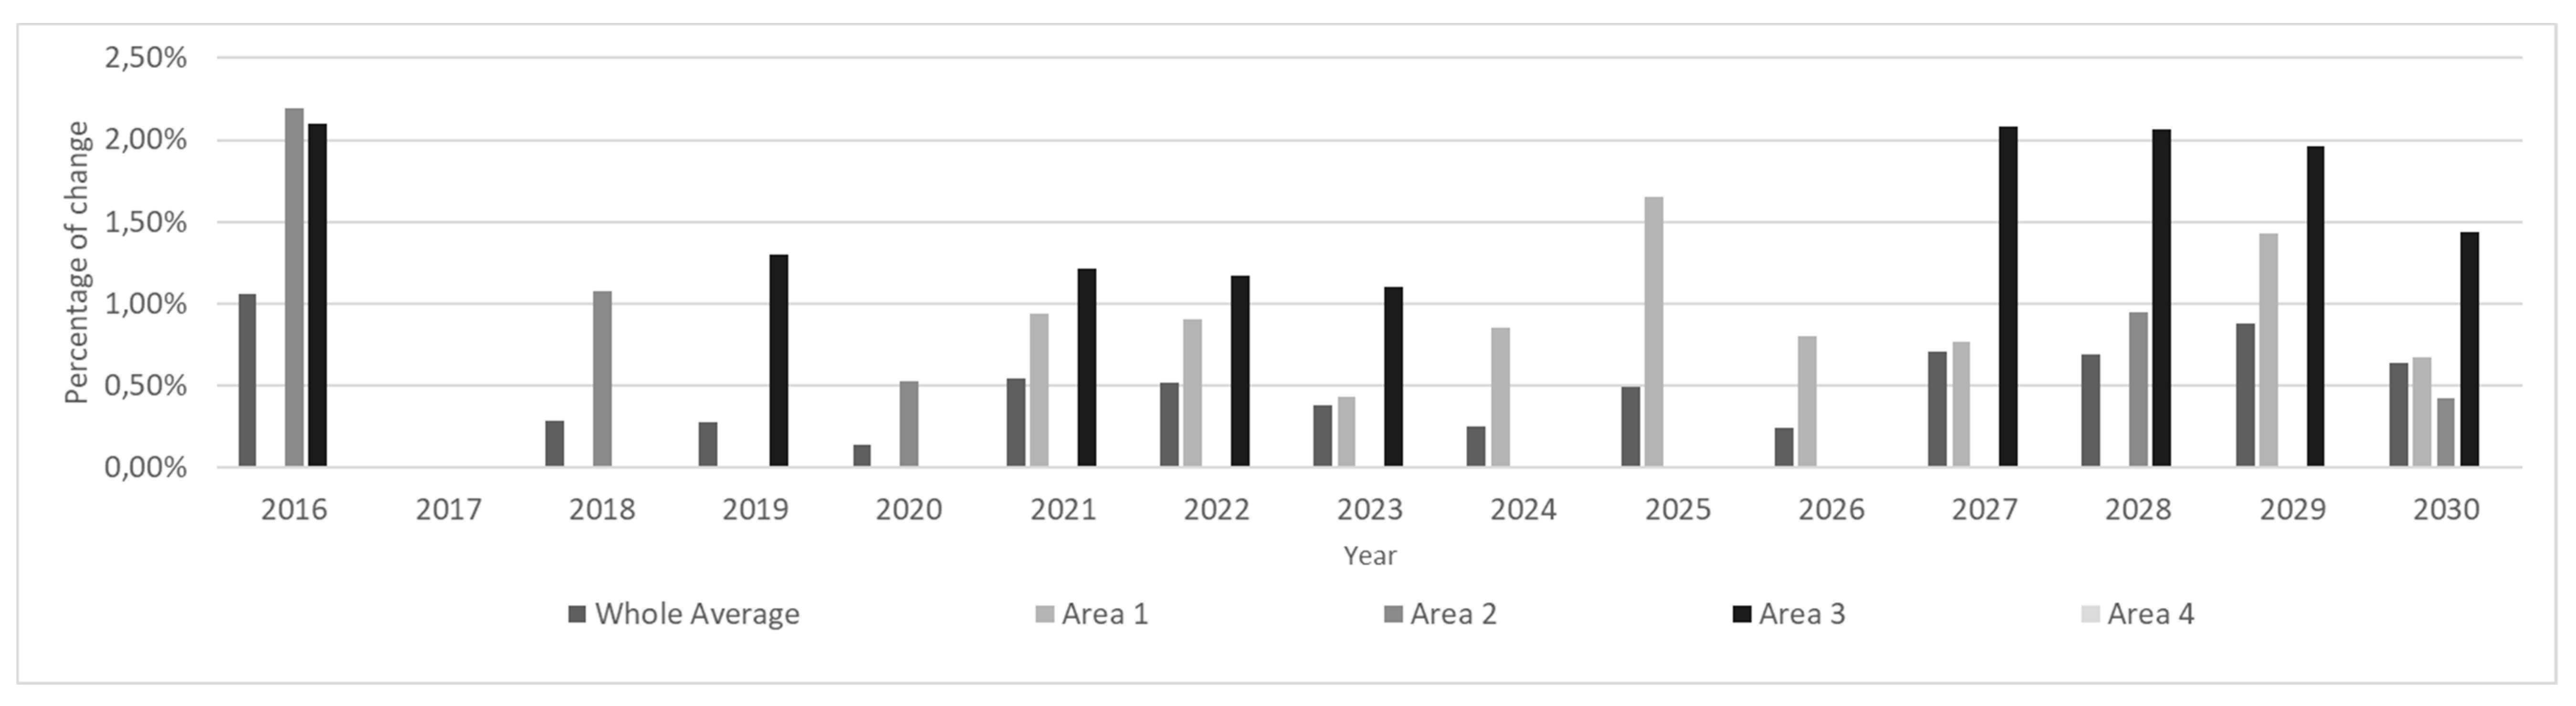
The electricity prices are determined by crossing the electricity demand curve with the electricity supply curve in each area. Electricity prices without any EVs in the system are shown in Figure 8. As it can be seen above, the electricity price in EMMEV increases linearly when the consumption increases. It is assumed that the generation units will keep their capacity during the period that EMMEV is modelled and there is always enough generation for the demand. In Figure 9, the changes in electricity prices as result of the LCFS are shown. The electricity price increases on average by 1–2% per year. In the next figure, the changes of electricity prices as result of the LCFS with agents implementing a banking strategy are shown.
The size of electricity consumption by EVs in comparison to the overall electricity consumption is very low. The electricity price increase is less than 2% in all the areas because of the implementation of the LCFS. In addition, the size of the EV fleet does not change considerably through the implementation of the LCFS.
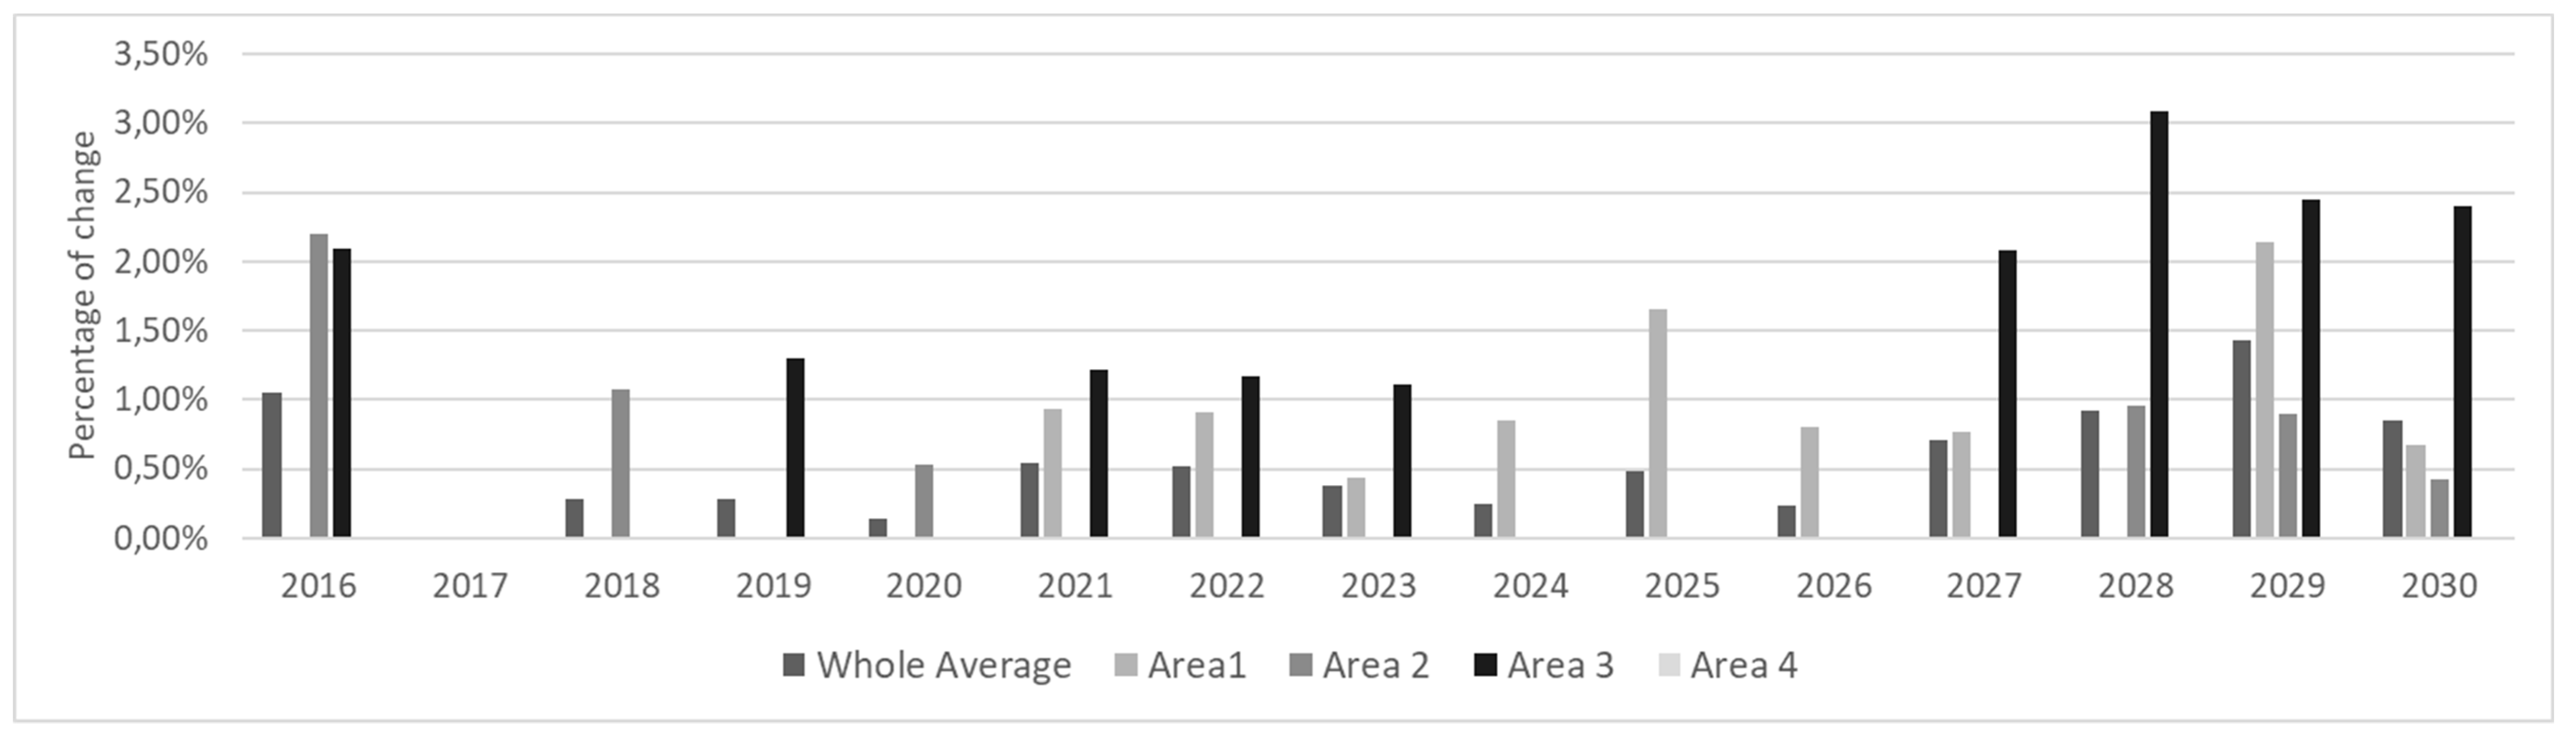
The electricity price changes are dependent on both demand and supply. As the electricity supply function is a step function, an increase in demand can increase or keep the electricity price levelled, as can be seen in Figure 9. The banking strategy has a small negative impact on the number of EVs and, consequently, on electricity prices, as shown in Figure 10. The electricity prices changed more in the banking-strategy case than in the no-banking-strategy case. The percentage of change in electricity price between banking and no-banking strategy is very low. The low share of the total electricity consumption by EVs is the main reason. The average year-to-year change in electricity price is 0.47% in the no-banking case and 0.54% in the banking case.
The sensitivity analysis is described in Table 5.
This sensitivity analysis is performed by running the model by varying a parameter and keeping all other parameters fixed. The sensitivity results (neutral, linear proportional, high, and low) in Table 4 are shown in relative measures to make them comparable with each other. Electricity consumption per person, peak electricity consumption, and share of different types of generation units can influence the penetration of EVs in 2030. On the other hand, the number of LDV (Low Duty Vehicles) per person and share of each type of vehicle can have a large influence on electricity prices.
6. Conclusions
The LCFS is a policy with the aim to promote low-carbon fuels. In this paper, an agent-based model called EMMEV is developed to investigate the influence of the LCFS on the number of EVs and on electricity price.
The effectiveness of this policy is mainly dependent on wide geographical spread, resilience of market liquidity, and price competitiveness. Based on the assumption that agents reinvest the revenue from the LCFS on EV charging infrastructure or other EV-promoting activities, such as incentives, the effect of the LCFS on the adoption of low-carbon vehicles is quite small, as demonstrated in this paper. Consequently, the impact of an increased number of EVs on electricity prices is not considerable.
In EMMEV, it is assumed that the agents only trade in the Ongoing Market, since the regulated parties have contracts in the ongoing LCFS Credit Market and there are no credit shortfalls. It is also assumed an elasticity of each additional station per 100,000 residents would increase its EV market share by 0.12% and the profits from the LCFS are spent in charging infrastructure (although other studies have shown that rebates might be more effective [46]). The results from EMMEV show that the impact of the LCFS on EV penetration is low. It is also indicated that the LCFS is not an effective driver for EV penetration in a small geographical area with low liquidity. The LCFS seems to need large regulated parties to guarantee the resiliency required for market liquidity, since supply and demand are dependent on a larger number of participants.
Market liquidity is one of the important factors for financial stability and real trade activity in the LCFS. Low market liquidity downgrades the efficiency of the market [47] but is also the result of inefficient design of the market. The regulators should follow the market changes every year to target a right level and adapt the supply and demand of credits to ensure trade activities in the market. In case of low market liquidity, the LCFS will be fragile and likely to evaporate in response to shocks. As described above, LCFS can be effective when the market is spread in wide geographical areas to ensure enough credits in the market. The credit prices will also become less unpredictable in case of higher market liquidity. Highly uncertain prices will decrease participation of fuel distributors in the market and will make it hard for investors to make long-term decisions.
The price competitiveness in the LCFS is dependent on more regular Credit Clearing Markets. Bilateral contracts will not give enough confidence to investors to be ensured that they can sell their credits and have credible predictions of the credit price. On the other hand, those agents who have not met their previous year-end obligation can use Credit Clearing Markets to provide additional compliance flexibility. The results from this paper show that the banking strategy of the agents contributing to the LCFS can have a small negative impact on penetration of EVs, unless there is regular Credit Clearance. A regular Credit Clearance can neutralize the effect of banking by providing buyers and sellers flexibility to negotiate mutually beneficial transactions.
From the electricity market perspective, the initial influence of EVs penetration on electricity prices is low. The electricity price in both the banking and no-banking case did change, but very marginally. Even in case of high EV penetration, the influence on electricity price is not considerable [10].
As with many policies, the design and context of implementation of the LCFS will have an influence on its performance. We have shown, in a simplistic model, that in a small market without credit clearance some agents might choose to bank their credits, leading to a lower EV penetration rate than what could otherwise be expected.
The interdependence of transportation policies and the electricity market is increasing due to increasing number of Electric Vehicles while these two historically had low interdependence. This paper both introduced EMMEV and also started the investigation of the impact of LCFS on the electricity market. In the future, EMMEV will be used to investigate the impact of other low-carbon policies on the electricity market.
The LCFS is an efficient policy driver to decrease carbon emissions in transportation in the long term and in wide geographical areas. This can be a good fit on the European Commission level, so each member state, apart from their local policies to decrease emissions in transportation, can contribute to a future green vision for transportation in Europe.
Author Contributions
A.K. conceived and designed the model, EMMEV. He has done coding of the model in Java and development of test system. J.A.P.L. contributed in the development of the conceptual model and M.A.d.R. contributed in development of the codesand definition of the agents. A.K. wrote the paper and the paper is revised and edited by Frances Sprei, associate professor at Chalmers University of Technology, J.A.P.L. and M.A.d.R.
Funding
This research was funded by Ween Energy Aktie Bolag (http://ween.energy/).
Acknowledgments
The authors would like to thank Ween Energy Aktie Bolag (http://ween.energy/) in Sweden for sponsoring this research. The authors would also like to send very special thanks to Frances Sprei, associate professor at Chalmers University of Technology in Gothenburg, Sweden for her contributions in development of the model and writing this paper. In addition, the authors would like to thank Faculty of Engineering University of Porto, MIT Portugal program and Federal University of Santa Catarina (UFSC) for supporting this research.
Conflicts of Interest
The authors declare no conflict of interest.
References
- United Nations Framework Convention on Climate Change. Available online: https://unfccc.int/resource/docs/convkp/conveng.pdf (accessed on 13 July 2018).[Green Version]
- International Energy Agency. Transport, Energy and CO2: Moving Toward Sustainability; Organization for Economic Co-Operation and Development: Paris, France, 2009. [Google Scholar]
- Barker, T.; Bashmakov, I.; Bernstein, L.; Bogner, J.; Bosch, P.; Dave, R.; Davidson, O.; Fisher, B.; Grubb, M.; Gupta, S. Climate Change 2007: Mitigation of Climate Change; Cambridge University Press: Cambridge, UK; New York, NY, USA, 2007. [Google Scholar]
- International Energy Agency. Global EV Outlook 2016—Beyond One Million Electric Cars; Organization for Economic Co-Operation and Development: Paris, France, 2016. [Google Scholar]
- Burleson, E. Paris Agreement and Consensus to Address Climate Challenge. Available online: https://papers.ssrn.com/sol3/papers.cfm?abstract_id=2710076 (accessed on 13 July 2018).
- Eberle, U.; Helmolt, R.V. Sustainable transportation based on electric vehicle concepts: A brief overview. Energy Environ. Sci. 2010, 3, 689–699. [Google Scholar] [CrossRef]
- Fazeli, R.; Leal, V.; Sousa, J.P. A multi-criteria evaluation framework for alternative light-duty vehicles technologies. Int. J. Multicriteria Decis. Mak. 2011, 1, 230–251. [Google Scholar] [CrossRef]
- Overview of CO2-Based Motor Vehicle Taxes in the EU. Available online: https://www.acea.be/publications/article/overview-of-co2-based-motor-vehicle-taxes-in-the-eu (accessed on 13 July 2018).
- Sierzchula, W.; Bakker, S.; Maat, K.; Wee, B.V. The influence of financial incentives and other socio-economic factors on electric vehicle adoption. Energy Policy 2014, 68, 183–194. [Google Scholar] [CrossRef]
- Ahmad, K. Analysis of Integration of Plug-in Hybrid Electric Vehicles in the Distribution Grid. Master’s Thesis, Royal Institute of Technology, Stockholm, Sweden, 2009. [Google Scholar]
- Lopes, J.A.P.; Soares, F.J.; Almeida, P.M.R.; Baptista, P.C.; Silva, C.M.; Farias, T.L. Quantification of technical impacts and environmental benefits of electric vehicles integration on electricity grids. Proceedings of 8th International Symposium on Advanced Electromechanical Motion Systems & Electric Drives Joint Symposium, Lille, France, 1–3 July 2009. [Google Scholar]
- Hadley, S.W.; Tsvetkova, A.A. Potential Impacts of Plug-in Hybrid Electric Vehicles on Regional Power Generation. Electr. J. 2009, 22, 56–68. [Google Scholar] [CrossRef] [Green Version]
- Yeh, S.; Sperling, D.; Griffin, M.; Khanna, M.; Leiby, P.; Msangi, S.; Rhodes, J.; Rubin, J. National Low Carbon Fuel Standard: Policy Design Recommendations. Available online: https://papers.ssrn.com/sol3/papers.cfm?abstract_id=2105897 (accessed on 13 July 2018).
- Farrell, A.E.; Sperling, D. A Low-Carbon Fuel Standard for California, Part 1: Technical Analysis. Available online: https://www.energy.ca.gov/low_carbon_fuel_standard/UC_LCFS_study_Part_1-FINAL.pdf (accessed on 13 July 2018).
- Barouti, M.; Hoang, V.-D.D. Electricity as a Commodity. 2011. Available online: http://www.essectransac.com/wp-content/themes/arthemia/images/2011/04/Electricity-as-a-Commodity-M.Barouti-and-D.Hoang_.pdf (accessed on 13 July 2018).
- Stralen, J.N.P.v.; Uslu, A.; Longa, F.D.; Panoutsou, C. The role of biomass in heat, electricity, and transport markets in the EU27 under different scenarios. Biofuels Bioprod. Biorefin. 2013, 7, 147–163. [Google Scholar] [CrossRef]
- Reimagine Consumer Engagement. Available online: https://www.bidgely.com/ (accessed on 13 July 2018).
- Biggar, D.R.; Hesamzadeh, M.R. The Economics of Electricity Markets; Wiley-IEEE Press: West Sussex, UK, 2014; Available online: http://s1.nonlinear.ir/epublish/book/The_Economics_of_Electricity_Markets_1118775759.pdf (accessed on 13 July 2018).
- Albrecht, M.; Nilsson, M.; Akerman, J. Electrification of Vehicles–Policy Drivers and Impacts in Two Scenarios. 2013. Available online: https://onlinelibrary.wiley.com/doi/abs/10.1002/9781118568040.ch1 (accessed on 13 July 2018).
- Foxon, T.J. Technological and Institutional ‘Lock-in’ as a Barrier to Sustainable Innovation. 2002. Available online: https://www.imperial.ac.uk/media/imperial-college/research-centres-and-groups/icept/7294726.PDF (accessed on 13 July 2018).
- Seto, K.C.; Davis, S.J.; Mitchell, R.B.; Stokes, E.C.; Unruh, G.; Urge-Vorsatz, D. Carbon Lock-In: Types, Causes, and Policy Implications. Annu. Rev. Environ. Resour. 2016, 41, 425–452. [Google Scholar] [CrossRef]
- Greene, D.L.; Patterson, P.D.; Singh, M.; Li, J. Feebates, rebates and gas-guzzler taxes: A study of incentives for increased fuel economy. Energy policy 2005, 33, 757–775. [Google Scholar] [CrossRef]
- Sprei, F.; Bauner, D. Incentives Impact on EV Markets. 2011. Available online: http://docplayer.net/30370495-Incentives-impact-on-ev-markets.html (accessed on 13 July 2018).
- Mersky, A.C.; Sprei, F.; Samaras, C.; Qian, Z. Effectiveness of incentives on electric vehicle adoption in Norway. Transp. Res. Part D Transp. Environ. 2016, 46, 56–68. [Google Scholar] [CrossRef] [Green Version]
- Lade, G.E.; Lawell, C.-Y.C.L. The design and economics of low carbon fuel standards. Res. Transp. Econ. 2015, 52, 91–99. [Google Scholar] [CrossRef] [Green Version]
- Yeh, S.; Witcover, J. Status Review of California’s Low Carbon Fuel Standard. 2013. Available online: http://clean-economy.org/wp-content/uploads/2014/01/LCFS-Status-Review-Jan-2014-UCD-ITS-RR-14-01R.pdf (accessed on 13 July 2018).
- Yeh, S.; Witcover, J. Status Review of California’s Low Carbon Fuel Standard. 2014. Available online: https://merritt.cdlib.org/d/ark:%252F13030%252Fm59g721x/1/producer%252F893141744.pdf (accessed on 13 July 2018).
- Berry, T.; Jaccard, M. The renewable portfolio standard: Design considerations and an implementation survey. Energy Policy 2001, 29, 263–277. [Google Scholar] [CrossRef]
- Fagiani, R.; Barquín, J.; Hakvoort, R. Risk-based assessment of the cost-efficiency and the effectivity of renewable energy support schemes: Certificate markets versus feed-in tariffs. Energy Policy 2013, 55, 648–661. [Google Scholar] [CrossRef]
- Tudor, G.G. The Norway-Sweden Certificate Market in Renewable Electricity: A Model for the European Union. 2012. Available online: https://heinonline.org/HOL/LandingPage?handle=hein.journals/texjogel7&div=13&id=&page= (accessed on 13 July 2018).
- Swedish Energy Agency. Available online: https://www.iea.org/policiesandmeasures/pams/sweden/name-21727-en.php (accessed on 13 July 2018).
- Low Carbon Fuel Standard. Available online: https://www.arb.ca.gov/fuels/lcfs/lcfs.htm (accessed on 13 July 2018).
- Clean Fuels Program 2017 Rulemaking. 2016. Available online: https://www.oregon.gov/deq/Rulemaking%20Docs/CFP2017meet1sum.pdf (accessed on 13 July 2018).
- Low Carbon Fuel Standard—Final Regulation Order. 2012. Available online: https://www.arb.ca.gov/regact/2015/lcfs2015/lcfsfinalregorder.pdf (accessed on 13 July 2018).
- Low Carbon Fuel Standard Regulatory Guidance 16-04. 2016. Available online: https://www.arb.ca.gov/fuels/lcfs/guidance/regguidance_16-04.pdf (accessed on 13 July 2018).
- Green, R. The electricity contract market in England and Wales. J. Ind. Econ. 1999, 47, 107–124. [Google Scholar] [CrossRef]
- Morrison, F. The Art of Modeling Dynamic Systems: Forecasting for Chaos, Randomness and Determinism; Dover Publications: New York, NY, USA, 2008. [Google Scholar]
- Benth, F.E.; Benth, J.S.; Koekebakker, S. Stochastic Modelling of Electricity and Related Markets; World Scientific: Singapore, 2008. [Google Scholar]
- Parsons, S.; Wooldridge, M. Game Theory and Decision Theory in Multi-Agent Systems. Auton. Agents Multi-Agent Syst. 2002, 5, 243–254. [Google Scholar] [CrossRef]
- Ringler, P.; Keles, D.; Fichtner, W. Agent-based modelling and simulation of smart electricity grids and markets–A literature review. Renew. Sustain. Energy Rev. 2016, 57, 205–215. [Google Scholar] [CrossRef]
- McArthur, S.D.J.; Davidson, E.M.; Catterson, V.M.; Dimeas, A.L.; Hatziargyriou, N.D.; Ponci, F.; Funabashi, T. Multi-Agent Systems for Power Engineering Applications; Part I: Concepts, Approaches, and Technical Challenges. IEEE Trans. Power Syst. 2007, 22, 1743–1752. [Google Scholar] [CrossRef] [Green Version]
- Wooldridge, M. An Introduction to MultiAgent Systems, 2nd ed.; John Wiley & Sons: Glascow, UK, 2009. [Google Scholar]
- Collier, N.; North, M. Repast Java Getting Started. 2012. Available online: https://repast.github.io/docs/RepastJavaGettingStarted.pdf (accessed on 13 July 2018).
- Suguri, H. A standardization effort for agent technologies: The foundation for intelligent physical agents and its activities. In Proceedings of the 32nd Annual Hawaii International Conference on Systems Sciences, Maui, HI, USA, 5–8 January 1999. [Google Scholar]
- Karnama, A.; Resende, F.O.; Lopes, J.A.P. Optimal Management of Battery Charging of Electric Vehicles: A New Microgrid Feature. In Proceedings of the 2011 IEEE Trondheim PowerTech, Trondheim, Norway, 19–23 June 2011. [Google Scholar]
- Axsen, J.; Kurani, K.S. Hybrid, plug-in hybrid, or electric—What do car buyers want? Energy Policy 2013, 61, 532–543. [Google Scholar] [CrossRef]
- Christensen, A.; Hobbs, B. A model of state and federal biofuel policy: Feasibility assessment of the California Low Carbon Fuel Standard. Appl. Energy 2016, 169, 799–812. [Google Scholar] [CrossRef] [Green Version]
Figure 1.
Agents interaction for generation in electricity market (only black text is relevant for this figure).
Figure 1.
Agents interaction for generation in electricity market (only black text is relevant for this figure).

Figure 2.
Agents interaction for retailing in electricity market.

Figure 3.
Agents interaction in LCFS.

Figure 4.
The test system structure LDV: Light Duty Vehicle.

Figure 5.
Load in 4 different areas.

Figure 6.
EMMEV process.

Figure 7.
Impact of LCFS credit prices increase on EV penetration.

Figure 8.
Average electricity prices in four areas and average in all areas from 2016 to 2030.

Figure 9.
Changes of electricity prices (%) with EVs and LCFS (no banking).

Figure 10.
Change in electricity price (%) with EVs and LCFS (with banking).


Table 1.
Comparison of LCFS and Renewables Certificate Market.
| Market | Main Goal | Players | Certificate Receivers | Quota Obligation |
|---|---|---|---|---|
| RCM | Promote renewable electricity generation | Electricity generation units and large electricity consumers and electricity retailers | One certificate for each MWh of electricity generated from renewable resources | One quota obligation for some percentage of electricity consumption |
| LCFS | Promote low-carbon transportation fuels | Energy providers for transportation | One credit for CI reduction below decreasing annual targets | One credit for sales of fuel with higher CI than LCFS annual target |
Table 2.
Description of the parameters in the test system.
| About Parameters | General (G) | Electricity Consumption (EC) | Electricity Generation (EG) | Mobility (M) | |||||
|---|---|---|---|---|---|---|---|---|---|
| Parameter ID | G1 | G2 | EC1 | EC2 | EC3 | EG1 | EG2 | M1 | M2 |
| Parameter description | Number of countries in the electricity market | Population in each country | Electricity consumption per person | Peak electricity consumption | Load patterns | Power generation capacity | Share of different type of generation | Number of LDV per person | Share of each type of vehicle |
| Assumption | √ | √ | √ | - | - | √ 1 | √ | √ | - |
| Based on a reference | - | - | - | - | √ [10] | - | - | - | - |
| Derived from another parameter(s) | - | - | - | √ (G2, EC1) | - | √ (EC2, EC3) | - | - | √ (M1) |
1 It is assumed that there is always enough extra generation. Therefore, the case of infinite electricity price is impossible to happen in this model. √: Valid point for the parameter.
Table 3.
Agents in the test system.
| Agent Number | Generation Unit (MW) | Share of Electric Vehicles Serviced by Each Agent (%) |
|---|---|---|
| 1 | 7300 | 26 |
| 2 | 17,600 | 24 |
| 3 | 8100 | 21 |
| 4 | 12,600 | 4 |
| 5 | 5900 | 26 |
Table 4.
Fuel alternatives in the test system.
| Fuel Type | gCO2/MJ | EER | Primary Fuel Share |
|---|---|---|---|
| Electricity | 20 | 3.4 | 1.58 |
| Biofuel | 40 | 1 | 18.65 |
| Diesel/Gasoline | 98 | 1 | 79.77 |
Table 5.
Sensitivity analysis of variables.
| Parameter | Number of Countries in the Electricity Market | Population in Each Country | Electricity Consumption per Person | Peak Electricity Consumption | Load Patterns | Power Generation Capacity | Share of Different Type of Generation | Number of LDV Per Person | Share of Each Type of Vehicle |
|---|---|---|---|---|---|---|---|---|---|
| Sensitivity of EV penetration in 2030 in relation to | Neutral | Linear proportional | Neutral | Low | Low | Low | Low | High | High |
| Sensitivity of electricity price in relation to | Neutral | Linear proportional | High | High | Depends on the pattern | High | High | Neutral | High |
© 2018 by the authors. Licensee MDPI, Basel, Switzerland. This article is an open access article distributed under the terms and conditions of the Creative Commons Attribution (CC BY) license (http://creativecommons.org/licenses/by/4.0/).
Share and Cite
MDPI and ACS Style
Karnama, A.; Peças Lopes, J.A.; Augusto da Rosa, M. Impacts of Low-Carbon Fuel Standards in Transportation on the Electricity Market. Energies 2018, 11, 1943. https://doi.org/10.3390/en11081943
AMA Style
Karnama A, Peças Lopes JA, Augusto da Rosa M. Impacts of Low-Carbon Fuel Standards in Transportation on the Electricity Market. Energies. 2018; 11(8):1943. https://doi.org/10.3390/en11081943
Chicago/Turabian StyleKarnama, Ahmad, João Abel Peças Lopes, and Mauro Augusto da Rosa. 2018. "Impacts of Low-Carbon Fuel Standards in Transportation on the Electricity Market" Energies 11, no. 8: 1943. https://doi.org/10.3390/en11081943
Note that from the first issue of 2016, this journal uses article numbers instead of page numbers. See further details here.