Article

Baltic Power Systems’ Integration into the EU Market Coupling under Different Desynchronization Schemes: A Comparative Market Analysis

1
Department of Energy, Politecnico di Torino, 10129 Turin, Italy
2
European Commission, JRC—Directorate C Energy, Transport and Climate, Petten 1755ZG, The Netherlands
*
Author to whom correspondence should be addressed.
Energies 2018, 11(8), 1945; https://doi.org/10.3390/en11081945
Submission received: 6 July 2018 / Revised: 20 July 2018 / Accepted: 24 July 2018 / Published: 26 July 2018

Abstract

:
Currently, the power transmission system of the Baltic states is synchronized with the Integrated/Unified Power System (IPS/UPS), which includes the Russian grid, and the IPS/UPS provides frequency regulation and system security within the Baltic states. Since joining the European Union (EU) in 2004, the Baltic states have been following the EU’s energy policy targets. The Baltics are presently participating in a European electricity market, i.e., the NordPool market, while they are expected to join the pan-European electricity market—the European target model for power market integration. Moreover, from a power grid perspective, EU energy policies intend to desynchronize the power grid of the Baltic states from the IPS/UPS over the coming years. This paper evaluates these policy trends through market impacts, and it complements existing studies on Baltic-IPS/UPS desynchronization in terms of wholesale electricity prices, generation surpluses, primary reserve adequacy, and redispatch costs. Participation of the Baltic states in the integrated pan-European day-ahead electricity market with zonal pricing was modeled for 2030, followed by a national redispatch, with detailed power grid modeling of Baltic states to solve potential intrazonal congestion. The simulation results imply the superiority of the Baltics’ synchronization to continental Europe, compared to the other schemes.

1. Introduction

The power system in the Baltic states is currently synchronized with the Integrated/Unified Power System (IPS/UPS), including the power grids of Russia and Belarus, through 330 kV high voltage alternating current (HVAC) transmission lines [1]. The power system of three Baltic states (Estonia, Latvia, and Lithuania), along with Russia and Belarus, form the Soviet-designed BRELL (Belarus, Russia, Estonia, Latvia, and Lithuania) power ring [2]. As the world’s most geographically extended power system, the IPS/UPS ensures the required primary reserve and system security within the BRELL. Besides the HVAC cross-border interconnections with the IPS/UPS, the Baltic states are also interconnected to Finland, Sweden, and Poland though high voltage direct current (HVDC). Two HVDC cables—Estlink 1 and Estlink 2—connect Estonia to Finland with 350 MW and 650 MW capacities, respectively. Lithuania is connected to Sweden through Nordbalt link, with a 700 MW capacity, while the 500 MW Litpol link1 connects Lithuania to Poland [3]. A Litpol link2, with 500 MW capacity, is also planned to be constructed by 2025, increasing the asynchronous interconnection capacity between Lithuania and Poland to 1000 MW [3].
Following the Baltic integration into the European Union in 2004 and deregulation of the Baltic power markets, the three Baltic States joined NordPool between 2010 and 2013 [4]. Generally, Baltic power systems have been in a transition phase between East and West interconnections in the last decade, attracting significant attention [5,6,7].
As members of the EU, the Baltic states have to follow EU energy policies and targets. One of the principal EU policies in the electricity area is to integrate electricity markets throughout Europe in order to decrease electricity prices and increase power system security [8]. Under a Europe-wide electricity market integration, electricity will be more efficiently allocated across the EU, and the market power of the market participants will be eliminated. However, substantial market design changes are required to harmonize market rules before integration. Furthermore, there is a growing need for more interconnection capacity and policy implication to ensure remuneration of the investment costs on the interconnections [8]. The recent trend towards establishing an integrated European electricity market shows the necessity of improving power grid connections between the Baltics and the European countries [9]. The planned integrated European electricity market, aggregating power markets of European countries, will be based on the zonal pricing model (as it is currently performed in Europe), which ignores intrazonal transmission constraints, while it represents interzonal flow limits (between countries) [10]. Therefore, regional transmission system operators (TSOs) need to ensure a sound operation of an integrated European market, with respect to internal network constraints, providing that a proper congestion management approach is required to solve potential intrazonal congestions. Moreover, for the full integration of Baltics’ electricity system into the EU power market, desynchronization from the IPS/UPS and synchronization with the power systems of the Union is required by EU energy policy [9]. From the Baltic states’ energy policy side, desynchronization from Russia is one of the fundamental issues for pursuing energy independency targets.
In the available literature [6,11], three scenarios after Baltics-IPS/UPS desynchronization are proposed: (1) synchronous operation of power systems of the Baltic states and the Continental Europe Network (CEN), (2) synchronous operation of Baltic states and Nordic countries, and (3) autonomous synchronous operation of the Baltic states. As reported in [6], in addition to the investments needed in each of the prospective synchronization schemes in terms of required network reinforcement, also the provision of the primary reserve, presently provided by Russia, must be implemented, either directly inside the Baltics or with the support of the synchronized European countries. Currently, Scenario 1—Baltics/CEN synchronization—is identified as the best option from a technical point of view, with the minimum required investment cost [6].
This paper complements the three Baltics-IPS/UPS desynchronization scenarios with new results in generation surplus, electricity wholesale prices, and congestion management costs. The three scenarios were analyzed under the pan-European electricity market (including the Baltics) following the desynchronization from the IPS/UPS and under possible alternative schemes for the interconnections with the EU network. Primary reserve in the Baltic states is considered a shared service to be provided regionally through all the countries in the corresponding synchronous area. The share of each Baltic country under different desynchronization schemes is assigned according to the current regulations in Nordic and Continental Europe synchronous areas. Baltic states, along with the other 31 European countries, are modeled in the day-ahead integrated electricity market through the zonal pricing approach. In the zonal pricing approach, a “bidding zone” is defined as the largest geographical area within which market participants are able to exchange energy without capacity allocation [12]. In this paper, 34 European countries are modeled as one bidding zone per country comprising Austria, Belgium, Bosnia and Herzegovina, Bulgaria, Croatia, Cyprus, Czech Republic, Denmark, Estonia, Finland, France, former Yugoslav Republic of Macedonia, Germany, Great Britain, Greece, Hungary, Ireland (and North Ireland as separated region), Italy, Latvia, Lithuania, Luxembourg, Montenegro, Netherlands, Norway, Poland, Portugal, Romania, Serbia, Slovakia, Slovenia, Spain, Sweden, and Switzerland. Following the day-ahead market-clearing, power flow is run by each Baltic TSO, based on the day-ahead generation schedules, cross-border power exchanges, and internal network constraints with respect to the detailed network model of the Baltic states, developed in previous studies [5]. Intrazonal congestions are managed through a market-based redispatch approach. Therefore, we implemented two sequential market models as:
  • A European integrated day-ahead market model with an interzonal congestion management approach (34 European countries modeled as one node)
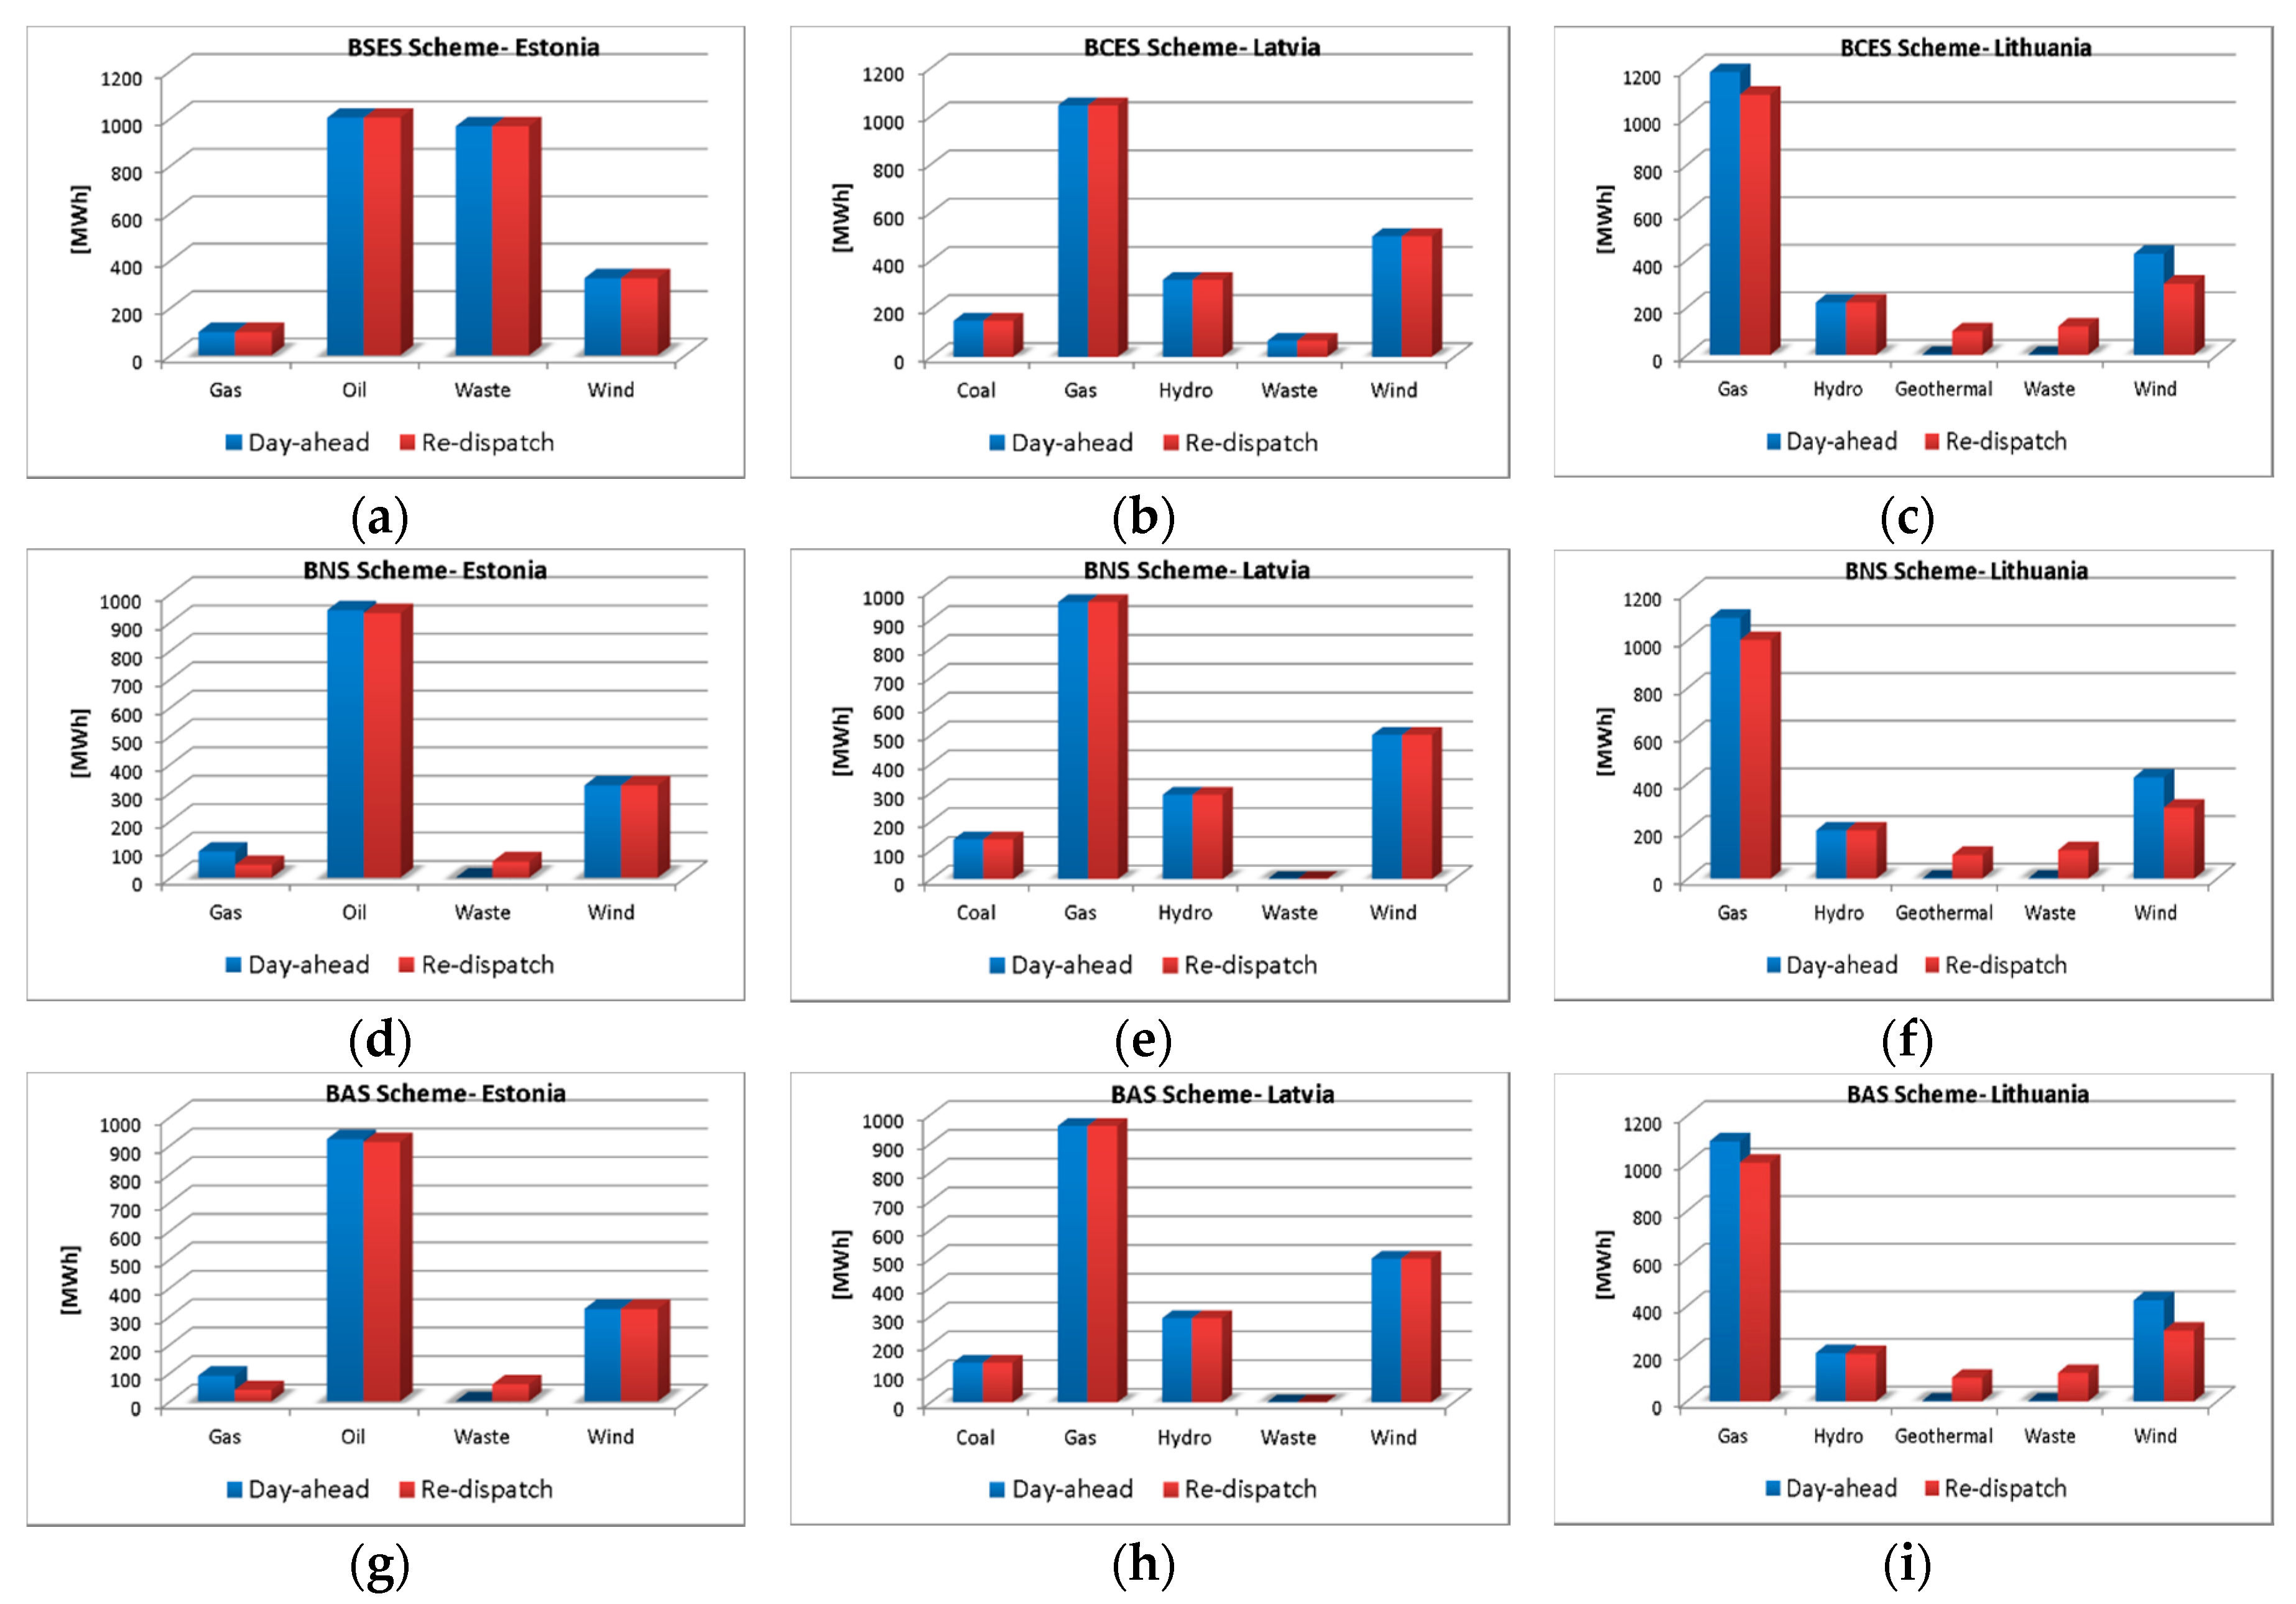
  • A regional redispatch market model with an intrazonal congestion management approach (a detailed power grid model of the Baltic states).
The paper is structured as follows. Section 2 introduces the considered desynchronization scenarios for the Baltic states and corresponding primary frequency control schemes. Day-ahead market-clearing and the congestion management scheme in the Baltic states is described in Section 3. Section 4 summarizes the modeling assumptions, and Section 5 provides a comparative analysis in terms of market performance and desynchronization scenarios, providing summer and winter peak results for 2030. Finally, in Section 6, conclusions are drawn and an outlook on future research is provided.

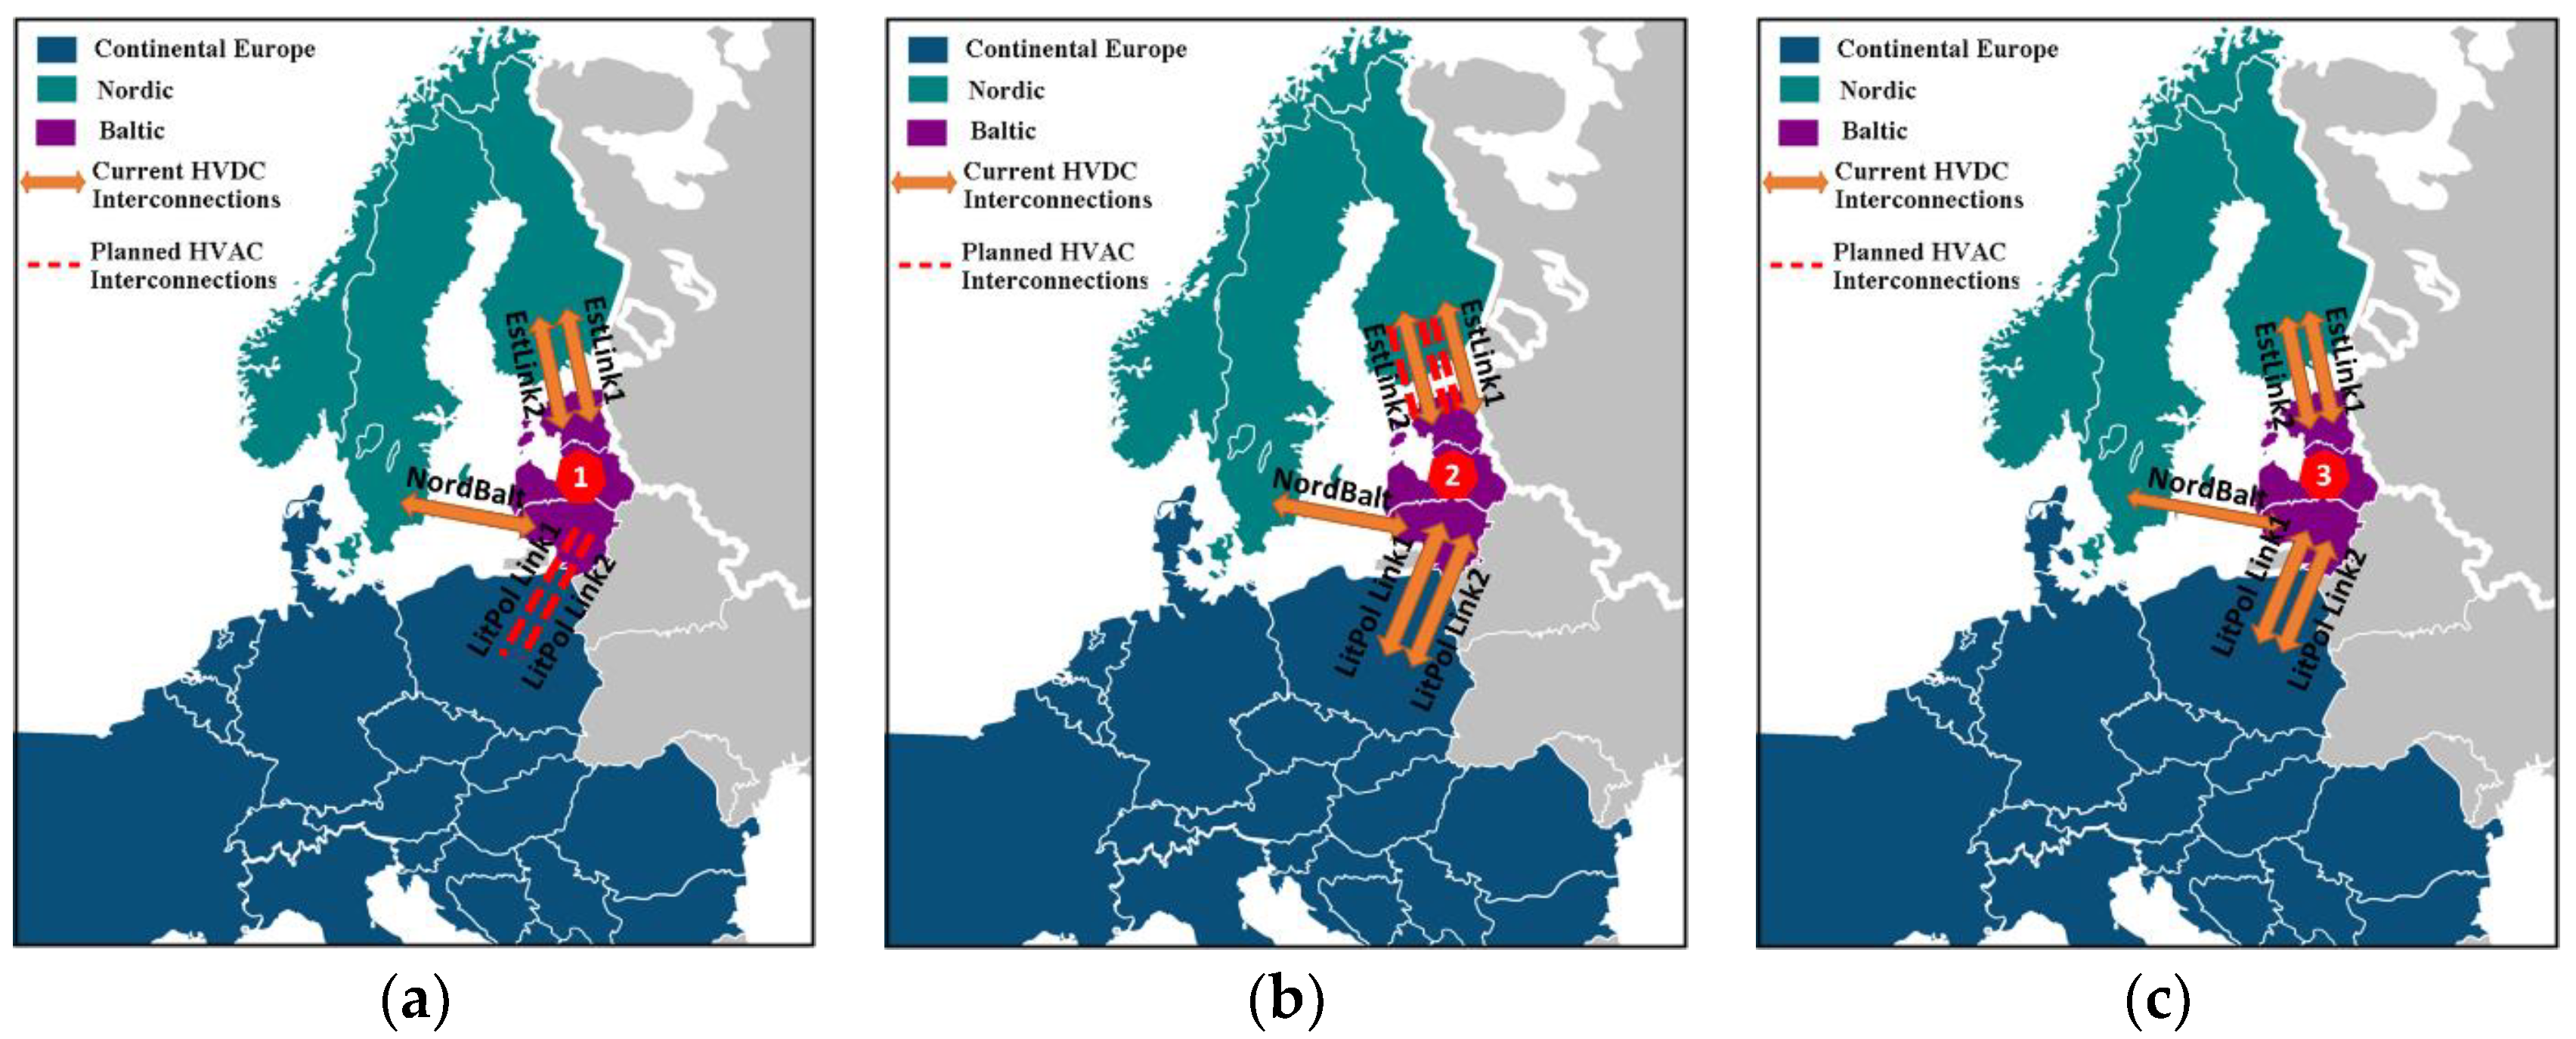
2. Desynchronization Schemes for the Baltic States and Corresponding Primary Frequency Regulations

We consider, based on [6,11], three cross-border interconnection schemes after desynchronization of the Baltic power system from IPS/UPS by 2030 (Figure 1):
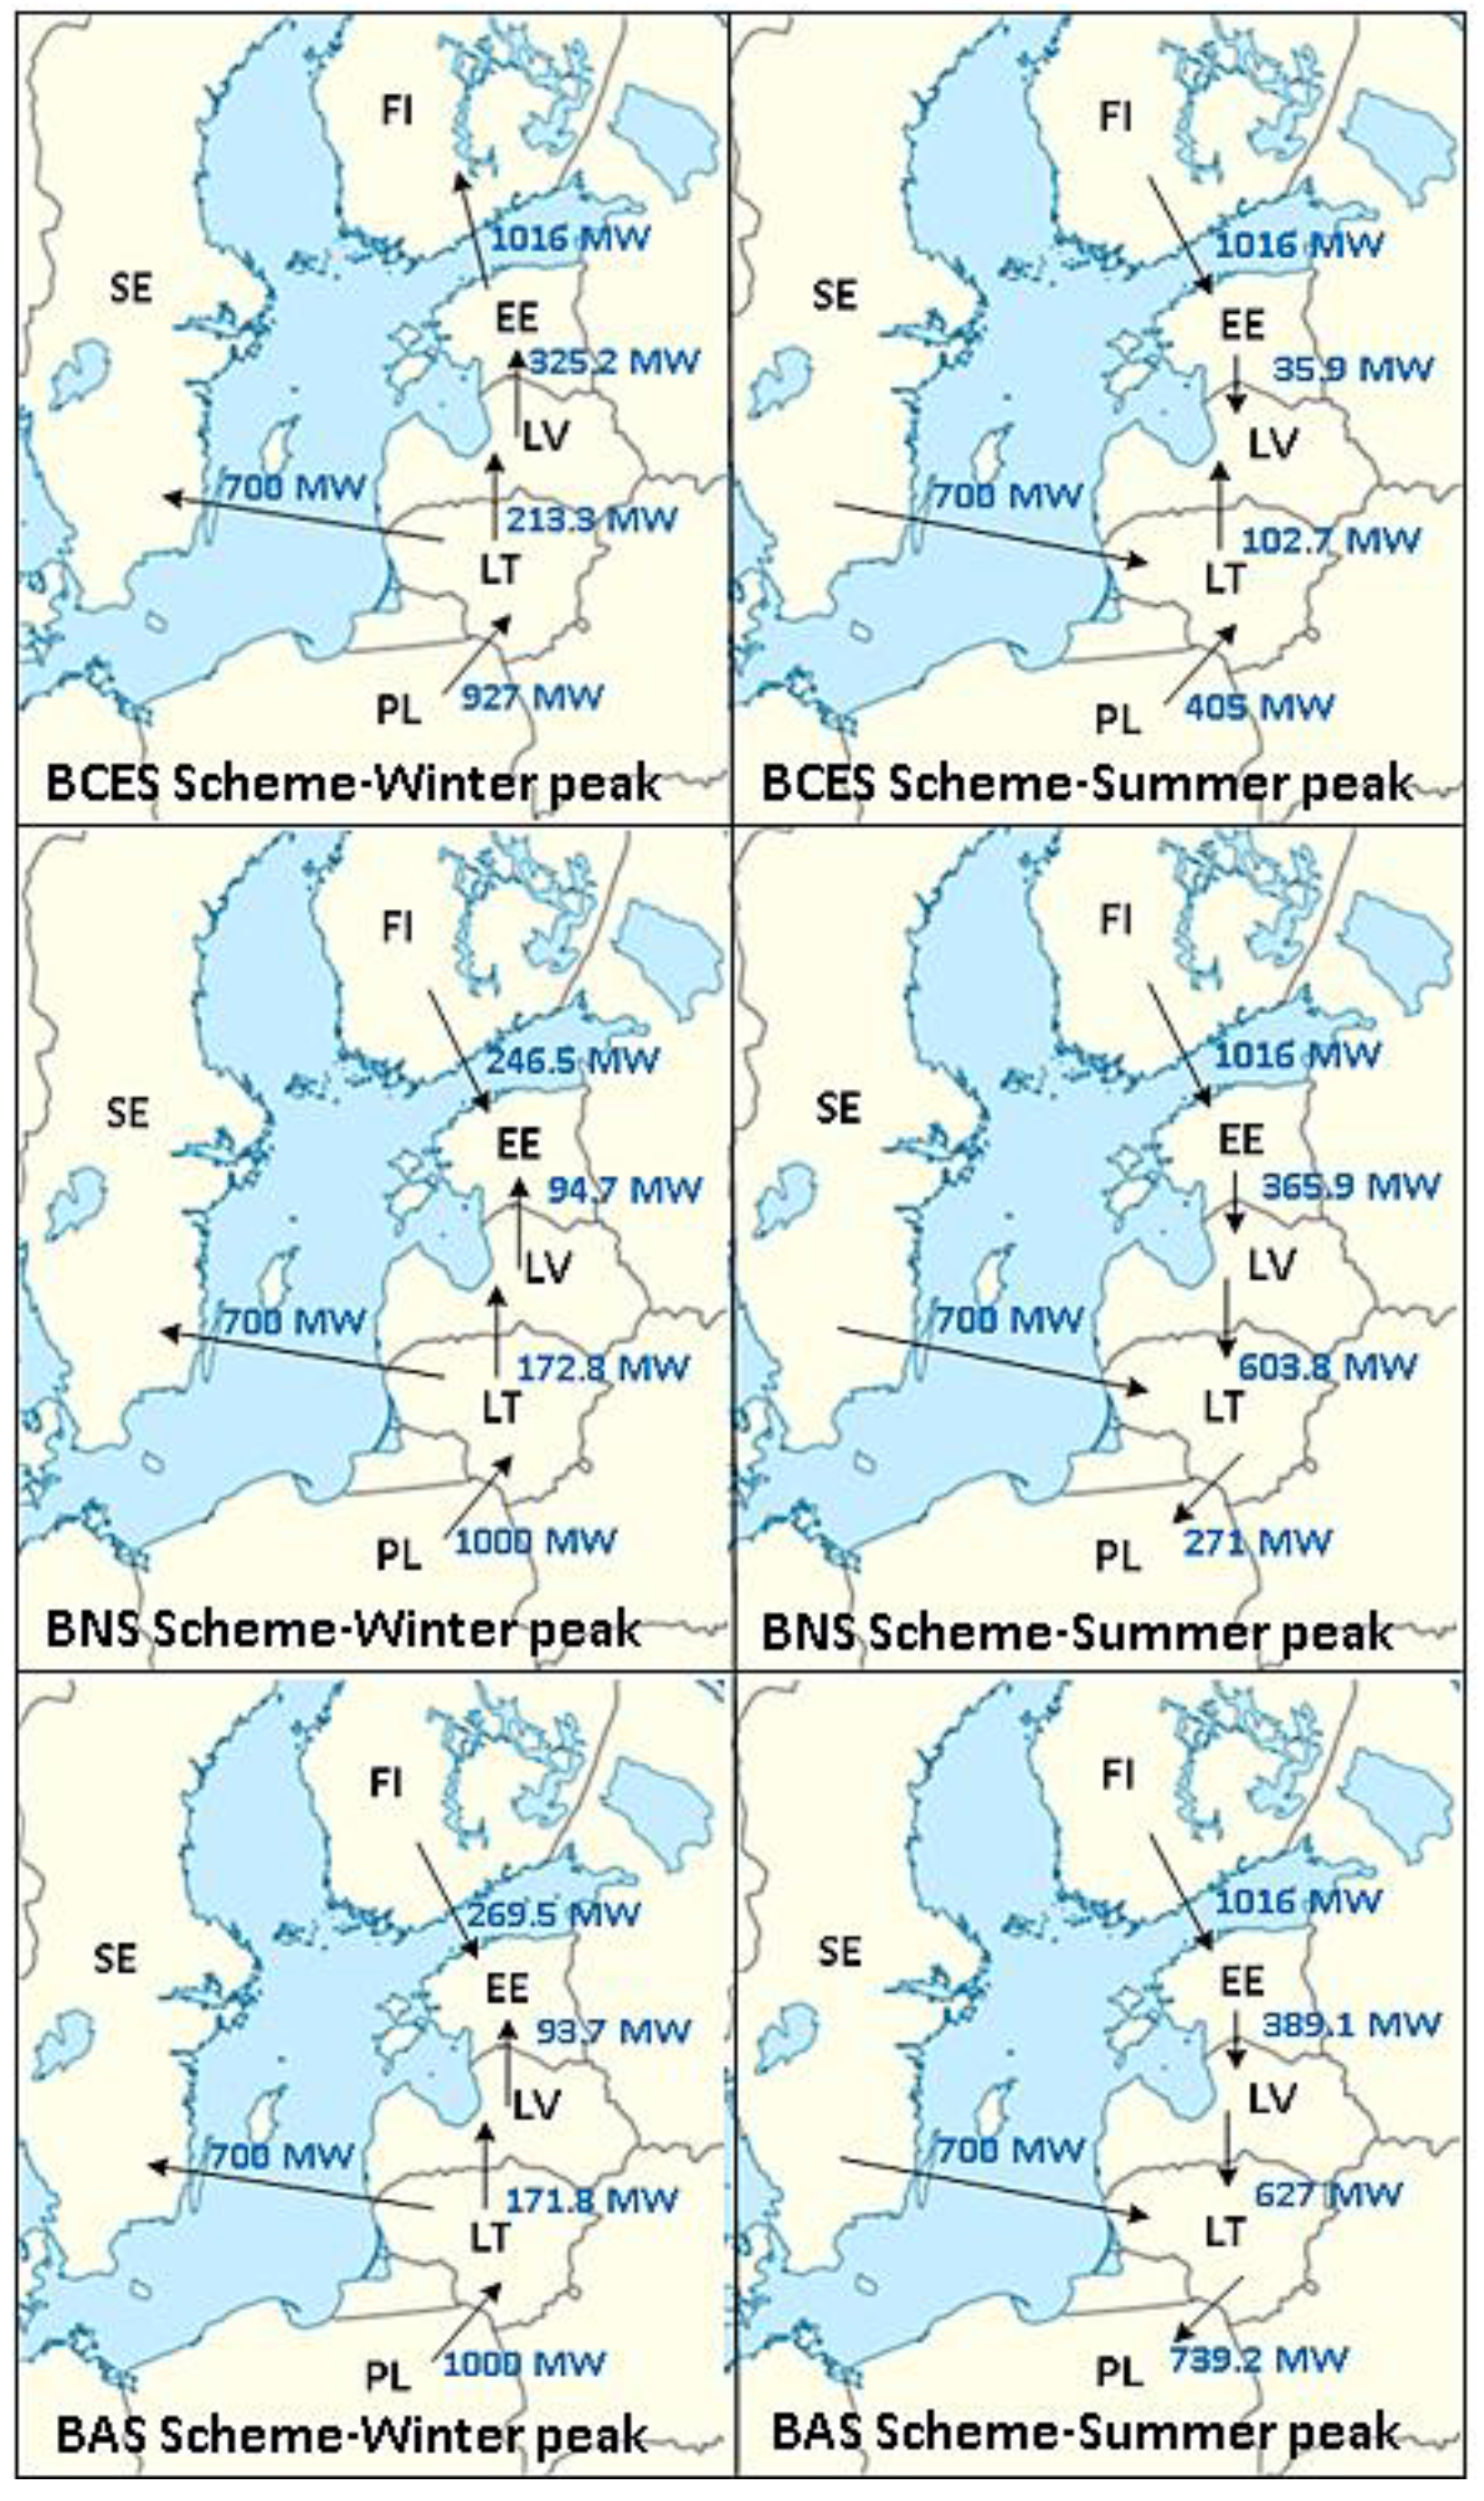
  • BCEN Scheme: Baltic synchronization with the CEN synchronous area via Poland.
  • BNS Scheme: Baltic synchronization with the Nordic synchronous area through newly constructed HVAC undersea cables between Estonia and Finland.
  • BAS Scheme: Baltic states’ autonomous synchronous operation.
Baltic synchronization with the CEN was modeled through the existing double-circuit AC line connecting Lithuania and Poland (LitPol link1) and the new planned double-circuit AC line (LitPol Link 2), with a total of 2 × 1683 MW (1870 MVA with 0.9 power factor assumption) capacity [13].
Baltic synchronization with the Nordic synchronous area was modeled by adding new HVAC undersea cables connecting Estonia and Finland, in addition to the existing HVDC links: Estlink1 with 350 MW capacity and Estlink2 with 650 MW capacity. The new HVAC cables for Baltic-Nordic synchronization were modeled by 3 × 225 MW undersea cables [11].
Under the Baltic states’ autonomous synchronous operation, all the current HVDC connections between the Baltic states and their European neighboring countries (Estlink1&2, LitPol link1, NordBalt), as well as planned interconnections (LitPol link2), exist to the support Baltic states in energy exchanges, while no HVAC interconnection was added to the model. This scenario is important due to its ability to pinpoint major weaknesses and challenges of the existing power system in the Baltics in terms of generation adequacy and available primary reserve capacity.
The HVAC and HVDC cross-border interconnections between the Baltic states and their European neighboring countries are illustrated in Figure 1.
Each of the above-mentioned desynchronization schemes can impact the electricity market performance and market-clearing results inside Baltic countries and other bidding zones in two ways: through different cross-border transmission capacities for energy exchange in the electricity market, and through limiting the available generation capacity of conventional power plants for energy production inside the market, due to the requirement to keep adequate primary reserve inside each control area, which varies under different schemes. The electricity market considered in this study is the European integrated day-ahead electricity market, followed by a national redispatch mechanism to solve the congestion management inside the Baltic countries. The focus of this study is to analyze the impact of desynchronization schemes inside the Baltic states.
In the following Section 2.1, Section 2.2 and Section 2.3, the required primary reserve capacity inside the Baltic states under different desynchronization schemes is presented. Table 1 provides an overview of the primary reserve requirement in each Baltic country under the three aforementioned schemes.

2.1. Primary Reserve Regulation in the CEN Synchronous Area

The primary reserve capacity requirement in the CEN synchronous area is equal to 3000 MW (based on N-2 criterion [14]), which must be provided by all the CEN members together. The share of each country in providing the required primary reserve is assigned through contribution coefficients based on their energy share of the previous year in the synchronous area. These coefficients are determined and published annually [15]. The primary reserve capacity provided by each control region in the CEN synchronous area is expressed by:
r i k = G i k 1 i I G i k 1 R    
where G i k 1 represents the total electrical energy generation in control region i during k-1th year, and R represents the total capacity required as primary reserve in the synchronized area. The term G i k 1 i I G i k 1 is the contribution coefficient of each area i belonging to the set I of countries in the CEN synchronized area.
The share of each Baltic and CEN country is calculated on the basis of the forecasted generation in 2030 (ENTSOE, [16]) and is reported in Table 1. Under this scheme, the HVAC interconnections between Lithuania and Poland are used for both cross-border energy exchange and primary reserve exchange under an emergency.

2.2. Primary Reserve Regulation in Nordic Synchronous Area

The so-called frequency containment reserve (FCR) product used in the Nordic power system [13] is equivalent to the primary reserve service. Generally, the FCR is the operating reserve with the purpose of balancing the system within the normal frequency band (i.e., 49.9–50.1 Hz) and in case of disturbance. To preserve the consistency of the FCR in Nordic countries with the primary reserve in CEN countries, this paper focuses on the frequency containment reserve under disturbance (FCR-D).The FCR-D capacity inside the Nordic synchronous area is based on the concept of a dimensioning fault/incident in each control region that is “the fault which entails the loss of individual major components (production, lines, transformers, bus bars, consumption, etc.) and entails the greatest impact upon the power system from all fault events that have taken into account” [13,17]. The required FCR-D capacity is equal to the dimensioning fault power minus 200 MW, i.e., the effect of frequency-dependent loads. The response from frequency-dependent loads can be ignored in this study.
Starting from the computation of the dimensioning fault within each control region, the share of FCR-D is computed with respect to the current regulations in the Nordic synchronous area [17]. The share of each control region in providing FCR-D, r i k , is:
r i k = D i k i I D i k R  
where D i k represents the dimensioning fault in the control region i during the year k, and R represents total capacity required as primary reserve (FCR-D) in the Nordic synchronized area, which is equal to m a x i I { D i k } the   effect   of   frequency   dependent   loads ). I is defined as the set of Nordic countries.
The share of each Baltic country in providing the required primary reserve in the Baltic-Nordic synchronization scheme, as well as the share of Nordic countries, according to the corresponding dimensioning faults, is presented in Table 2.

2.3. Primary Reserve in the Baltics under Autonomous Synchronous Operation

Under the Baltic autonomous synchronous operation scenario, Estonia, Latvia, and Lithuania are supposed to form a new synchronous area in Europe, for which there are no predefined regulations. We assumed the same regulations for the primary reserve of the Nordic synchronous area for the Baltic synchronous area (in Section 2.2). The dimensioning fault in this synchronization scheme, which determines the total required primary reserve in the Baltic synchronous area, is NordBalt interconnection, between Lithuania and Sweden, with 700 MW capacity.

3. EU Market-Clearing and Congestion Management in Baltic States

The single auction platform for EU day-ahead market coupling purposes is known as Pan-European Hybrid Electricity Market Integration Algorithm (EUPHEMIA), which is the key achievement of the Price Coupling of Regions (PCR) project [18]. Currently, EUPHEMIA is used to calculate day-ahead electricity prices and electrical energy allocation across 23 European countries, including Austria, Belgium, Czech Republic, Denmark, Estonia, Finland, France, Germany, Hungary, Italy, Latvia, Lithuania, Luxembourg, The Netherlands, Norway, Poland, Portugal, Romania, Slovakia, Slovenia, Spain, Sweden, and the UK, with the objective function of maximizing total social surplus. In summary, EUPHEMIA uses several bidding areas as the smallest entities in which generation offer/demand bids can be submitted, then it computes the market-clearing price for each bidding area through an optimization model. The current approach for energy exchange among bidding areas in day-ahead market coupling is based on available transfer capacities (ATC). The ATC model represents the bidding areas linked by interconnectors in a given topology, considering the power transmission lines simply as transportation corridors. The electrical energy flow between the neighboring bidding areas is limited by the ATC of the interconnectors. The ATC values in the EU day-ahead market coupling are defined by the corresponding TSOs.
Area pricing model performed in EUPHEMIA, as well as in the NordPool electricity market, conforms to the so-called zonal pricing model [19]. In general, European electricity markets are usually modeled as simplified zonal-pricing power markets without considering interzonal congestions inside the market model, which results in a uniform market price in each zone, typically a country or state [19,20,21,22,23,24]. The network model of each zone in the simplified zonal pricing model is replaced by one equivalent node connected to equivalent interzonal transmission lines, while intrazonal network constraints and potential congestions are neglected. It is mostly expected that the prospective integrated European power market will also work based on a zonal-pricing model. Therefore, centralized congestion management approaches will be required to ensure the technical feasibility of market outputs with respect to intrazonal network constraints.
In a restructured power system, market participants have open access to the transmission system, and the independent TSO is responsible for taking necessary actions, referred to as congestion management approaches, to ensure a feasible system operation state without violations of grid constraints [25,26]. Basically, in electricity markets with a zonal-pricing scheme, like the target model of the European integrated day-ahead electricity market, the highly simplified grid representation of the market clearance may result in infeasible power flows due to transmission congestions [27]. When a market dispatch, typically with the zonal pricing approach, fails to provide a feasible operating state without intrazonal constraint violations, the TSOs redispatch generations and loads to reach a feasible state at least cost.
Following day-ahead market clearing, each Baltic TSO checks the feasibility of the day-ahead market results in terms of eventual intrazonal congestions, and in case of potential network violations, runs congestion management for intrazonal congestion relief by redispatching its region, while cross-border power exchanges from the day-ahead integrated market are kept fixed. We assume that if the TSOs cannot achieve a feasible solution by activating upward/downward redispatch offers in the market, they would proceed to load curtailment as the most expensive solution. The cost of load curtailment is quantified by the value of lost load (VOLL). Redispatch market clearing in this study was modeled by the pay-as-bid approach.
The redispatch market was modeled through a network-constrained optimization problem with a direct current (DC) network representation that minimizes the redispatch costs, as formulized through Equations (3)–(6).
Objective Function:
  Min   C   C M = g G ( ρ g C M ,   u p Δ P g C M ,   u p ρ g C M ,   d n Δ P g C M ,   d n ) + υ V ( K υ C M ,   c u P υ C M ,   c u ) +   d D ( V d l L d C M ,   l )    
The first term of objective function represents the cost of activating generation adjustments by multiplying the adjustment offer prices ( ρ g C M ,   u p / d n ) and accepted adjustment power quantities ( Δ P g C M ,   u p / d n ) . The second term is defined to exert a penalty for renewable curtailment due to congestion management. The third term represents the cost of load curtailment. We did not consider demand response for congestion management in this study. However, by this term, the model can easily apply load curtailment services from active demand by assigning different values for load curtailment prices for different customers ( V d l ) .
The accepted adjustment power of generator g in the redispatch mechanism should be assigned in such a way that its final output power does not exceed the upper and lower band defined by the generator capacity and minimum technical limit, respectively (Equations (4) and (5)). The net value of total upward and downward adjustment powers in each control region should be equal to zero, as presented by Equation (6).
  P g D A + Δ P g C M ,   u p Δ P g C M ,   d n + P g R e s P g M a x  
  P g M i n P g D A Δ P g C M ,   d n  
  g G ( Δ P g C M ,   u p Δ P g C M ,   d n ) υ V P υ C M ,   c u + d D L d C M ,   l = 0    
Equations (7)–(9) indicate the final power flow between nodes i and j ( F i j C M ) after congestion management, based on DC power flow. Generation–demand balance in each node is demonstrated by Equation (9), in which the aggregated generation of all generators connected to node i in the redispatch market is equal to the final demand at node i plus aggregated outflows through the lines connected to that node ( F i j C M ) .
  F i j C M = B i j ( θ   i C M θ   j C M )  
  F j i M a x F i j C M F i j M a x  
  g G i ( P g D A + Δ P g C M ,   u p Δ P g C M ,   d n ) + υ V i ( P υ D A P υ C M ,   c u ) d D i ( L d D A ,   l L d C M ,   l ) j B , j i F i j C M = 0    
Figure 2 illustrates the possible actions taken by TSOs in a redispatch market, and the associated redispatch costs or revenues.

4. Modeling Assumptions

We set a model for 2030 based on ENTSO-E Vision 3 of “National Green Transition” [13]. The day-ahead market simulation was performed by PLEXOS® Integrated Energy Model [27] version 7.4 (Energy Exemplar, North Adelaide, Australia). We made the following assumptions:
(a)
Each connection is characterized by its net transfer capacity (NTC) [28,29], i.e., the maximum power exchange capacity between two areas compatible with security standards [21]. Assuming high liquidity of the day-ahead electricity market, the NTC is considered fully available for the day-ahead market, thus, it is assumed that ATC = NTC. This assumption is in line with the current ATC-based network modeling in EUPHEMIA. Under the ATC-based model, the impact of HVDC or HVAC interconnection types are inherently considered in calculation of NTCs.
(b)
In each zone, except for the Baltics, all the generators of the same type are lumped in one equivalent generator, with rated capacity equal to the sum of the individual generators [30]. Inside the Baltics, large generators are individually represented (30 in Estonia, 20 in Latvia, and 22 in Lithuania).
(c)
We considered the ENTSO-E winter-peak snapshot in January (19:00 p.m.) and summer-peak snapshot in July (11:00 a.m.) [30]. The aggregated electricity demand in the Baltic states is 5520 MW in the winter peak and 3780 MW in the summer peak.
(d)
The output power of wind and solar power plants in the summer-peak snapshot were assumed equal to the average generation profiles during 11:00 a.m. for the July days in [31,32], and modified based on the installed capacities under ENTSO-E Vision 3. Similarly, for the winter-peak snapshot, the average of the generation data for wind and solar power plants during the January 19:00 p.m. days was extracted from [31,32].
(e)
Primary reserve was assumed to be provided by thermal and hydro power plants equipped with droop control on the governor system. Considering 5% droop on generators’ governor system [33], and full activation of primary reserve in response to a 200 mHz frequency drop, it was approximated that all the online thermal and hydro generators inside the Baltic states can provide up to 8% of their available capacity for primary reserve. This assumption is not in contrast to the reserve requirement in Table 2. However, it limits the maximum available primary reserve capacity inside each Baltic country.
(f)
Primary reserve service was not co-optimized with energy in the day-ahead electricity market and was supposed to be provided through a separate approach, before energy market clearing, e.g., through long-term contracts or individual ancillary service markets. This assumption is in line with the current European market model. Therefore, first we allocated the primary reserve requirement to all the thermal and hydro power plants of each bidding zone according to the merit order list, based on their marginal generation costs. The primary reserve market modeling and pricing mechanism is out of the scope of this study.
(g)
The VOLL was considered to be 1000 €/MWh. Since demand response programs were not considered in this study, we considered a high VOLL to avoid load curtailment as long as possible.

5. Comparative Analysis of Synchronization Schemes

Three different synchronization schemes, as listed in Section 2, were compared in terms of day-ahead market performance (zonal prices and generation surplus), congestion management costs, and primary reserve adequacy inside the Baltic states.

5.1. EU Integrated Day-Ahead Market Performance

Different synchronization schemes may impact the market performance, since, under different schemes, NTCs between the three Baltic zones and the rest of Europe, with respect to the EU day-ahead market clearing, may change and the required provision of the primary reserve may impact differently the power that the generation units can bid on the market. The cross-zonal NTCs were calculated by subtracting the total available transmission capacity and a security margin based on N-1 security criteria, plus the required capacity for transferring primary reserves between the corresponding zones.
Baltic synchronization with CEN countries reduces the NTC from Poland to Lithuania for energy transactions in the day-ahead market to 927 MW, while the NTC in the opposite direction, from Lithuania to Poland, is 1588 MW [6]. In the other synchronization schemes, the NTC of the Lithuania–Poland interconnection is 1000 MW. The NTCs between Estonia and Finland (1016 MW) and Lithuania and Sweden (700 MW) do not change in the three synchronization schemes.
From the other side, the required primary reserve in the Baltic states under Baltic-CEN synchronization scheme is 32 MW and can be provided solely by hydro power plants. However, under the other synchronization schemes (Baltic-Nordic and Baltic autonomous synchronous operation schemes), 8% of the available hydro and thermal capacity is held for primary reserve, which reduces the available thermal capacity of the Baltic states in the day-ahead market, from 3485 MW to 3206 MW. Moreover, the relatively high requirement of the primary reserve in these schemes requires maintaining all the thermal power plants spinning in the Baltic power systems, running close to their minimum technical limit, which in turn leads to insufficient revenue of conventional generators in the day-ahead market and requires uplift charges.
The day-ahead market results are represented in Figure 3 and Table 3. Figure 3 illustrates the cross-border power exchanges between the Baltic states and other European countries. The results indicate energy import to the Baltics from Poland and energy export from the Baltics to Sweden during winter-peak snapshots in all desynchronization scenarios. However, the energy exchanges between Finland and Estonia change significantly from the first synchronization Scenario in Scenarios 2 and 3.
The impact of the synchronization scheme on the day-ahead market performance is higher in the summer snapshot with lower energy demand, because social welfare minimization results in 100% renewable generation in the Baltic states, while, to ensure available primary reserve for emergencies, it is required to keep the conventional generators with governor system synchronized in the power system. Since the primary reserve contracts/market is supposed to be cleared before the day-ahead market clearing, it is the producers’ responsibility to keep spinning and to be available to activate their primary reserve, if required by the TSO. Therefore, we assumed that primary reserve providers offer zero price at the day-ahead market for their minimum technical limit and offer their marginal costs for the rest of their capacity. Under this assumption, the generators’ surplus in the Baltic states reaches a negative value under the Baltic autonomous synchronous operation scheme.
Table 3 summarizes the financial outputs of the day-ahead market model in the three predefined desynchronization scenarios in both winter-peak and summer-peak snapshots, including the day-ahead market price in the Baltic states, the Baltics’ net interchange, settlement surplus (difference between cost to load and generator revenues), and generation surplus (generator’s profit). The results show higher generation surplus inside the Baltic states and all of Europe in Scenario 1, compared to the other two scenarios. The resulting financial loss of reserve-provider generators is supposed to be covered through uplift payments or reserve remuneration mechanisms.

5.2. Congestion Management Results within the Baltic States

The Baltic synchronization scheme impacts the generation schedules in the day-ahead market, as well as cross-border power exchange between the Baltic states and the rest of the Europe, as shown in Figure 3. Therefore, the synchronization scheme may change the intrazonal power flows inside the Baltic states and lead to intrazonal congestion.
We implemented congestion management inside the Baltic states through modeling a network-constrained redispatch market model, considering a detailed transmission network of the three Baltic states [8], as well as power exchange with the neighboring countries.
The redispatch market results are summarized in Figure 4 and Table 4. As it can be seen in Figure 4, generation schedules in the day-ahead market result in no congestion inside Latvia in all the three synchronization scenarios. However, in Estonia and Lithuania, network constraints compel the system operator to dispatch more expensive units as waste and geothermal power plans, while decreasing the output of cheaper units from the day-ahead market results. Over the summer-peak snapshot in all three desynchronization schemes, the day-ahead market schedules satisfy internal network constraints inside Estonia, Latvia, and Lithuania, and there is no need to redispatch the generation units.

5.3. Primary Reserve Adequacy in the Baltic States

As reported in Table 1, the required primary reserve capacity in the three Baltic states under different synchronization schemes differs significantly. The total primary reserve requirements in the Baltic states are 32 MW in the Baltic-CEN synchronization scheme, 298 MW in Baltic-Nordic synchronization scheme, and 700 MW in the Baltic autonomous synchronous operation scheme. However, the maximum available primary reserve in each Baltic state is limited, which may result in reserve deficit under some synchronization schemes.
The available primary reserve capacity and reserve deficit in Baltic power systems are listed in Table 5. The reported reserve deficit is calculated as the difference between reserve requirement in each scenario (Table 1) and the available reserve in each country. The fifth unit of the pumped-storage hydroelectricity plant Kruonis in Lithuania, planned by 2020, is considered to provide an additional 170 MW primary emergency reserve capacity. As represented in Table 5, the Baltic autonomous synchronous operation scheme leads to a primary reserve deficit in Estonia and Latvia, which leads to additional investment cost for building new emergency power plants under this scheme.

6. Conclusions and Discussion

Three future synchronization schemes of the Baltic states power system—(1) Baltic-CEN synchronization, (2) Baltic-Nordic synchronization, and (3) Baltics in autonomous synchronous operation—were compared in terms of day-ahead market performance, congestion management, and reserve adequacy.
The modeling results for 2030 show that Baltic synchronization with the CEN (Scheme 1) leads to the highest generation surplus and lowest redispatch cost in the Baltic states. Day-ahead market clearing in this scheme leads to intrazonal congestion only inside Lithuania during the winter peak. Furthermore, the available primary reserve capacity inside the Baltic states is adequate for synchronization with the CEN.
Baltic synchronization with Nordic countries (Scheme 2) leads to a decrease in generation surpluses in the Baltic states, especially in the summer peak. The difference between generation surpluses in different synchronization schemes is more remarkable during the summer peak with lower electricity demand, as generators need to be kept spinning to ensure a sufficient amount of primary reserves within the Baltic power system by offering a zero price in the day-ahead electricity market. Day-ahead market clearing results in intrazonal congestion inside Estonia and Lithuania in the winter peak, and the redispatch cost increases, compared to Scheme 1. Even though the primary reserve requirement in the Baltic states in this scheme is a lot higher than in the Baltic-CEN synchronization scheme, with the planned emergency power plant in Lithuania (extra 250 MW by 2020), there will be no primary reserve deficit in the Baltic states.
The Baltics’ autonomous synchronous operation leads to the lowest generation surplus inside the Baltic states in the winter snapshot, and even negative surplus in the summer snapshot. The day-ahead market clearing leads to intrazonal congestion in Estonia and Lithuania, with the highest redispatch cost among all the possible synchronization schemes, and the available primary reserve capacities inside Estonia and Latvia cannot meet the requirement in these countries.
To summarize, the Baltics’ synchronization with the CEN is the most preferable scenario for generation companies and system operators in terms of generation surplus and intrazonal congestion management. Even though previous studies have confirmed that all three schemes are technically feasible, the Baltic-CEN synchronization scheme requires the lowest amount of investment for network and generation expansion, which, in turn, is to be more straightforward to be implemented in terms of policy-making complexity. This outcome, even if driven from different results, is in line with previous studies [6].

Author Contributions

The paper is the cooperative effort of all the authors. E.B., S.Z., T.H., A.P., M.M.: Conceptualization, Methodology, Validation, Formal Analysis, Writing-Original Draft Preparation.

Funding

This research received no external funding.

Acknowledgments

The authors would like to acknowledge Energy Exemplar for providing technical support for PLEXOS.

Conflicts of Interest

The authors declare no conflict of interest.

Abbreviations

IPS/UPSIntegrated/Unified Power System
EUEuropean Union
HVACHigh Voltage Alternating Current
HVDCHigh Voltage Direct Current
BRELLBelarus, Russia, Estonia, Latvia, Lithuania
TSOTransmission System Operators
CENContinental Europe Network
CMCongestion Management
NTCNet Transfer Capacity
FCRFrequency Containment Reserve
FCR-Dfrequency containment reserve under disturbance
EUPHEMIAEU+ Pan-European Hybrid Electricity Market Integration Algorithm
ATCAvailable Transfer Capacity
VOLLValue Of Lost Load
Symbols
G Set of conventional generators, indexed by g
V Set of renewable generators, indexed by υ
D Set of electricity consumers, indexed by d
B Set of transmission network nodes, indexed by i , j
G i Set of conventional generators connected to node i , indexed by g
V i Set of renewable generators connected to node i , indexed by υ
D i Set of electricity consumers connected to node i , indexed by d
C   C M Total re-dispatch/congestion management cost
G i k 1 Total energy generation in control region i during k-1th year
R Total capacity required as primary reserve in the synchronous area
r i k Primary reserve capacity provided by each control region
D i k Dimensioning fault in the control region i during the year k
ρ g C M ,   u p Upward adjustment offer prices by conventional generator g in re-dispatch market
ρ g C M ,   d n Downward adjustment offer prices by conventional generator g in re-dispatch market
Δ P g C M ,   u p Upward adjustment power provided by conventional generator g in re-dispatch market
Δ P g C M ,   d n Downward adjustment power provided by conventional generator g in re-dispatch market
K υ C M ,   c u Penalty price of renewable curtailment in re-dispatch market
P υ C M ,   c u Curtailed power of renewable generator υ in re-dispatch market
V d l Curtailment cost of customer d in re-dispatch market (VOLL under inelastic demand assumption)
L d C M ,   l Curtailed load of customer d in re-dispatch market for congestion management
P g D A Scheduled output power of conventional generator g in day-ahead market
P g M a x Maximum power of conventional generator g
P g M i n Minimum power of conventional generator g due to technical limits
P g , t R e s Reserve capacity provided by conventional generator g
F i j C M Power flow from node i to node j
L d D A ,   l Power demand of customer g in day-ahead market
B i j Susceptance of transmission line between nodes i and j
θ   i C M Voltage angle of node i

References

  1. L’Abbate, A.; Careri, F.; Calisti, R.; Rossi, S.; Fulli, G. Long-term HVDC developments in the European power system: the Baltic case in GridTech analysis. In Proceedings of the IEEE 5th International Conference on Power Engineering, Energy and Electrical Drives, Riga, Latvia, 11–13 May 2015. [Google Scholar]
  2. Litgrid Website. Available online: http://www.litgrid.eu/index.php/about-us/international-activities-/621 (accessed on 20 September 2017).
  3. Radziukynas, V.; Klementavicius, A.; Kadisa, S.; Radziukyniene, N. Challenges for the Baltic Power System connecting synchronously to Continental European Network. Electr. Power Syst. Res. 2016, 140, 54–64. [Google Scholar] [CrossRef]
  4. Nord Pool Website. Available online: http://www.nordpoolspot.com/How-does-it-work/ (accessed on 22 September 2017).
  5. Bompard, E.; Carpaneto, E.; Huang, T.; Pi, R.J.; Fulli, G.; Purvins, A.; Mutule, A. Electricity independence of the Baltic States: Present and future perspectives, Sustainable Energy. Grids Netw. 2017, 10, 55–64. [Google Scholar] [CrossRef]
  6. European Commission. Integration of the Baltic States into the EU Electricity System. Available online: https://publications.europa.eu/en/publication-detail/-/publication/8d3b7da2-562e-11e7-a5ca-01aa75ed71a1/language-en/format-PDF/source-31392329 (accessed on 10 September 2017).
  7. FinGrid, Statnett, Svenska Kraftnat, Evengrinet.dk. Impact of Baltic Synchronization on the Nordic Power System Stability. 2016. Available online: https://www.svk.se/siteassets/om-oss/rapporter/impact-of-baltic-synchronization-on-the-nordic-power-system-stability.pdf (accessed on 20 September 2017).
  8. Newbery, D.; Strbac, G.; Viehoff, I. The benefits of integrating European electricity markets. Energy Policy 2016, 94, 253–263. [Google Scholar] [CrossRef] [Green Version]
  9. ENTSO-E. Regional Investment Plan 2015—Baltic Sea; ENTSO-E: Brussels, Belgium, 2015. [Google Scholar]
  10. Ding, F.; Fuller, J.D. Nodal, Uniform, or zonal pricing: Distribution of economic surplus. IEEE Trans. Power Syst. 2005, 20, 875–882. [Google Scholar] [CrossRef]
  11. ENTSO-E, Baltic Synchronization. Available online: http://tyndp.entsoe.eu/insight-reports/baltic-synchronisation/ (accessed on 20 September 2017).
  12. ENTSO-E. Principals for Determining the Transfer Capacities in the Nordic Power Market; ENTSO-E: Brussels, Belgium, 2017. [Google Scholar]
  13. ENTSO-E. Nordic Balancing Philosophy. June 2016. Available online: https://www.entsoe.eu/Documents/Publications/SOC/Nordic/Nordic_Balancing_Philosophy_160616_Final_external.pdf (accessed on 22 November 2017).
  14. ENTSO-E. Then-Year Network Development Plan 2010–2020. Non-Binding Community-Wide Ten-Year Network Development Plan Pilot Project Final Report; ENTSO-E: Brussels, Belgium, 28 June 2010. [Google Scholar]
  15. UCTE. Policy 1: Load-Frequency Control and Performance; UCTE: Ottawa, ON, Canada, 2009. [Google Scholar]
  16. ENTSO-E. TYNDP 2016 Scenario Development Report; ENTSO-E: Brussels, Belgium, 2015. [Google Scholar]
  17. Grande, O.S.; Doorman, G.; Bakken, B.H. Exchange of Balancing Resources between the Nordic Asynchronous System and The Netherlands/Germany/Poland; SINTEF Energiforskning AS: Trondheim, Norway, 2008. [Google Scholar]
  18. EUPHEMIA Public Description, PCR Market Coupling Algorithm. Version 1.5. December 2016. Available online: https://www.nordpoolspot.com/globalassets/download-center/pcr/euphemia-public-documentation.pdf (accessed on 10 September 2017).
  19. Bjorndal, E.; Bjorndal, M.; Gribkovskaia, V. A Nodal Pricing Model for the Nordic Electricity Market; Discussion Paper; Department of Business and Management Science, Norwegian School of Economics: Bergen, Norway, December 2014. [Google Scholar]
  20. Aravena, I.; Papavasiliou, A. Renewable energy integration in zonal markets. IEEE Trans. Power Syst. 2017, 32, 1334–1349. [Google Scholar]
  21. Oggioni, G.; Smeers, Y. Market failure of market coupling and counter-trading in Europe: An illustrative model based discussion. Energy Econ. 2013, 35, 74–87. [Google Scholar] [CrossRef]
  22. Beus, M.; Pavic, I.; Stritof, I.; Capuder, T.; Pandzic, H. Electricity market design in Croatia within the European electricity market—Recommendations for further development. Energies 2018, 11, 346. [Google Scholar] [CrossRef]
  23. Ellenbeck, S.; Beneking, A.; Ceglarz, A.; Schmidt, P.; Battaglini, A. Security of supply in European electricity markets-determinants of investment decisions and the European Energy Union. Energies 2015, 8, 5198–5216. [Google Scholar] [CrossRef]
  24. Poncela, M.; Purvins, A.; Chondrogiannis, S. Pan-European analysis on power system flexibility. Energies 2018, 11, 1765. [Google Scholar] [CrossRef]
  25. Bompard, E.; Correia, P.; Gross, G.; Amelin, M. Congestion-management schemes: A comparative analysis under a unified framework. IEEE Trans. Power Syst. 2003, 18, 346–352. [Google Scholar] [CrossRef]
  26. Delikaraoglou, S.; Morales, J.M.; Pinson, P. Impact of inter- and intra-regional coordination in markets with a large renewable component. IEEE Trans. Power Syst. 2016, 3, 5061–5070. [Google Scholar] [CrossRef]
  27. Energy Exemplar Website, PLEXOS Simulation Software. Available online: www.energyexemplar.com (accessed on 10 September 2017).
  28. Tennet. Model for Capacity Calculation; TenneT: Arnhem, The Netherlands, July 2012. [Google Scholar]
  29. Energy, E.U. Transport and GHG Emissions Trends to 2050; EU Reference Scenario; European Commission: Brussels, Belgium, 2016. [Google Scholar]
  30. ENTSO-E. Scenario Outlook and Adequacy Forecast 2014–2030; ENTSO-E: Brussels, Belgium, 2014. [Google Scholar]
  31. ENTSO-E. Ten-Year Network Development Plan 2016. Available online: http://tyndp.entsoe.eu/2016/reference/#downloads (accessed on 20 January 2018).
  32. Staffell, I.; Pfenninger, S. Using bias-corrected reanalysis to simulate current and future wind power output. Energy 2016, 114, 1224–1239. [Google Scholar] [CrossRef]
  33. Zalzar, S.; Shafiyi, M.A.; Yousefi-Talouki, A.; Ghazizadeh, M.S. A smart charging algorithm for integration of EVs in providing primary reserve as manageable demand-side resource. Int. Trans. Electr. Energy Syst. 2017, 27, e2283. [Google Scholar] [CrossRef]
Figure 1. Baltic-EU interconnections under different desynchronization schemes. From left to right: (a) Baltic synchronization with the Continental Europe Network (CEN); (b) Baltic synchronization with Nordic; (c) Baltic states’ autonomous synchronous operation.
Energies 11 01945 g001
Figure 2. Schematic representation of redispatch actions by transmission system operator (TSOs).
Energies 11 01945 g002
Figure 3. Cross-border power exchanges resulting from the European day-ahead market integration model (2030).
Energies 11 01945 g003
Figure 4. Comparison of energy generation by each fuel type resulting from the day-ahead and redispatch markets—winter peak (2030). (a) BSES Scheme-Estonia; (b) BSES Scheme-Latvia; (c) BSES Scheme-Lithuania; (d) BNS Scheme-Estonia; (e) BNS Scheme-Latvia; (f) BNS Scheme-Lithuania; (g) BAS Scheme-Estonia; (h) BAS Scheme-Latvia; (i) BAS Scheme-Lithuania.
Energies 11 01945 g004
Table 1. Estimated required primary reserves for different desynchronization schemes (2030).
SchemesStatusRequired Primary Reserve Capacity (MW)
EstoniaLatviaLithuaniaNordic Countries (without the Baltic States)CEN Countries (without the Baltic States)
BCESBaltic synchronization
with Continental Europe
981514002968
BNSBaltic synchronization
with Nordics
6611012211023000
BASBaltic island operation25317527214003000
Table 2. Primary reserve contribution coefficient of Baltic-Nordic countries based on dimensioning faults (2030).
CountryDimensioning Fault (MW)FCR Contribution CoefficientFCR Requirement (MW)
Finland13000.22730.2273 × 1400 = 318
Sweden14000.24480.2448 × 1400 = 343
Norway12000.20980.2098 × 1400 = 294
Denmark6000.10490.1049 × 1400 = 147
Estonia2700.04720.0472 × 1400 = 66
Latvia4500.07870.0787 × 1400 = 110
Lithuania5000.08740.0874 × 1400 = 122
Table 3. Day-ahead market results in different synchronization schemes (2030).
Market Performance MetricsBCES SchemeBNS SchemeBAS Scheme
Winter PeakSummer PeakWinter PeakSummer PeakWinter PeakSummer Peak
Baltic’s Day-head Price (€/MWh)61.521.361.521.361.521.3
Baltic’s Net export (MW)789−2121−546.5−1445−569.5−967.8
Europe-wide Settlement/Merchandize Surplus (€) (The difference between the aggregate amount paid by consumers and the aggregate amount paid to generators.)20,025261,84020,165261,84020,165261,840
Baltic’s Generation Surplus (€)161,89331,575155,82213,644155,012−4304
Europe-wide Generation Surplus (€)24,515,4385,366,12024,509,3675,348,18924,508,5565,330,241
Table 4. Redispatch results in Estonia, Latvia, and Lithuania—winter peak (2030).
SchemesRedispatch Cost (€/h)Renewable Curtailment (MWh)
EstoniaLatviaLithuaniaEstoniaLatviaLithuania
BCES00787700125
BNS4930799600127
BAS4990817500130
Table 5. Primary reserve capacity and reserve deficit in Baltic States (2030).
CountryAvailable Primary Reserve (MW)Primary Reserve Requirement (MW)Primary Reserve Deficit (MW)
Scheme 1Scheme 2Scheme 3Scheme 1Scheme 2Scheme 3
Estonia8896625300165
Latvia12181101750054
Lithuania113 (+170)15122272000

