The Influence of the Backfilling Roadway Driving Sequence on the Rockburst Risk of a Coal Pillar Based on an Energy Density Criterion

1
State Key Laboratory of Eco-hydraulics in Northwest Arid Region, Xi’an University of Technology, Xi’an 710048, China
2
School of Civil Engineering, Henan Polytechnic University, Jiaozuo 454003, China
3
Institute of Geotechnical Engineering, Shaanxi Provincial Key Laboratory of Loess Mechanics and Engineering, Xi’an University of Technology, Xi’an 710048, China
*
Author to whom correspondence should be addressed.
Sustainability 2018, 10(8), 2609; https://doi.org/10.3390/su10082609
Submission received: 27 June 2018
/
Revised: 18 July 2018
/
Accepted: 23 July 2018
/
Published: 25 July 2018
(This article belongs to the Section Energy Sustainability)
Abstract
:The rockburst hazard has always been an important issue affecting the safety production of coal mines in China. The unreasonable sequencing of roadway driving can lead to the dynamic instability of coal pillars, which subsequently causes rockburst accidents in roadway backfilling mining engineering and poses a serious threat to the safety of the mines. Roadway backfilling mining technology is an effective approach with which to mine corner residual coal resources under buildings, railways, and rivers. An energy density criterion is established and programmed with FISH language using numerical analysis software for the rockburst risk evaluation of coal pillars. On this basis, a numerical simulation model is established based on four scheme types, namely, the sequential mining, one-roadway interval mining, two-roadway interval mining, and three-roadway interval mining schemes. The influence of the backfilling roadway driving sequence on coal pillar stability is investigated, and the change law of vertical stress and energy density factor of coal pillars in different driving sequences in roadway backfilling mining technology are analyzed. According to the research results, the maximum energy density factor value of 21,172 J/m4 for coal pillars in one-roadway interval mining is the lowest among the different schemes. Therefore, the one-roadway interval mining scheme is the optimal choice in roadway backfilling mining technology. The results can be treated as an important basis for the prevention and treatment of coal pillar instability and rockburst in roadway backfilling mining technology.
1. Introduction
China is in a high-speed stage of economic development, but its energy utilization structure is not reasonable. Coal resource consumption accounts for 63.7% of total energy consumption in China in 2015 [1,2]. In addition, the safety production of coal mines, which is part of the energy safety objective of China, will likely affect the development of the Chinese national economy. For the sake of recovering the corner residual coal resource under railways, buildings, and water bodies, the roadway backfilling mining technology is preferentially employed and widely promoted, given that long-wall backfilling mining technology is not suitable in certain conditions [3,4,5,6]. In roadway backfilling mining technology, coal cutting is synchronized with roadway excavation, a method realized by a roadheader. Then, the backfilling materials are conveyed to the mined roadway [7,8,9,10]. When the excavation and backfilling procession in a single roadway is completed, the same procession starts in the next roadway. Besides, the gangue generated in roadway excavation can be recycled as solid backfilling materials. Therefore, roadway backfilling mining technology is also beneficial to environmental protection [11,12,13,14].
In the last 20 years, the mining industry has witnessed a series of remarkable achievements in roadway backfilling mining technology [15,16,17,18]. To deal with the waste disposal problem and the extraction of trip coal pillars, Zhang et al. [19] proposed the use of roadway backfilling mining technology by expounding its effect on surface movement. The layout of the waste filling roadway was centralized and decentralized on the basis of the analyzed feasible coal-pillar width of substituted extraction. In addition, the layout with two waste backfilling roadways placed at the middle of the coal-pillar strip extraction is determined. The width and height are 4.0 m and 5.0 m, respectively. To understand the strata movement and control caused by mining with backfilling under buildings, railways, and water bodies, Yu et al. [20] emphasized the combined action of backfilling, coal pillar, and roof load-bearing rock stratum and subsequently suggested the mechanical model of coordinated support systems. Besides, rock mechanics and strata control principle were adopted to analyze the supporting mechanism of backfilling, supporting conditions of coal pillar, and process of mechanical action. The stability condition of the coordinated support systems was also determined. To solve the engineering technical problems in extra-thick coal seams, Deng et al. [21] proposed the longwall-roadway cemented backfilling mining technology. The composition and bearing characteristics of backfilling materials were also investigated to determine the optimal ratio of cemented filling materials, which are commonly applied in field work. The optimal proportion of fly ash, lime slag, cement, and gangue were 35%, 10%, 2%, and 53%, respectively. To deal with the environmental problem and low recovery of coal in traditional coal mining, Sun et al. [22] proposed the longwall-roadway backfill coal mining method based on a systematic analysis of the roadway layout and backfill mining technology. Besides, the plan for roadway backfill coal mining was optimally designed and then combined with the engineering case of roadway backfill mining in Shanxi Changxing Coal Mine. On the basis of the deformation characteristics of overburdened strata in roadway backfilling mining technology, Cao et al. [23] established the mechanical model of the bearing system of a coal pillar and a backfilling body and derived the corresponding joint bearing mechanism by combining the elastic-viscoelastic correspondence principle and the compressive mechanical property of the backfilling body.
The research achievements have been considerably apparent for roadway backfilling mining technology, and the topics have mainly concentrated on the mining technical practice, mechanical properties of backfilling materials, and backfilling equipment [24,25,26]. Nonetheless, making a rational choice regarding the roadway driving sequence is also vital to the security of roadway backfilling mining technology, because unreasonable sequencing can lead to rockburst accidents of coal pillars, which subsequently pose serious threats to the safety of mines, especially in the corner residual coal resource. The influence of the backfilling roadway driving sequence on the rockburst danger of coal pillars should also be systematically studied to provide the basis for preventing and treating coal pillar instability and rockburst in roadway backfilling mining technology.
In this study, the energy density criterion for the rockburst danger evaluation of coal pillars was established. Four kinds of numerical simulation models for roadway driving sequence were designed to study the influence of backfilling roadway driving sequence on coal pillar stability. The change rule of vertical stress and energy density factor of coal pillars in different driving sequences in roadway backfilling mining technology were analyzed. On this basis, the optimal roadway driving sequence was put forward, which could avoid the rockburst accidents of coal pillars in the roadway backfilling mining technology. Furthermore, the research results can be summarized as a guideline and a reference for the prevention and treatment of coal pillar instability and rockburst in roadway backfilling mining technology.
2. Geological and Engineering Conditions
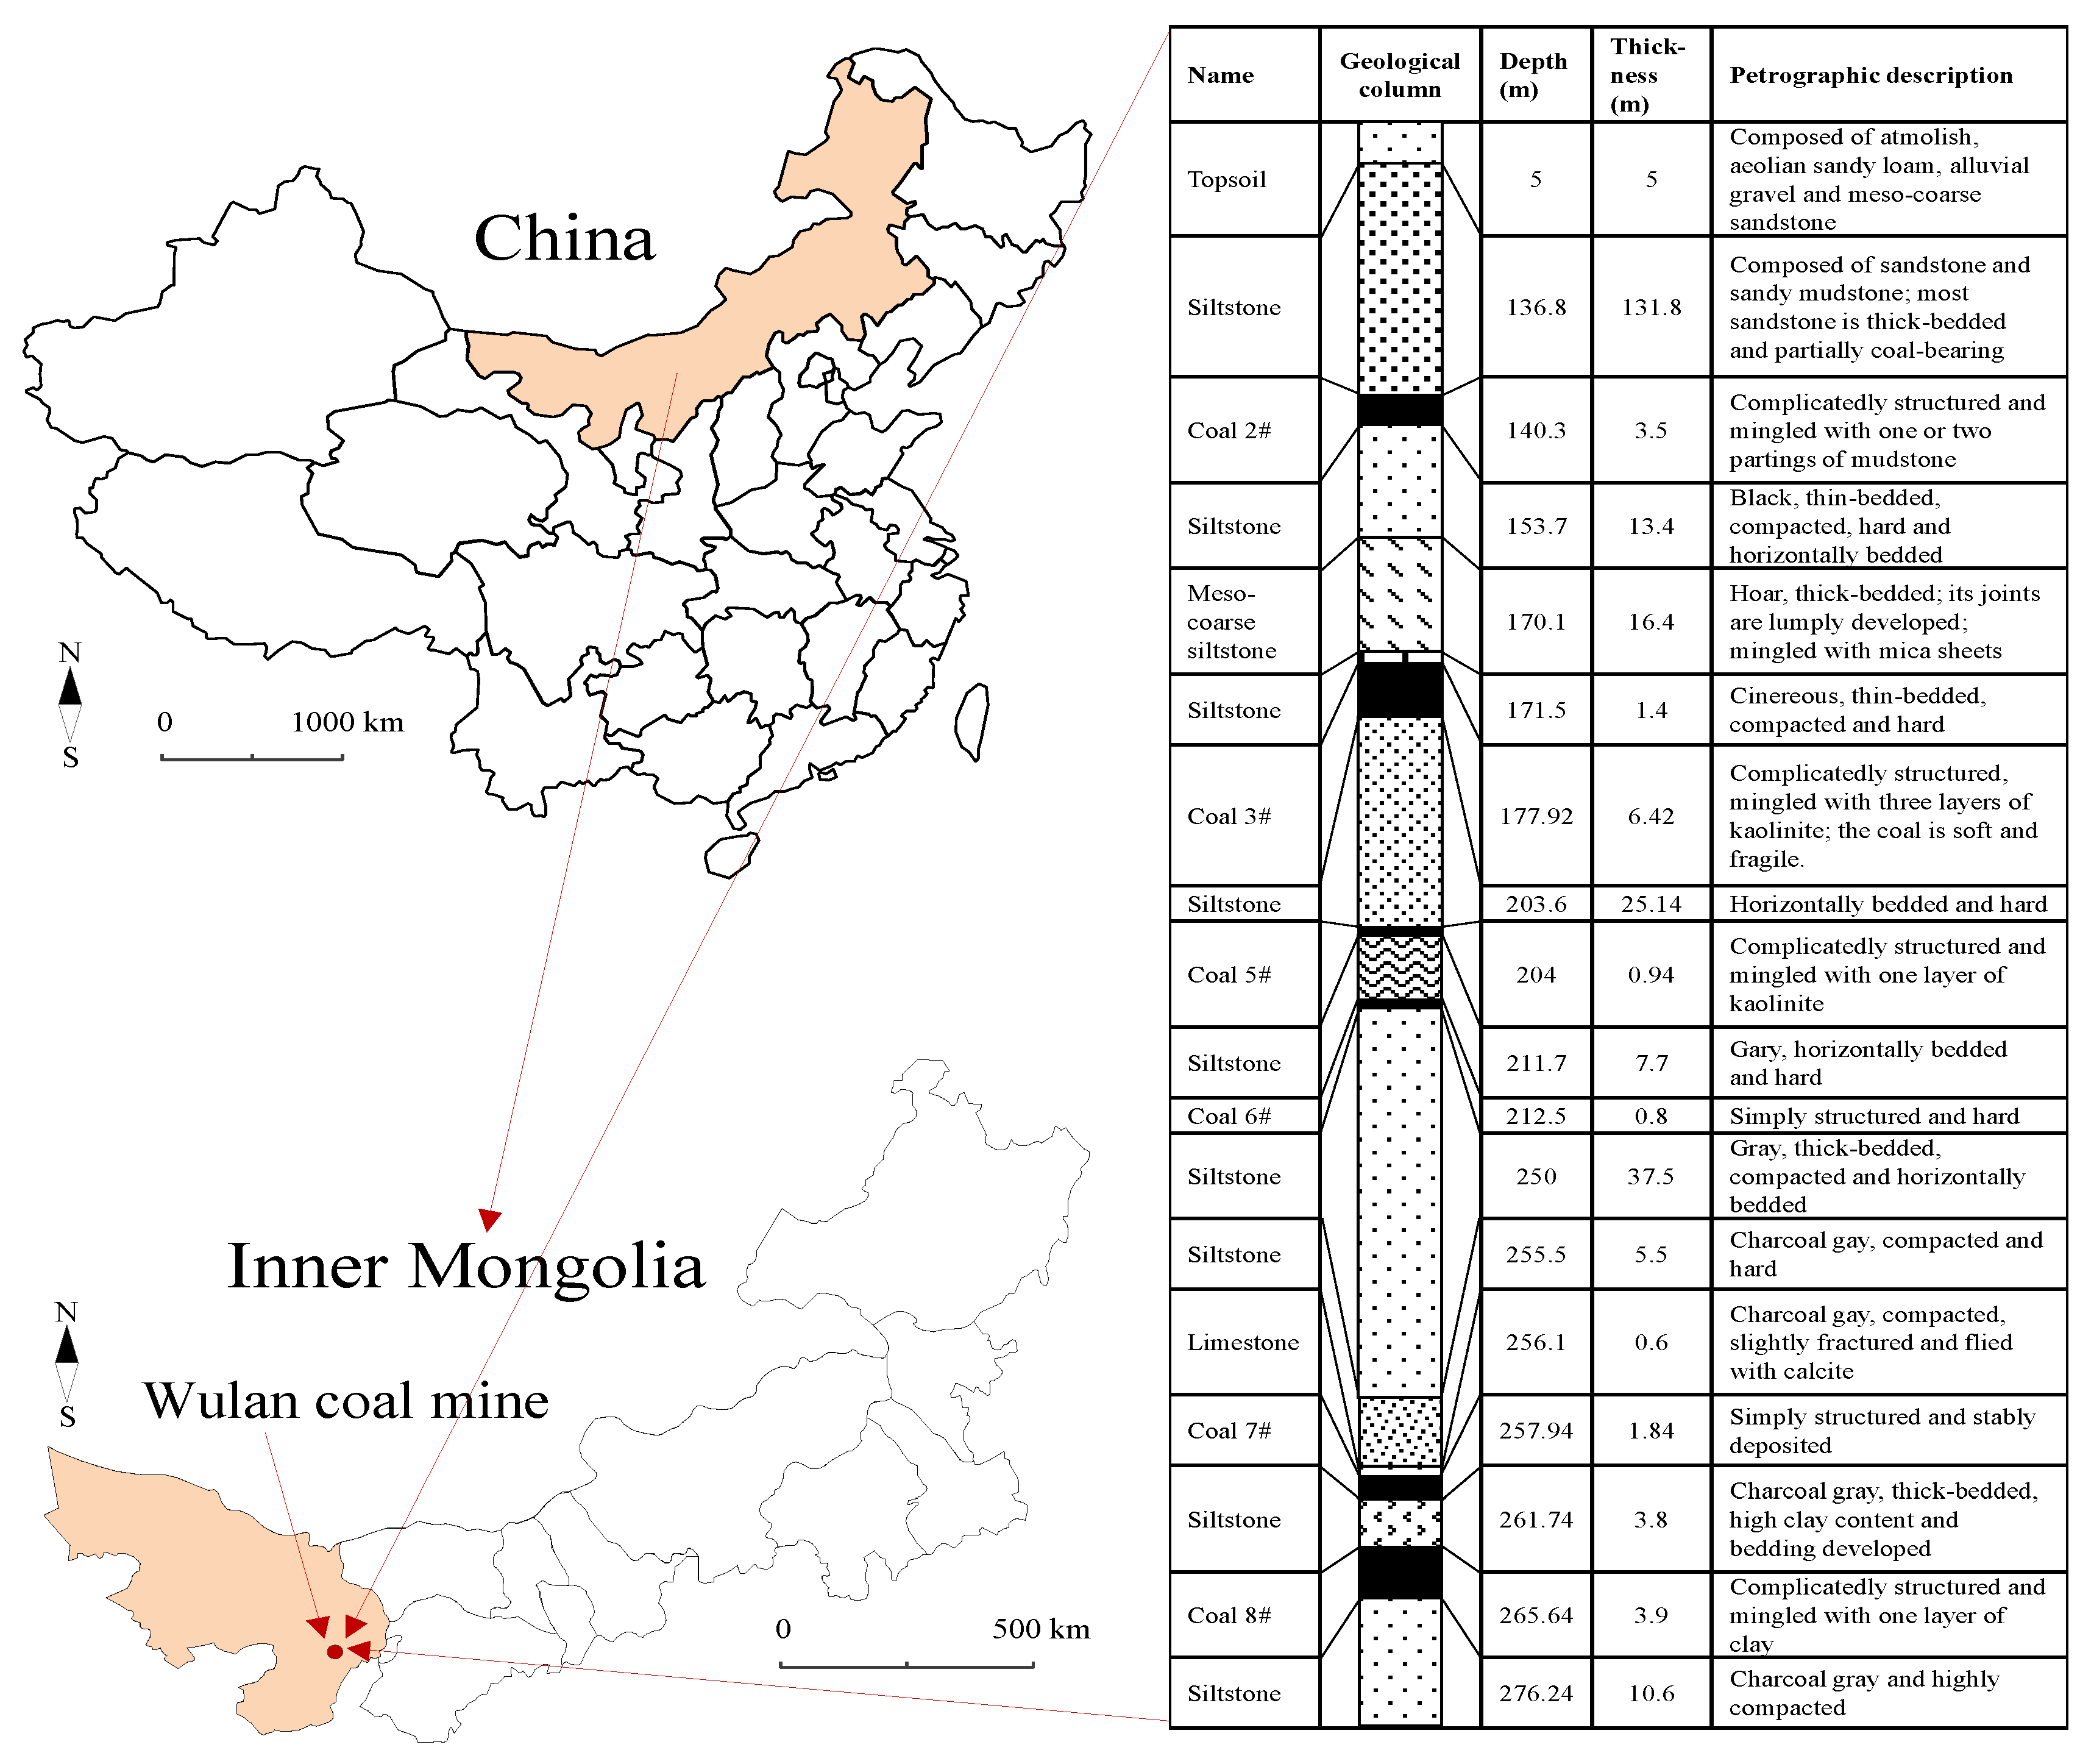
The Wulan mine of the Shenhua Ningxia Coal Industry Group Co., Ltd., located in the Inner Mongolia Autonomous Region in China, is an example of a mine with serious risks of coal and gas outbursts. The mine has a north-to-south monoclinic dumping relief trend. The strike is 5.3 km and the dip is 3.04 km. The mine has 17 minable layers. The main coal seam includes coal seams 2#, 3#, 7#, and 8#. The location and geologic column of the Wulan coal mine are shown in Figure 1. The geo-stress of the coal seam at Wulan mine is high, which mainly hinders the mining of the coal seam. A rockburst disaster hazard is also a major problem in the production process of Wulan mine. The core objective of this study is to put forward an effective method for determining the optimal roadway driving sequence in roadway backfilling mining technology at Wulan mine. The originality of this study is the rockburst risk evaluation of coal pillars based on the energy density criterion established and programmed with FISH language through numerical analysis method.
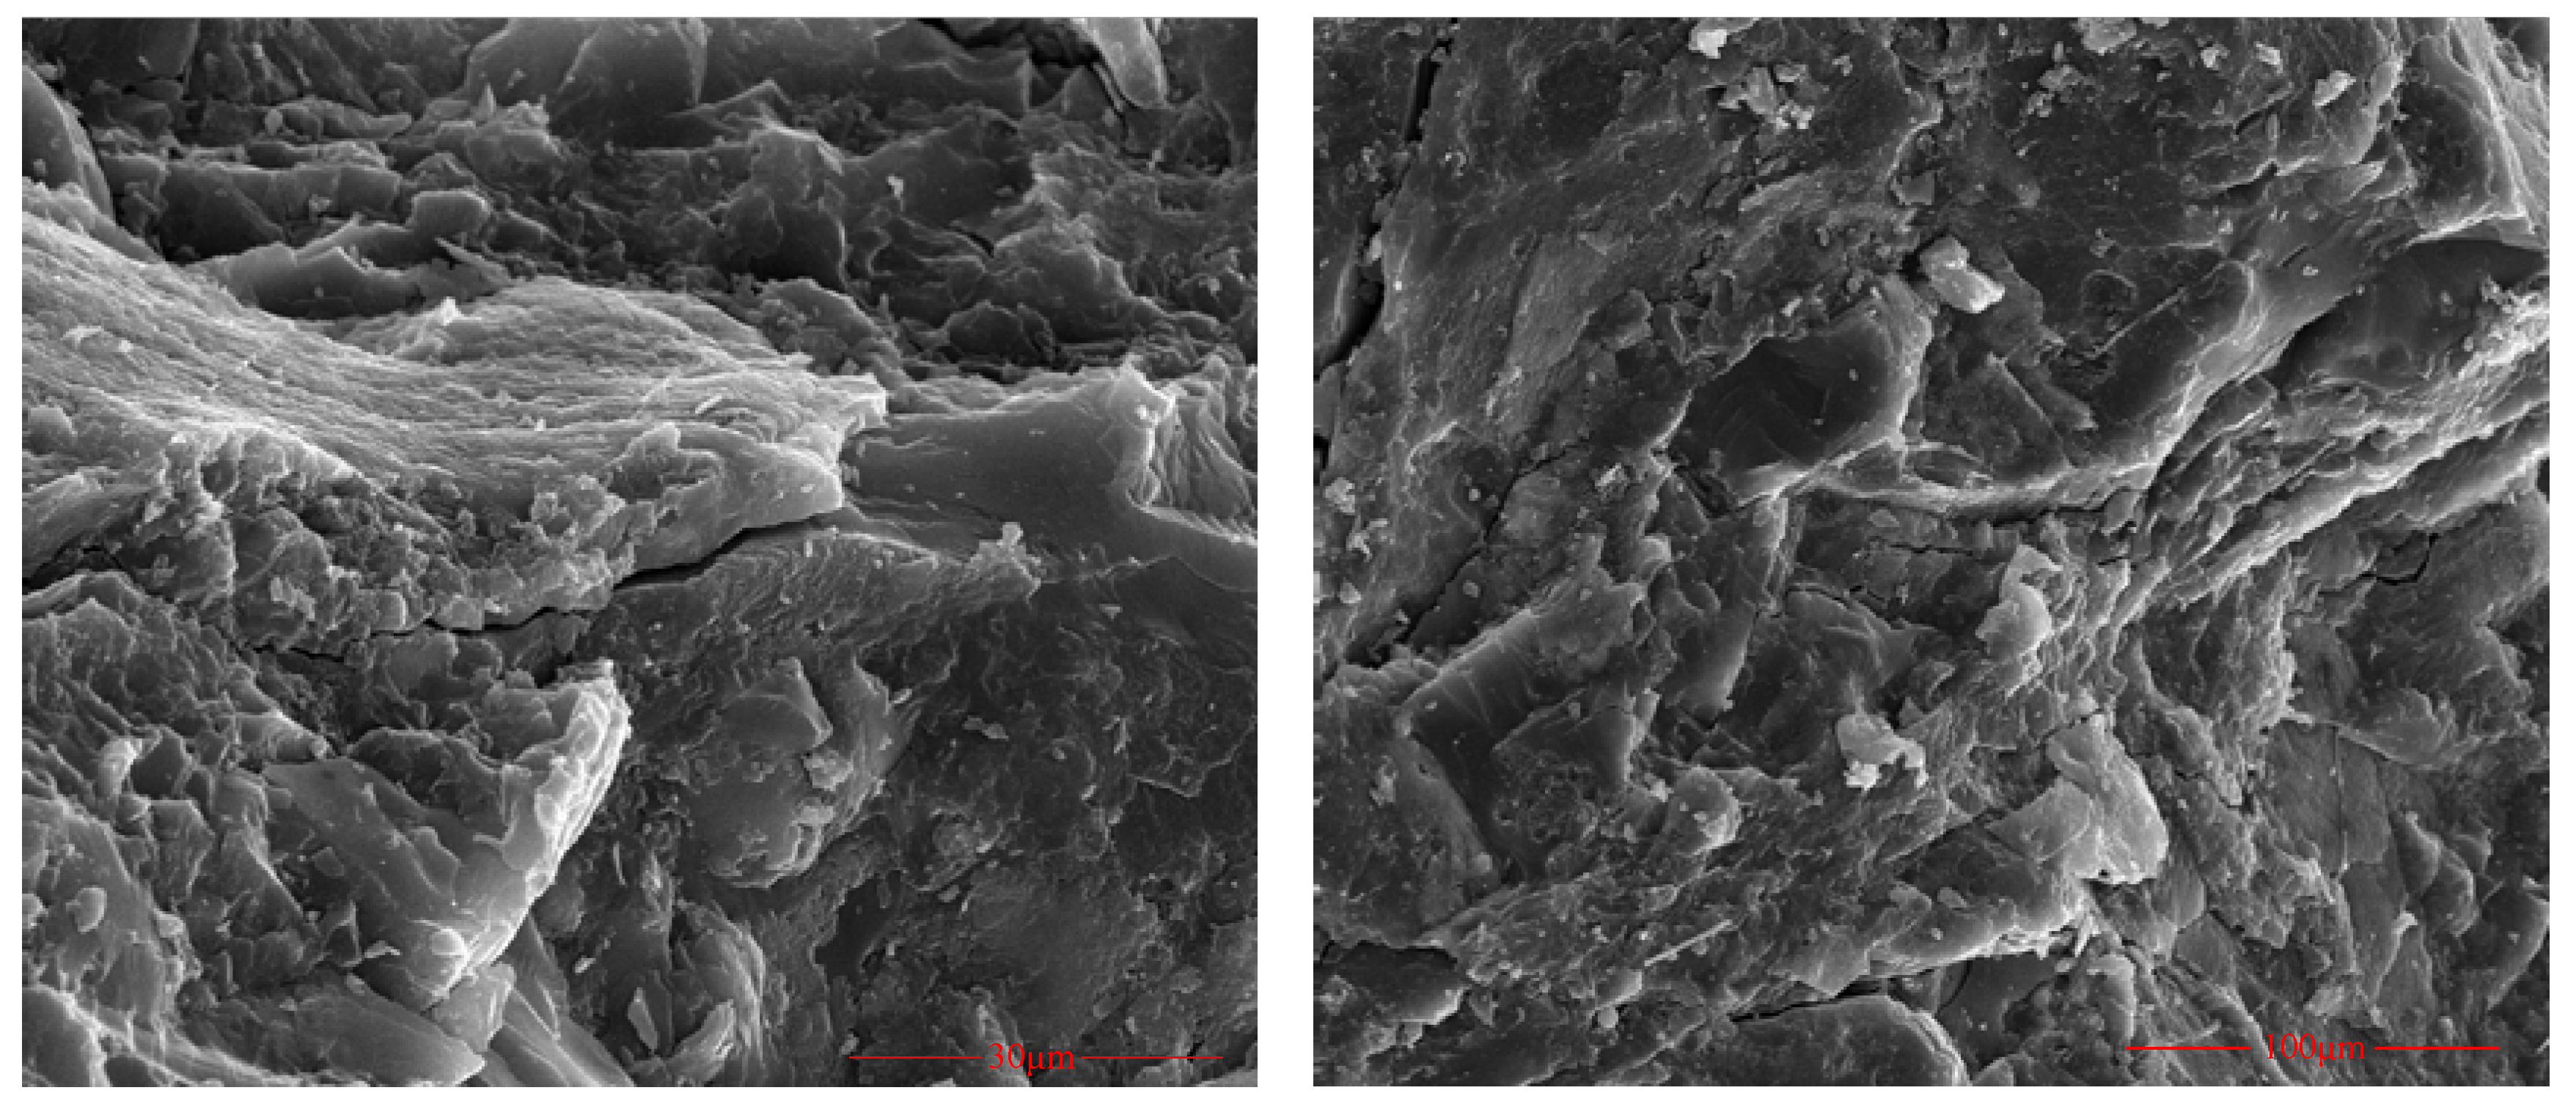
A coal mass is a special geological material formed by a long and complex diagenetic process, and it contains a large number of original cracks, as shown in Figure 2. Underground mining usually induces fracture and destruction of surrounding coals and rocks, which then directly determines the mechanical strength and damage characteristics of the coals and rocks in the area.
In the study, traditional triaxial test is performed to have a comprehensive understanding of mechanical behavior of coal mass. According to the in-situ measurement of Wulan Coal Mine, the geo-stress of the target depth range (200–300 m) is 15 MPa. Considering the stress release caused by excavation, the surrounding rock is subjected to low restrictions, and the compression test is carried out under restricted conditions (confining pressure of 15 MPa). In the test, after applying the confining pressure at the loading rate of 2.5 MPa/min, the specimens are first loaded axially at the rate of 25 kN/min. Then, when the axial stress is close to the failure strength, the constant axial deformation rate maintains 0.01 mm/min to avoid rock bursting at the point of failure.
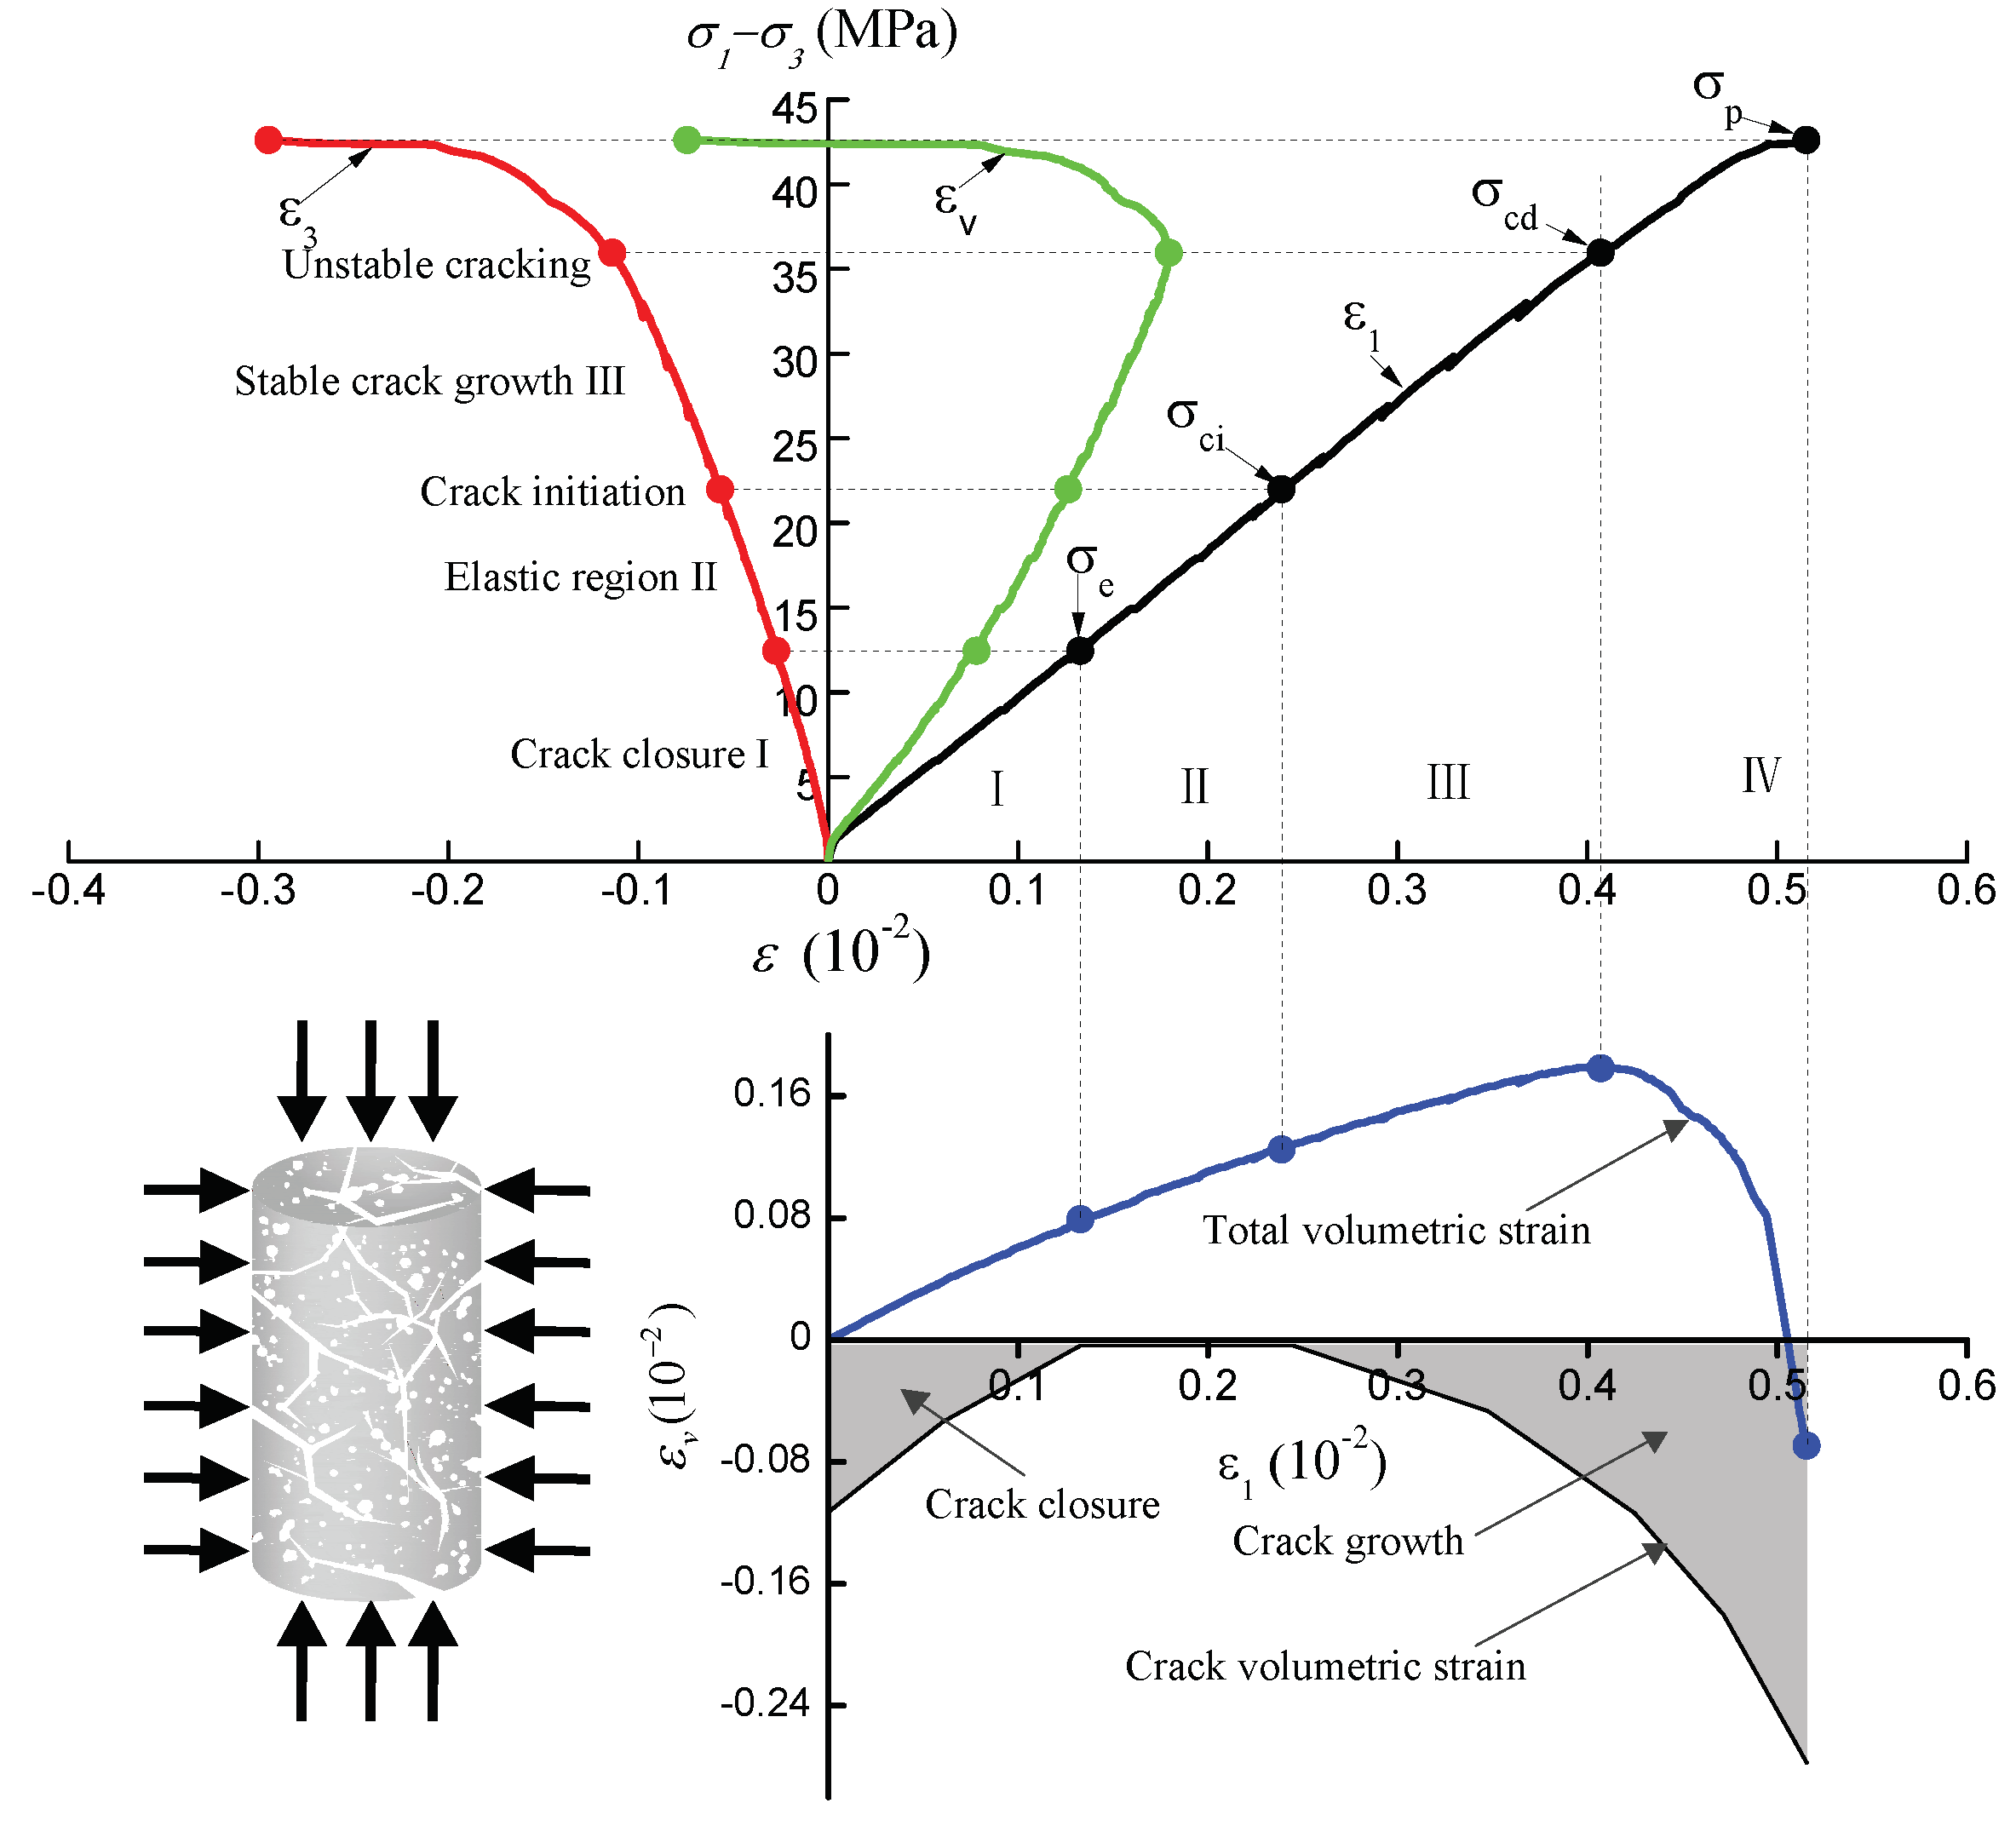
The stress-strain curves of phases I, II, III, and IV correspond to the compaction process and the elastic deformation stage of the coal samples, as shown in Figure 3. , , and are the three principal stresses, MPa; , , and are the three principal strains corresponding to the principal stresses, respectively; is the total volumetric strain; is the deviatoric stress, MPa; is the stress in elastic stage, MPa; is the stress at the crack initiation point, MPa; is the stress at the unstable cracking point, MPa; is the peak stress, MPa. The elastic compression of coals and the proximity of fractures initially absorb most of the energy exerted by external stress. Then, the energy is stored in the rock in the form of elastic energy with no apparent acoustic emission. The next stage corresponds to the nonlinear plastic deformation stage. After the transformation of the volume strain from compaction to dilatancy, a large number of new cracks rapidly develop. Finally, the coal mass is broken, and the fracture ratio increases by three to four orders of magnitude compared with the initial value. In this stage, the risk of rockburst increases significantly.
Over the past few decades, scholars have proposed some theories and models to describe the mechanical behavior of rocks based on rock experiments, such as strength theory, damage model, and energy criterion [27,28,29]. It is generally believed that the reduction of mechanical properties and rock failure are mainly related to the development of internal cracks and the accumulation of damage. Most of the studies on the mechanism and prediction of rockburst are based on the application of strength, stiffness, fractal, fracture damage, catastrophe theory, and numerical analysis [30,31,32]. Hoek and Brown [33] have proposed the stress intensity criteria of rock burst for rock engineering. Zhao et al. [34] further modified the standards by investigating the observation results of underground tunnels. Qian [35] calculated the stiffness of rock pillar and surrounding rock, and established a prediction model for rock burst. Disaster theory and cusp catastrophe model are also used in the analysis of rockburst system [36]. Although the energy criteria are normally used to analyze the rock damage, they are rarely used in the evaluation and prediction of the rockburst risk. Therefore, based on the phased mechanical characteristics observed from the test, we adopt an energy density criterion for the rockburst risk evaluation of coal pillars through numerical method in the following sections.
3. Energy Density Criterion for the Rockburst Risk Evaluation of the Coal Pillar
3.1. Elastic Strain Energy Density
Coal seam excavation causes stress field redistribution in the original rock mass, and this phenomenon leads to stress concentration and elastic strain energy accumulation. In tri-axial stress states, the elastic strain energy density of coal mass can be expressed as [37]
in which , , and represent the three principal stresses, MPa, while , , and represent the three principal strains corresponding to the principal stresses, respectively. Besides, the generalized Hooke law is
in which and represent the elastic modulus (MPa) and Poisson’s ratio of the coal mass, respectively.
By combining Equation (1) with Equation (2), the elastic strain energy density of the coal mass represented by the principle stress can be obtained by
3.2. Energy Density Criterion
Rockbursts in coal mines represent the dynamic disaster of surrounding rocks in working face or during roadway excavation, and they are caused by the abrupt release of elastic strain energy in coal mass. The strength of a rockburst is proportional to the differential value of accumulated energy and dissipated energy in a coal mass. Therefore, the total accumulated energy in the coal mass and the position of accumulated energy are vital to rockburst behavior.
The accumulated energy level is represented by the maximum energy density , while the position of accumulated energy is represented by distance between the point of maximum energy density and the free face of roadway. Thus, the energy density criterion of rockburst risk is positively related to the maximum energy density and negatively to the distance .
The energy density criterion for rockburst risk evaluation can then be proposed by combining the maximum energy density with the distance between the point of maximum energy density and the free face of a roadway.
in which is the energy density factor, J/m4. Rockburst occurs when the value of energy density factor is larger than the limit energy density factor , which is shown in Equation (5).
in which the value is only related to the structure feature and lithology of the coal pillar, which can be obtained by a mechanical test of the coal mass and a site test of the rockburst in the coal mine. Besides, the energy density criterion is achieved by using a numerical software in FISH programming language.
4. Rockburst Risk of Coal Pillars in Different Roadway Driving Sequences
4.1. Numerical Calculation Model
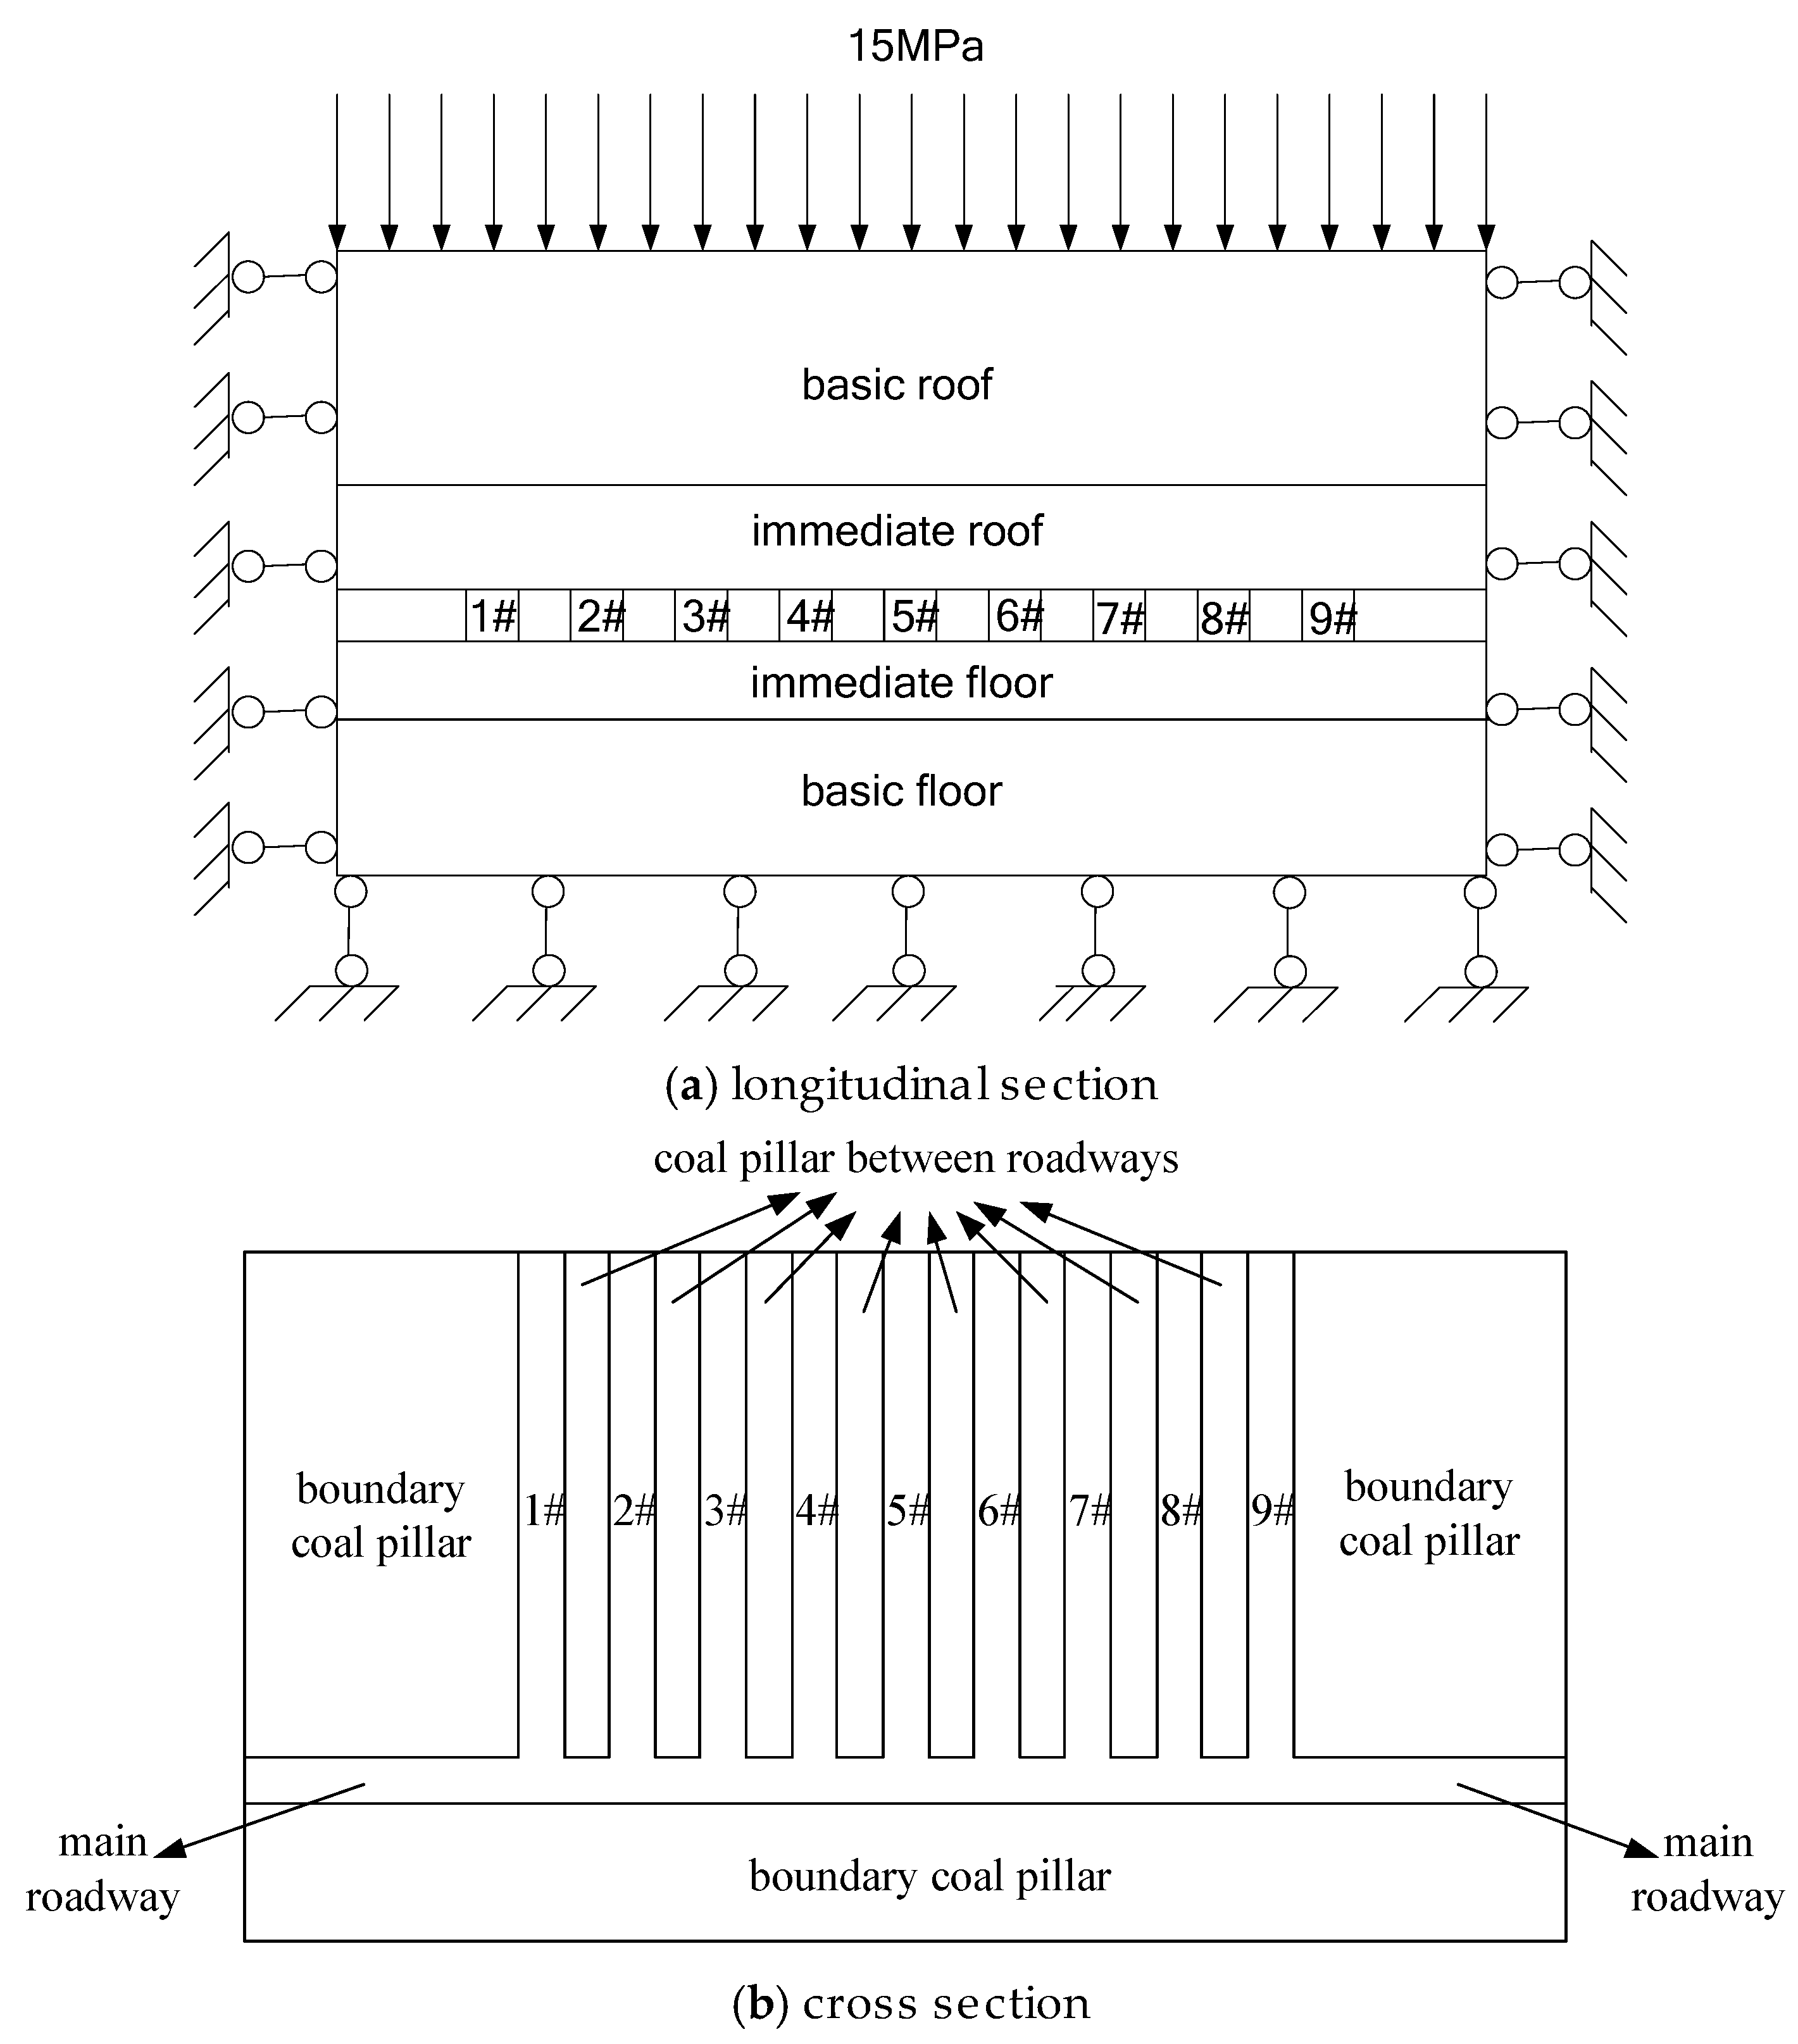
The influence rule of roadway driving sequence on the rockburst risk of a coal pillar is investigated, and the numerical calculation model of roadway backfilling mining is established on the basis of the geological conditions of Wulan coal mine (Figure 4). This area has a main roadway for transmitting coal and nine backfilling roadways for excavating coal. The backfilling roadways are identified as 1# to 9# from left to right. The width of the coal pillar and the roadway are 5 m, and the height of the roadway is 6 m. Meanwhile, the length and width of the numerical model are 185 m and 100 m, respectively, and the main roadway width is 5 m. The mechanical parameters of each single strata in the numerical model and the backfilling mass, which are based on the geological and mining conditions of the coal seam, are shown in Table 1.
The boundary conditions of numerical model are set so that the upper boundary of the numerical model is free face. The uniform load of the overburden strata applied on the boundary is 15 MPa. The left and right sides of the numerical model restrict horizontal displacement, while the bottom part of the numerical model restricts vertical displacement.
In this numerical procedure, four kinds of numerical scheme are designed as follows:
- (1)
- In sequential mining, the driving sequence of the backfilling roadway is 1#, 2#, 3#, 4#, 5#, 6#, 7#, 8#, and 9#.
- (2)
- In one-roadway interval mining, the driving sequence of the backfilling roadway is 1#, 3#, 5#, 7#, 9#, 2#, 4#, 6#, and 8#.
- (3)
- In two-roadway interval mining, the driving sequence of the backfilling roadway is 1#, 4#, 7#, 2#, 5#, 8#, 3#, 6#, and 9#.
- (4)
- In three-roadway interval mining, the driving sequence of the backfilling roadway is 1#, 5#, 9#, 3#, 7#, 2#, 6#, 4#, and 8#.
In addition, before the next roadway is excavated, the previous roadway should be backfilled.
4.2. Sequential Mining Scheme
In the sequential mining scheme of the roadway backfilling mining technology, one cycle is sufficient to finish the mining and backfilling work.
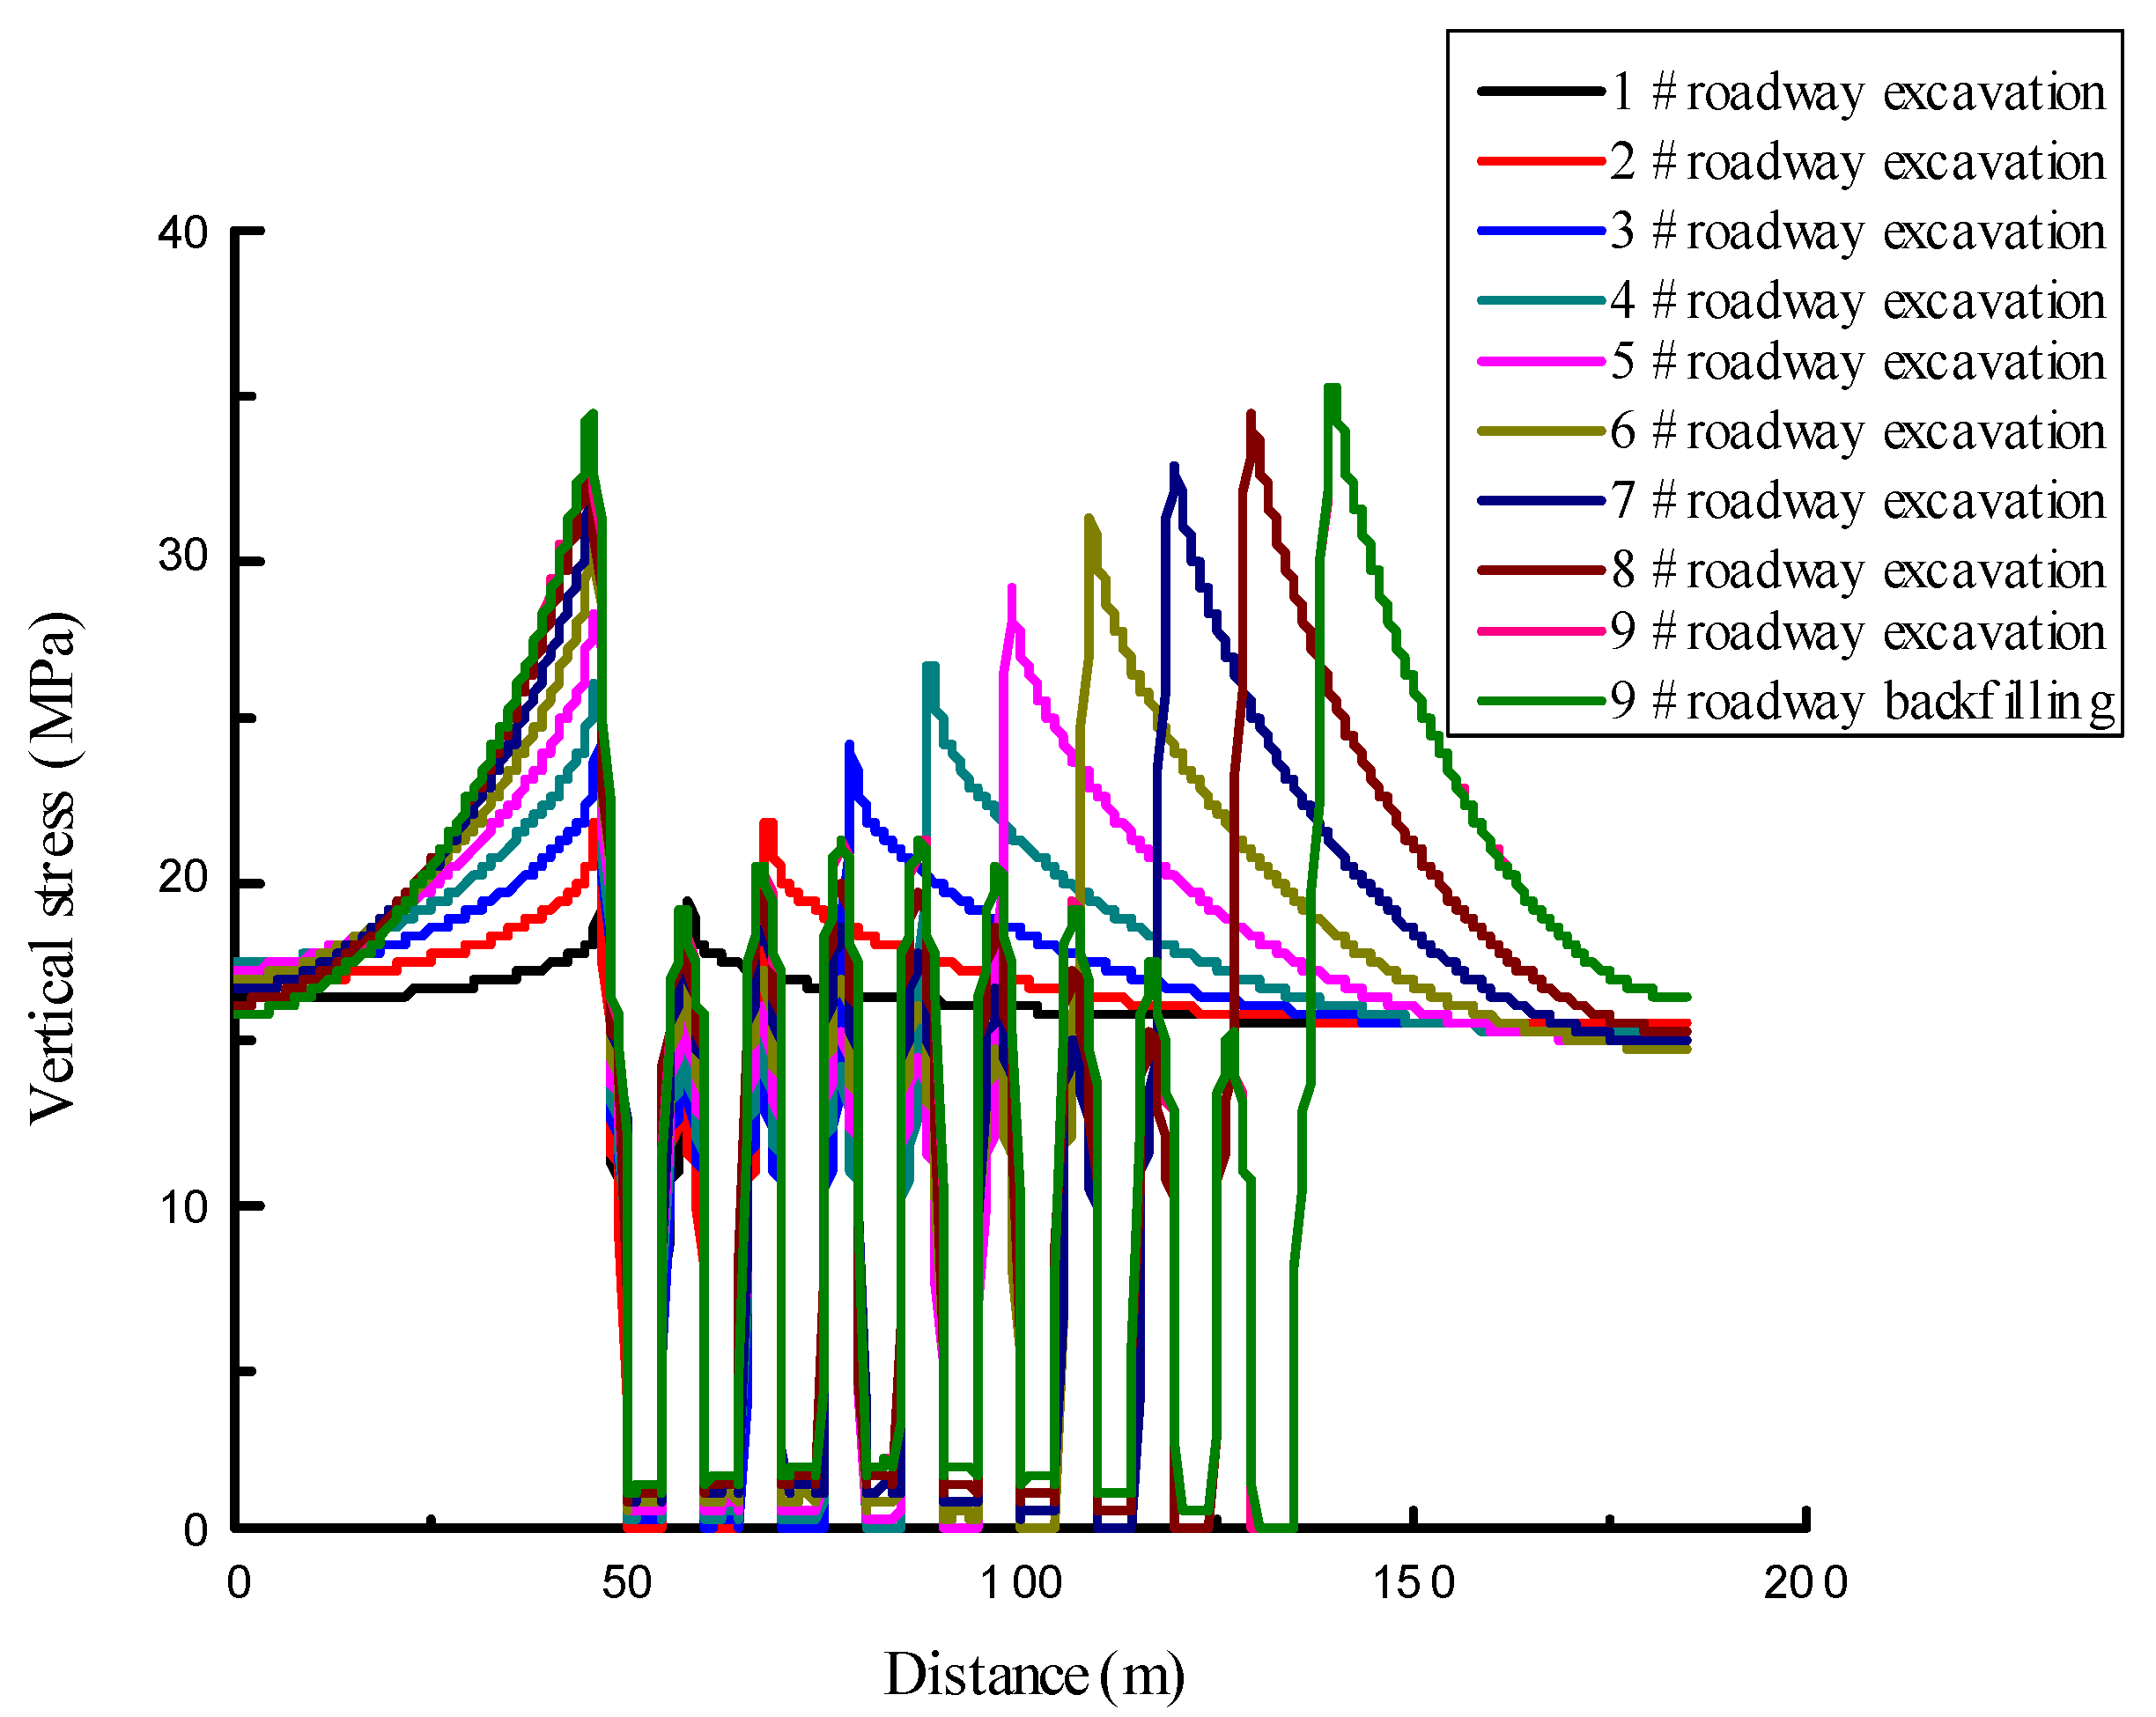
The vertical stress curve of the surrounding rock of a roadway in the sequential mining scheme is shown in Figure 5. The maximum vertical stress of the surrounding rock is 35.25 MPa, which occurs in the excavation of 9# roadway. The position is located at the right side of the roadway, and the x coordinate value is 139.57 m. It is obvious that the rockburst risk of coal pillars is the maximum in the excavation of 9# roadway in the sequential mining scheme.
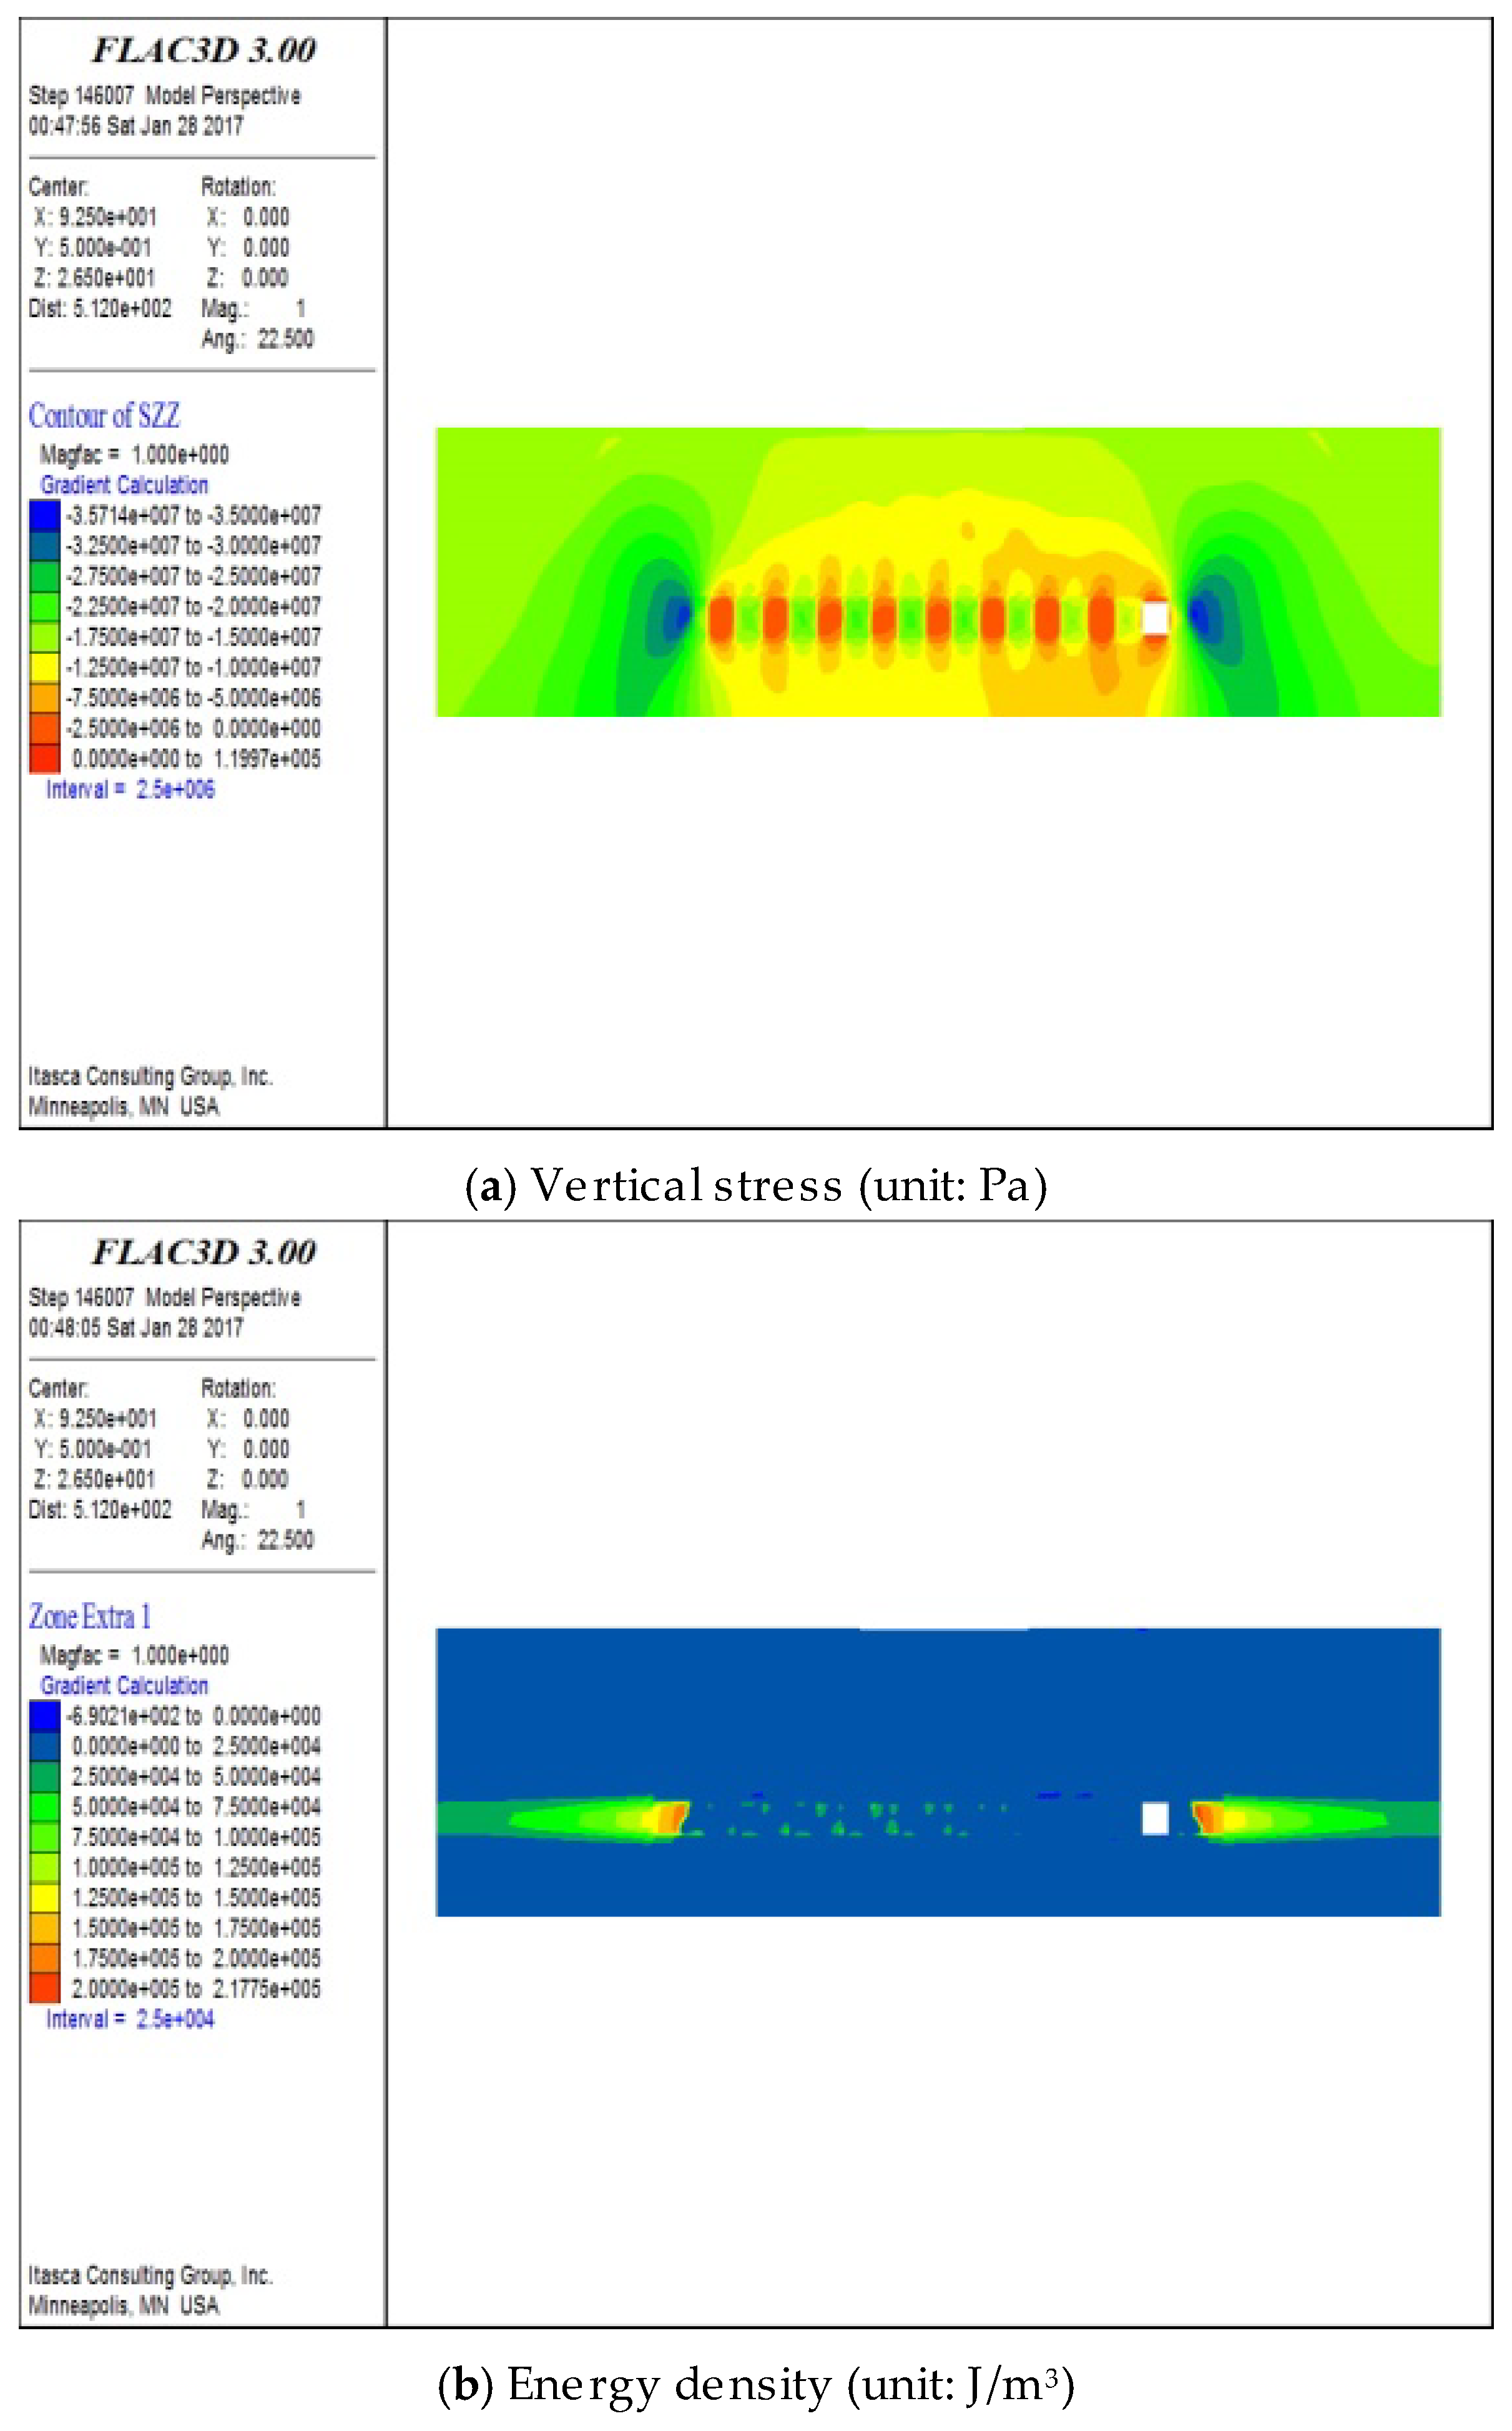
The vertical stress and energy density contour of the surrounding rock in 9# roadway excavation in sequential mining is shown in Figure 6, while the energy density factor value of the surrounding rock in this scheme is shown in Table 2. The maximum density value of the surrounding rock is 228,029 J/m3, which occurs in the excavation of 9# roadway. The position is located at the right side of the roadway, and the x coordinate value 139.64 m. Thus, distance d is 4.64 m.
4.3. One-Roadway Interval Mining Scheme
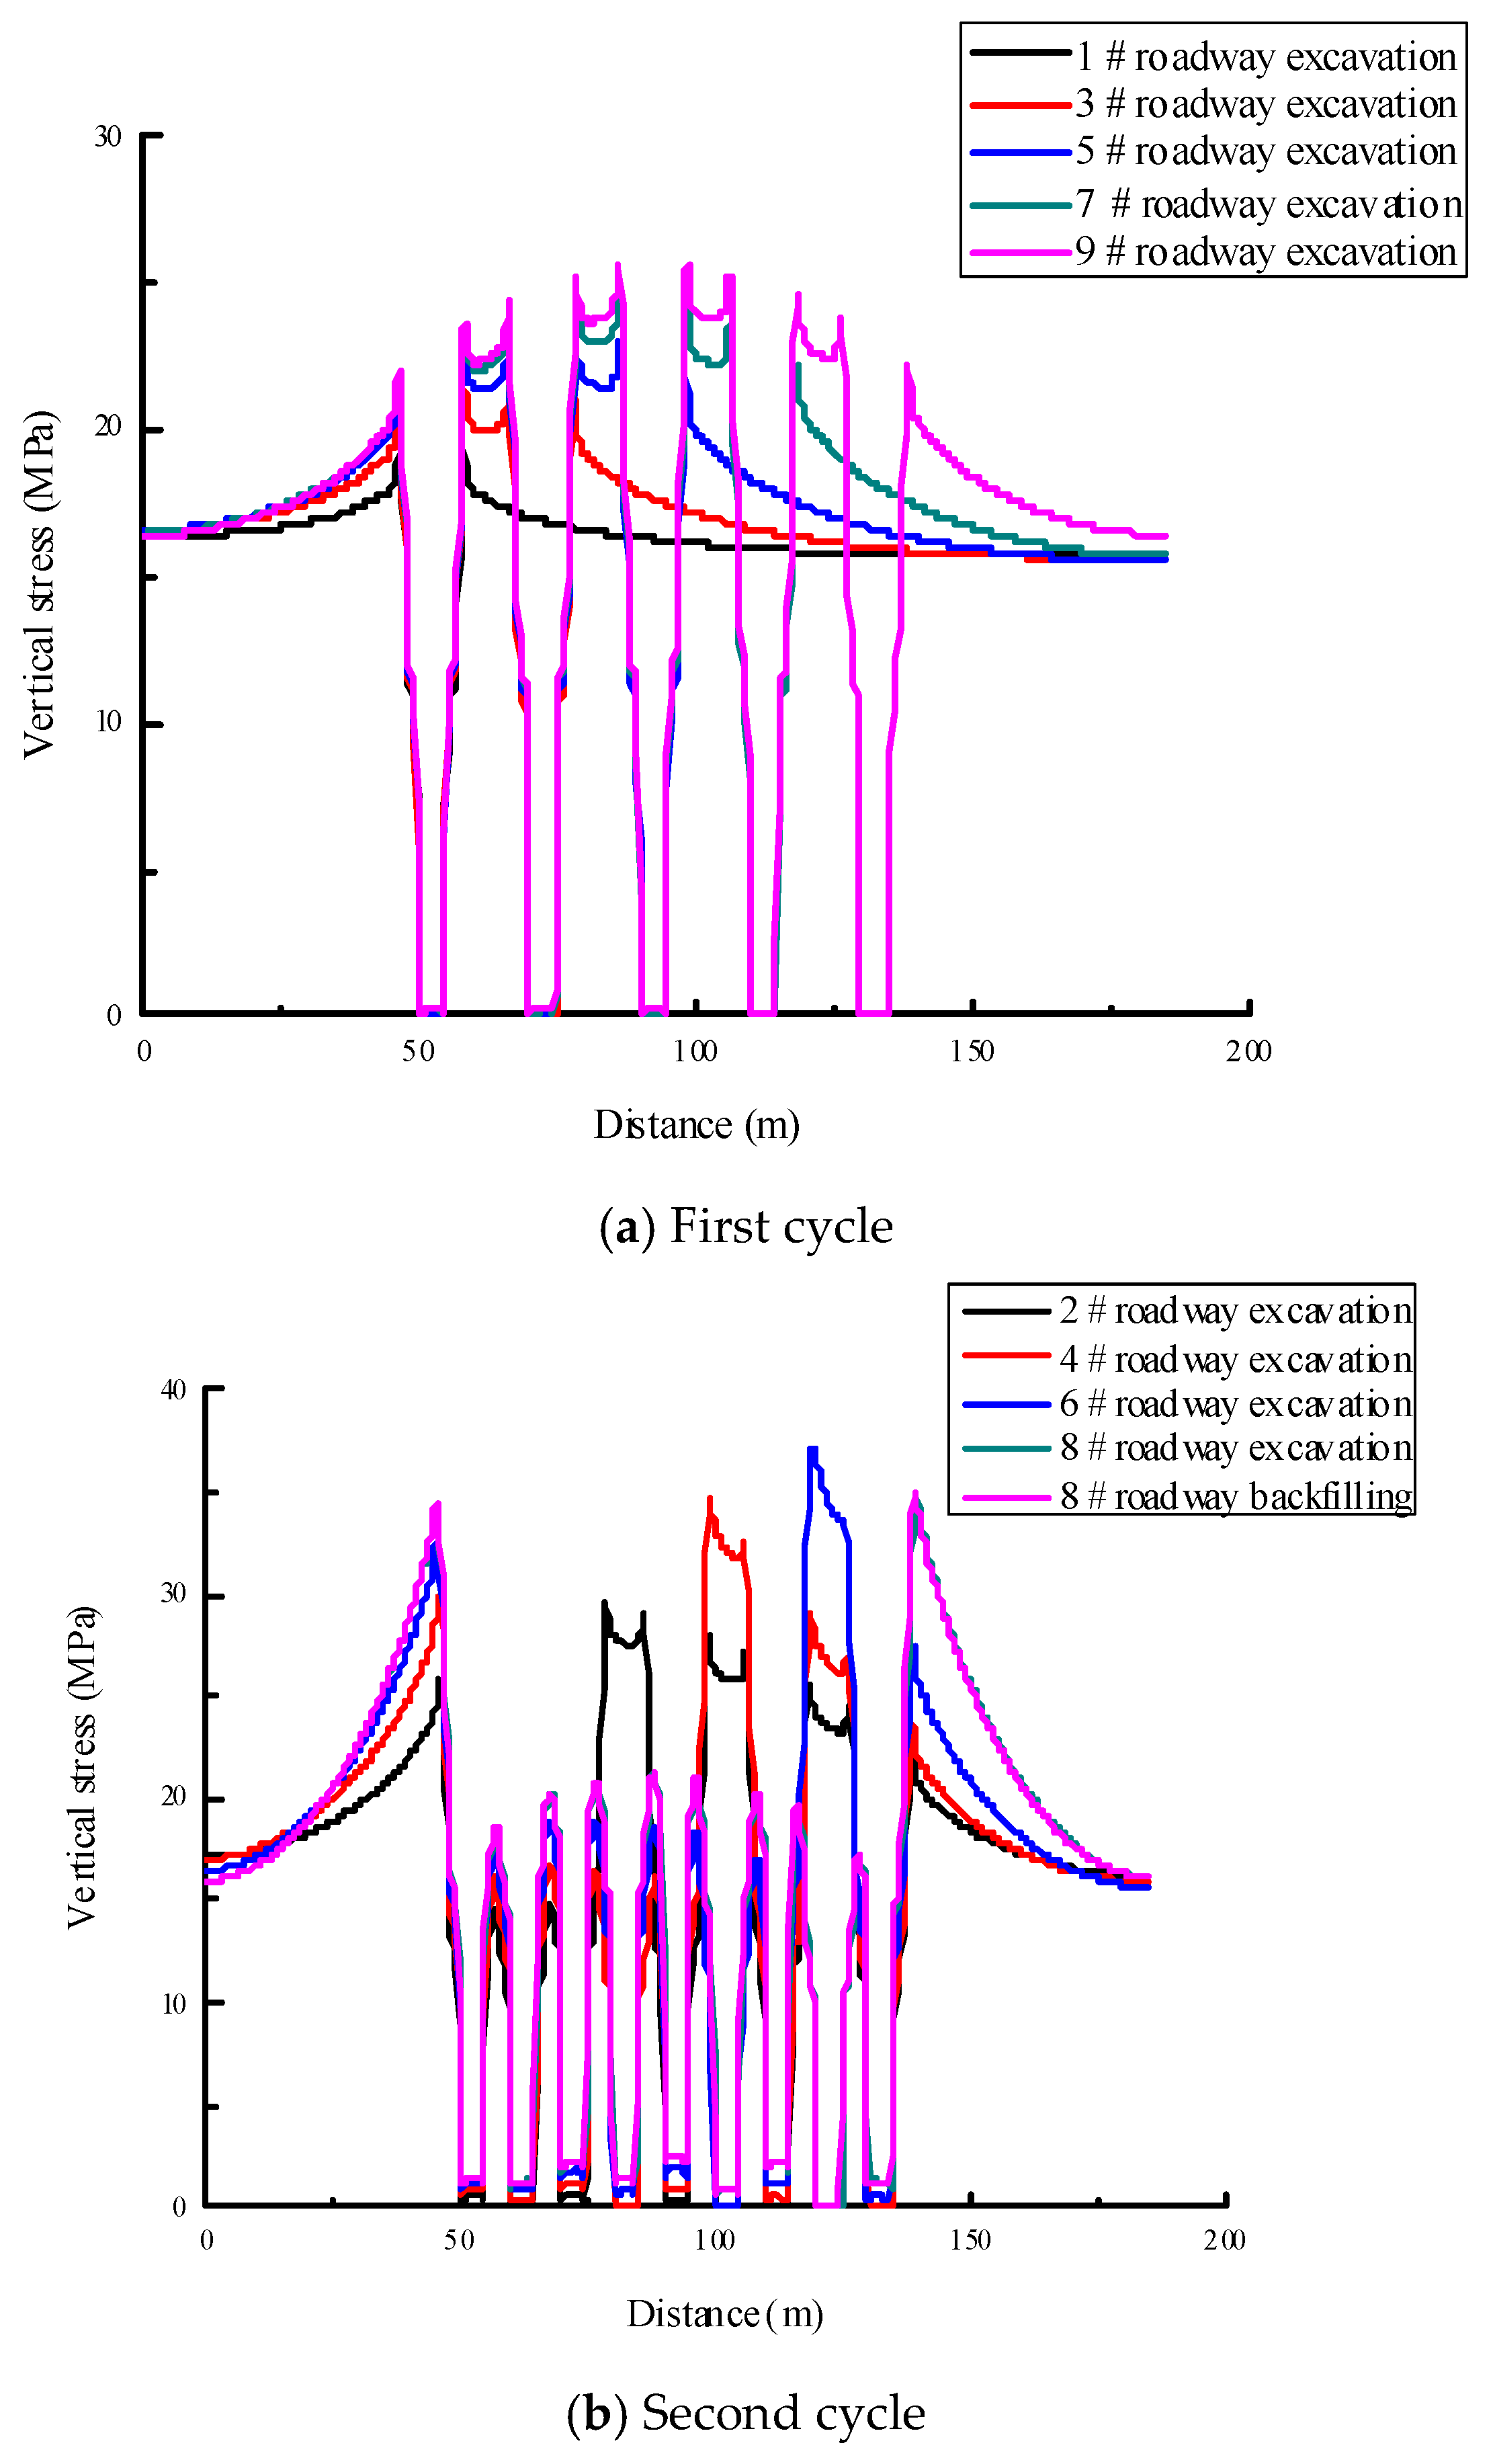
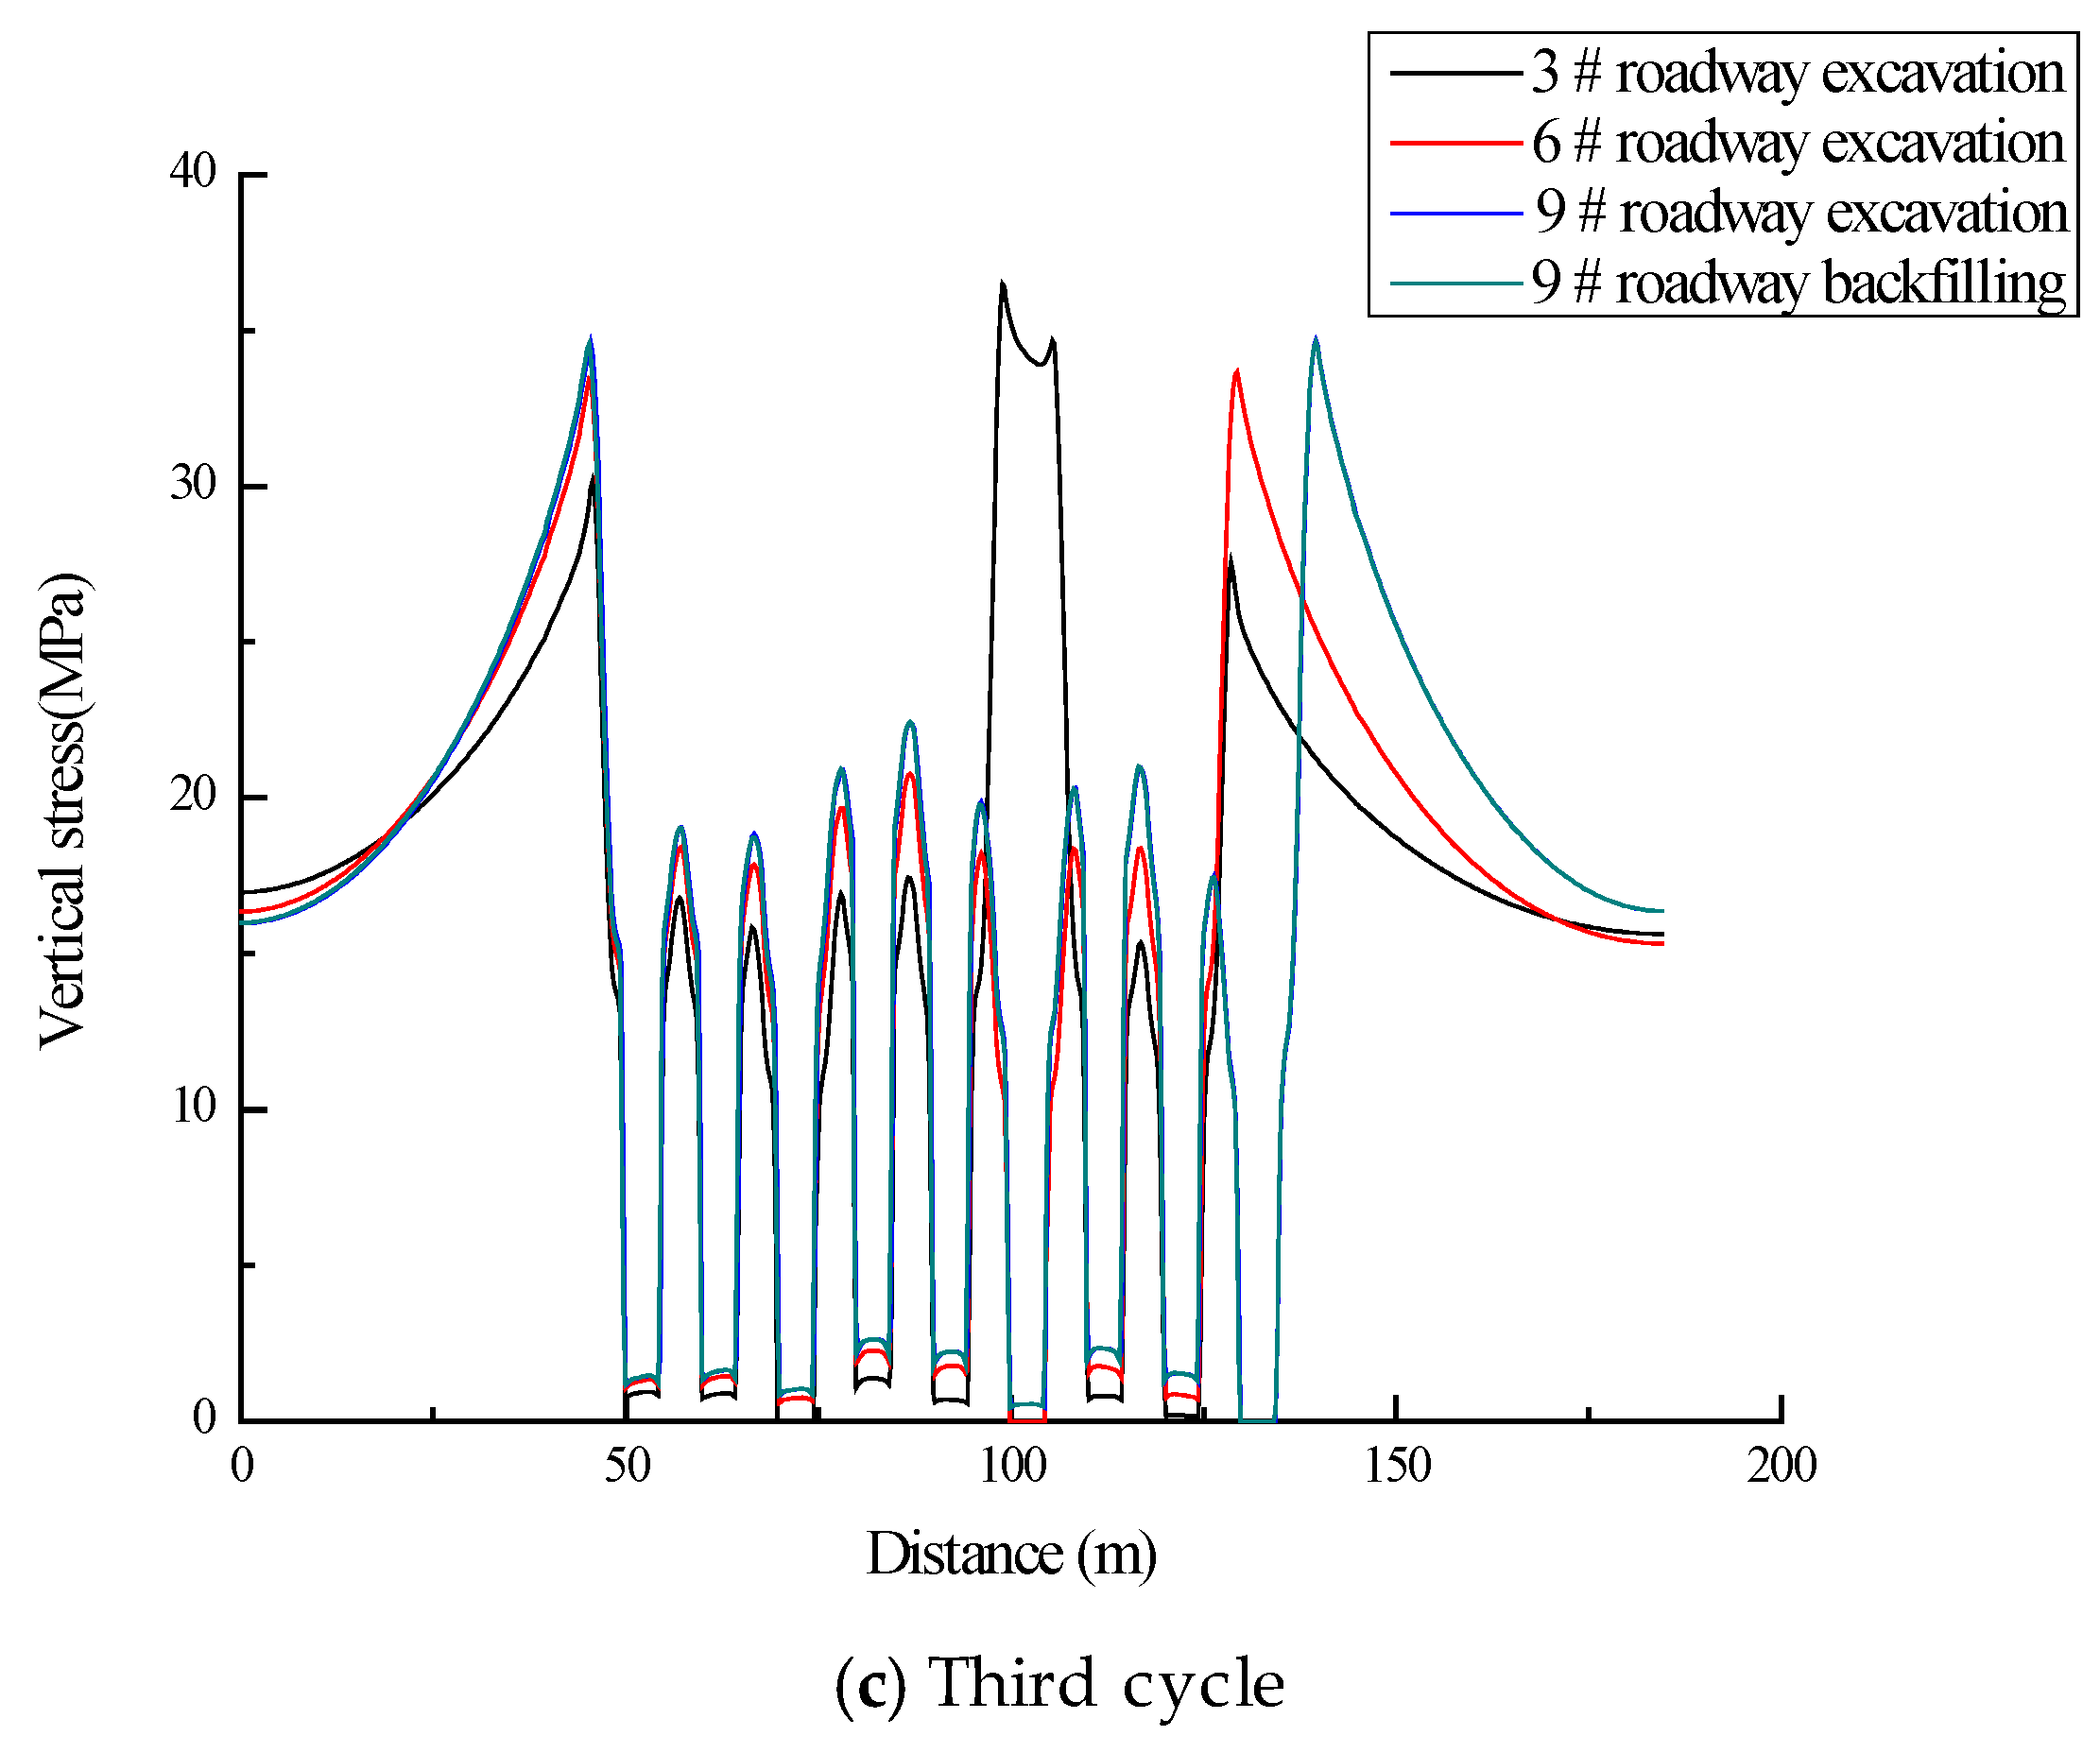
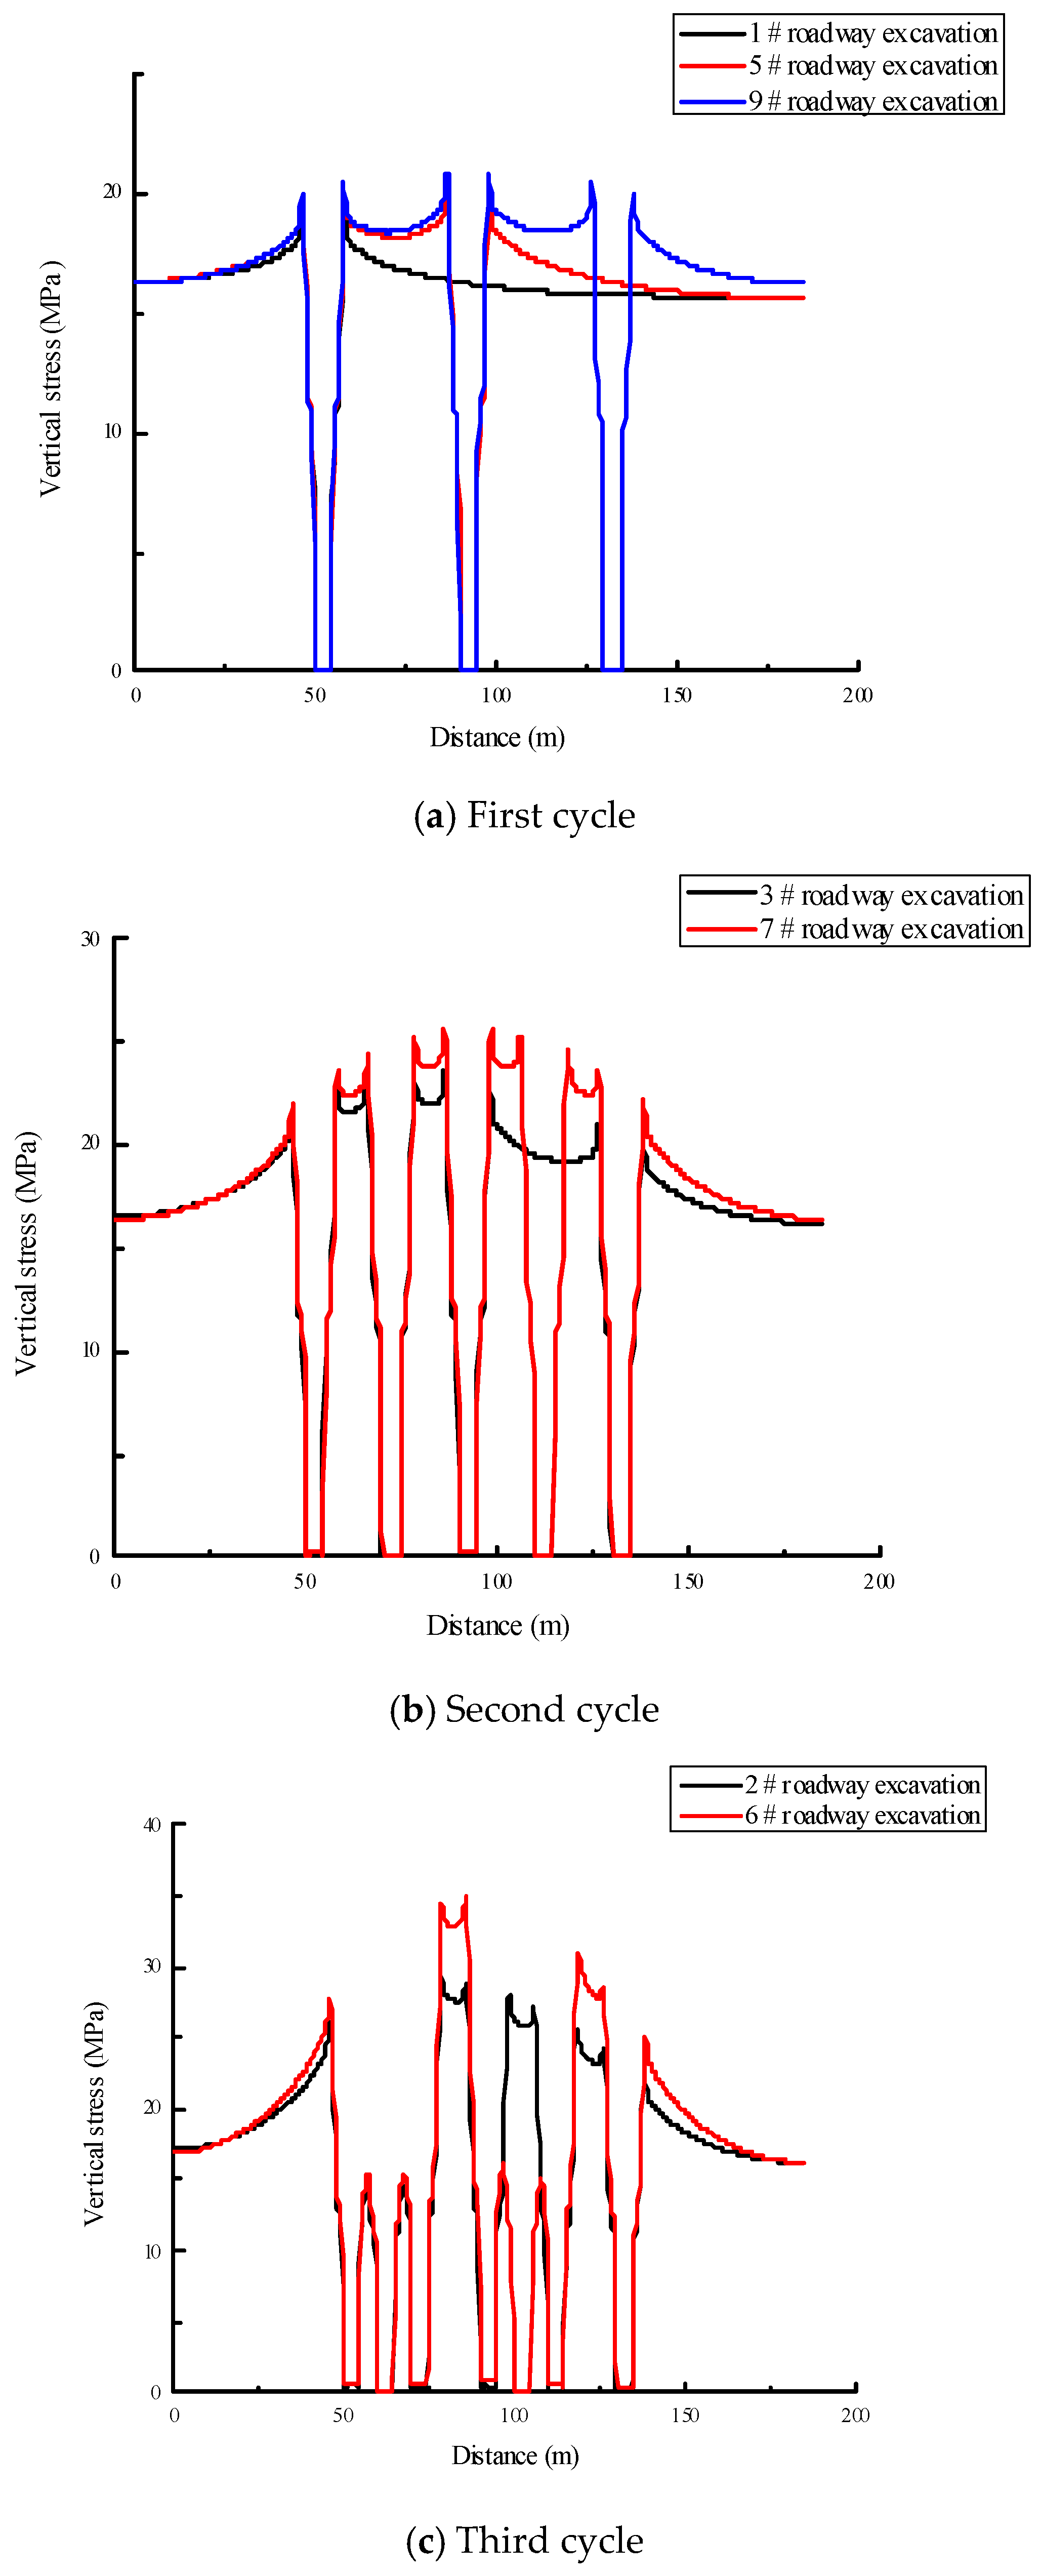
In the one-roadway interval mining scheme of the roadway backfilling mining technology, two cycles are needed to finish the mining and backfilling work. In particular, the first cycle involves 1#, 3#, 5#, 7#, and 9#, while the second cycle involves 2#, 4#, 6#, and 8#. The vertical stress curve of the surrounding rock of a roadway in the one-roadway interval mining scheme is shown in Figure 7. The maximum vertical stress of the surrounding rock is 37.14 MPa, which occurs in the excavation of 6# roadway in the second cycle. The position is located at the right side of the roadway, and the x coordinate value is 119.10 m. Besides, the maximum vertical stress of the surrounding rock in the first cycle is 25.08 MPa, which occurs in the excavation of 9# roadway. It is obvious that the rockburst risk of coal pillars is the maximum in the excavation of 6# roadway in the second cycle in the one-roadway interval mining scheme.
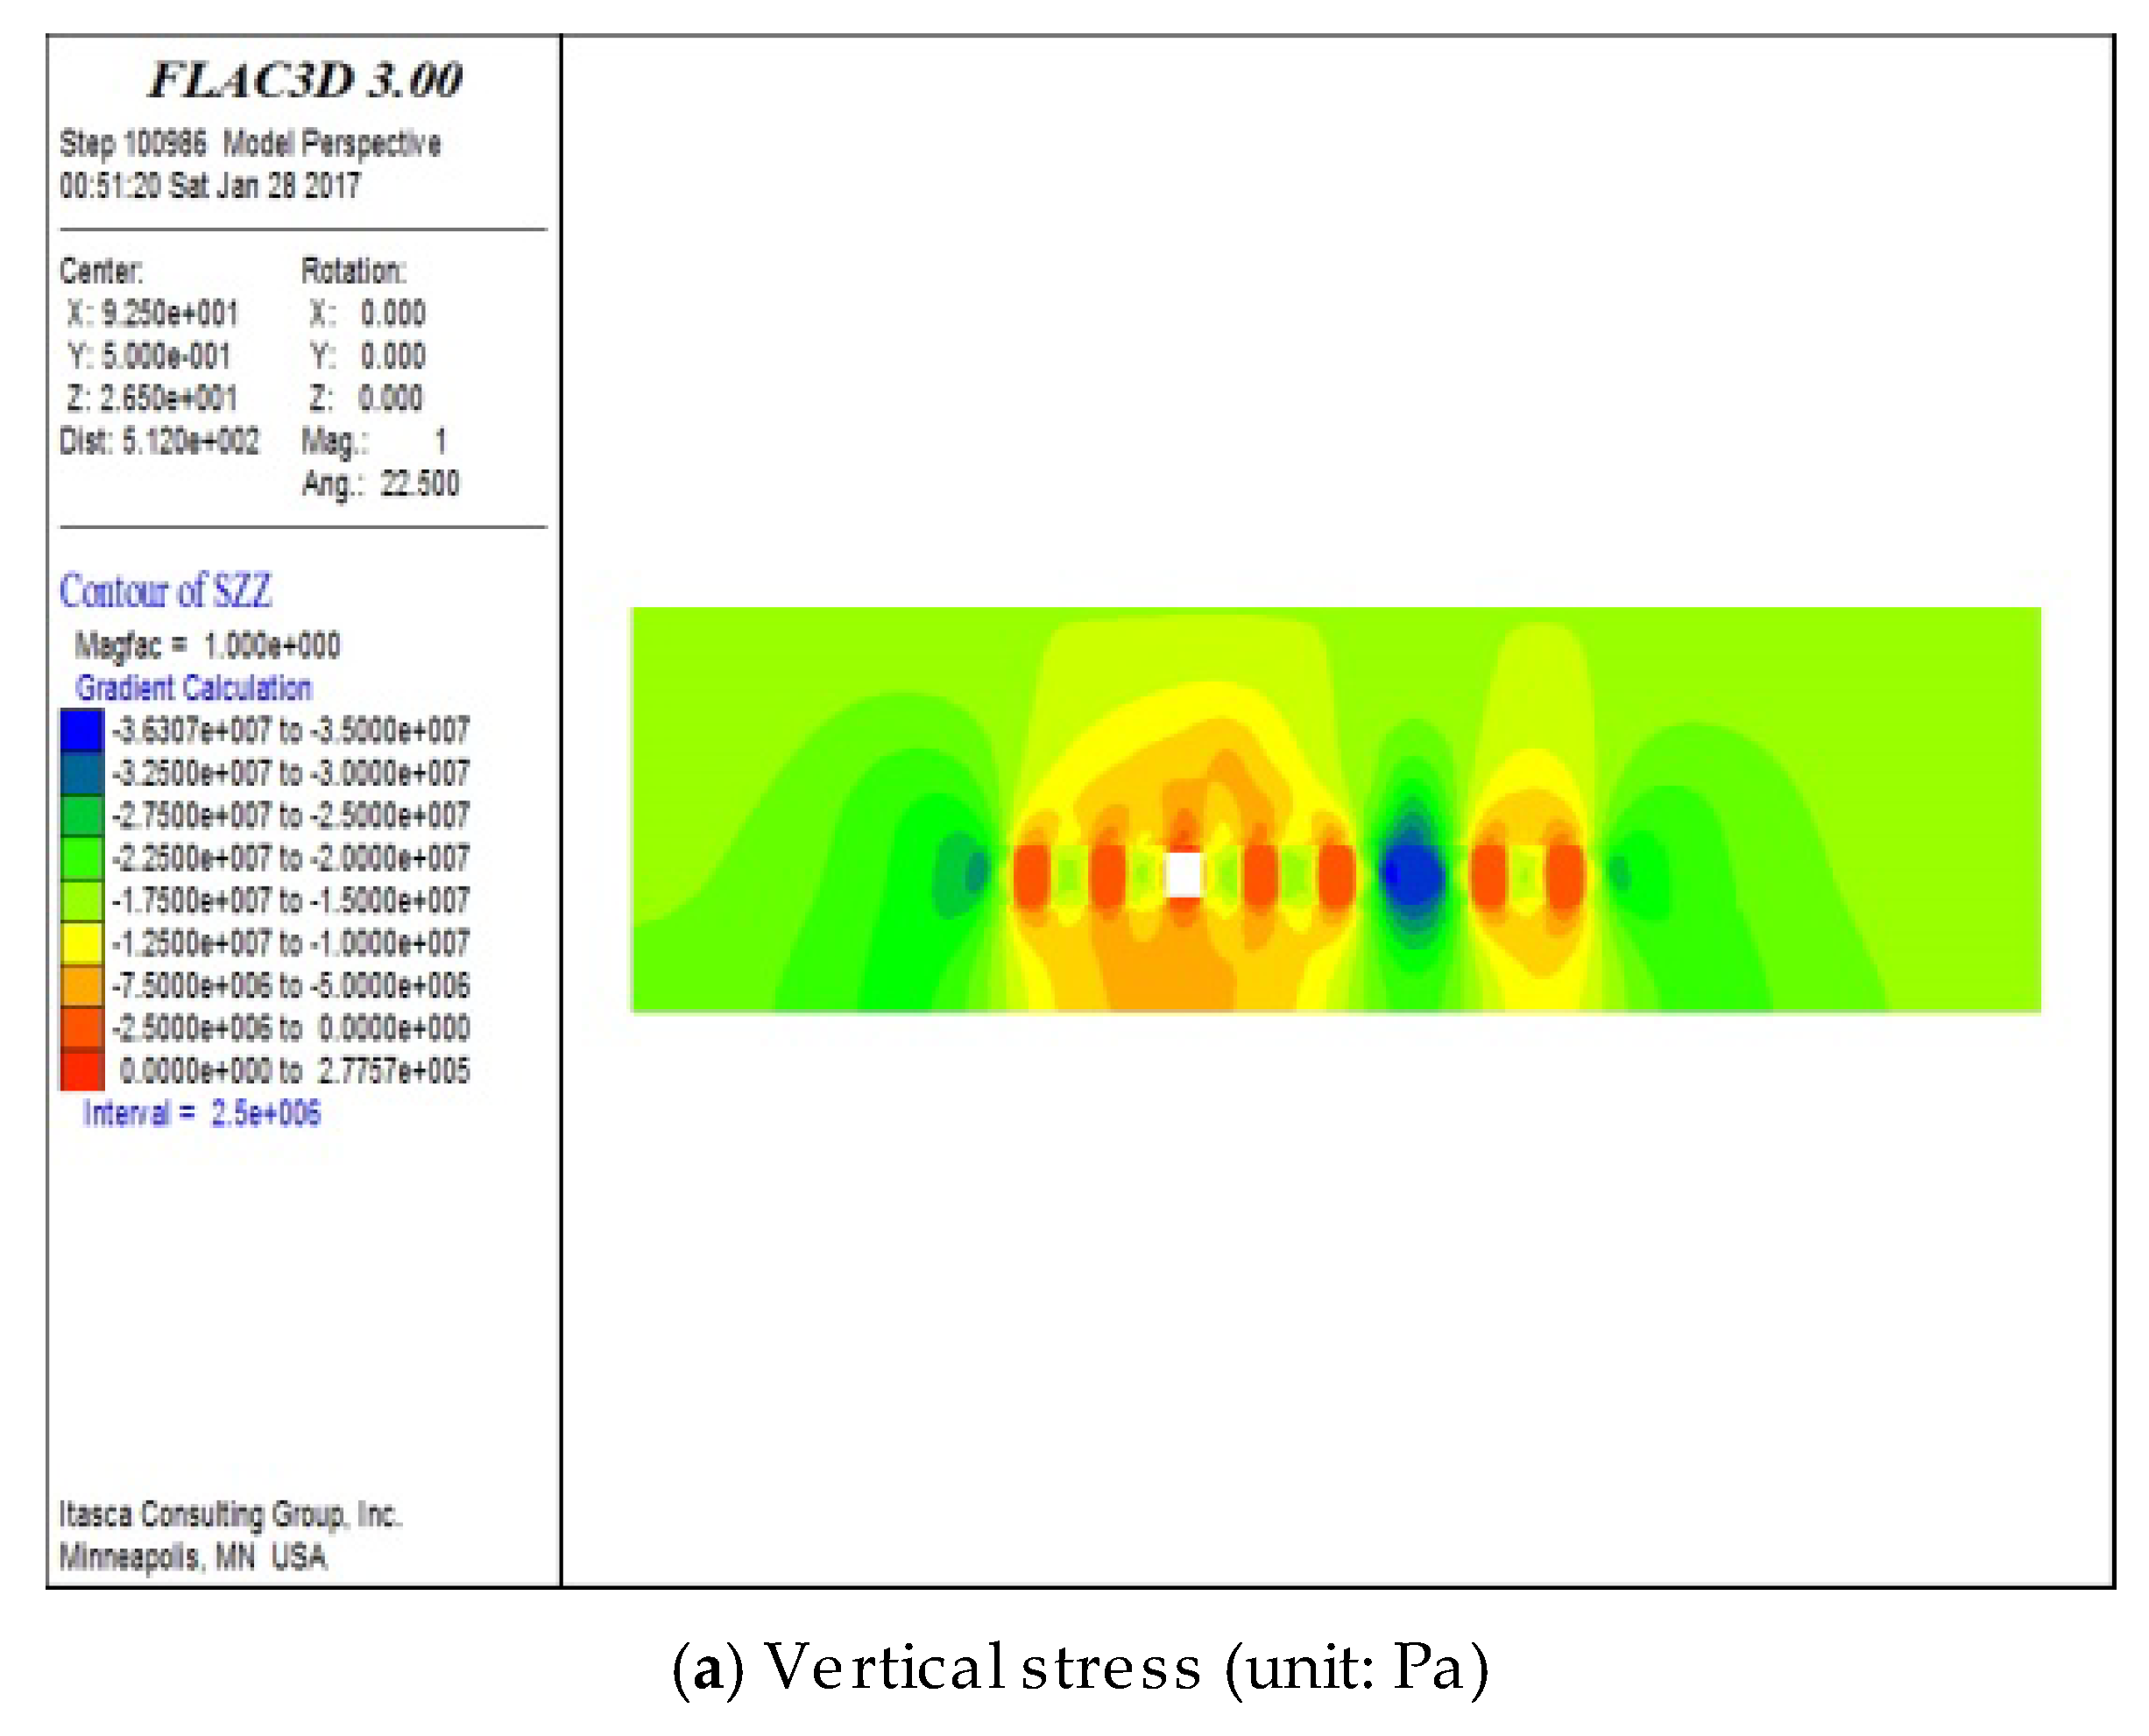
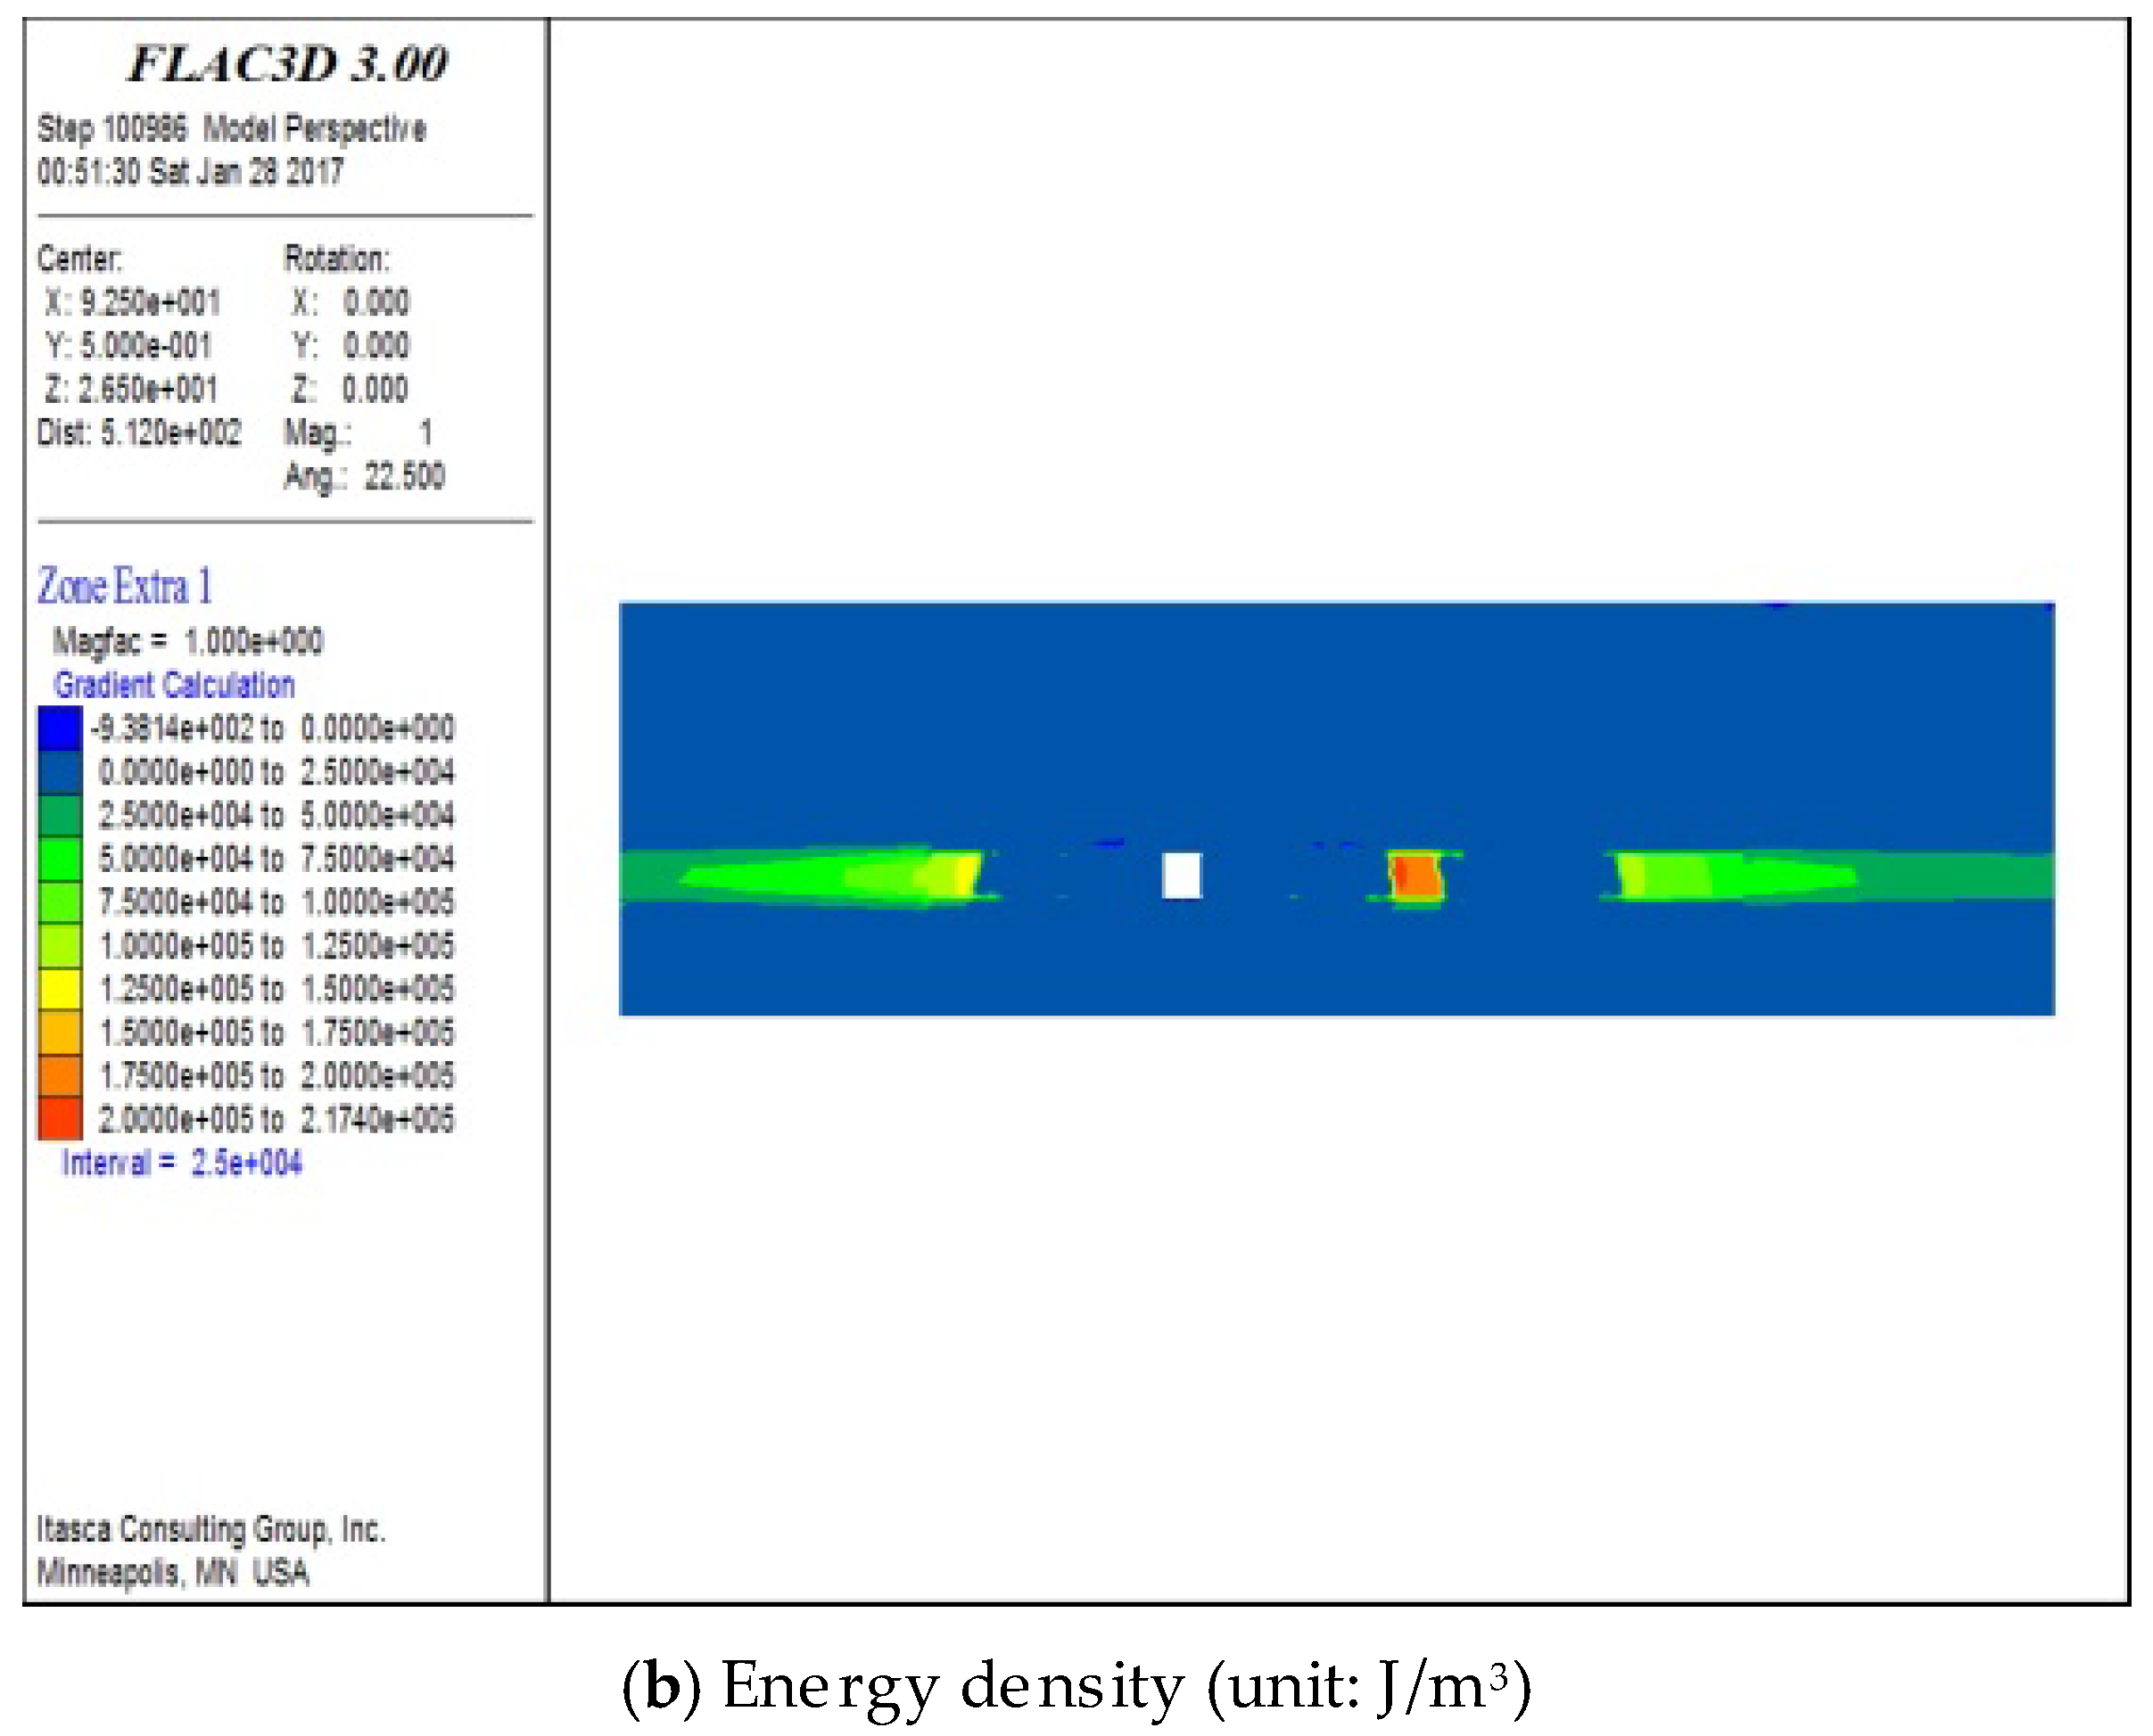
The vertical stress and energy density contour of the surrounding rock in 6# roadway excavation in sequential mining are shown in Figure 8. The energy density factor value of the surrounding rock in the one-roadway interval mining scheme is shown in Table 3. The maximum density value of the surrounding rock is 243,926 J/m3, which occurs in the excavation of 6# roadway in the second cycle. The position is located at the right side of the roadway, and the x coordinate value is 119.14 m. Thus, distance d is 14.14 m.
4.4. Two-Roadway Interval Mining Scheme
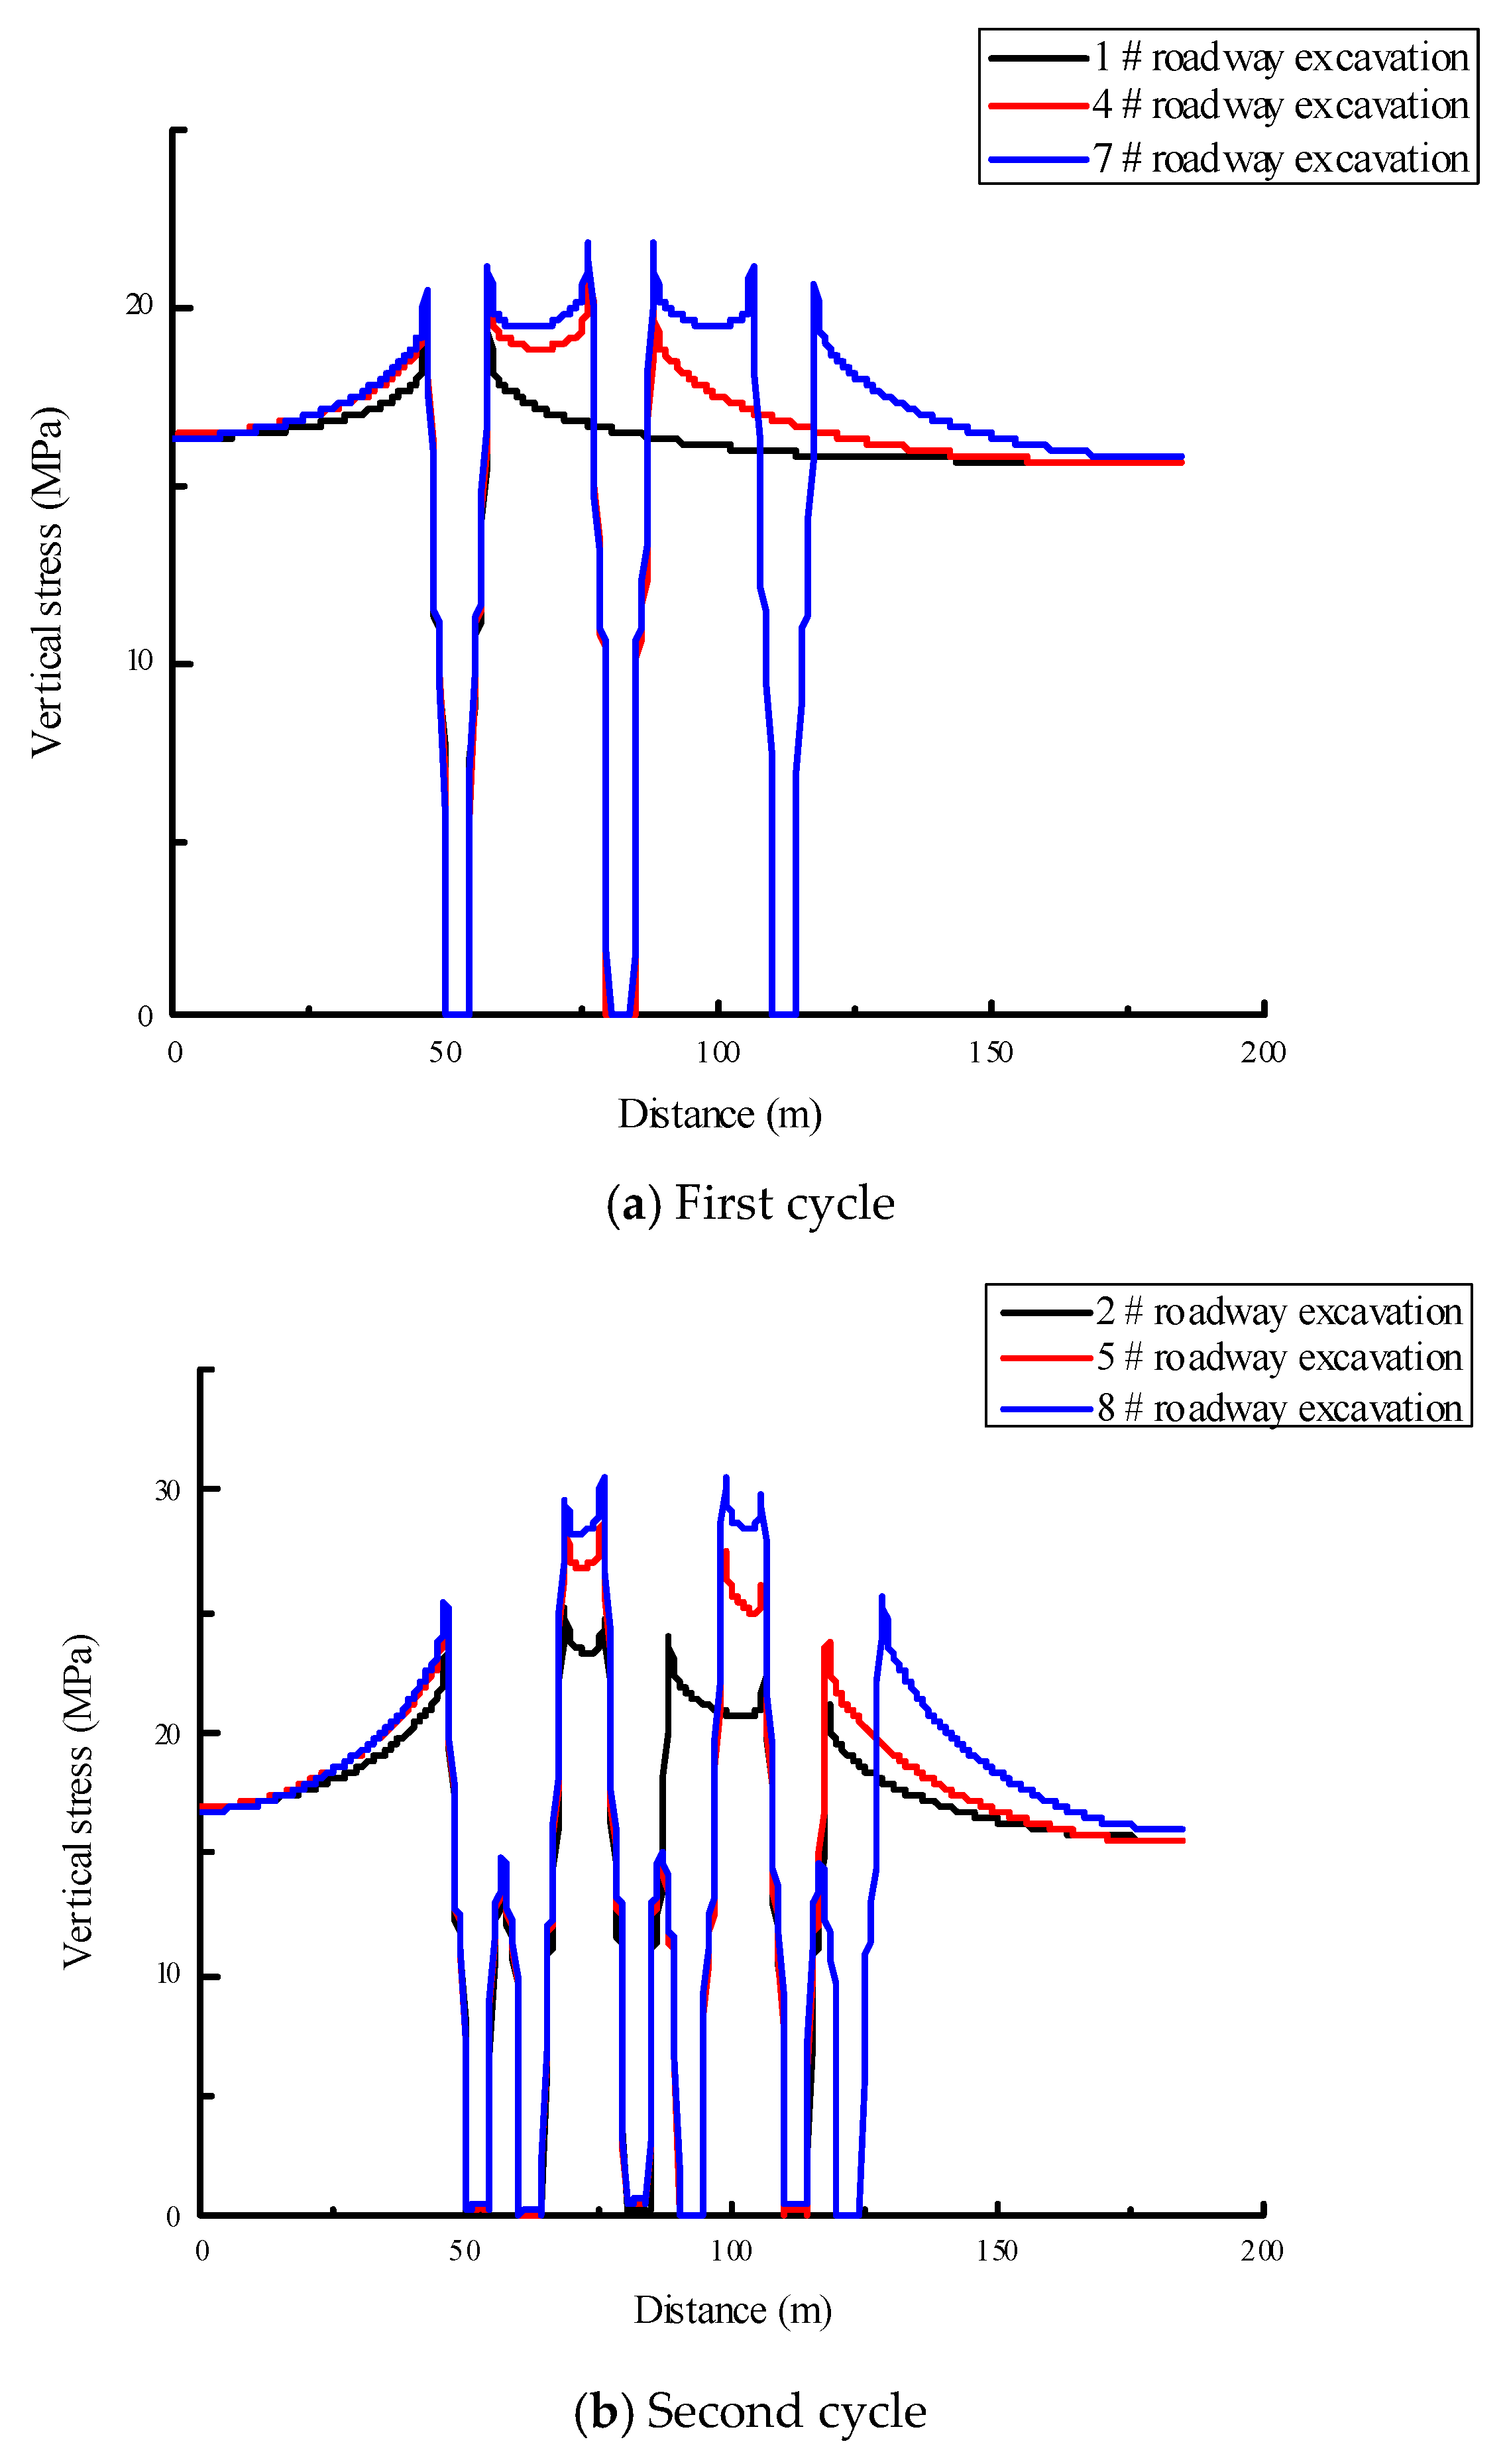
In the two-roadway interval mining scheme of the roadway backfilling mining technology, three cycles are needed to finish the mining and backfilling work. The first cycle involves 1#, 4#, and 7#; the second cycle involves 2#, 5#, and 8#; and the third cycle involves 3#, 6#, and 9#. The vertical stress curve of the surrounding rock of a roadway in the two-roadway interval mining scheme is shown in Figure 9. The maximum vertical stress of the surrounding rock is 36.48 MPa, which occurs in the excavation of 3# roadway in the third cycle. The position is located at the right side of the roadway, and the x coordinate value is 98.87 m. Besides, the maximum vertical stress of the surrounding rock in the first cycle is 22.13 MPa, which occurs in the excavation of 7# roadway; the maximum vertical stress of the surrounding rock in the second cycle is 30.02 MPa, which occurs in the excavation of 8# roadway. It is obvious that the rockburst risk of coal pillars is the maximum in the excavation of 3# roadway in the third cycle in the two-roadway interval mining scheme.
The vertical stress and energy density contour of the surrounding rock in 3# roadway excavation in sequential mining are shown in Figure 10. The energy density factor value of the surrounding rock in the two-roadway interval mining scheme is shown in Table 4. The maximum density value of the surrounding rock is 225,925 J/m3, which occurs in the excavation of 3# roadway in the third cycle. The position is located at the right side of the roadway, and the x coordinate value is 99.38 m. Thus, distance d is 24.38 m.
4.5. Three-Roadway Interval Mining Scheme
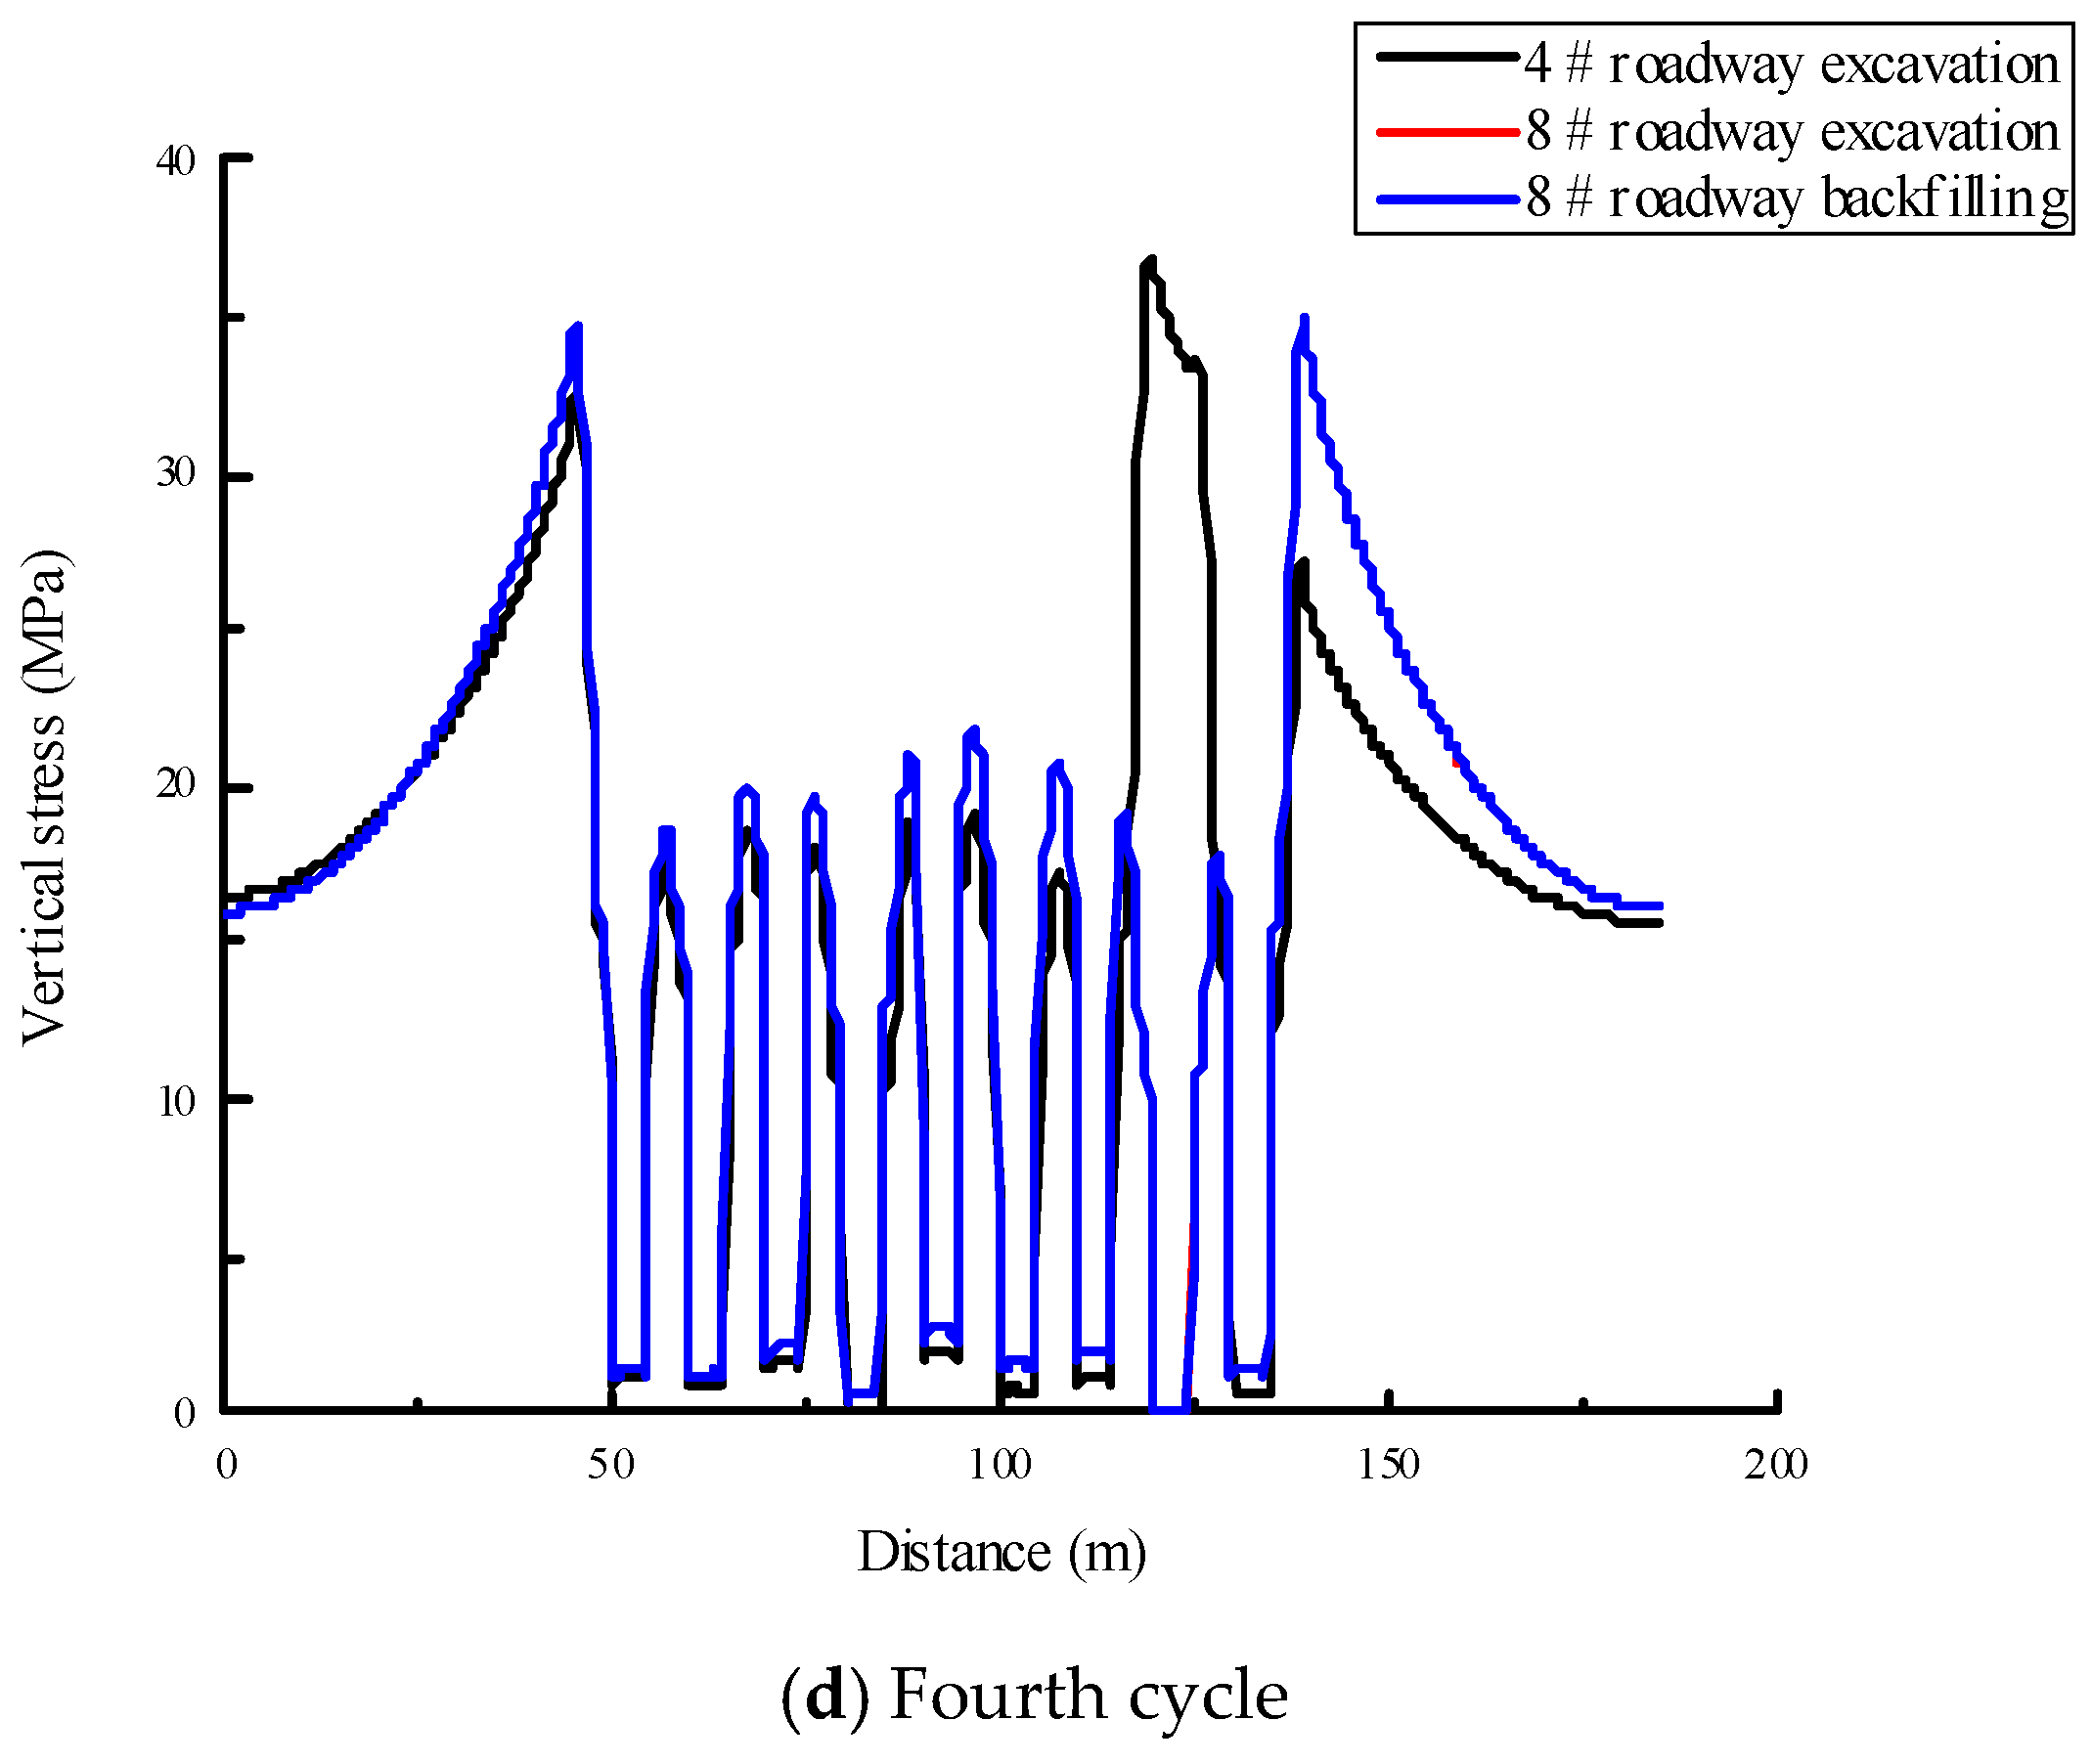
In the three-roadway interval mining scheme of roadway backfilling mining technology, four cycles are needed to finish the mining and backfilling work. The first cycle involves 1#, 5#, and 9#; the second cycle involves 3# and 7#; the third cycle involves 2# and 6#; and the fourth cycle involves 4# and 8#. The vertical stress curve of the surrounding rock of a roadway in the three-roadway interval mining scheme is shown in Figure 11. The maximum vertical stress of the surrounding rock is 36.87 MPa, which occurs in the excavation of 4# roadway in the fourth cycle. The position is located at the right side of the roadway, and the x coordinate value is 119.35 m. Besides, the maximum vertical stress of the surrounding rock in the first cycle is 21.94 MPa, which occurs in the excavation of 9# roadway; the maximum vertical stress of the surrounding rock in the second cycle is 26.16 MPa, which occurs in the excavation of 7# roadway; the maximum vertical stress of the surrounding rock in the third cycle is 35.17 MPa, which occurs in the excavation of 6# roadway. It is obvious that the rockburst risk of coal pillars is at its maximum in the excavation of 4# roadway in the fourth cycle in the three-roadway interval mining scheme.
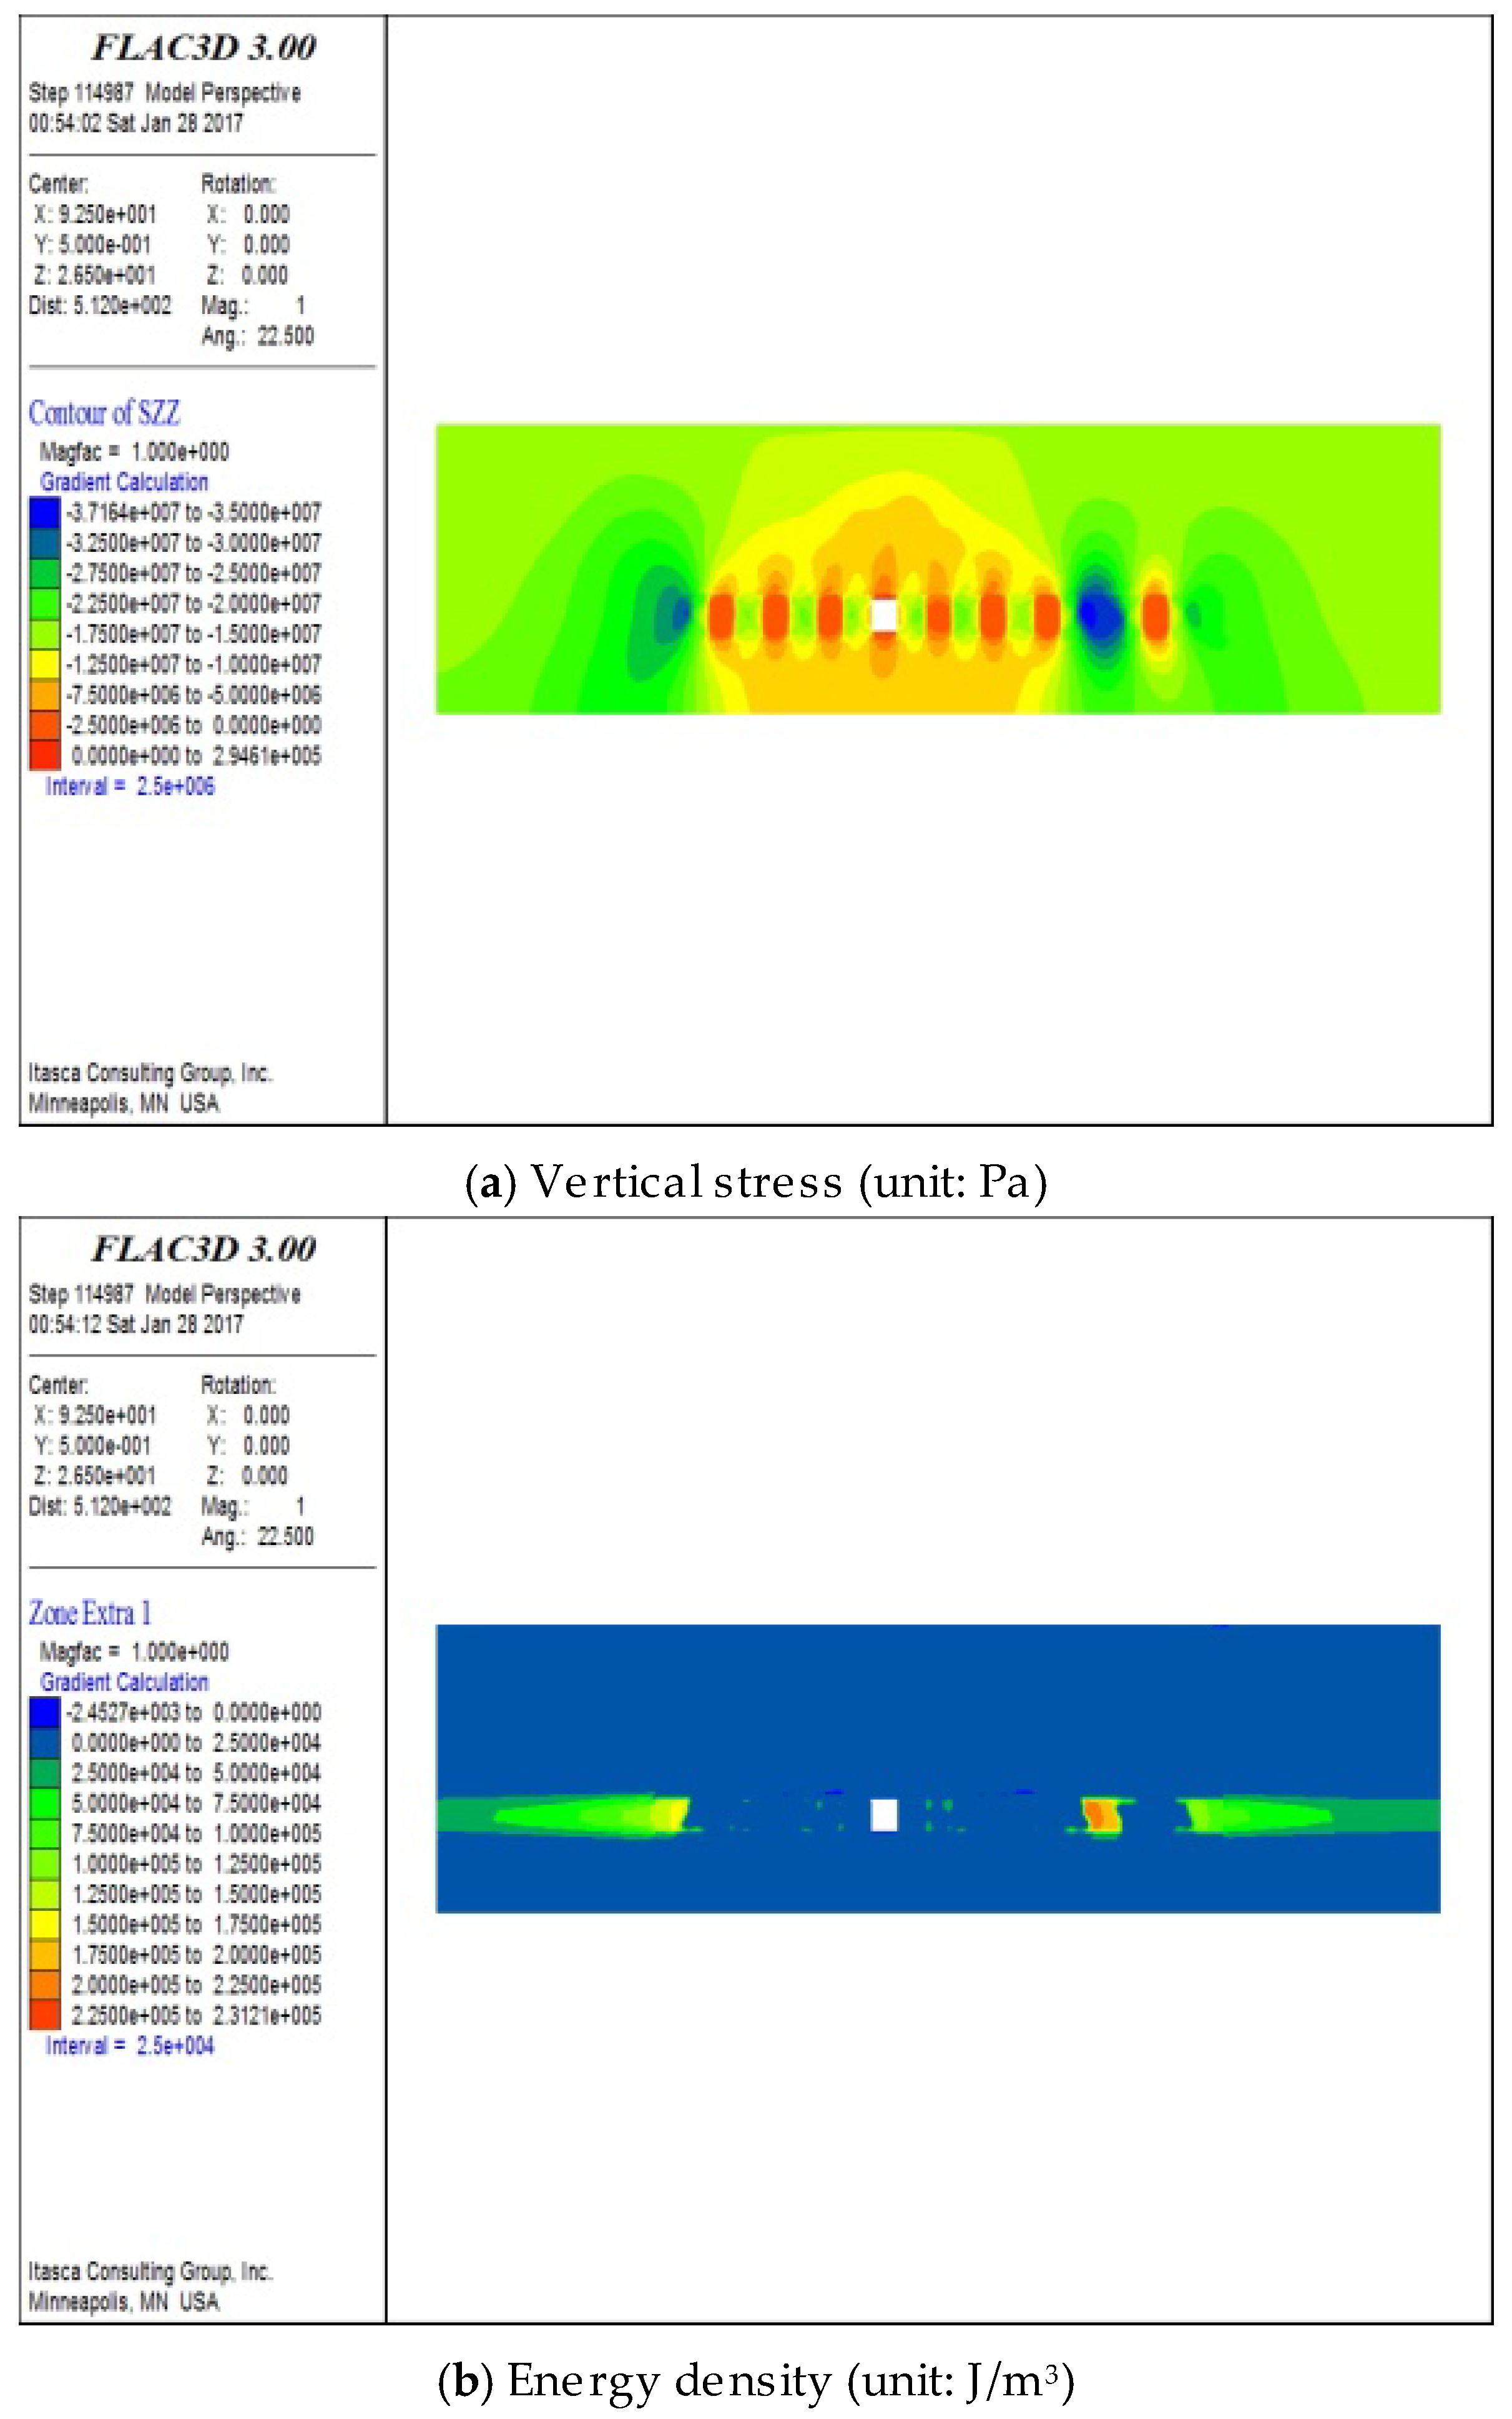
The vertical stress and energy density contour of the surrounding rock in 4# roadway excavation in sequential mining are shown in Figure 12. The energy density factor value of the surrounding rock in the three-roadway interval mining scheme is shown in Table 5. The maximum density value of the surrounding rock is 238,839 J/m3, which occurs in the excavation of 4# roadway in the fourth cycle. The position is located at the right side of the roadway, and the coordinate value is 119.39 m. Thus, distance is 34.39 m.
4.6. Calculation Results and Analysis
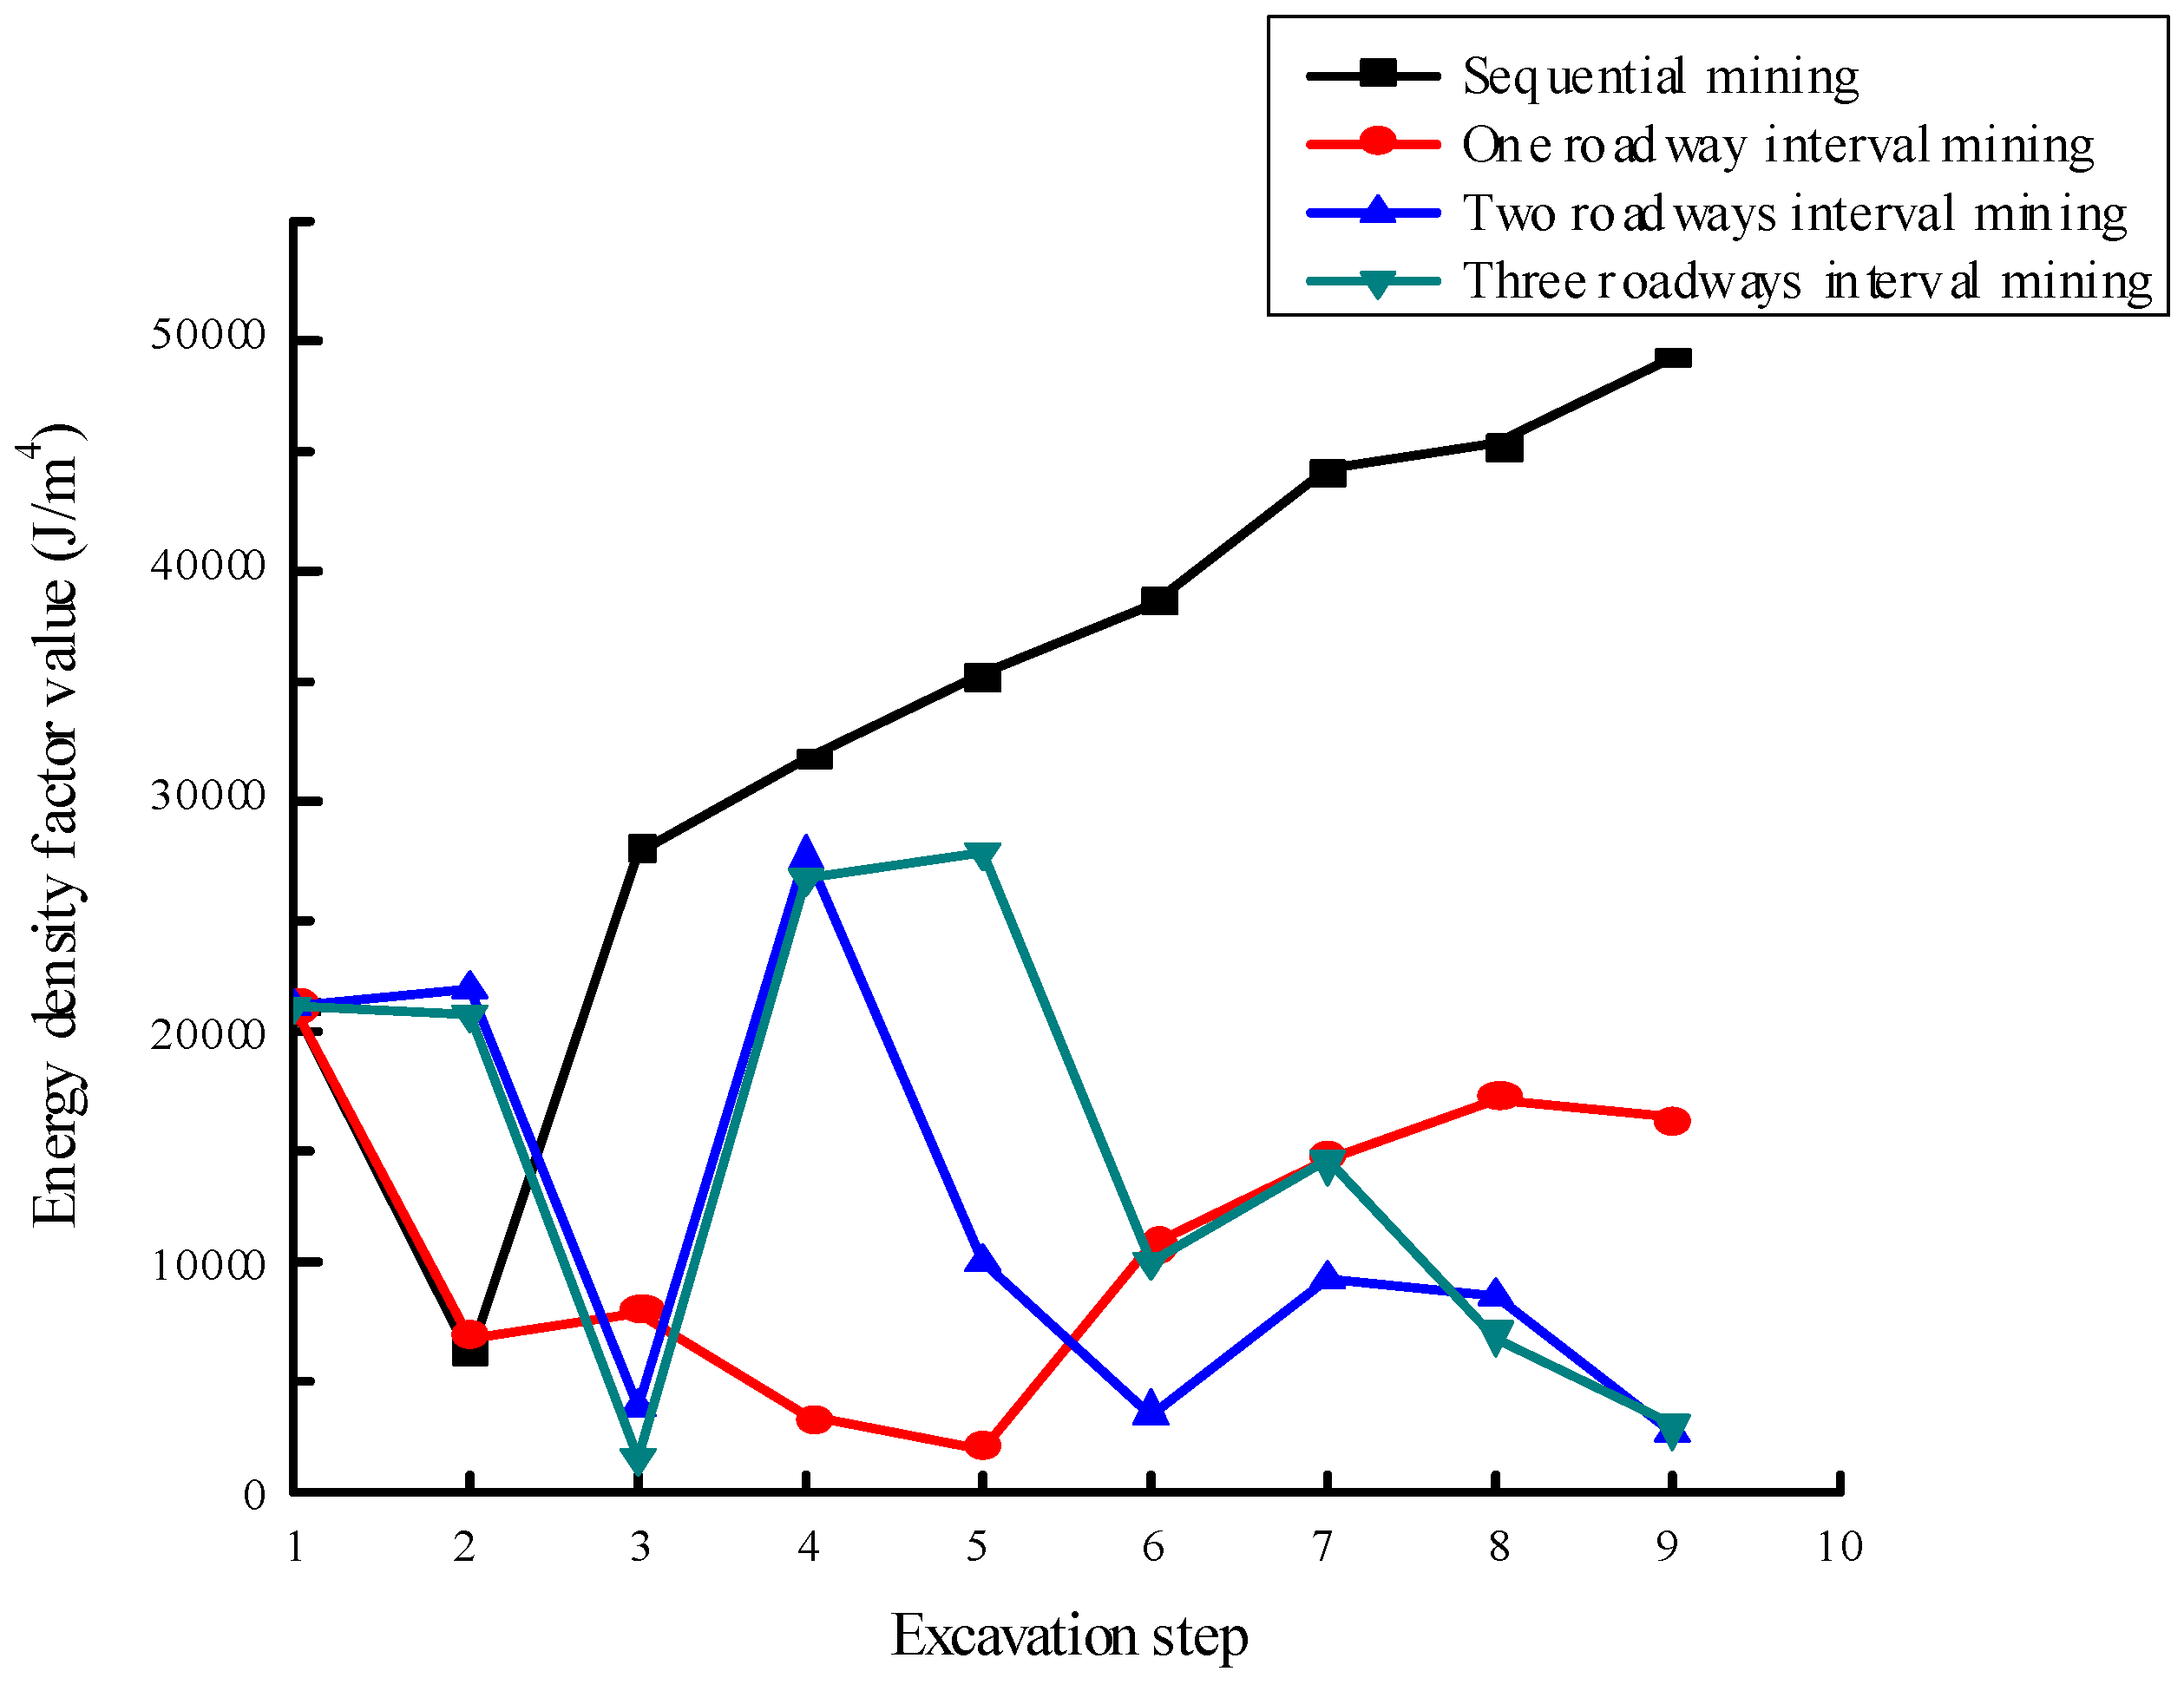
On the basis of the energy density factor values of the surrounding rock of the roadway for the four schemes (Table 2, Table 3, Table 4 and Table 5) and the excavation step in each scheme for roadway backfilling mining, which is identified by their respective numbers, the change rule of the energy density factor of the surrounding rock in these schemes is obtained (Figure 13).
The maximum energy density factor value of the surrounding rock in the sequential mining scheme is 49,144 J/m4 (Table 2), and the largest rockburst risk occurs in the excavation of 9# roadway. The maximum energy density factor value of the surrounding rock in the one-roadway interval mining scheme is 21,172 J/m4 (Table 3), and the largest rockburst risk occurs in the excavation of 1# roadway in the first cycle. The maximum energy density factor value of the surrounding rock in the two-roadway interval mining scheme is 27,627 J/m4 (Table 4), and the largest rockburst risk occurs in the excavation of 2# roadway in the second cycle. The maximum energy density factor value of the surrounding rock in the three-roadway interval mining scheme is 27,710 J/m4 (Table 5), and the largest rockburst risk occurs in the excavation of 7# roadway in the second cycle.
4.7. Discussion
Compared with the research results in previous literature [16,17,20,21], which are usually obtained from experience, the results in this study are achieved by theoretical analysis and numerical calculation. More importantly, the energy density criterion is established and programmed with FISH language for the rockburst risk evaluation of coal pillars. Besides, the influence of backfilling roadway driving sequence on coal pillar stability is investigated, and the change law of vertical stress and energy density factor of coal pillars in different driving sequences in roadway backfilling mining technology is analyzed.
It is obvious that the energy density criterion in this study is suitable for the rockburst risk evaluation of coal pillars. Through the comparative analysis of the four kinds of numerical scheme, the rockburst risk evaluation of coal pillars in the one-roadway interval mining scheme is at its minimum, which is the priority choice to avoid rockburst accident. The maximum energy density factor value of 49,144 J/m4 for the surrounding rock in the sequential mining scheme is the largest among the four types of mining scheme. The maximum energy density factor value of 21,172 J/m4 for the surrounding rock in the one-roadway interval mining scheme is the lowest relative to the two-roadway and three-roadway interval mining schemes at 27,627 and 27,710 J/m4, respectively. Therefore, the one-roadway interval mining scheme is the optimal choice for roadway backfilling mining technology.
5. Conclusions
- (1)
- The degree and position of accumulated energy in the surrounding rock of roadways are the two vital parameters of the rockburst evaluation of coal mines. The energy density criterion of the rockburst risk is positively related to maximum energy density and negatively related to the distance between the point of maximum energy density and the free face of the roadway. The energy density criterion for rockburst risk evaluation is therefore proposed by combining the parameters of maximum energy density and distance. In addition, the energy density criterion is achieved by using numerical software in FISH programming language.
- (2)
- The maximum energy density factor of the surrounding rock in the sequential mining scheme is 49,144 J/m4, the largest rockburst risk occurs in the excavation of 9# roadway, and the maximum energy density factor of the surrounding rock in the one-roadway interval mining scheme is 21,172 J/m4, and the largest rockburst risk occurs in the excavation of 1# roadway in the first cycle. The maximum energy density factor of the surrounding rock in the two-roadway interval mining scheme is 27,627 J/m4, and the largest rockburst risk occurs in the excavation of 2# roadway in the second cycle. The maximum energy density factor of the surrounding rock in the three-roadway interval mining scheme is 27,710 J/m4, and the largest rockburst risk occurs in the excavation of 7# roadway in the second cycle. Therefore, the excavation security of 1# roadway in the first cycle in the one-roadway interval mining scheme should be guaranteed to reduce the rockburst risk of coal pillar, such as improving the backfilling quality, speeding up the backfilling work, decelerating the excavation work, strengthening the roadway support, and so on.
- (3)
- The maximum energy density factor of the surrounding rock in the sequential mining scheme is 49,144 J/m4, which is the largest among the four types of mining scheme. The maximum energy density factor of the surrounding rock in the one-roadway interval mining scheme is 21,172 J/m4, which is the lowest among the four kinds of mining scheme, particularly the two-roadway and three-roadway interval mining schemes at 27,627 and 27,710 J/m4, respectively. Therefore, the one-roadway interval mining scheme is the optimal choice for roadway backfilling mining technology.
Author Contributions
Y.X. conceived the model; Z.C. performed the numerical simulation; Z.C. and F.D. wrote the paper; and Y.X. and L.Z. revised the paper.
Funding
This study is sponsored by the China Postdoctoral Science Foundation (No. 2018M633549), the Key Scientific Research Project Fund of Colleges and Universities of Henan Province (No. 19A130001), the Ph.D. Programs Foundation of Henan Polytechnic University (No. B2018–65), and the Initiation Fund of Doctor’s Research (No. 107–451117008).
Conflicts of Interest
The authors declare no conflict of interest.
References
- Dong, K.-Y.; Sun, R.-J.; Li, H.; Jiang, H.-D. A review of China’s energy consumption structure and outlook based on a long-range energy alternatives modeling tool. Petrol. Sci. 2017, 14, 214–227. [Google Scholar] [CrossRef]
- Li, P.; Qian, H.; Howard, K.W.F.; Wu, J. Building a new and sustainable “Silk Road economic belt”. Environ. Earth Sci. 2015, 74, 7267–7270. [Google Scholar] [CrossRef]
- Khokholov, Y.A.; Solov’Ev, D.E. Procedure of joint calculation of temperature and ventilation mode in uninterrupted mining in permafrost zone. J. Min. Sci. 2013, 49, 126–131. [Google Scholar] [CrossRef]
- Chen, Q.-F.; Niu, W.-J.; Liu, Y.-Z.; Chen, Q.-L.; Liu, J.-G.; Fan, Q.-Y. Improvement of Knothe model and analysis on dynamic evolution law of strata movement in fill mining. J. China Univ. Min. Technol. 2017, 46, 250–256. [Google Scholar]
- Xue, Y.; Cao, Z.-Z.; Cai, C.-Z.; Dang, F.-N.; Hou, P.; Zhang, J. A fully coupled thermo-hydro-mechanical model associated with inertia and slip effects. Therm. Sci. 2017, 21, 259–266. [Google Scholar] [CrossRef]
- Jia, H.-S.; Qiao, A.-Z.; Jiang, W.-Y. Deformation-failure characteristics and supporting method of mining tunnel roof in Buertai mine. J. Henan Polytech. Univ. (Nat. Sci.) 2016, 35, 338–344. [Google Scholar]
- Hauquin, T.; Gunzburger, Y.; Deck, O. Predicting pillar burst by an explicit modelling of kinetic energy. Int. J. Rock Mech. Min. Sci. 2018, 107, 159–171. [Google Scholar] [CrossRef]
- Guo, W.-B.; Li, Y.-T.; Liu, D.-C. Application of strip pillar Mining. technology under dense constructions within industrial square. J. Henan Polytech. Univ. (Nat. Sci.) 2017, 36, 8–14. [Google Scholar]
- Ju, F.; Huang, P.; Guo, S.; Xiao, M.; Lan, L.-X. A roof model and its application in solid backfilling mining. Int. J. Min. Sci. Technol. 2017, 27, 139–143. [Google Scholar] [CrossRef]
- Xue, Y.; Dang, F.-N.; Li, R.-J.; Fan, L.-M.; Hao, Q.; Mu, L.; Xia, Y.-Y. Seepage-stress-damage coupled model of coal under geo-stress influence. Comput. Mater. Contin. 2018, 54, 43–59. [Google Scholar]
- Zhao, G.-Y.; Wu, H.; Chen, Y.; Xu, Z.-W.; Li, Z.-Y.; Wang, E.-J. Experimental study on load-bearing mechanism and compaction characteristics of mine filling materials. J. China Univ. Min. Technol. 2017, 46, 1251–1258. [Google Scholar]
- Ranjith, P.G.; Zhao, J.; Ju, M.; Silva, R.V.S.D.; Rathnaweera, T.D.; Bandara, A.K.M.S. Opportunities and challenges in deep mining: A brief review. Engineering 2017, 3, 546–551. [Google Scholar] [CrossRef]
- Pu, Y.; Apel, D.; Xu, H. A principal component analysis/fuzzy comprehensive evaluation for rockburst potential in kimberlite. Pure Appl. Geophys. 2017, 175, 2141–2151. [Google Scholar] [CrossRef]
- Khosravi, A.; Simon, R. Verification of the csds model in estimating the postpeak behavior of hard rocks. Int. J. Geomech. 2018, 18, 235–242. [Google Scholar] [CrossRef]
- Hosseini, N. Evaluation of the rockburst potential in longwall coal mining using passive seismic velocity tomography and image subtraction technique. J. Seismol. 2017, 21, 1101–1110. [Google Scholar] [CrossRef]
- Louchnikov, V.N.; Eremenko, V.A.; Sandy, M.P.; Kosyreva, M.A. Support design for mines exposed to rockburst hazard. J. Min. Sci. 2017, 53, 504–512. [Google Scholar] [CrossRef]
- Guo, G.; Kang, H.; Qian, D.; Gao, F.; Wang, Y. Mechanism for controlling floor heave of mining roadways using reinforcing roof and sidewalls in underground coal mine. Sustainability 2018, 10, 1413. [Google Scholar] [CrossRef]
- Rasskazov, I.Y.; Tsirel’, S.V.; Rozanov, A.O.; Tereshkin, A.A.; Gladyr’, A.V. Application of acoustic measurement data to characterize initiation and development of disintegration focus in a rock mass. J. Min. Sci. 2017, 53, 224–231. [Google Scholar] [CrossRef]
- Zhang, J.X.; Huang, P.; Zhang, Q.; Li, M.; Chen, Z.-W. Stability and control of room mining coal pillars-taking room mining coal pillars of solid backfill recovery as an example. J. Cent. South Univ. 2017, 24, 1121–1132. [Google Scholar] [CrossRef]
- Yu, W.-J.; Wang, W.-J. Strata movement induced by coal-pillar under three circumstances exchanged by gangue backfill and quadratic stability law. Chin. J. Rock Mech. Eng. 2011, 30, 105–112. [Google Scholar]
- Deng, X.; Zhang, J.; Klein, B.; Zhou, N.; DeWit, B. Experimental characterization of the influence of solid components on the rheological and mechanical properties of cemented paste backfill. Int. J. Miner. Process. 2017, 168, 116–125. [Google Scholar] [CrossRef]
- Sun, Q.; Zhang, J.; Zhou, N.; Qi, W. Roadway backfill coal mining to preserve surface water in western china. Min. Water Environ. 2017, 37, 366–375. [Google Scholar] [CrossRef]
- Cao, Z.-Z.; Xu, P.; Li, Z.-H.; Zhang, M.-X.; Zhao, Y.; Shen, W.-L. Joint bearing mechanism of coal pillar and backfilling body in roadway backfilling mining technology. Comput. Mater. Contin. 2018, 54, 137–159. [Google Scholar]
- Li, M.; Zhang, J.; Quan, K.; Zhou, N. Innovative extraction method for a coal seam with a thick rock-parting for supporting coal mine sustainability. Sustainability 2017, 9, 1982. [Google Scholar] [CrossRef]
- Xue, Y.; Dang, F.; Cao, Z.; Du, F.; Liu, F.; Ren, J.; Gao, F. Numerical Analysis of Heat and Gas Transfer Characteristics during Heat Injection Processes Based on a Thermo-Hydro-Mechanical Model. Energies 2018, 11, 1722. [Google Scholar] [CrossRef]
- Zhang, J.-X.; Zhang, Q.; Spearing, A.J.S.; Miao, X.-X.; Guo, S.; Sun, Q. Green coal mining technique integrating mining-dressing-gas draining-backfilling-mining. Int. J. Min. Sci. Technol. 2017, 27, 17–27. [Google Scholar] [CrossRef]
- Feng, G.; Xie, H. Statistically fractal strength theory for brittle materials. Acta Mech. Solida Sin. 1996, 1, 42–51. [Google Scholar]
- Chen, L.; Liu, J.-F.; Wang, C.-P.; Liu, J.; Su, R.; Wang, J. Characterization of damage evolution in granite under compressive stress condition and its effect on permeability. Int. J. Rock Mech. Min. Sci. 2014, 71, 340–349. [Google Scholar] [CrossRef]
- Du, Y.; Aydin, A. The maximum distortional strain energy density criterion for shear fracture propagation with applications to the growth paths of en Échelon faults. Geophys. Res. Lett. 2013, 20, 1091–1094. [Google Scholar] [CrossRef]
- Li, T.; Ma, C.; Zhu, M.; Meng, L.; Chen, G. Geomechanical types and mechanical analyses of rockbursts. Eng. Geol. 2017, 222. [Google Scholar] [CrossRef]
- Xie, H.; Chen, Z. Fractal geometry and fracture of rock. Acta Mech. Sin. 1988, 4, 255–264. [Google Scholar]
- Ma, C.-C.; Li, T.-B.; Xing, H.-L.; Zhang, H.; Wang, M.-J.; Liu, T.-Y.; Chen, G.-Q.; Chen, Z.-Q. Brittle rock modeling approach and its validation using excavation-induced micro-seismicity. Rock Mech. Rock Eng. 2016, 49, 3175–3188. [Google Scholar] [CrossRef]
- Hoek, E.; Brown, E.T. Underground Excavation in Rock; CRC Press: London, UK, 1980. [Google Scholar]
- Zhao, G.; Wang, D.; Gao, B.; Wang, S. Modifying rock burst criteria based on observations in a division tunnel. Eng. Geol. 2016, 216, 153–160. [Google Scholar] [CrossRef]
- Qian, Q.-H. Definition, mechanism, classification and quantitative forecast model for rockburst and pressure bump. Rock Soil Mech. 2014, 35, 1–6. [Google Scholar]
- Pan, Y.; Zhang, Y.; Yu, G.-M. Mechanism and catastrophe theory analysis of circular tunnel rockburst. Appl. Math. Mech. 2006, 27, 841–852. [Google Scholar] [CrossRef]
- Xie, H.; Li, L.; Peng, R.; Ju, Y. Energy analysis and criteria for structural failure of rocks. J. Rock Mech. Geotech. Eng. 2009, 1, 11–20. [Google Scholar] [CrossRef]
Figure 1.
Location and geologic column of the Wulan coal mine.

Figure 2.
Cracks of the coal under the scanning electron microscope.

Figure 3.
Whole stress-strain curve of coal mass.

Figure 4.
The numerical model of roadway backfilling mining technology.

Figure 5.
The vertical stress curve of surrounding rock of roadway in sequential mining.

Figure 6.
The contour of surrounding rock in 9# roadway excavation of sequential mining.

Figure 7.
The vertical stress curve of surrounding rock in one roadway interval mining.

Figure 8.
The contour of surrounding rock in 6 # roadway excavation of one roadway interval mining.

Figure 9.
The vertical stress curve of surrounding rock in two roadway interval mining.


Figure 10.
The contour of surrounding rock in 3 # roadway excavation of two roadway interval mining.
Figure 10.
The contour of surrounding rock in 3 # roadway excavation of two roadway interval mining.


Figure 11.
The vertical stress curve of surrounding rock in three roadways interval mining.


Figure 12.
The contour of surrounding rock in 4# roadway excavation of three roadway interval mining.
Figure 12.
The contour of surrounding rock in 4# roadway excavation of three roadway interval mining.

Figure 13.
The change rule of energy density factor of surrounding rock in four schemes.


Table 1.
The physical and mechanical parameters of each strata.
| Strata | Thickness (m) | Density (kg/m3) | Bulk Modulus (GPa) | Shear Modulus (GPa) | Tensile Strength (MPa) | Cohesive Force (MPa) | Internal Friction Angle (°) |
|---|---|---|---|---|---|---|---|
| Basic Roof | 31 | 2300 | 27 | 16.2 | 4.6 | 7.35 | 35 |
| Immediate Roof | 1 | 2615 | 18.7 | 11.2 | 4.4 | 6.9 | 30 |
| Coal Seam | 6 | 1400 | 1.67 | 1 | 1.14 | 2.86 | 29 |
| Immediate Floor | 1 | 2200 | 6.25 | 5.08 | 1.5 | 4.0 | 32 |
| Basic Floor | 14 | 2581 | 19.4 | 14.6 | 4.5 | 7.8 | 28 |
| Backfilling Body | 6 | 1500 | 0.083 | 0.038 | 1 | 2 | 28 |
Table 2.
The energy density factor of surrounding rock of roadway in sequential mining.
| Excavation Step | Maximum Energy Density (J/m3) | Position Of Maximum Energy Density | Distance d (m) | Energy Density Factor (J/m4) | ||
|---|---|---|---|---|---|---|
| x (m) | y (m) | z (m) | ||||
| 1# roadway excavation | 66,058 | 46.88 | 44.50 | 18.37 | 3.12 | 21,172 |
| 2# roadway excavation | 82,637 | 46.63 | 44.50 | 18.12 | 13.37 | 6181 |
| 3# roadway excavation | 100,956 | 78.63 | 55.50 | 18.62 | 3.63 | 27,812 |
| 4# roadway excavation | 123,528 | 88.88 | 69.50 | 18.36 | 3.88 | 31,837 |
| 5# roadway excavation | 146,525 | 99.13 | 69.50 | 18.11 | 4.13 | 35,478 |
| 6# roadway excavation | 168,855 | 109.38 | 69.50 | 18.11 | 4.38 | 38,551 |
| 7# roadway excavation | 194,063 | 119.39 | 69.50 | 18.85 | 4.39 | 44,206 |
| 8# roadway excavation | 210,558 | 129.64 | 69.50 | 18.60 | 4.64 | 45,379 |
| 9# roadway excavation | 228,029 | 139.64 | 69.50 | 18.60 | 4.64 | 49,144 |
| 9# roadway backfilling | 228,150 | 139.64 | 69.50 | 18.60 | ∞ | 0 |
Table 3.
The energy density factor of surrounding rock in one roadway interval mining.
| Excavation Step | Maximum Energy Density (J/m3) | Position Of Maximum Energy Density | Distance d (m) | Energy Density Factor (J/m4) | ||
|---|---|---|---|---|---|---|
| x (m) | y (m) | z (m) | ||||
| 1# roadway excavation | 66,058 | 46.88 | 44.50 | 18.37 | 3.12 | 21,172 |
| 3# roadway excavation | 80,159 | 58.37 | 44.50 | 18.12 | 11.63 | 6892 |
| 5# roadway excavation | 90,816 | 78.62 | 44.50 | 18.12 | 11.38 | 7980 |
| 7# roadway excavation | 103,837 | 78.62 | 44.50 | 18.11 | 31.38 | 3309 |
| 9# roadway excavation | 108,963 | 78.62 | 69.50 | 17.62 | 51.38 | 2121 |
| 2# roadway excavation | 149,473 | 78.87 | 69.50 | 18.11 | 13.87 | 10,777 |
| 4# roadway excavation | 206,279 | 99.13 | 69.50 | 18.10 | 14.13 | 14,599 |
| 6# roadway excavation | 243,926 | 119.14 | 69.50 | 18.84 | 14.14 | 17,251 |
| 8# roadway excavation | 224,936 | 138.89 | 69.50 | 19.09 | 13.89 | 16,194 |
| 8# roadway backfilling | 224,972 | 138.89 | 69.50 | 19.09 | ∞ | 0 |
Table 4.
The energy density factor of surrounding rock in two roadways interval mining.
| Excavation Step | Maximum Energy Density (J/m3) | Position Of Maximum Energy Density | Distance d (m) | Energy Density Factor (J/m4) | ||
|---|---|---|---|---|---|---|
| x (m) | y (m) | z (m) | ||||
| 1# roadway excavation | 66,058 | 46.88 | 44.50 | 18.37 | 3.12 | 21,172 |
| 4# roadway excavation | 73,871 | 76.63 | 43.50 | 18.12 | 3.37 | 21,920 |
| 7# roadway excavation | 82,590 | 88.37 | 44.50 | 18.12 | 21.63 | 3818 |
| 2# roadway excavation | 106,918 | 68.87 | 68.50 | 18.12 | 3.87 | 27,627 |
| 5# roadway excavation | 140,671 | 76.13 | 69.50 | 18.11 | 13.87 | 10,142 |
| 8# roadway excavation | 159,451 | 76.13 | 69.50 | 18.11 | 43.87 | 3635 |
| 3# roadway excavation | 225,925 | 99.38 | 69.50 | 18.10 | 24.38 | 9267 |
| 6# roadway excavation | 208,837 | 129.14 | 69.50 | 18.60 | 24.14 | 8651 |
| 9# roadway excavation | 220,821 | 46.11 | 69.50 | 18.85 | 83.89 | 2632 |
| 9# roadway backfilling | 220,862 | 46.11 | 69.50 | 18.85 | ∞ | 0 |
Table 5.
The energy density factor of surrounding rock in three roadways interval mining.
| Excavation Step | Maximum Energy Density (J/m3) | Position Of Maximum Energy Density | Distance d (m) | Energy Density Factor (J/m4) | ||
|---|---|---|---|---|---|---|
| x (m) | y (m) | z (m) | ||||
| 1# roadway excavation | 66,058 | 46.88 | 44.50 | 18.37 | 3.12 | 21,172 |
| 5# roadway excavation | 69,764 | 86.63 | 43.50 | 18.12 | 3.37 | 20,702 |
| 9# roadway excavation | 74,678 | 86.63 | 54.50 | 18.12 | 43.37 | 1722 |
| 3# roadway excavation | 96,642 | 78.62 | 44.50 | 18.12 | 3.62 | 26,697 |
| 7# roadway excavation | 107,238 | 106.13 | 69.50 | 18.12 | 3.87 | 27,710 |
| 2# roadway excavation | 144,437 | 79.12 | 69.50 | 18.11 | 14.12 | 10,229 |
| 6# roadway excavation | 202,887 | 85.88 | 69.50 | 18.10 | 14.12 | 14,369 |
| 4# roadway excavation | 238,839 | 119.39 | 69.50 | 18.35 | 34.39 | 6945 |
| 8# roadway excavation | 221,576 | 46.11 | 69.50 | 18.85 | 73.89 | 2999 |
| 8# roadway backfilling | 221,578 | 46.11 | 69.50 | 18.85 | ∞ | 0 |
© 2018 by the authors. Licensee MDPI, Basel, Switzerland. This article is an open access article distributed under the terms and conditions of the Creative Commons Attribution (CC BY) license (http://creativecommons.org/licenses/by/4.0/).
Share and Cite
MDPI and ACS Style
Xue, Y.; Cao, Z.; Du, F.; Zhu, L. The Influence of the Backfilling Roadway Driving Sequence on the Rockburst Risk of a Coal Pillar Based on an Energy Density Criterion. Sustainability 2018, 10, 2609. https://doi.org/10.3390/su10082609
AMA Style
Xue Y, Cao Z, Du F, Zhu L. The Influence of the Backfilling Roadway Driving Sequence on the Rockburst Risk of a Coal Pillar Based on an Energy Density Criterion. Sustainability. 2018; 10(8):2609. https://doi.org/10.3390/su10082609
Chicago/Turabian StyleXue, Yi, Zhengzheng Cao, Feng Du, and Lin Zhu. 2018. "The Influence of the Backfilling Roadway Driving Sequence on the Rockburst Risk of a Coal Pillar Based on an Energy Density Criterion" Sustainability 10, no. 8: 2609. https://doi.org/10.3390/su10082609
Note that from the first issue of 2016, this journal uses article numbers instead of page numbers. See further details here.