Article

Shifts in Growing Season of Tropical Deciduous Forests as Driven by El Niño and La Niña during 2001–2016

1
The Joint Graduate School of Energy and Environment and Center of Excellence on Energy Technology and Environment, King Mongkut’s University of Technology Thonburi, Bangkok 10140, Thailand
2
Department of Geography, Faculty of Social Science, Srinakharinwirot University, Bangkok 10110, Thailand
3
Department of Mathematics, King Mongkut’s University of Technology Thonburi, King Mongkut’s University of Technology Thonburi Geospatial Engineering and Innovation Center, Bangkok 10140, Thailand
4
GRID INC. Ao Building 6F 3-11-7 Kita Aoyama, Minato-ku, Tokyo 107-0061, Japan
5
Royal Forest Department, 61 Phaholyothin Road, Chatuchak, Bangkok 10900, Thailand
6
College of Agricultural and Environmental Sciences, The University of Georgia, Griffin Campus, Griffin, GA 30223, USA
*
Author to whom correspondence should be addressed.
Forests 2018, 9(8), 448; https://doi.org/10.3390/f9080448
Submission received: 22 May 2018 / Revised: 17 July 2018 / Accepted: 20 July 2018 / Published: 25 July 2018
(This article belongs to the Special Issue Long-Term Impacts of Climate Change on Forest Health)

Abstract

:
This study investigated the spatiotemporal dynamics of tropical deciduous forest including dry dipterocarp forest (DDF) and mixed deciduous forest (MDF) and its phenological changes in responses to El Niño and La Niña during 2001–2016. Based on time series of Normalized Difference Vegetation Index (NDVI) extracted from Moderate Resolution Imaging Spectroradiometer (MODIS), the start of growing season (SOS), the end of growing season (EOS), and length of growing season (LOS) were derived. In absence of climatic fluctuation, the SOS of DDF commonly started on 106 ± 7 DOY, delayed to 132 DOY in El Niño year (2010) and advanced to 87 DOY in La Niña year (2011). Thus, there was a delay of about 19 to 33 days in El Niño and an earlier onset of about 13 to 27 days in La Niña year. The SOS of MDF started almost same time as of DDF on the 107 ± 7 DOY during the neutral years and delayed to 127 DOY during El Niño, advanced to 92 DOY in La Niña year. The SOS of MDF was delayed by about 12 to 28 days in El Niño and was earlier about 8 to 22 days in La Niña. Corresponding to these shifts in SOS and LOS of both DDF and MDF were also induced by the El Niño–Southern Oscillation (ENSO).

1. Introduction

Tropical forests contain about 25% of the carbon in the terrestrial biosphere and account for 34% of Earth’s gross primary production [1]. Unlike temperate forests where temperatures fluctuate widely during the course of a year, their variation in tropical forest is modest. The trees of tropical forest are thus adapted to grow in a relatively narrow temperature range. Hence, the relative impact of climate warming is likely greater in the tropics than in other regions because predicted changes in temperature are large compared to normal inter-annual variations [2]. In addition, changes in precipitation patterns such as a shift toward more extreme events and extended droughts under climate change may result in loss of tropical forest and in large amount of CO2 released to the atmosphere [3,4].
Among various types of tropical forests, tropical deciduous forest occupies about 43% of the forest area in the tropical belt with great diversity of species [5]. It provides valuable services involving biodiversity, water resources and carbon sinks. However, like other forest ecosystems, these services are being affected by climate change and variability. Cavaleri [6] for example, reported a decline in the carbon sink of tropical rainforest during El Niño because of reduced photosynthesis and increased respiration rates. Strong climatic disturbances can severely reduce forest biomass, and if the frequency and intensity of these events increases beyond historical averages, these changing disturbance regimes have the capacity to significantly reduce forest biomass, resulting in a net source of carbon to the atmosphere. The study on Atlantic tropical moist forest in a long-term experimental plot also indicated a rapid biomass decline associated with El Niño events [7]. Many others studies have indicated that strong El Niño events have negative impacts on forest ecosystems, which could result in significant increasing level of tree mortality, changing plant phenology and carbon flux [3,4,8,9,10,11,12].
Forest phenology including the start, end and duration of growing season is an important indicator of vegetation response to climate change [13]. However, the information on tropical deciduous forest response to such climate extremes is sparse. Preliminary assessment over Southeast Asia suggests that decreasing precipitation and unusual high temperature in relation to severe drought (El Niño event) results in a significant reduction the CO2 uptake [14]. Such reduced CO2 uptake in tropical forests may be caused by reduced photosynthetic activity, shortened growing season, or a combination of both [6,15]. Further improvements in our understanding of tropical forests responding to climatic drivers and its links to ecosystem functions is thus needed.
In this study we applied the Normalized Difference Vegetation Index (NDVI), one of the most widely used indices, to quantify the interannual variation in canopy phenology of a tropical deciduous forest in Northern Thailand and to evaluate canopy response to extreme climate events. The indices derived from remote sensing were compared against in situ observations of canopy phenology. The insight gained through such observations will help to improve our understanding of key feedback mechanisms and our ability to predict vegetation dynamics under climate changes scenarios.

2. Materials and Methods
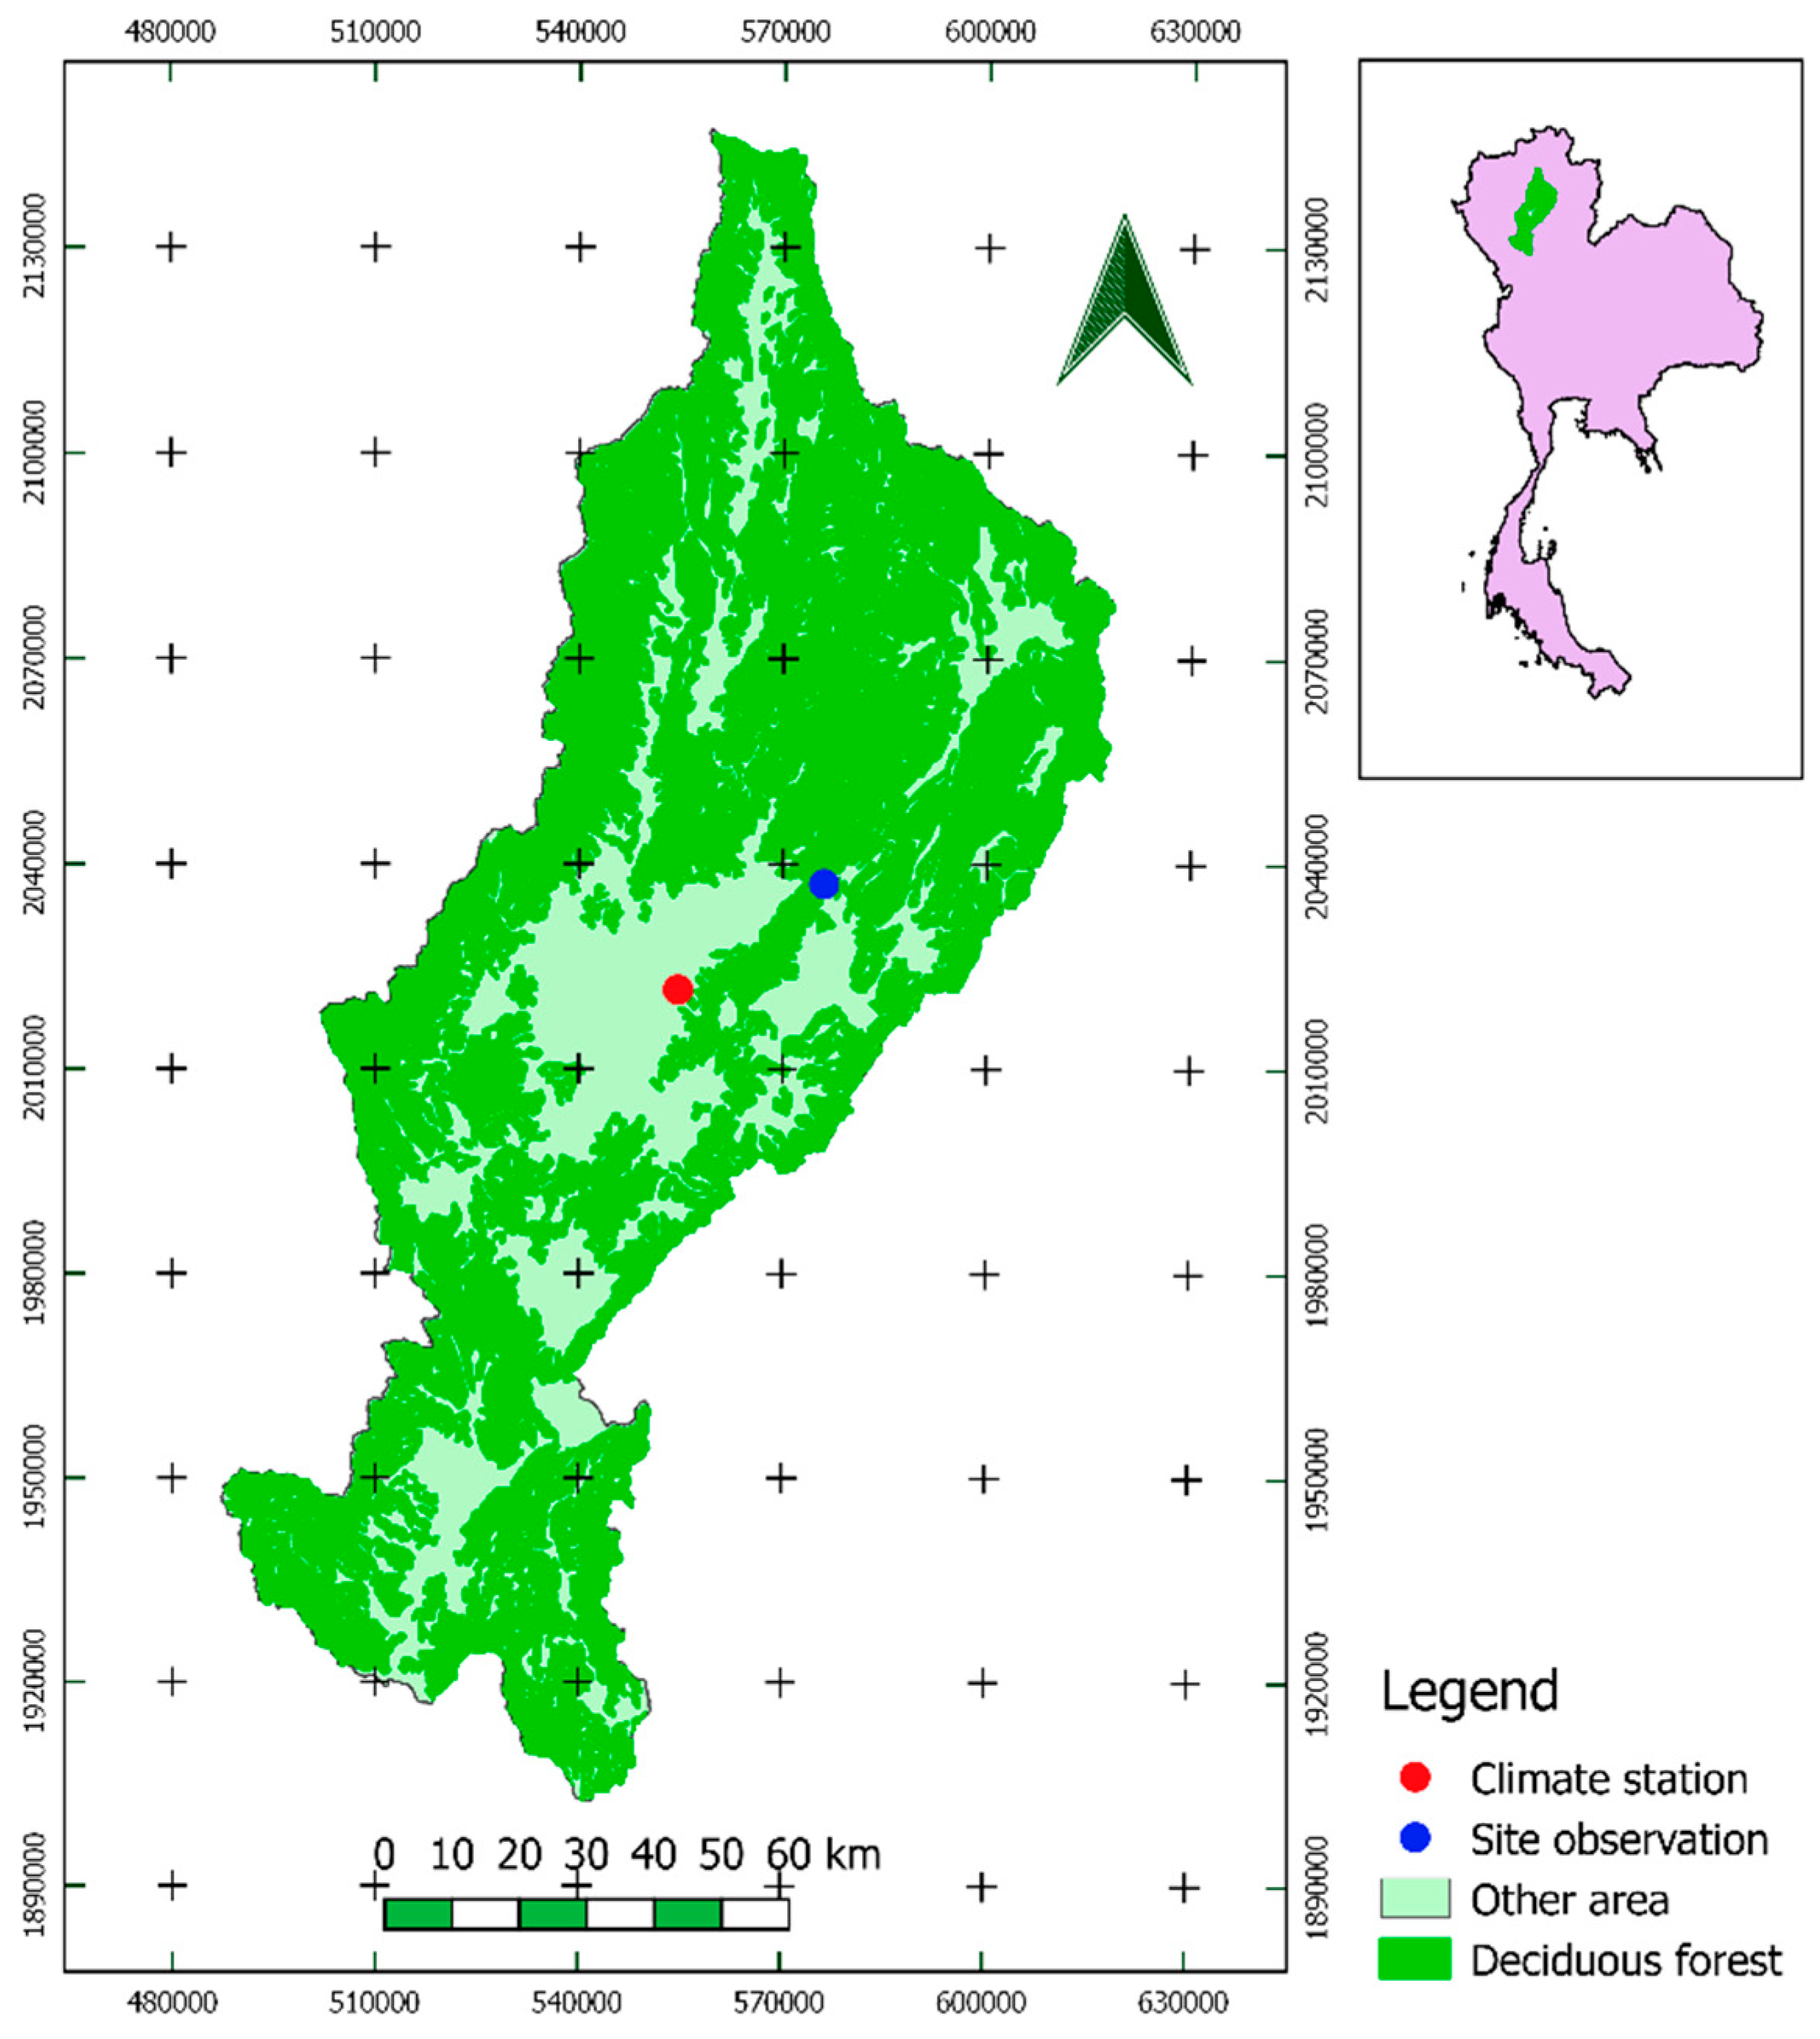
2.1. Study Area

Lampang Province is located in Northern Thailand with an area of 12,534 square kilometers (Figure 1). The Asian monsoon with two distinct seasons governs the climate in Lampang; a wet (May–October) and a dry season (November–April). The mean annual precipitation during the study period 2001–2016 is 1231 mm. The mean annual temperature is 25 °C, with a monthly minimum mean of 21–22 °C occurring in December–January, and a maximum monthly mean of 29.5 °C occurring in April [16].
Forest cover during the study period was on average 68.5% of total province area. Deciduous forest accounts for 68.3% of the overall forest coverage (Figure 1) [17]. Lampang is located on the area with the altitude ranging from 114 m to 1939 m above mean sea level. The main forest types in this study area are deciduous forests, mixed deciduous forest, and evergreen forest [18]. We selected Lampang as our study area for three reasons. Firstly, Lampang has a climate regime that is representative of northern Thailand and has experienced El Niño events during study period [19]. Secondly, there are long term field observations of leaf area index (LAI) in the Mea Mo teak plantation (2001–2012). Thirdly, the study area consists of a complex mountainous topography and the forest diversity varies according to different elevation. For example, lower elevation (300 m to 800 m) is dominated by the dry dipterocarp forest and Tectona grandis L. f (teak), and the higher elevation (800 m to 1000 m) is dominated by the mixed association of deciduous and evergreen hardwood, and the region above 1000 m is dominated by primary and evergreen with Pinus kesiya Roy. Ex Gord. (Pinaceae, pine) [20]. The complex topography, forest ecosystem and functioning make it ideal for evaluating the spatial variation in growing season of deciduous forest.

2.2. Data Set

2.2.1. MODIS Fata

This study used surface reflectance of MOD09Q1 from MODIS bands 1 (Red) and band 2 (NIR) at 250 m resolution, and MOD09A1 at 500 m resolution imagery captured in an 8-day period (2001–2016). The data were downloaded from the EROS Data Center, US Geological Survey [21,22]. Cloud cover was present in MOD09Q1 images, which limited the potential of the images for ground information extraction. Removing and replacing cloud-contaminated pixels was then performed following the method of Hoan and Tateishi [23]. Cloud removal processing for band 1 and band 2 of MODIS MOD09Q1 was divided into three main steps: cloud mask extraction, interpolation to remove cloud coverage and median smoothing. For cloud mask, combination of internal cloud algorithm flag (bit 10) and cloud shadow (bit 2) from 500 m State Flags layer of MOD09A1 (500 m) product was selected. The interpolation method for replacing cloud-contaminated areas was applied for each pixel (see detail in [23]). The NDVI was then calculated by using Red and NIR band [24].

2.2.2. Landsat Imagery

The dataset Operational Land Imager (OLI-8) images were downloaded from U.S. Geological Survey [25] by using the Global Visualization Viewer (GloVis). The images with less than 10% cloud cover were chosen to minimize the effect of cloud to interpreting forest areas. The red, green, blue, NIR, SWIR-1, and SWIR-2 bands were used in the forest classification. List of LANDSAT imagery used in this study is shown in Table 1.

2.2.3. Digital Elevation Models

The Shuttle Radar Topography Mission (STRM) 30 m × 30 m resolution obtained from the U.S. Geological Survey (USGS) were used in this study for topographic correction [26]. STRM was resampled using a nearest neighborhood transformation [27,28].

2.2.4. Climate Variables
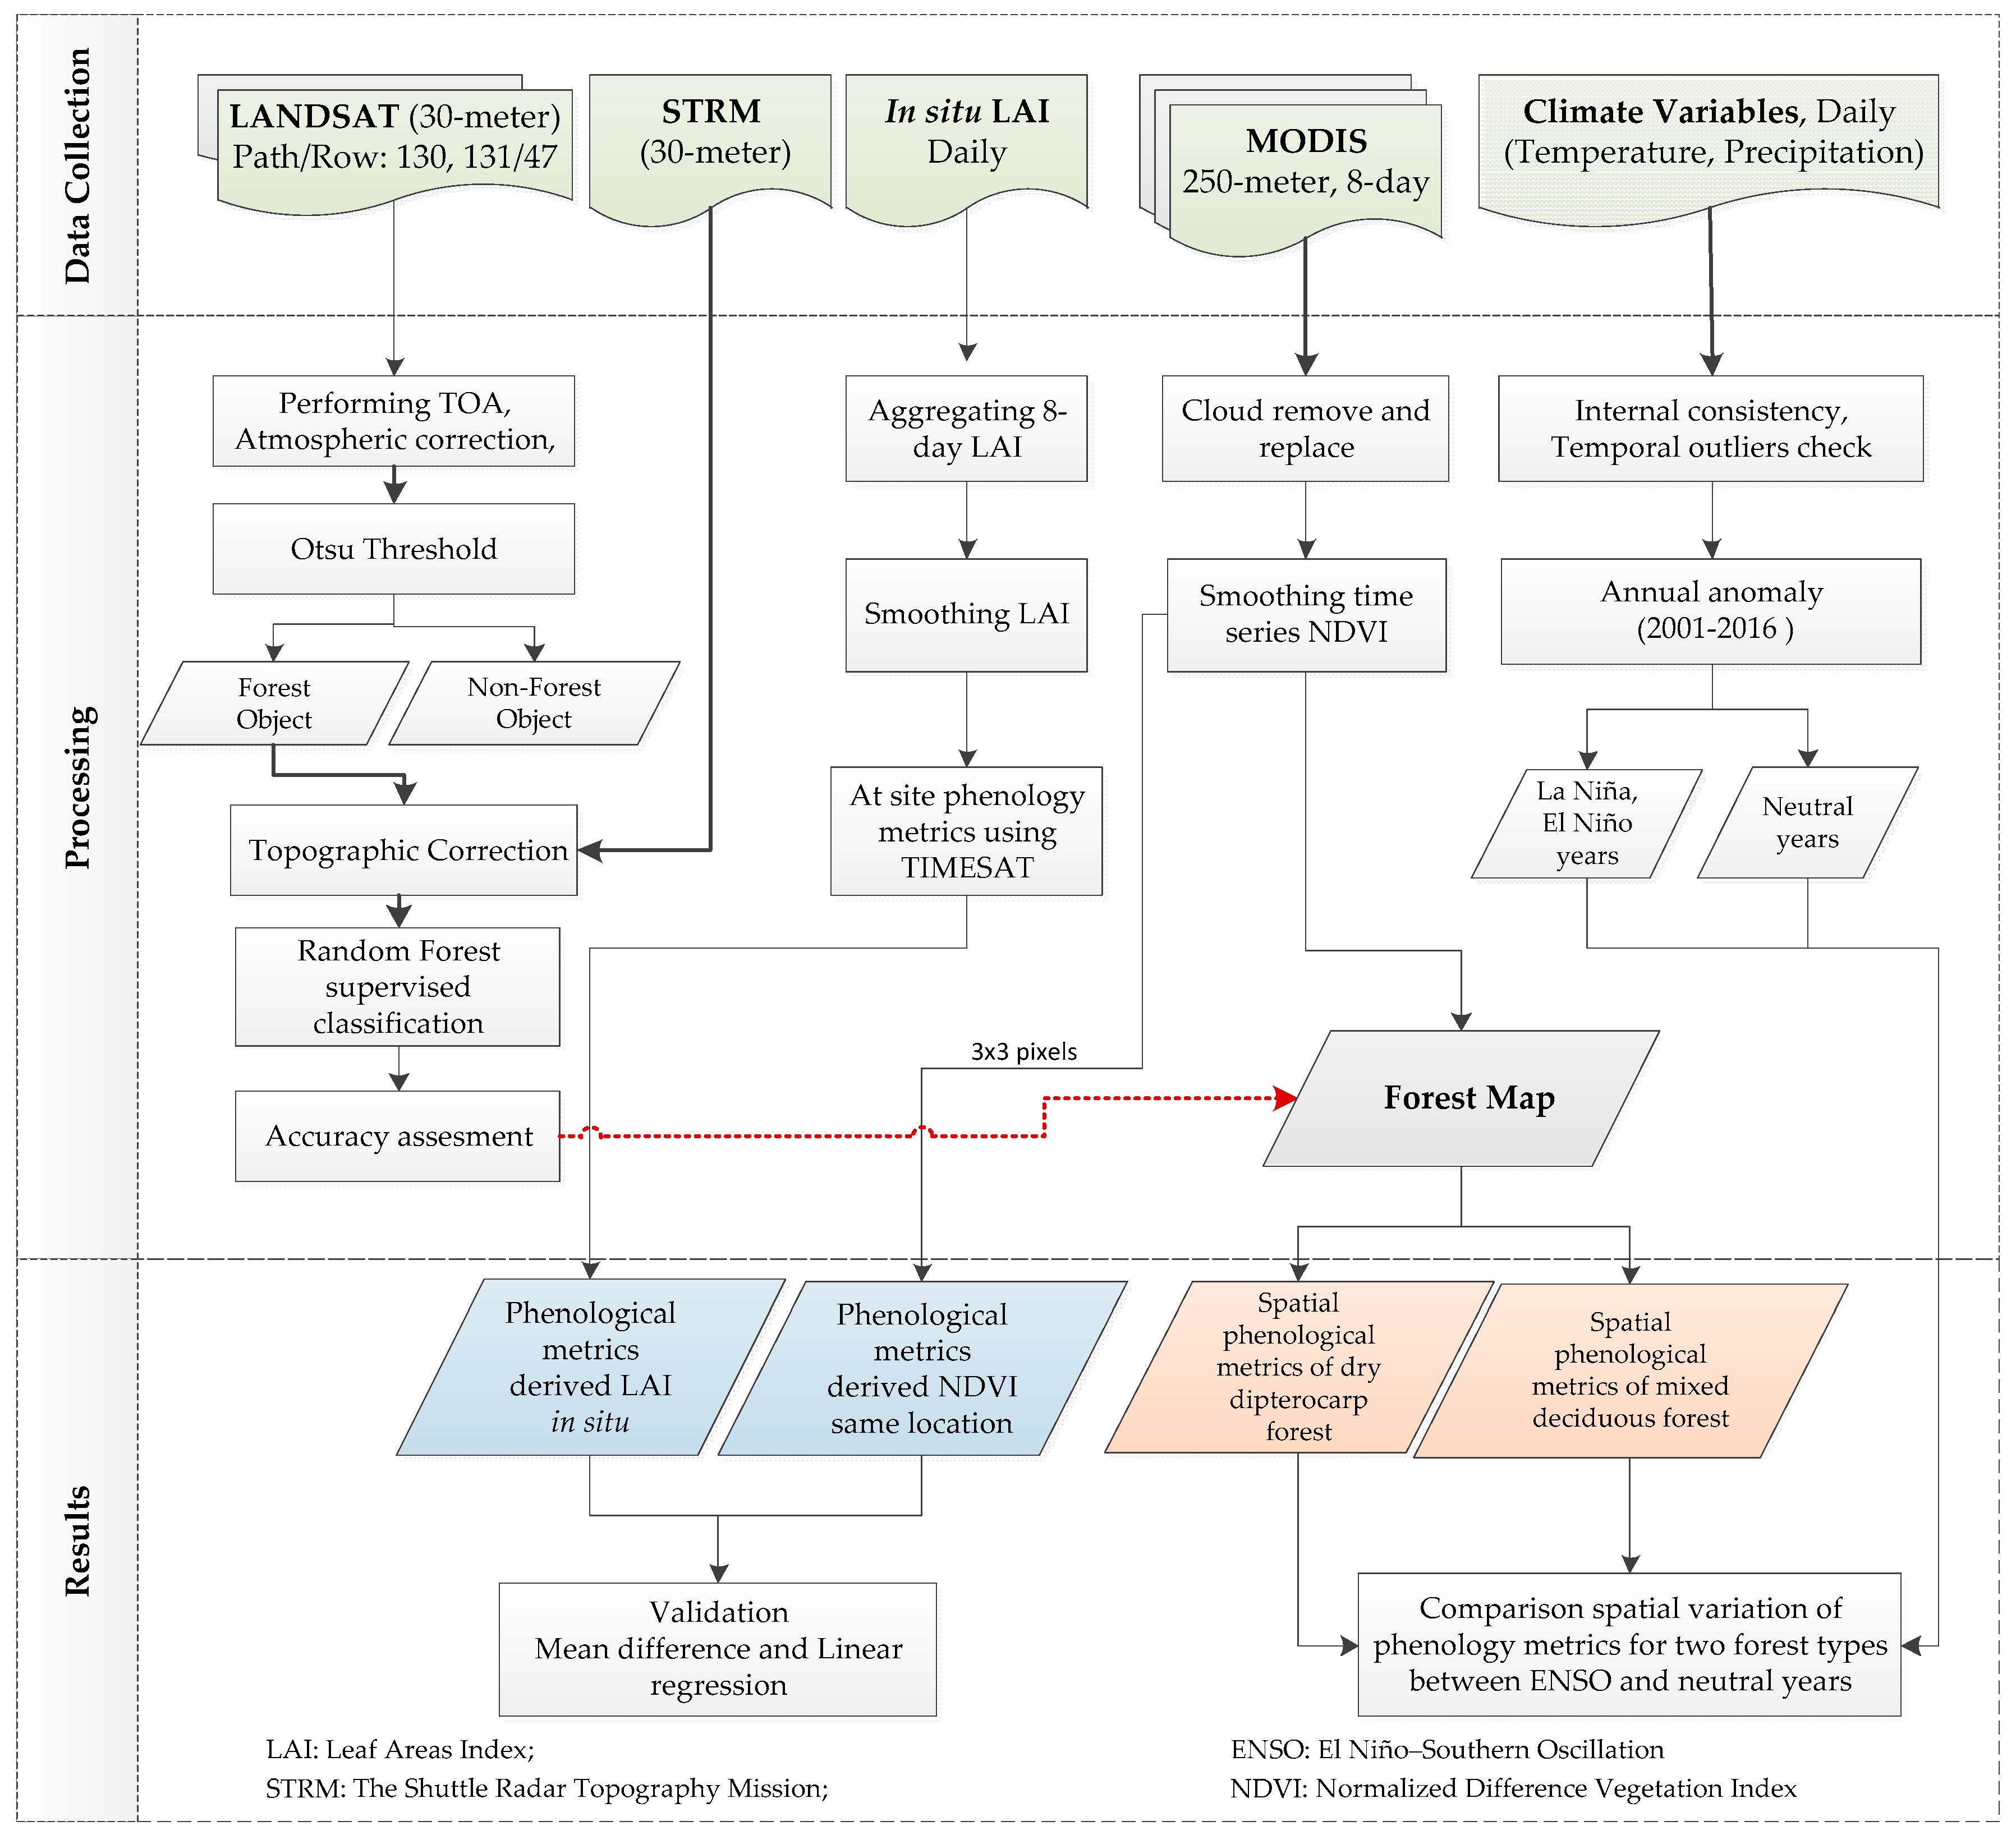
Local climate variables including daily maximum air temperature and precipitation were obtained for the period of 2001–2016 from Thai Meteorological Department. There are total of 123 meteorological stations over Thailand. However, there is only one station located within the study area (18°17′ N; 99°31′ E), and this was used as a representative of climate in Lampang. It should be noted that this station was only used to evaluate climatic trends and variation of the study area. It is not intended to characterize the climate of the whole region. The internal consistency and temporal outliers check were performed for climate data set. The missing value and outlier values on data set was checked and removed [29,30]. The daily maximum temperatures and precipitation were averaged and aggregated. Annual anomaly was calculated as the difference between the 16-year average and the individual year [31,32]. A positive anomaly value indicates that the observed value was greater than the average, while a negative anomaly indicates that the observed value was less than the average for the period 20012016.

2.3. Methods

This study consists of three main parts: forest classification, evaluation of the difference between in situ and satellite based phenological metrics, and the influence of the El Niño–Southern Oscillation (ENSO) to phenological metrics variation. A detailed description of the data, methods and outputs used in the study is provided in Figure 2.

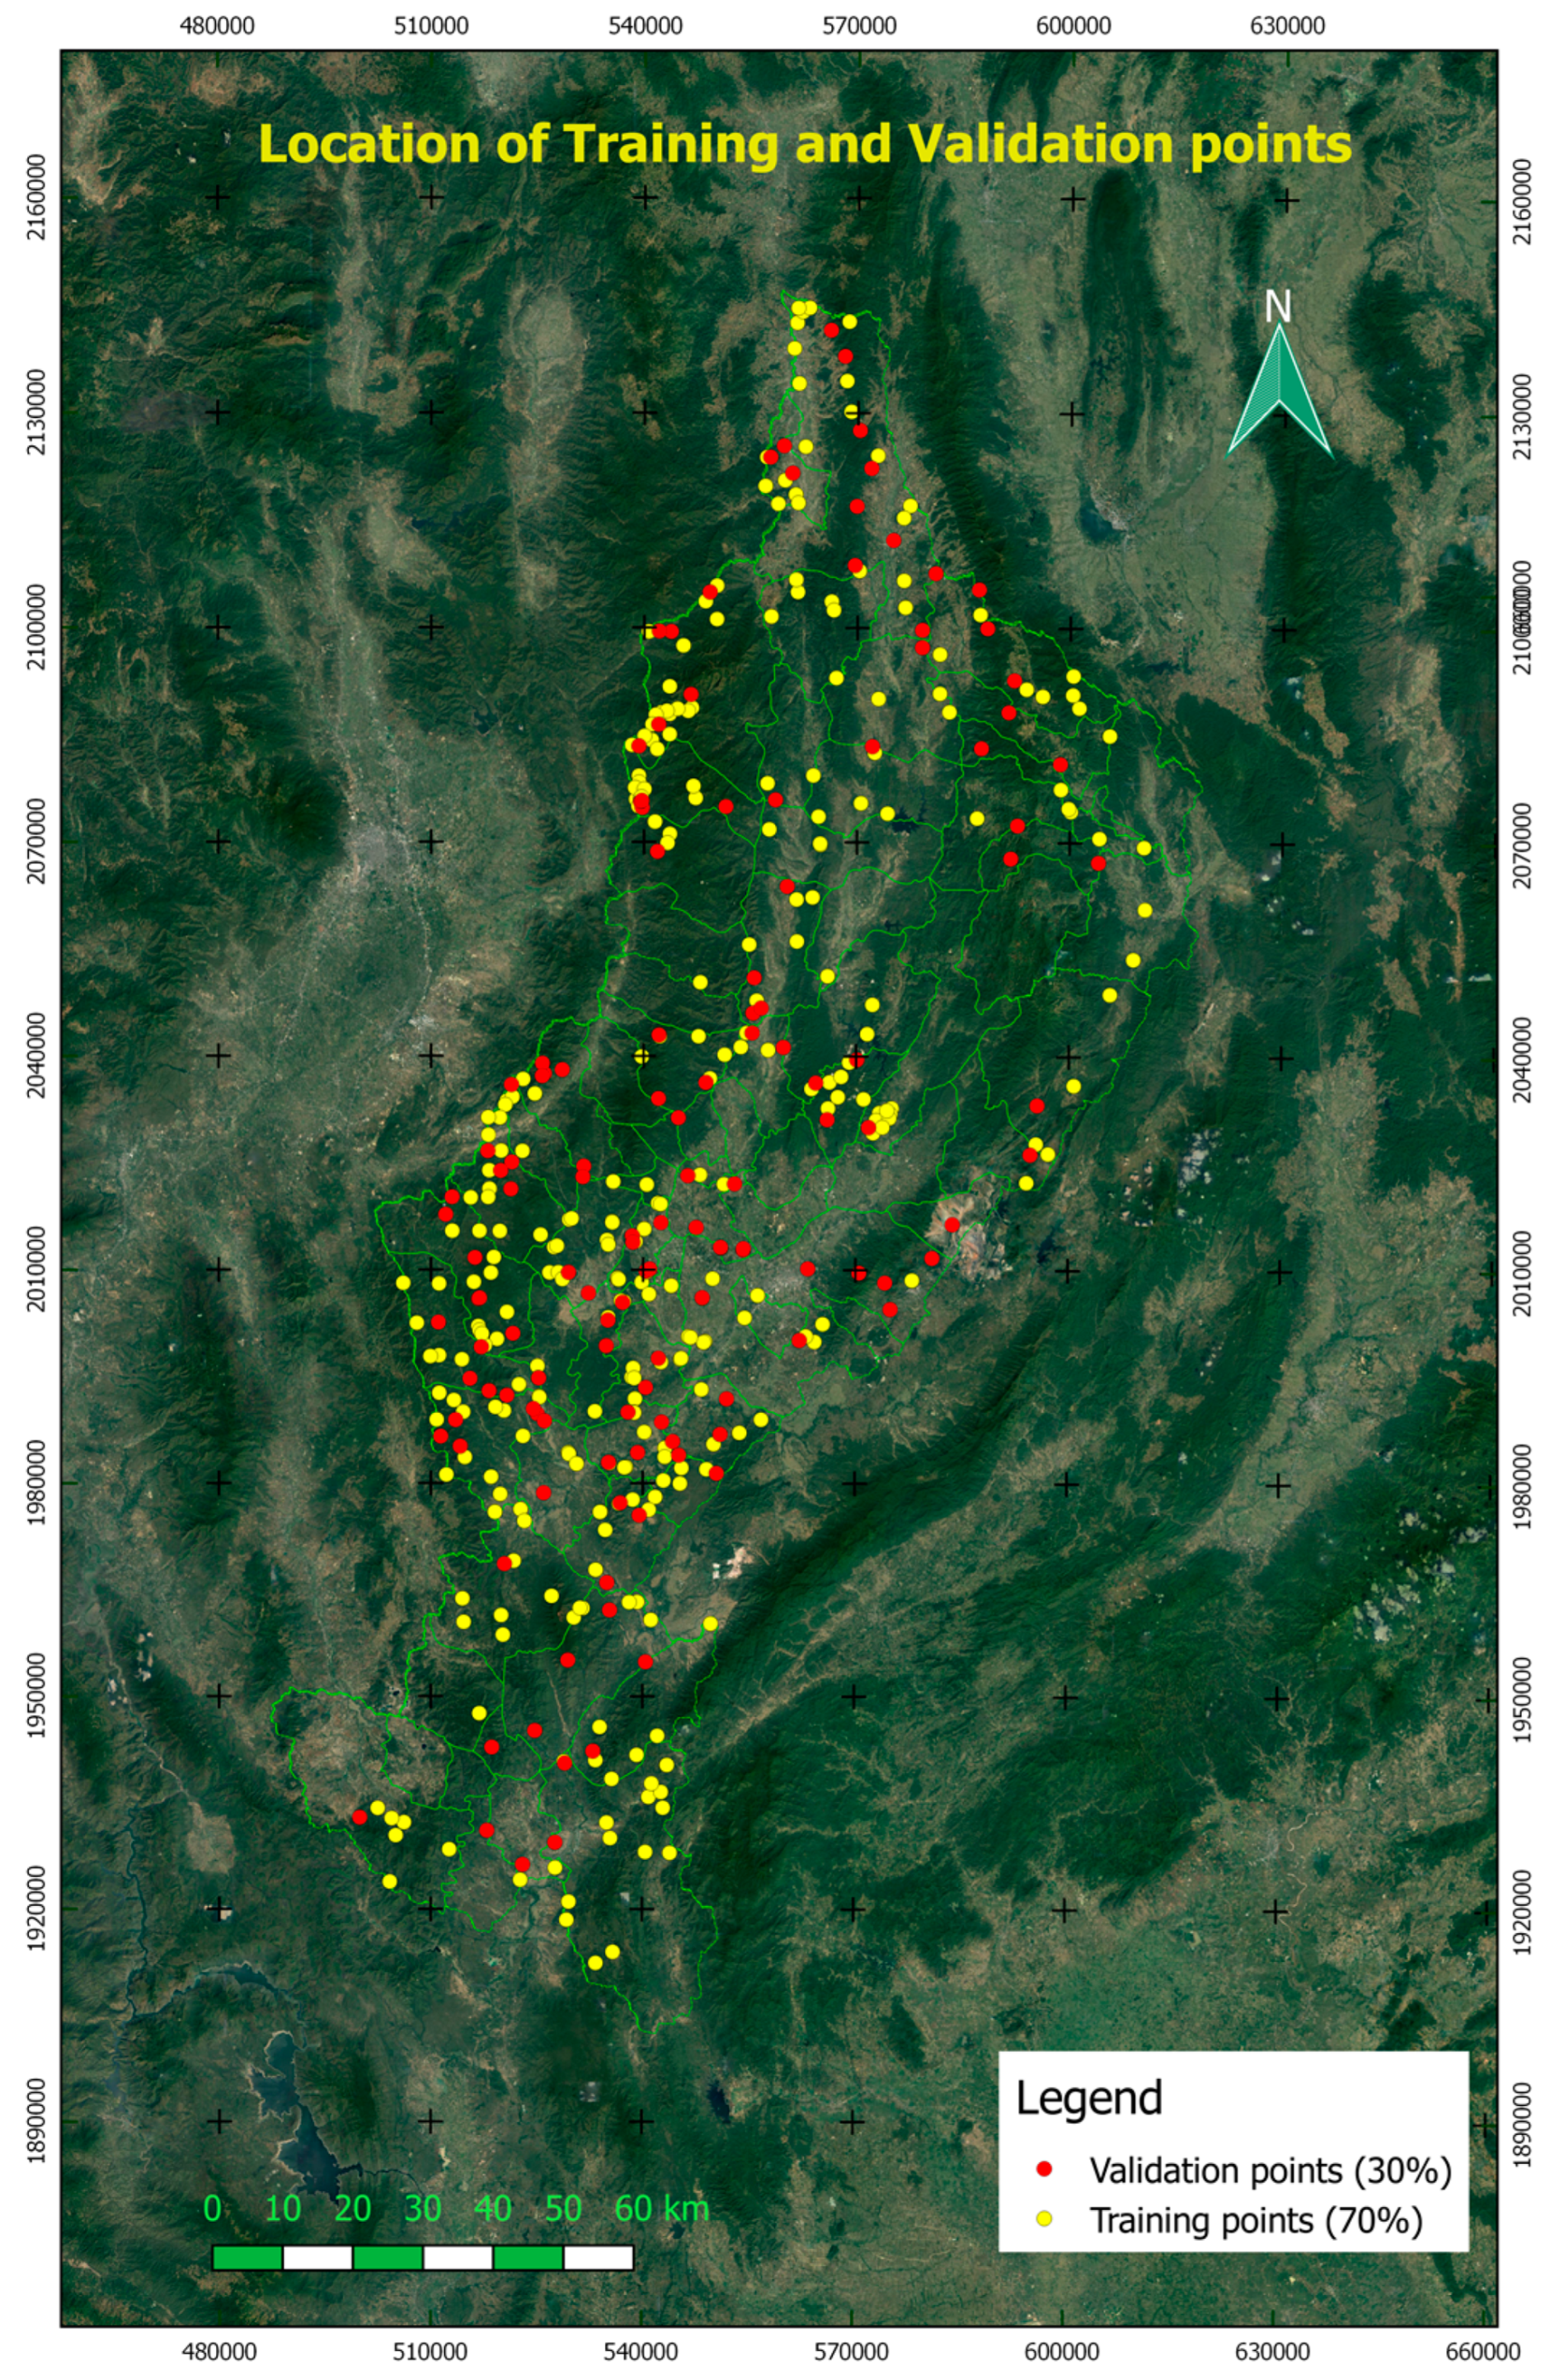
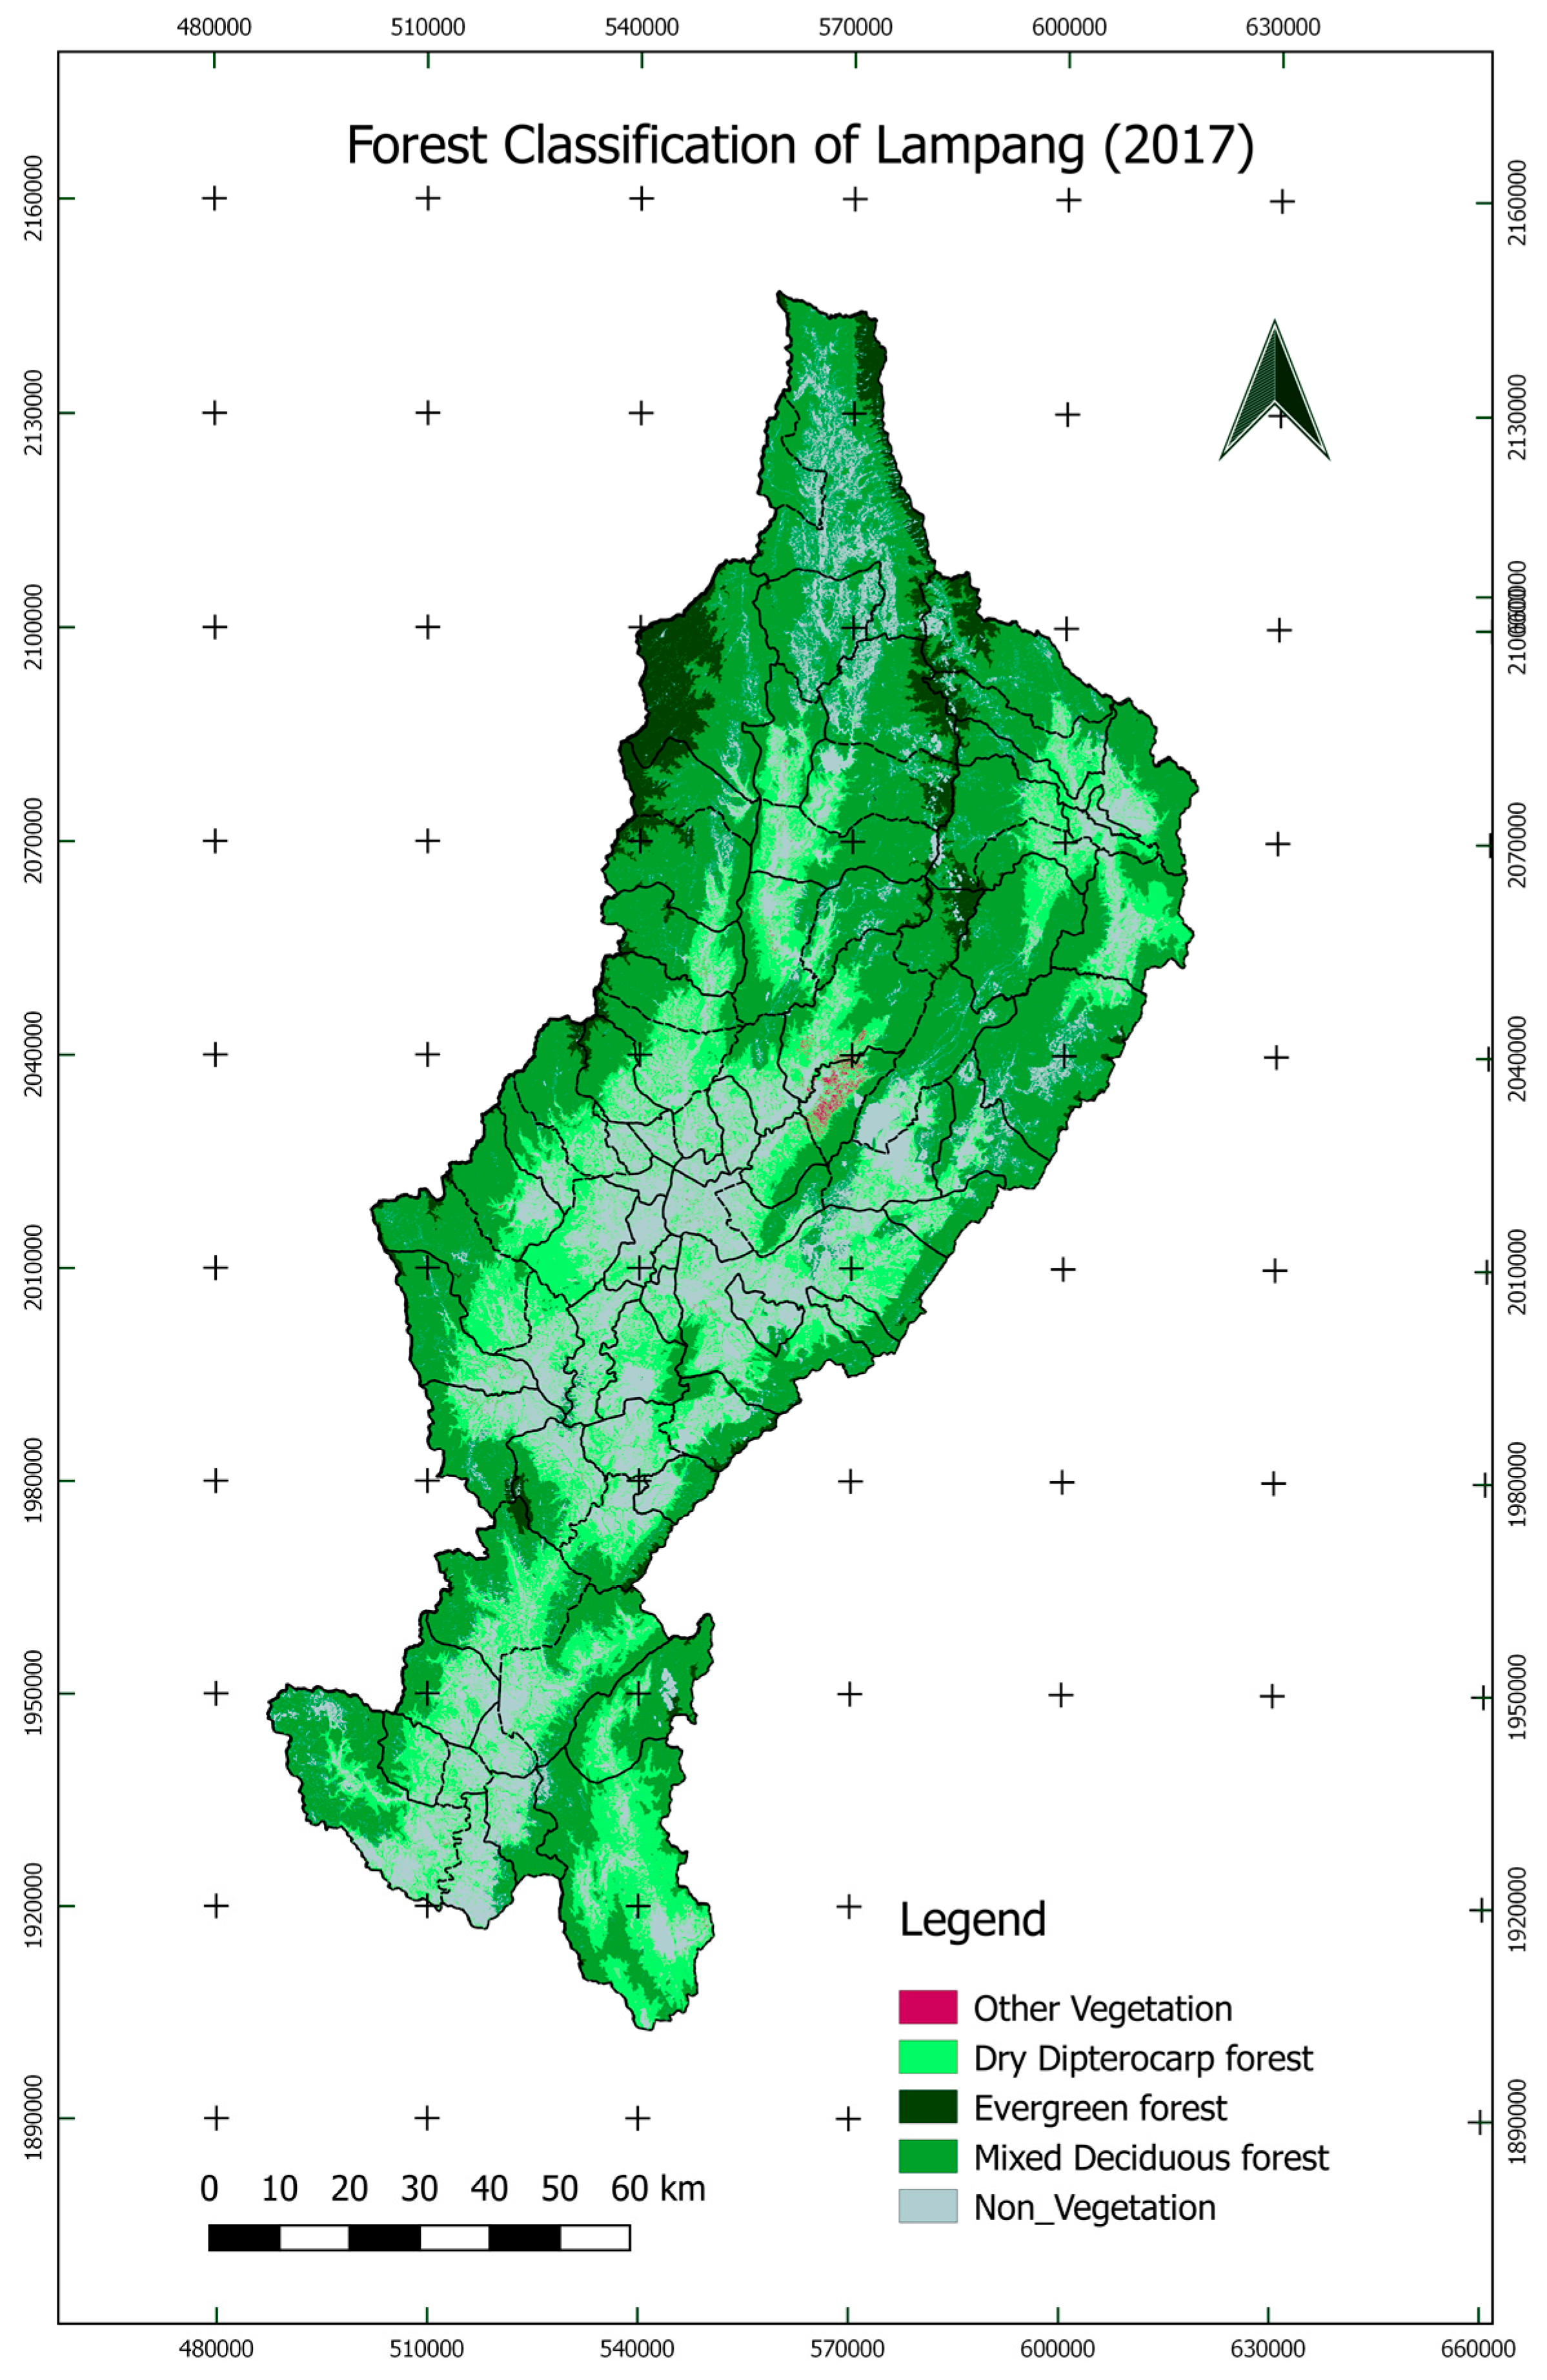
2.3.1. Forest Classification in Lampang

For pre-processing LANDSAT imagery, the top-of-atmosphere (TOA) reflectance and atmospheric correction (dark pixel subtraction method) were applied [33]. The cloud, cloud shadow and water pixels were identified by applying the Function of Mask (Fmask) algorithm [34,35] and were excluded from further analyses. Additionally, Landsat scenes contain jagged pixels along scene edges, which could result in incorrect reflectance values along the edge of imagery. These jagged pixels were removed using a 450 m buffer applied from the edge of the mask inward [36,37]. The Otsu threshold was then performed based on NDVI calculated from Red and NIR band of Landsat to separate the forest and non-forest areas [38]. The topographic correction with Statistical Empirical Correction method was performed on each stratified forest area to remove the topographic relief effect from Landsat imagery [28]. The forest object was then used to classify the forest type [39].
The stratified random sampling approach was performed in this study to estimate the number of samples points for each class [28,40]. The selection of a random sample of training data across all land use types ensures that samples have class proportions representative of each forest type. In total, there were 458 sample points selected for all classes (Figure 3). These 458 points included 50 points for evergreen forest (EF), 133 points for mixed deciduous forest (MDF), 50 points for dry dipterocarp forest (DDF), and 225 points for other vegetation types and non-forest class. A total of 40 of the 458 points were validated during the field survey. The rest were selected manually using a combination of the time series of MODIS NDVI during 2001–2016, the interpretation of high-resolution imagery, Google Earth images, and aerial photographs in Quantum GIS. To avoid the spatial autocorrelation a minimum distance of 2000 m was required between selected points [28]. A minimum of 50 training samples were used for each forest class [28].
The Random Forest (RF) Classifier, a widely used non-parametric machine learning classifier, was then applied for forest classification. RF is based on a tree classifier and grows many classification trees [28,39]. From the trained samples, the random Forest and raster packages were used to map forest types from the set of 06 spectral predictor variables (n = 500 classification trees). For the RF classification, 70% of sample points (320 points) were used to train the model, while the remaining 30% of sample points (138 points) were used to validate the classifier (Figure 3). The overall accuracy and Kappa statistic were considered for assessing the accuracy of RF classifier. The two major of classified deciduous forest types including MDF and DDF were used as mask to analysis their phenology in response to climate extreme event.

2.3.2. NDVI Time Series for Phenological Analysis

To examine the temporal signatures of deciduous forest classes, we extracted Normalized Difference Vegetation Index (NDVI) from MODIS to produce the profiles of vegetation dynamics during each growing season. NDVI was calculated from Red and Near infrared as described by [24]. The remaining noise in NDVI time series data was removed by using the Savitzky-Golay built within the TIMESAT software. The smoothed NDVI series was used to extract phenological metrics by using the threshold-based method [41,42,43,44]. In this study, we examined mean value of NDVI time series during 2001–2016 of two different forest types: DDF and MDF. The average of NDVI pixel locations of DDF and MDF was confirmed by checking the coordination from field survey.

2.3.3. Determination of Forest Phenological Variables from Satellite

TIMESAT software was used to extract the tropical deciduous forest phenology metrics for each year (2001–2015). An adaptive Savitsky-Golay filtering function in TIMESAT software was used to fit the curve of time series NDVI, which has been widely used for phenology monitoring [41,43,45,46]. Three phenological metrics were extracted as follows:
  • Start of growing season (SOS): This is defined as the date of leaf unfolding (day of year, DOY) and this study considered SOS as a date when NDVI of the left edge has increases 20 percentage measured from the left minimum point.
  • End of the season (EOS): This is defined as the dates of leaf discoloration (day of year, DOY) and leaf fall at the end of season. This study considered EOS as a date when NDVI of the right edge has decreases to 20 percentage of the right minimum level.
  • Length of the season (LOS): This is the duration (number of days) from the start to the end of the season.
The analysis of phenological metrics was performed for each pixel in this study. Note that one growing season cycle of tropical deciduous forest starts from current year and ends in the following year. Therefore, only 15 years of phenological metrics were extracted from NDVI time series of 2001–2016. To avoid long-term changes pixels classified as deciduous forest, only pixels for which the SOS ranged between 15 and 180 DOY for the whole study period were selected for further analysis.

2.3.4. Determination of in situ Derived Forest Phenological Metrics

The daily in situ LAI was aggregated to 8-day temporal resolution by using the mean function, with the same temporal resolution to MODIS NDVI. The Savitsky-Golay filtering was also performed with LAI data set. The phenological metrics were then extracted by the same method of satellite-based phenological metrics.

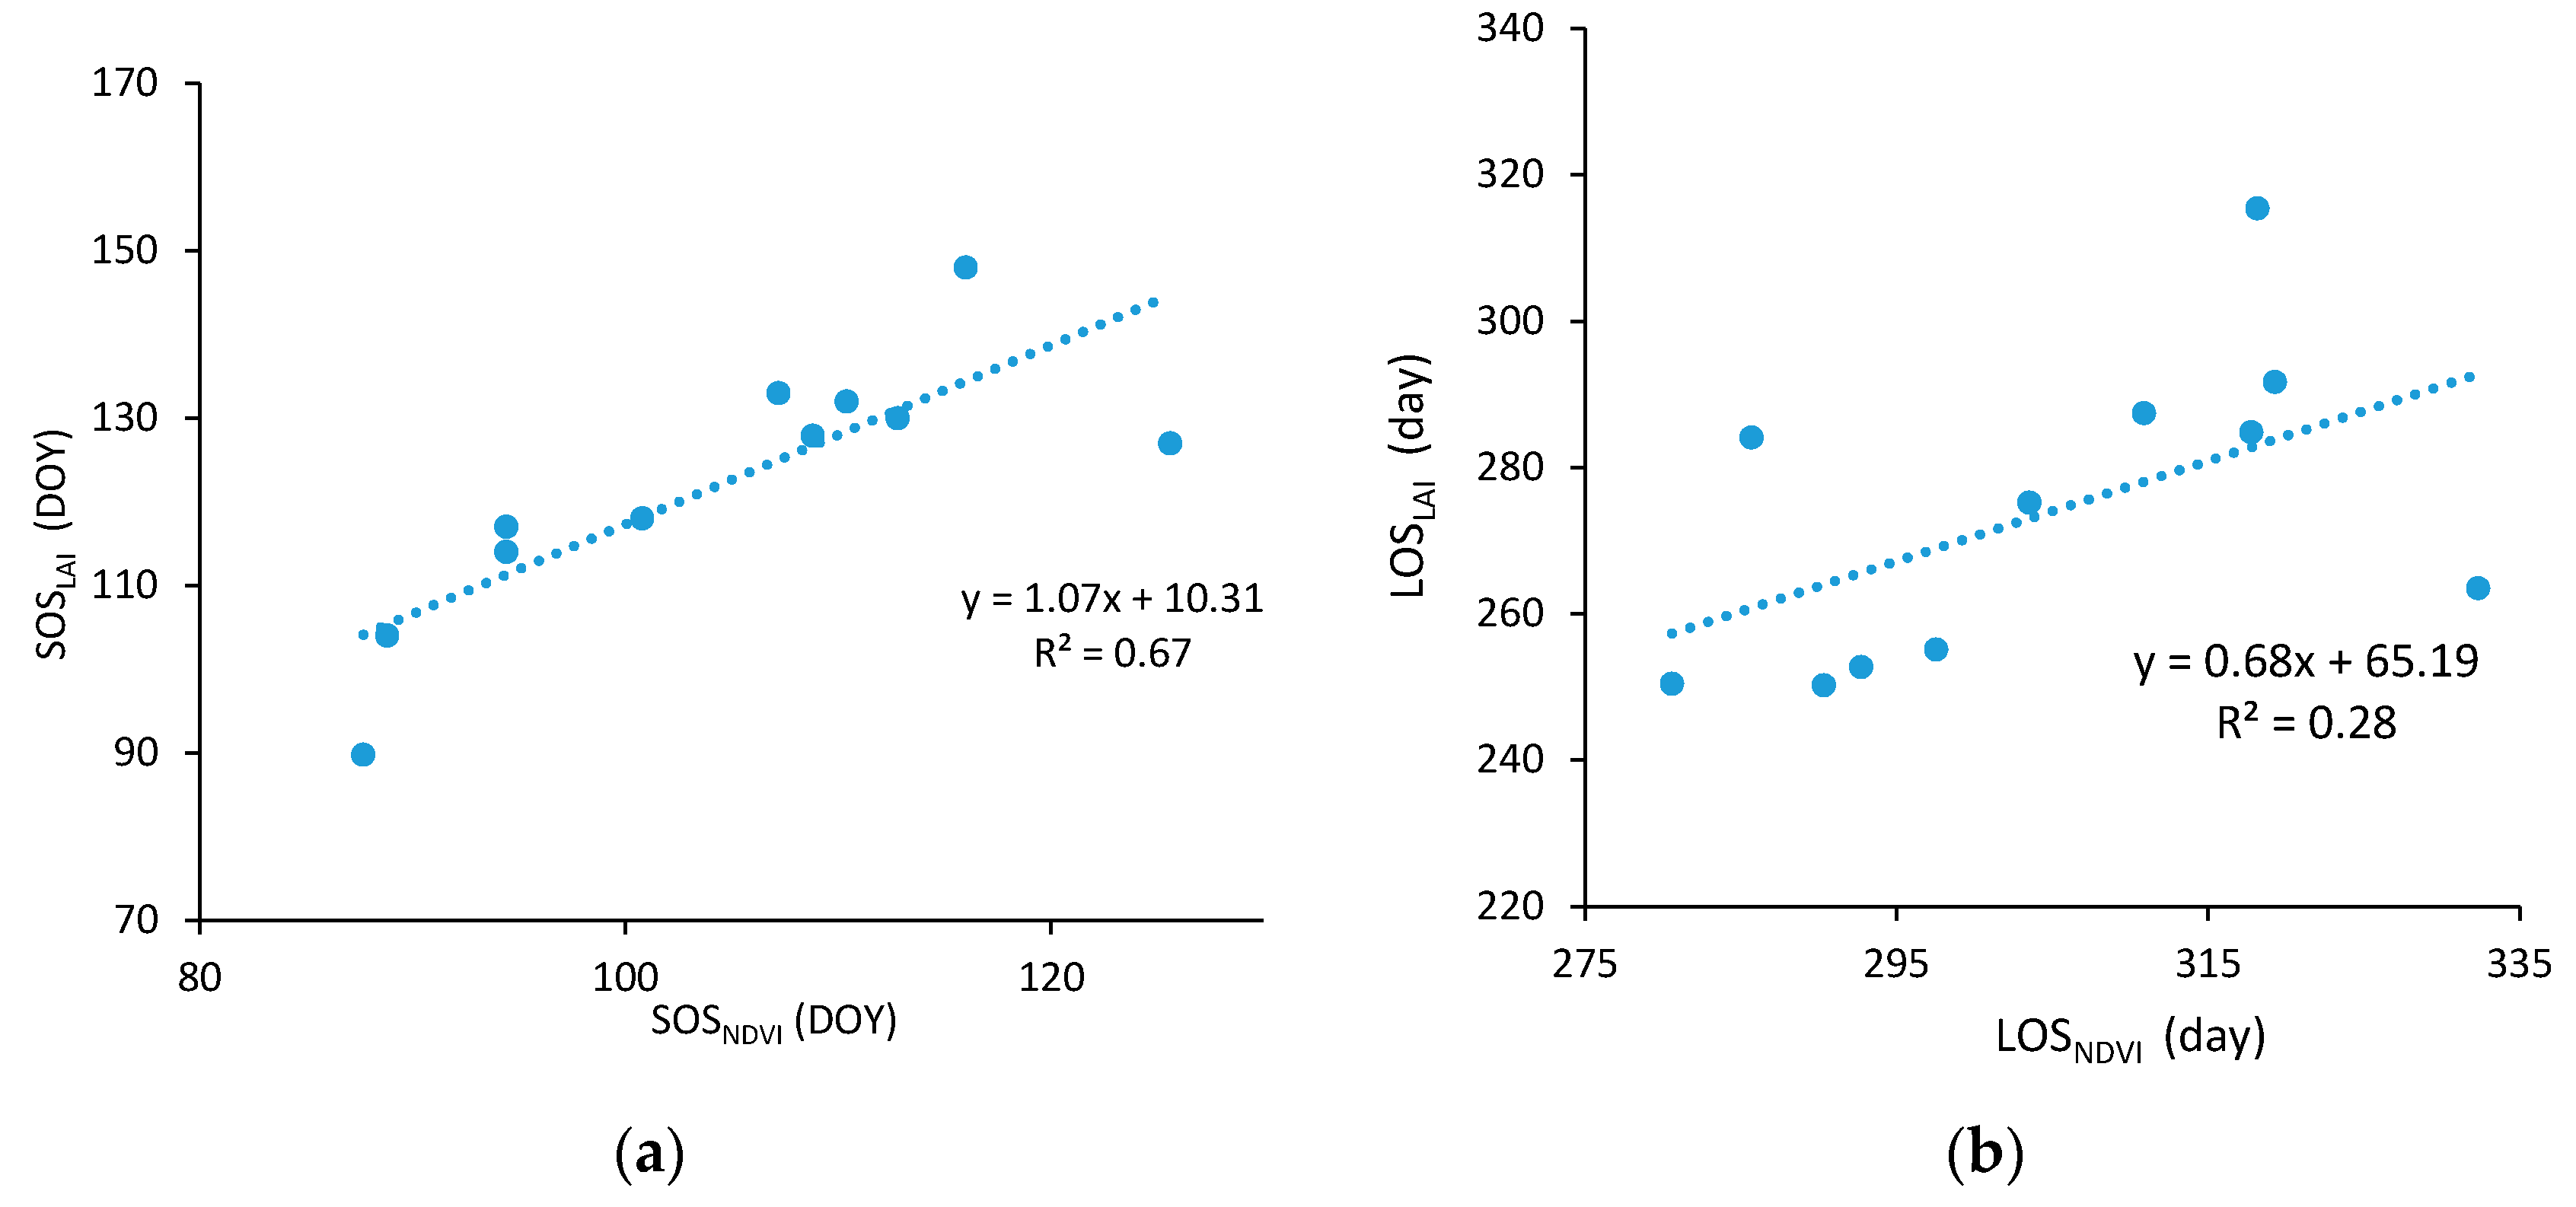
2.3.5. Validation of the Phenological Metrics

The ground observation site was located in Mae Mo District, Lampang Province (18°25′ N, 99°43′ E), in teak plantations (Tectona grandis Linn. f.) which was a major forest type in Lampang. In situ observation of leaf area index (LAI) from January 2001 to December 2012 was used to validate the time series of NDVI derived from satellite imagery [47]. To avoid positional error in MODIS data, the 3 × 3 pixels NDVI time series was extracted corresponding to the center of in situ measurement location. The daily in situ LAI was aggregated to 8-day temporal resolution by using the mean function. The phenological metrics extracted from MODIS and LAI are henceforth referred to as SOS NDVI , LOS NDVI and SOS LAI , LOS LAI . To understand more relationship between LAI and NDVI in term of phenology, we extracted the phenological metrics by using same threshold-based of 20 percentage amplitude. Linear regression was used to examine the overall relationship between the phenology metrics from in situ measurements and satellite-derived estimates.

2.3.6. Assessing the ENSO-Related Patterns in Annual Phenological Metrics

To examine the influence of ENSO events on tropical deciduous forest vegetation dynamics, the difference of phenological metrics during El Niño and La Niña years were evaluated for the study area. The extreme climate and neutral years were determined using the following criteria: (1) any year with five consecutive Oceanic Niño Index (ONI) periods in excess of +0.5 °C (−0.5 °C) is an El Niño (La Niña) year [48], (2) comparing against the annual anomaly climate at Lampang (see detail in Section 3.1). To evaluate the influence of ENSO events on canopy phenology, the difference between El Niño and La Niña impact patterns were evaluated for the study area using a simple difference between average El Niño or La Niña year and neutral year SOS and LOS. To investigate potential differences in ENSO impacts on different forest types, these differences were grouped by forest type and the significance of difference was compared based on one standard deviation (±1SD) and analysis of variance (ANOVA) at the confidence level of 95% (p ≤ 0.05).

3. Results and Discussion

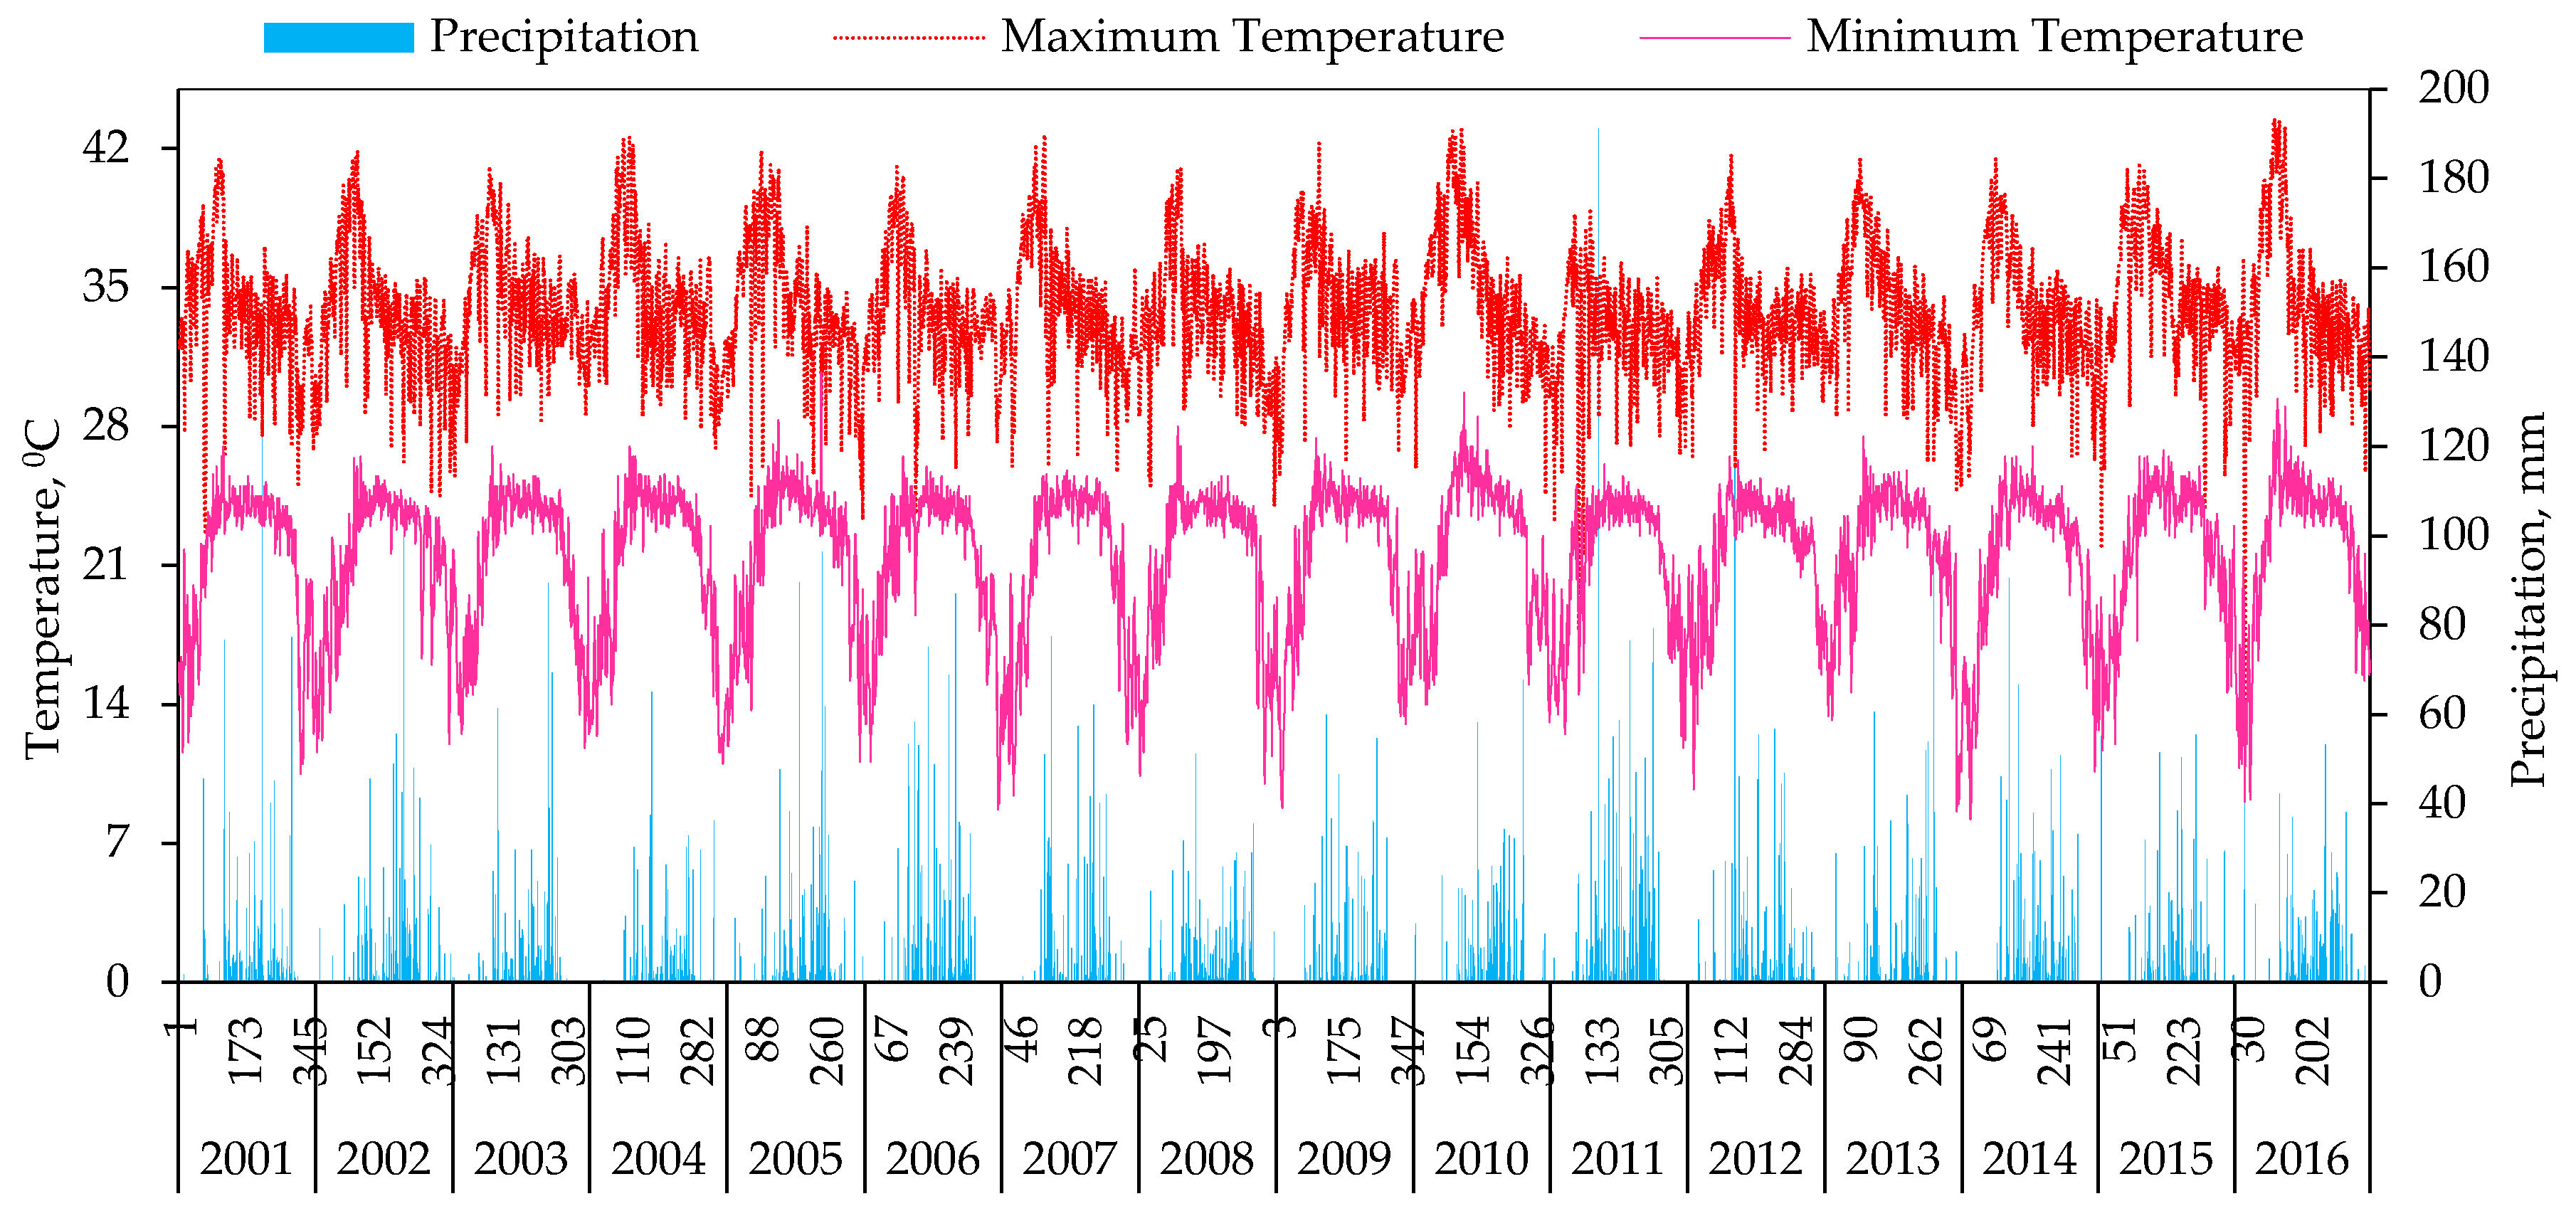
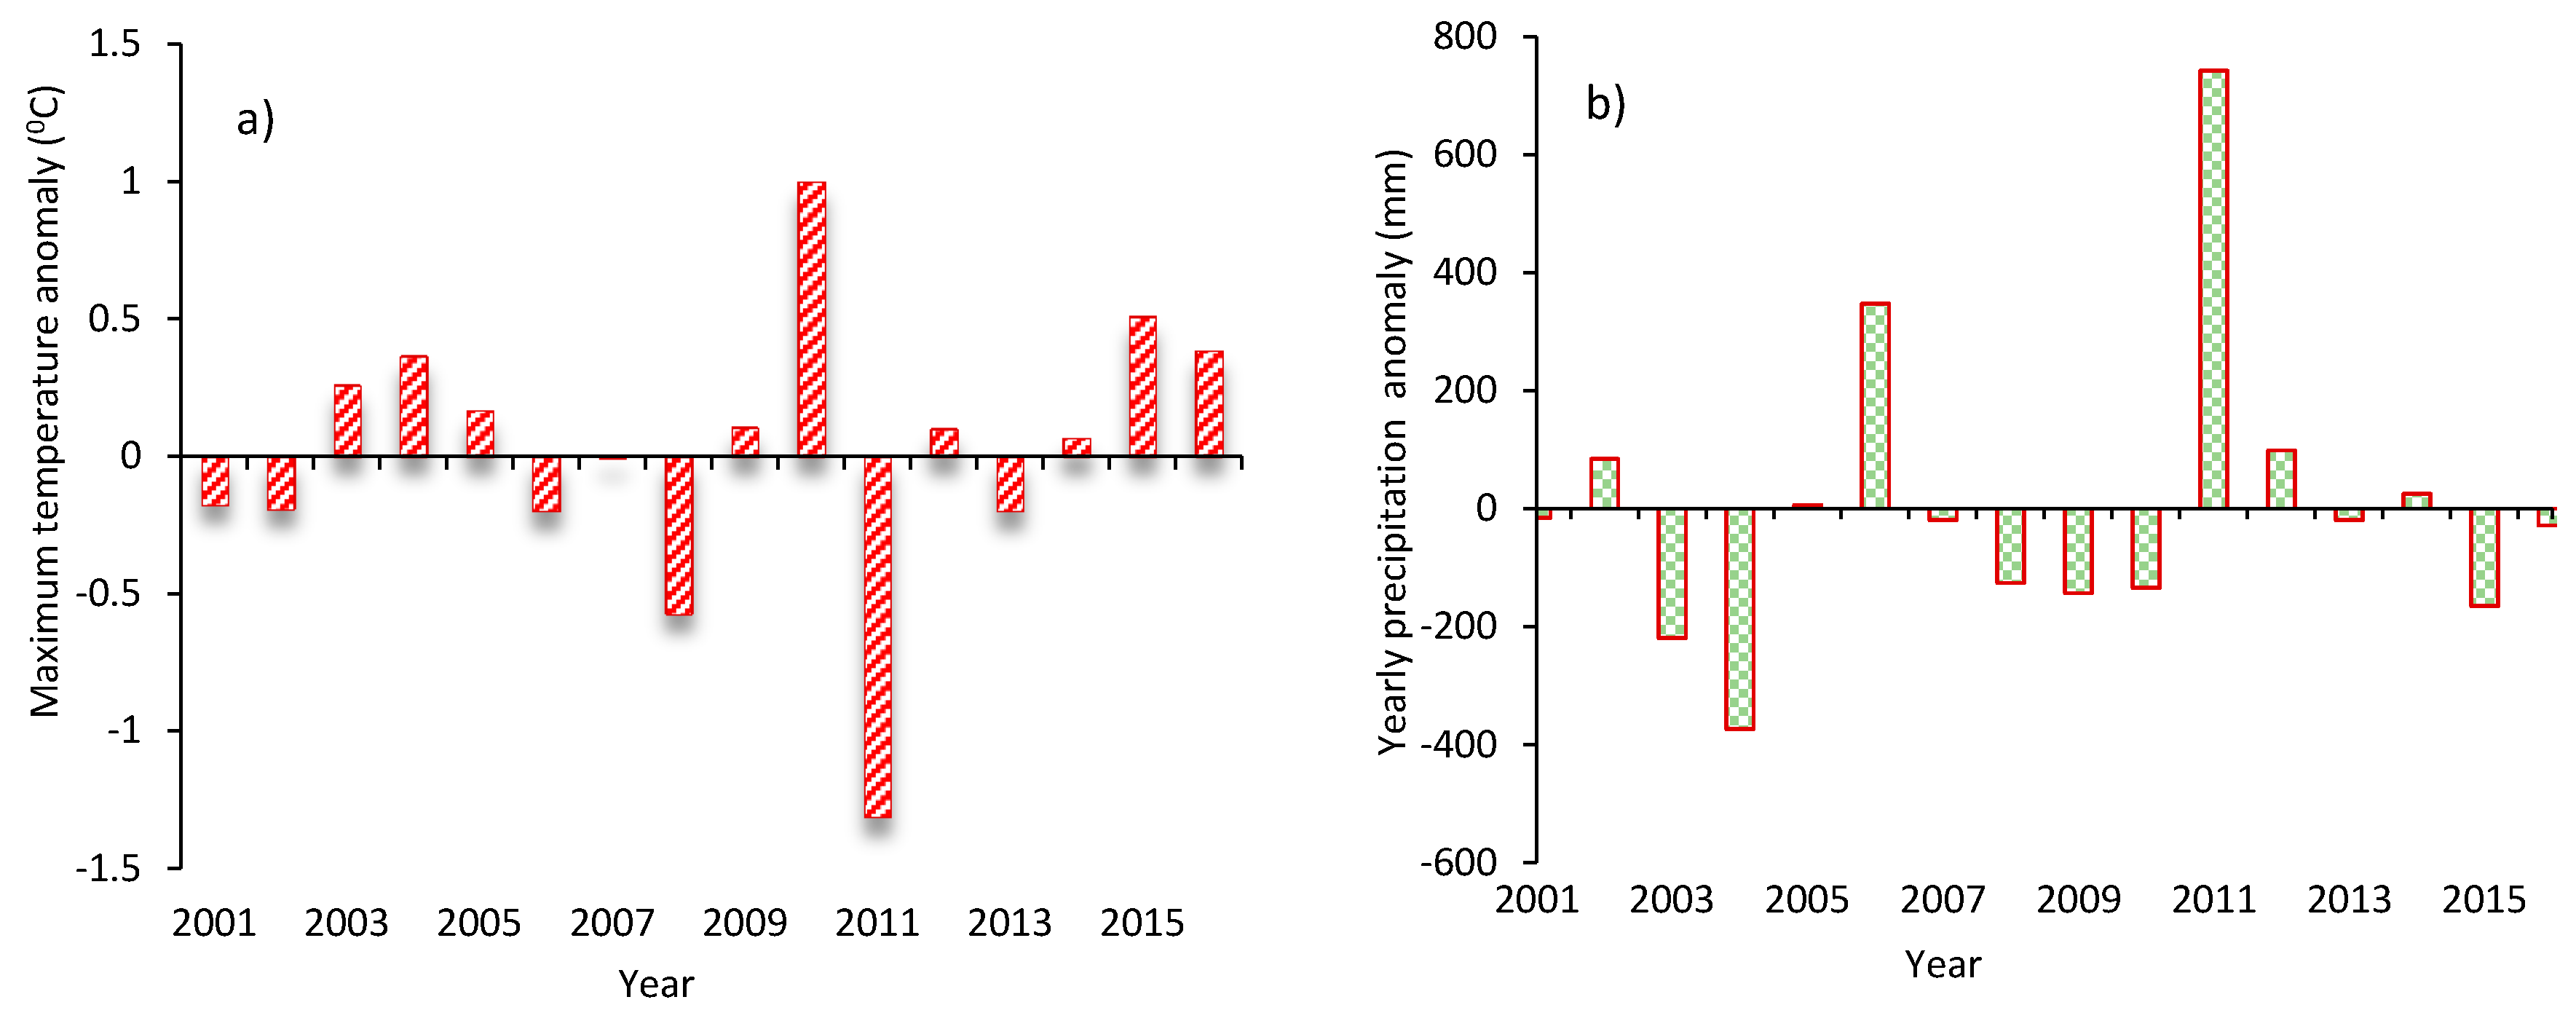
3.1. Variations in Temperature and Precipitation during 2001–2016

A clear seasonality of temperatures and precipitation is a main feature of climate characteristic in Northern Thailand, including in Lampang (Figure 4). Three clear seasons are as follows: (1) rainy or southwest monsoon season (mid-May to mid-October) with August to September as wettest period; (2) cool or northeast monsoon season (mid-October to mid-February), is the mild temperature period of the year with the coolest period in December and January; and (3) summer or pre-monsoon season (mid-February to mid-May). This is the transitional period from the northeast to southwest monsoons. March to May is the hottest period of the year with maximum temperatures often near or exceeding 40 °C. The subsequent onset of rainy season significantly reduces the temperatures from mid-May, which leads to intensive rainfall from mid-May until early October.
Based on the criterion that any year with five consecutive the Oceanic Niño Index (ONI) periods, beginning with the preceding August through October (ASO) period and ending with February through April (FMA) of the current year, El Niño or La Niña years are defined as any year excess of +0.5 °C (−0.5 °C) [48]. All other years are defined as neutral years. Following this criteria, the years 2001, 2006, 2008, 2011, 2012 are considered as La Niña, the years 2003, 2005, 2007, 2010, 2015, 2016 are El Niño year (with 2010 and 2016 defined as strong El Niño years).
Climate data analysis at Lampang station shows that the maximum temperature anomaly (+1.04 °C) was observed during the El Nino year (2010), which also had a pronounced negative precipitation anomaly (−133.9 mm). Precipitation anomalies during the period of study were mostly negative, particularly in El Niño events, whereas the precipitation anomalies values were highest in 2006 and 2011 (which indicates the wettest conditions) during the study period (Figure 5). Based on these results we identified 2010 and 2011 as strong El Nino and La Nina years, respectively, for use as extreme events in the impact analysis. The remaining years (2001–2009 and 2012–2015, including the weak El Niño and La Niña) with less variation of anomaly temperature and anomaly precipitation were considered as neutral years in this study. Two phenological metrics during neutral and extreme event years were extracted for each pixel, then the difference between them was investigated.

3.2. Forest Classification

RF classification for various different forest types from OLI-8 is presented in Figure 6. The classification of land use in Lampang 2017 was conducted with five land use and land cover classes: EF, MDF, DDF, other vegetation and non-forest. The total areas of classified deciduous forest were 878,831 ha (70.4% of total areas), where MDF and DDF occupied 45.4% and 24.9%, respectively. Areas of other land use types including evergreen forest, other vegetation and non-forest were 370,428 ha (29.7% of total areas). The machine learning RF classifier can be implemented effectively for forest classification in this study site. The overall accuracy of the classified map was 87.8%.

3.3. Variations in NDVI during 2001–2016

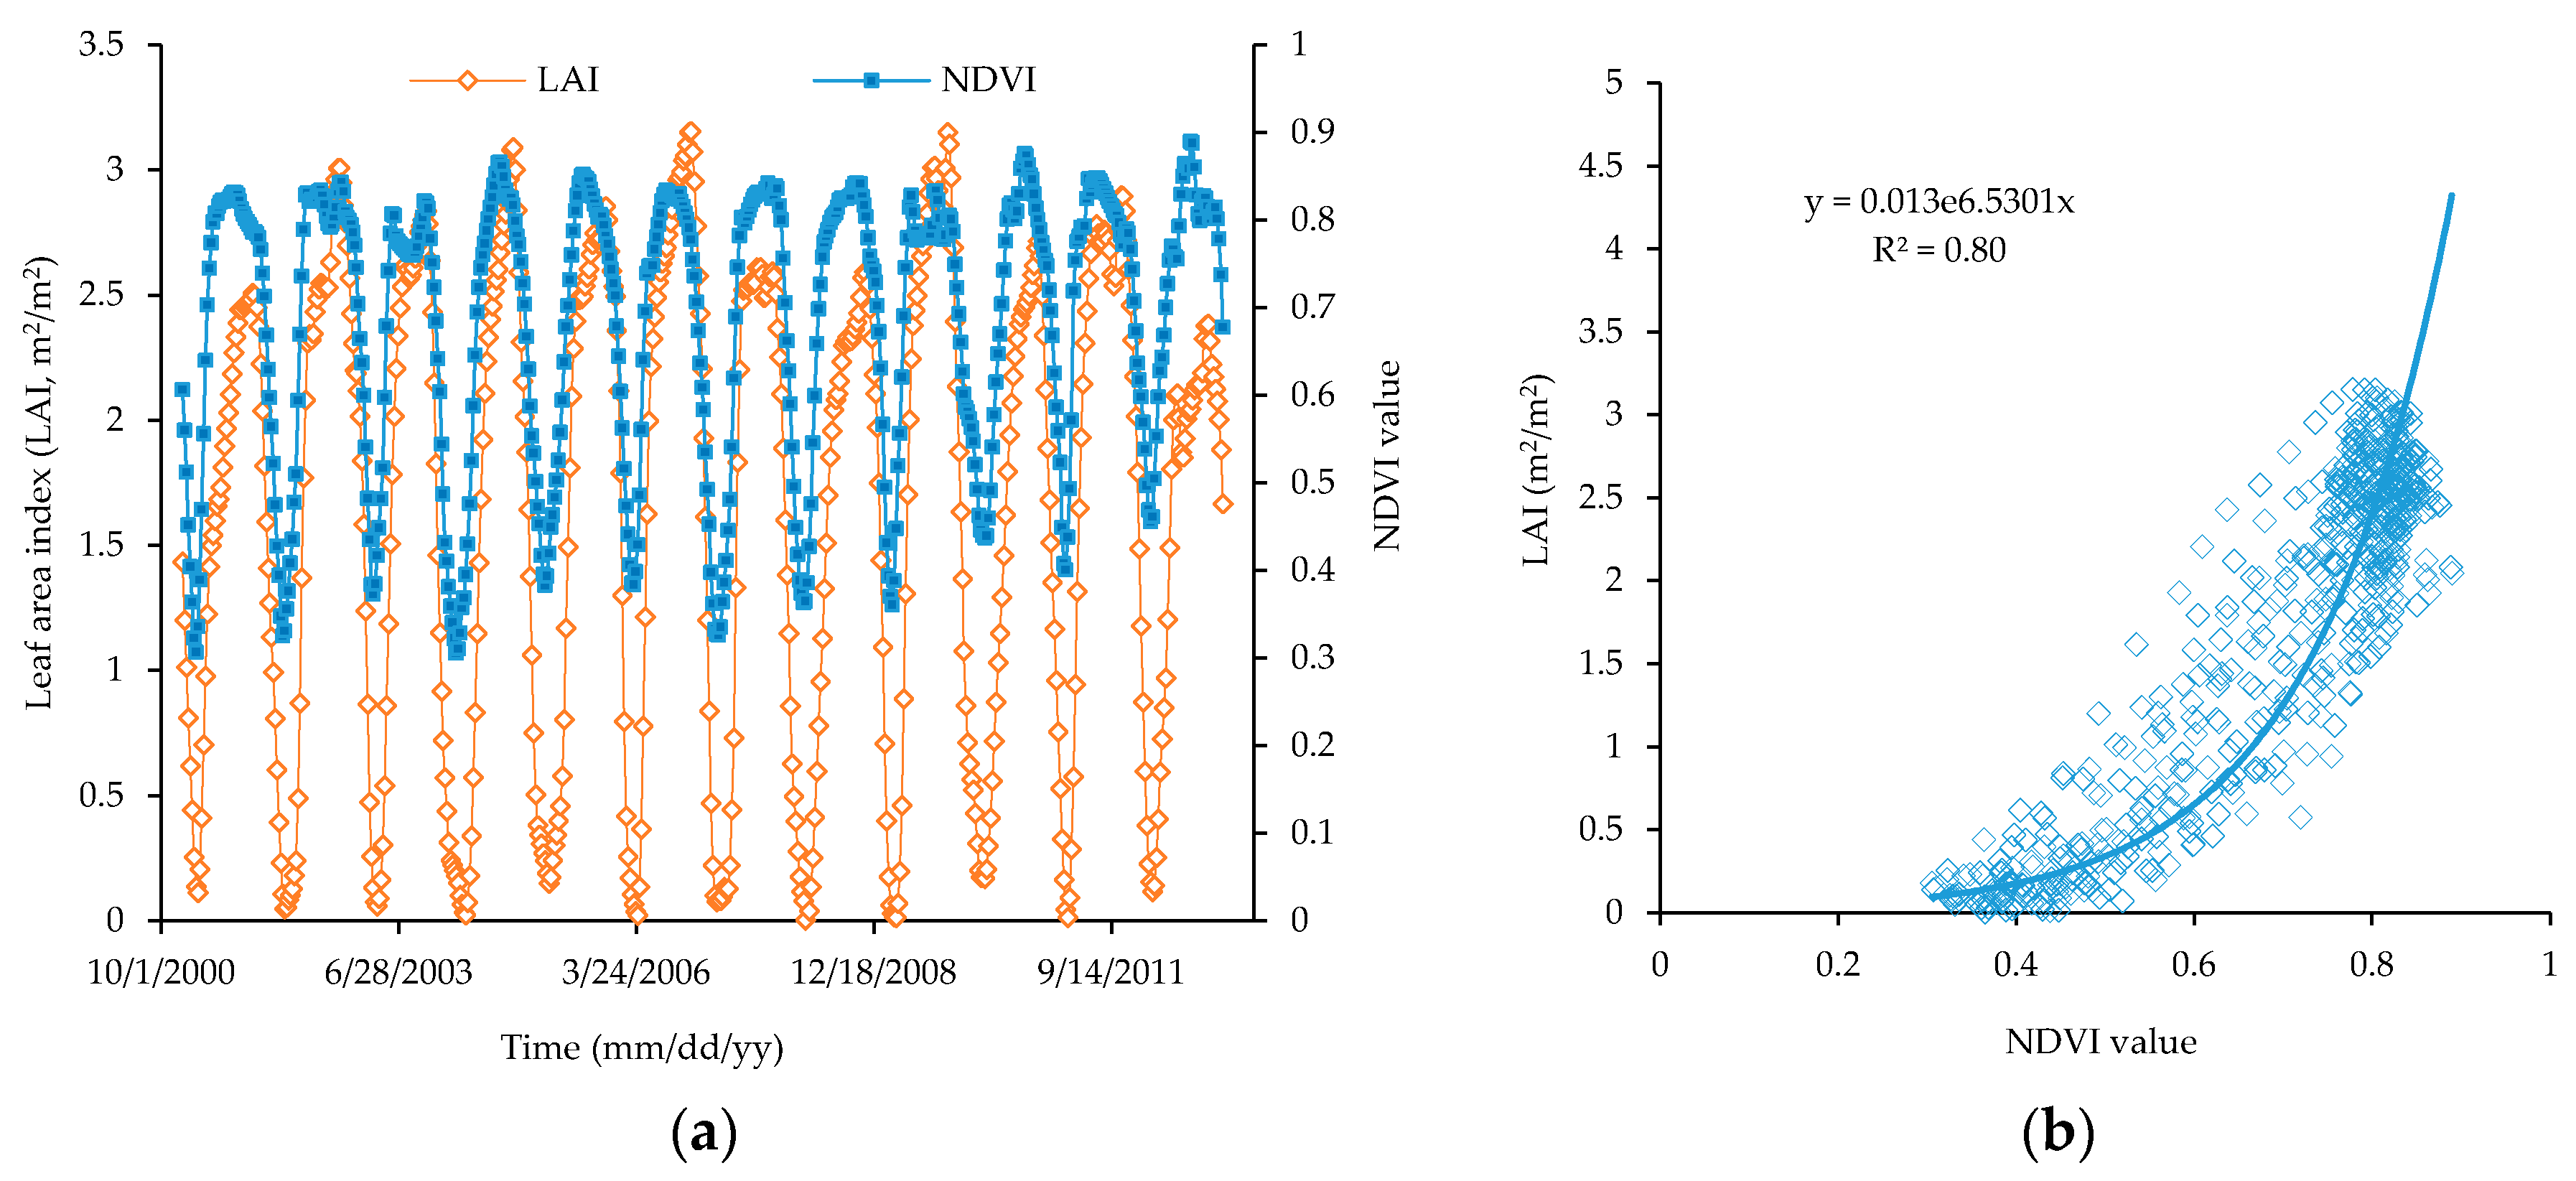
3.3.1. Relationship between Satellite-Based NDVI and Observed LAI of Teak Forest Plantation

In this study, satellite-based NDVI was compared against the observed LAI in a local teak forest plantation. NDVI showed a strong exponential relationship with the observed LAI (Figure 7). During the dry season, LAI decreased to the minimum value of about zero, while minimum NDVI remained around 0.3–0.4. However, NDVI seemed to be more sensitive than LAI during the onset of growing season, as NDVI increased more rapidly and reached the maximum value earlier than LAI (Figure 7a). The relationship between LAI and NDVI can be expressed as LAI = 0.013 e 6.53 NDVI , R2 = 0.80. For this deciduous teak forest, the NDVI becomes saturated at LAI around ≥ 2 m2/m2 (Figure 7b). Potithep et al. [49] also found an exponential relationship between NDVI and in situ LAI in a deciduous forest and NDVI was saturated at values over 0.8. Thus, it is confirmed that the pre-processing NDVI data set has a significant relationship to LAI and its capability for capturing the pattern of seasonality tropical deciduous forest in this study.
Figure 8 shows the relationship between SO S LAI and SO S NDVI at same thresholds-based (20%). Overall, the SOS derived from MODIS NDVI agreed well with that derived from LAI observation data. However, relationship between LO S LAI and LO S NDVI was rather weak. On average, SO S NDVI is 18 days earlier than SO S LAI and LO S NDVI is 30 days longer than LO S LAI , respectively. It is noted that SO S LAI and SO S NDVI were delayed about 4 days and 22 days, respectively in El Niño year (2010).

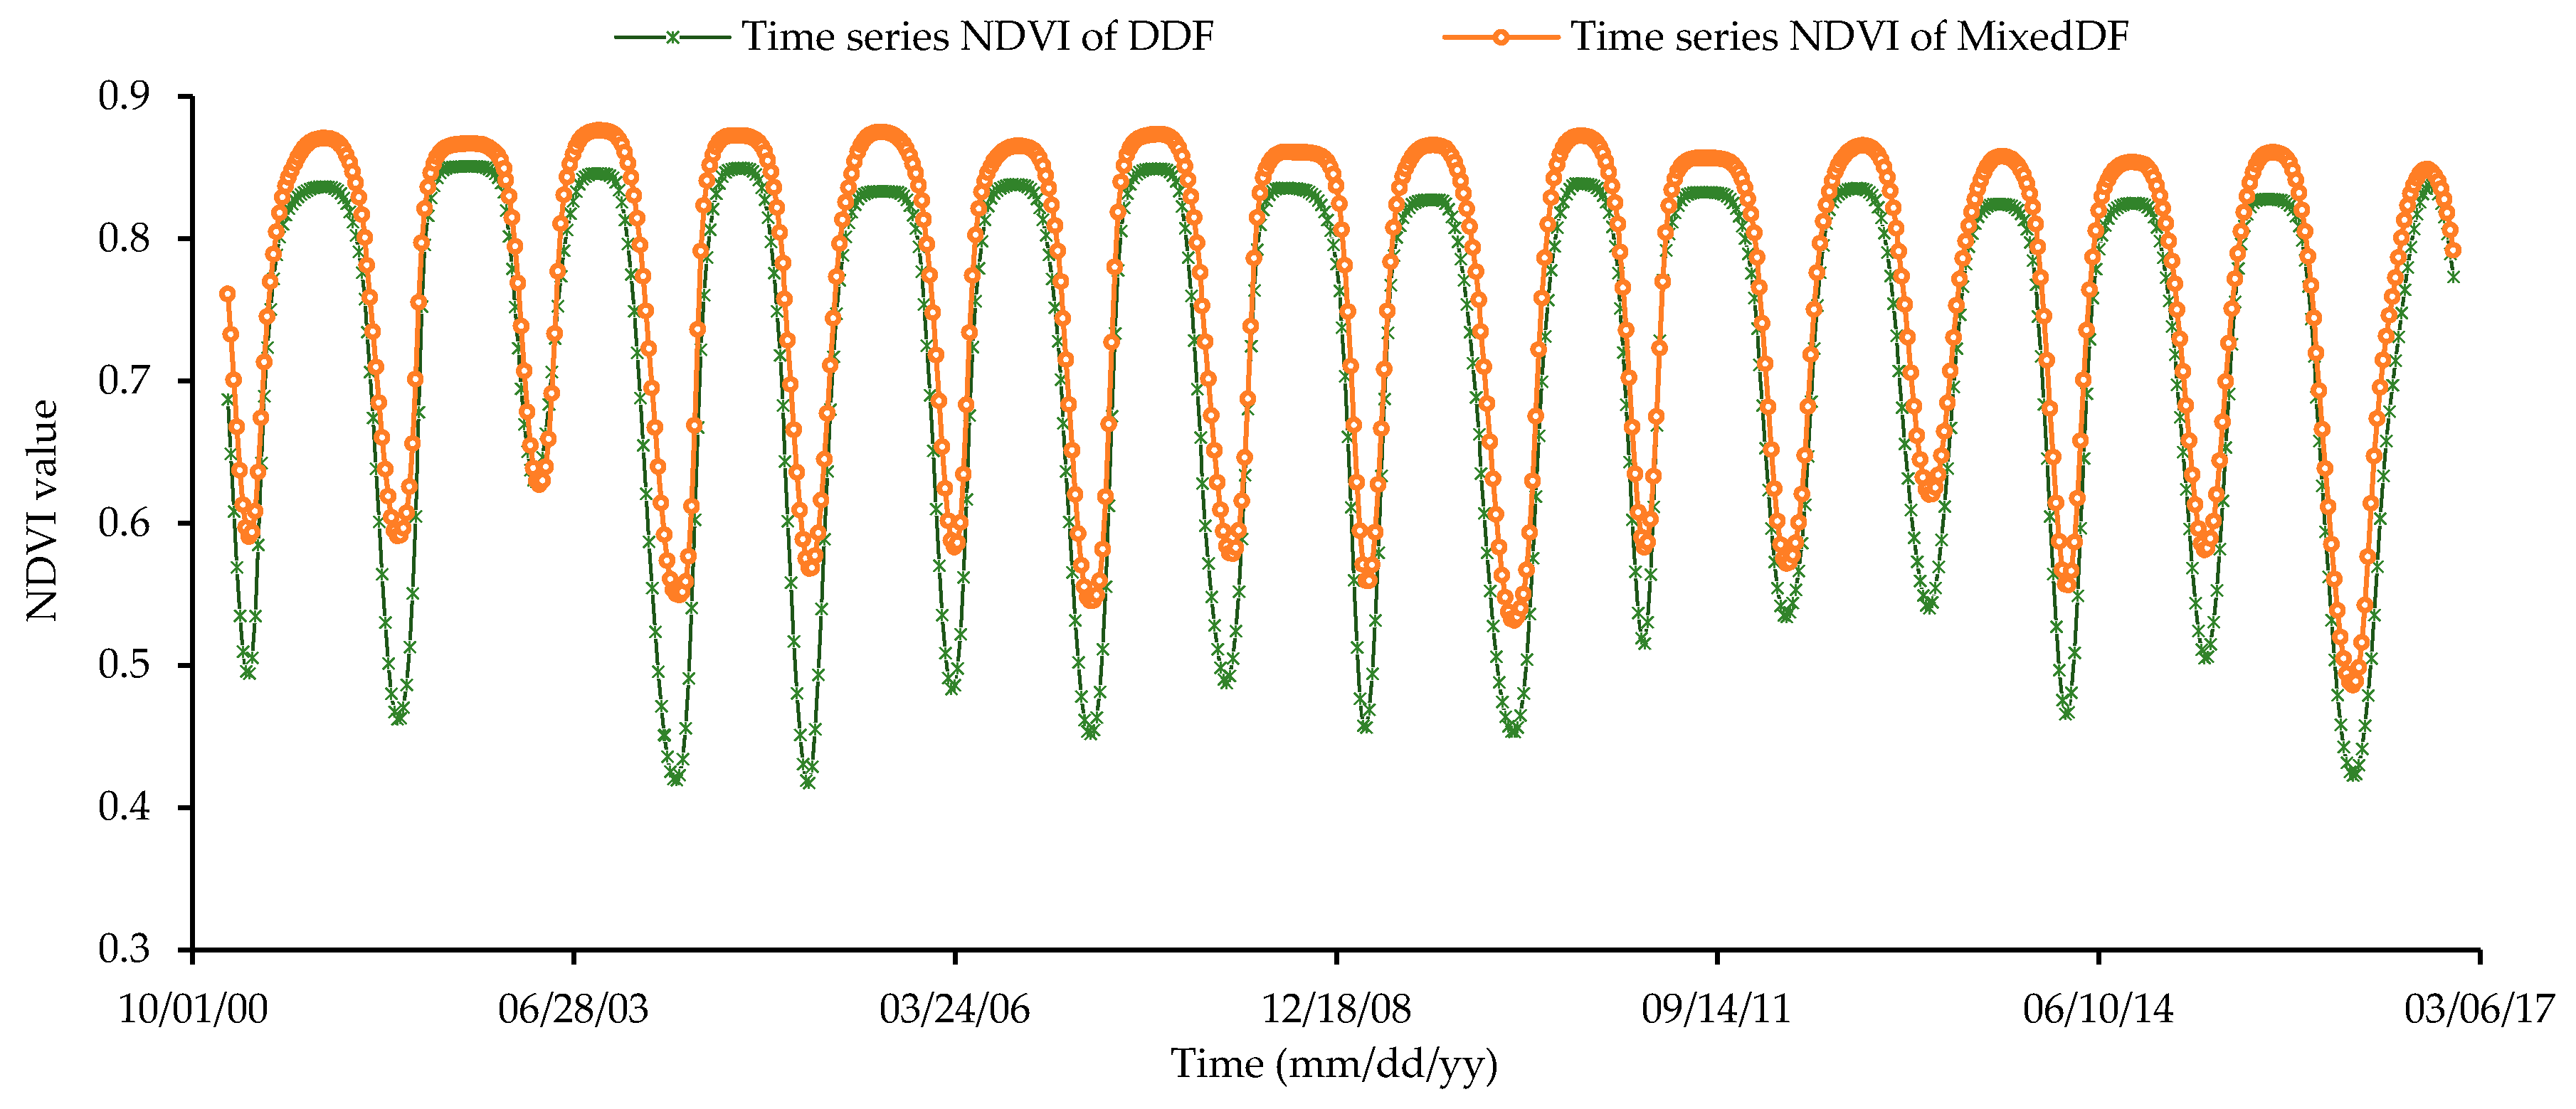
3.3.2. Temporal Variations of NDVI in Lampang Province during 2001–2016

In Lampang the rainy season starts around March to April, the same time as the deciduous forest starts to bud. A gradual increase in NDVI is also observed during this period (65–100 DOY). Rainy season ends around October to November, corresponding to the decrease of NDVI values during this period (Figure 9). The timing of the minimum NDVI value varied among different forest types. The minimum NDVI value of DDF occurred in March/April and it is lower than the minimum NDVI value of MDF in general. On the other hand, the maximum NDVI value of DDF occurred in June/July and it is also lower than the maximum NDVI of MDF. The seasonal pattern for growing season each year cycle can be described as follows:
NDVI was generally at its lowest (0.3–0.4) during the hottest period of the year (February to April), which is comparable to the field observations of LAI. NDVI then increased rapidly for 4–5 weeks, overlapping with the period of decreasing in temperature and increasing in precipitation resulting in leaf expansion. NDVI reached their maximum peak (0.8–0.9) in JulyAugust, corresponding to maximum and saturation LAI value. NDVI then gradually decreased to below 0.5 and LAI below 2.0 in November, overlapping with the period with lower rainfall and cooler temperature.

3.4. Variations of Phenological Metrics and the Effects of ENSO

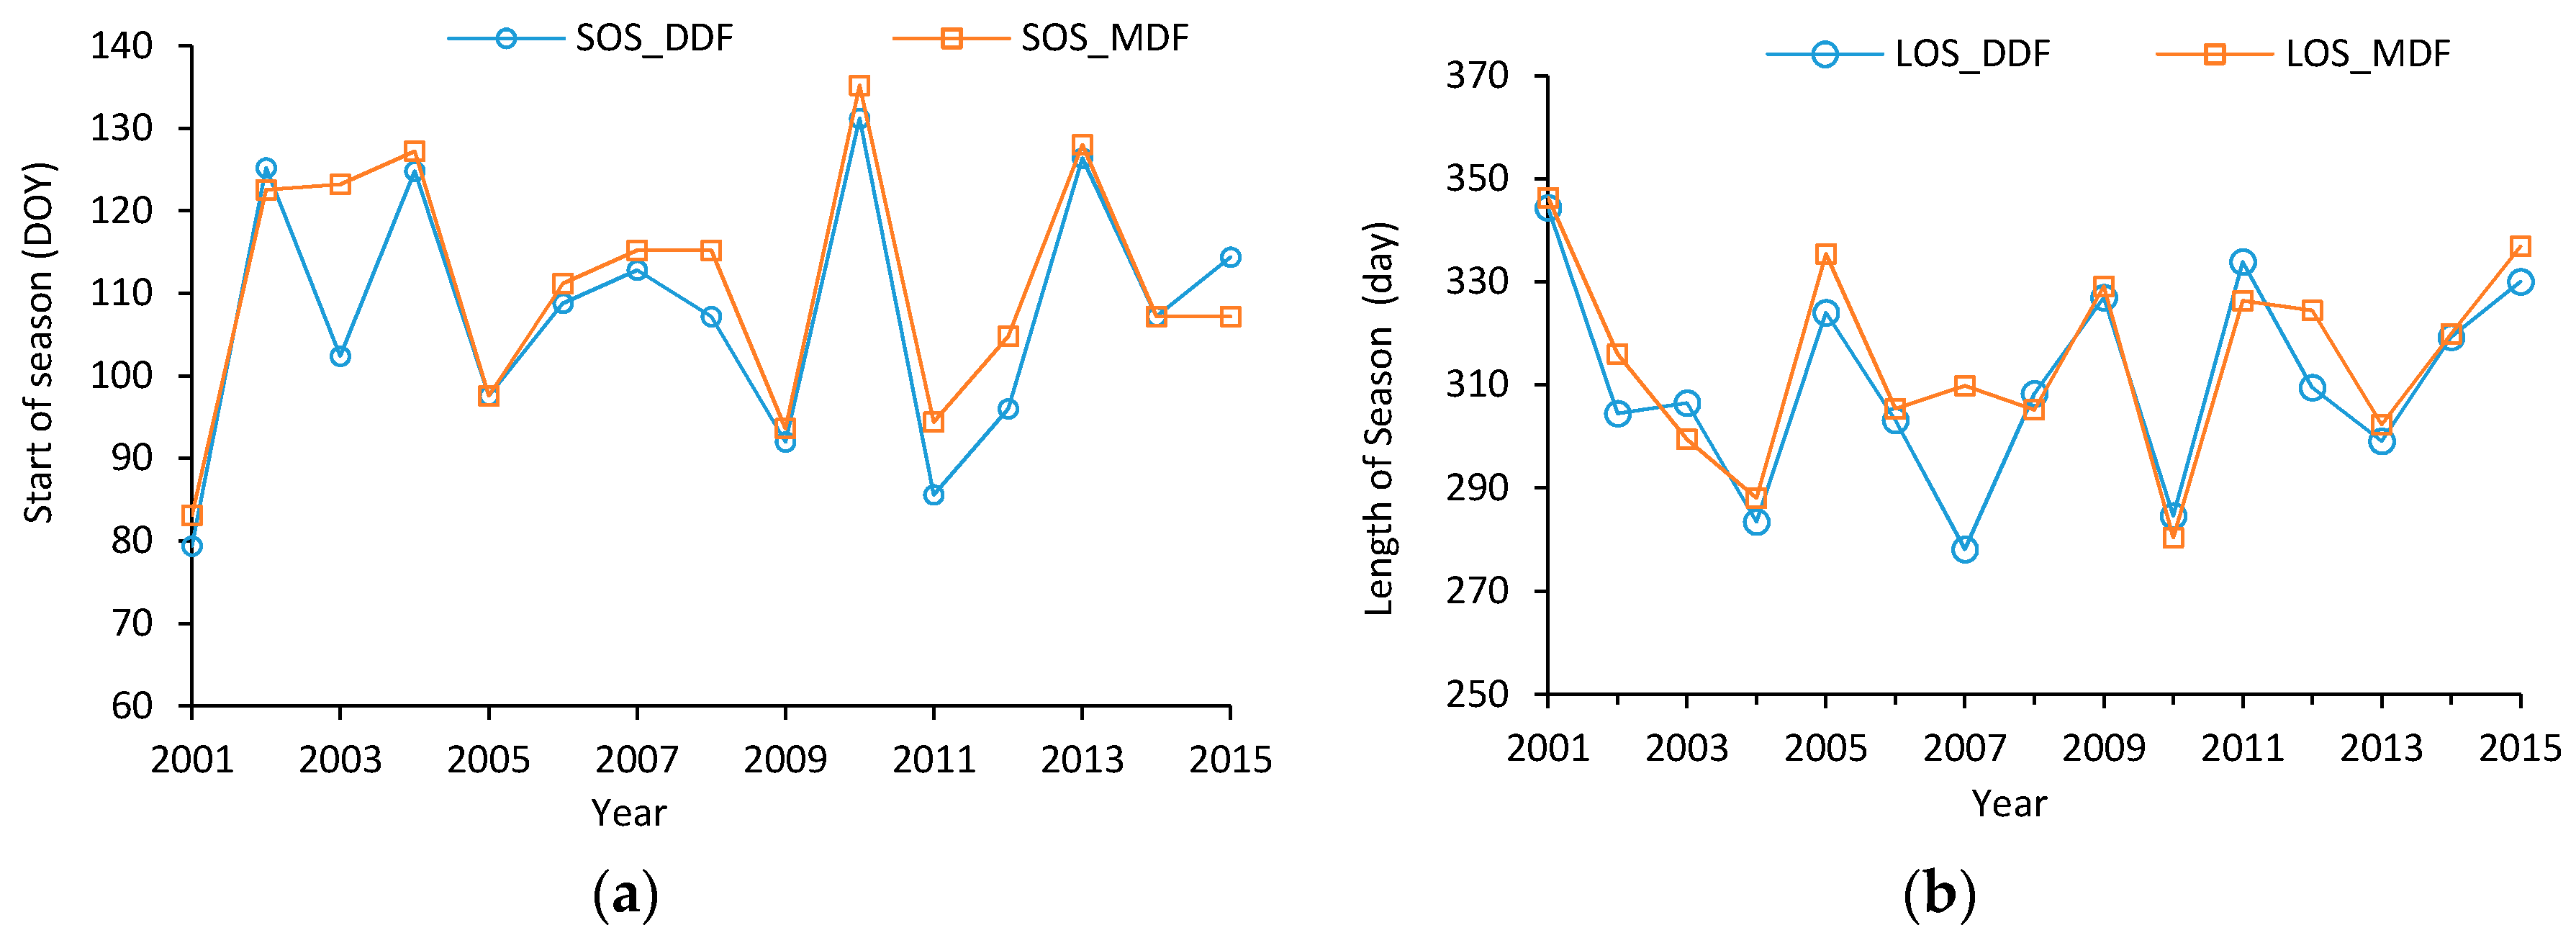
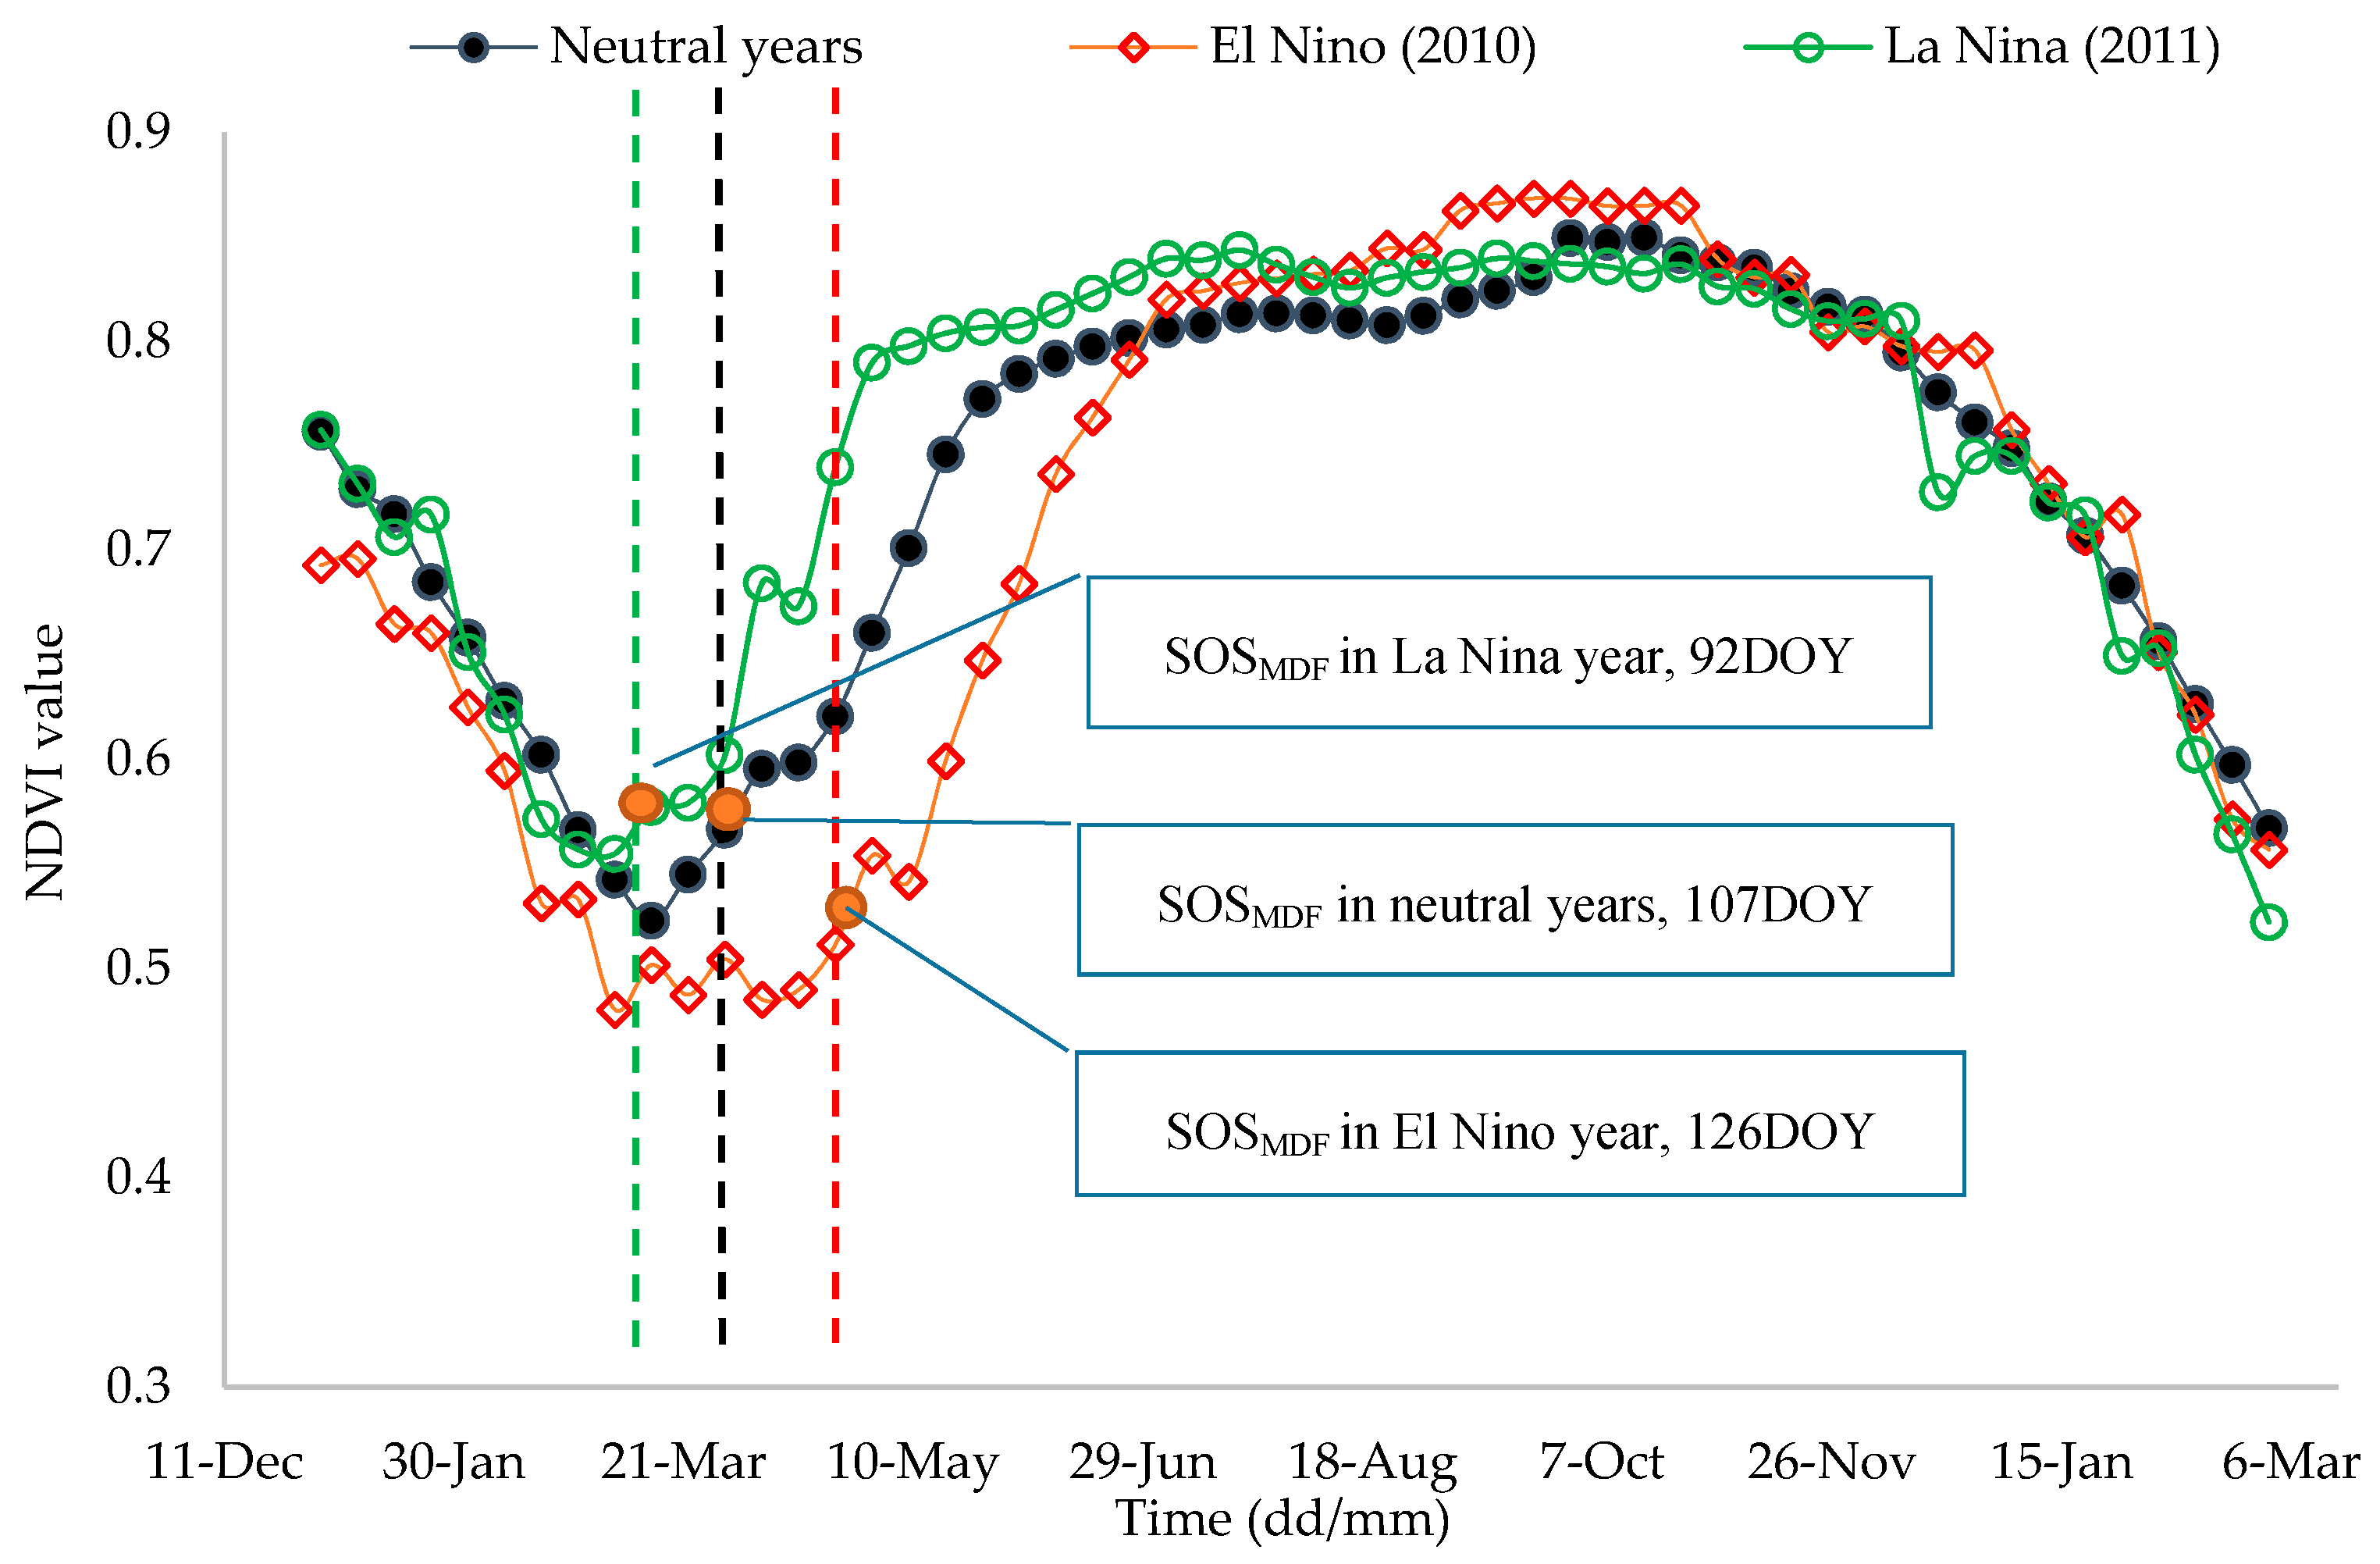
3.4.1. Temporal Variations

The temporal variations in tropical deciduous forest phenology metrics were examined for both the dry dipterocarp (DDF) and the mixed deciduous forests (MDF) pixels which were confirmed from field survey locations. The results are shown in Figure 10.
The average start of growing season for dry dipterocarp ( SOS DDF ) and start growing season for mixed deciduous forests ( SOS MDF ) during 2001–2015 were at DOY 113 ± 16, and 113 ± 15, respectively. On the other hand, length growing season of dry dipterocarp ( LOS DDF ) was about 302 ± 18 days, slightly shorter than the LOS MDF of 309 ± 17 days. During the El Niño (Year 2010), SOS DDF   and SOS MDF   was delayed about 26 days and 23 days, respectively and LOS DDF   and LOS MDF   was 19 days and 30 days shorter than the neutral year, respectively. On the other hand, during La Niña (Year 2011) SOS DDF   and SOS MDF   was 23 and 18 days advanced, whereas LOS DDF   and LOS MDF   was 24 and 13 days, respectively, longer than in the neutral years. An example of the difference in phenological metrics between El Niño (Year 2010) and La Niña (Year 2011) to average of phenology metrics during 2001–2015 is illustrated in Figure 11. It is obvious that ENSO significantly affects the start of the season while the effects of ENSO on the end of season was not clear as that of the start of the season.

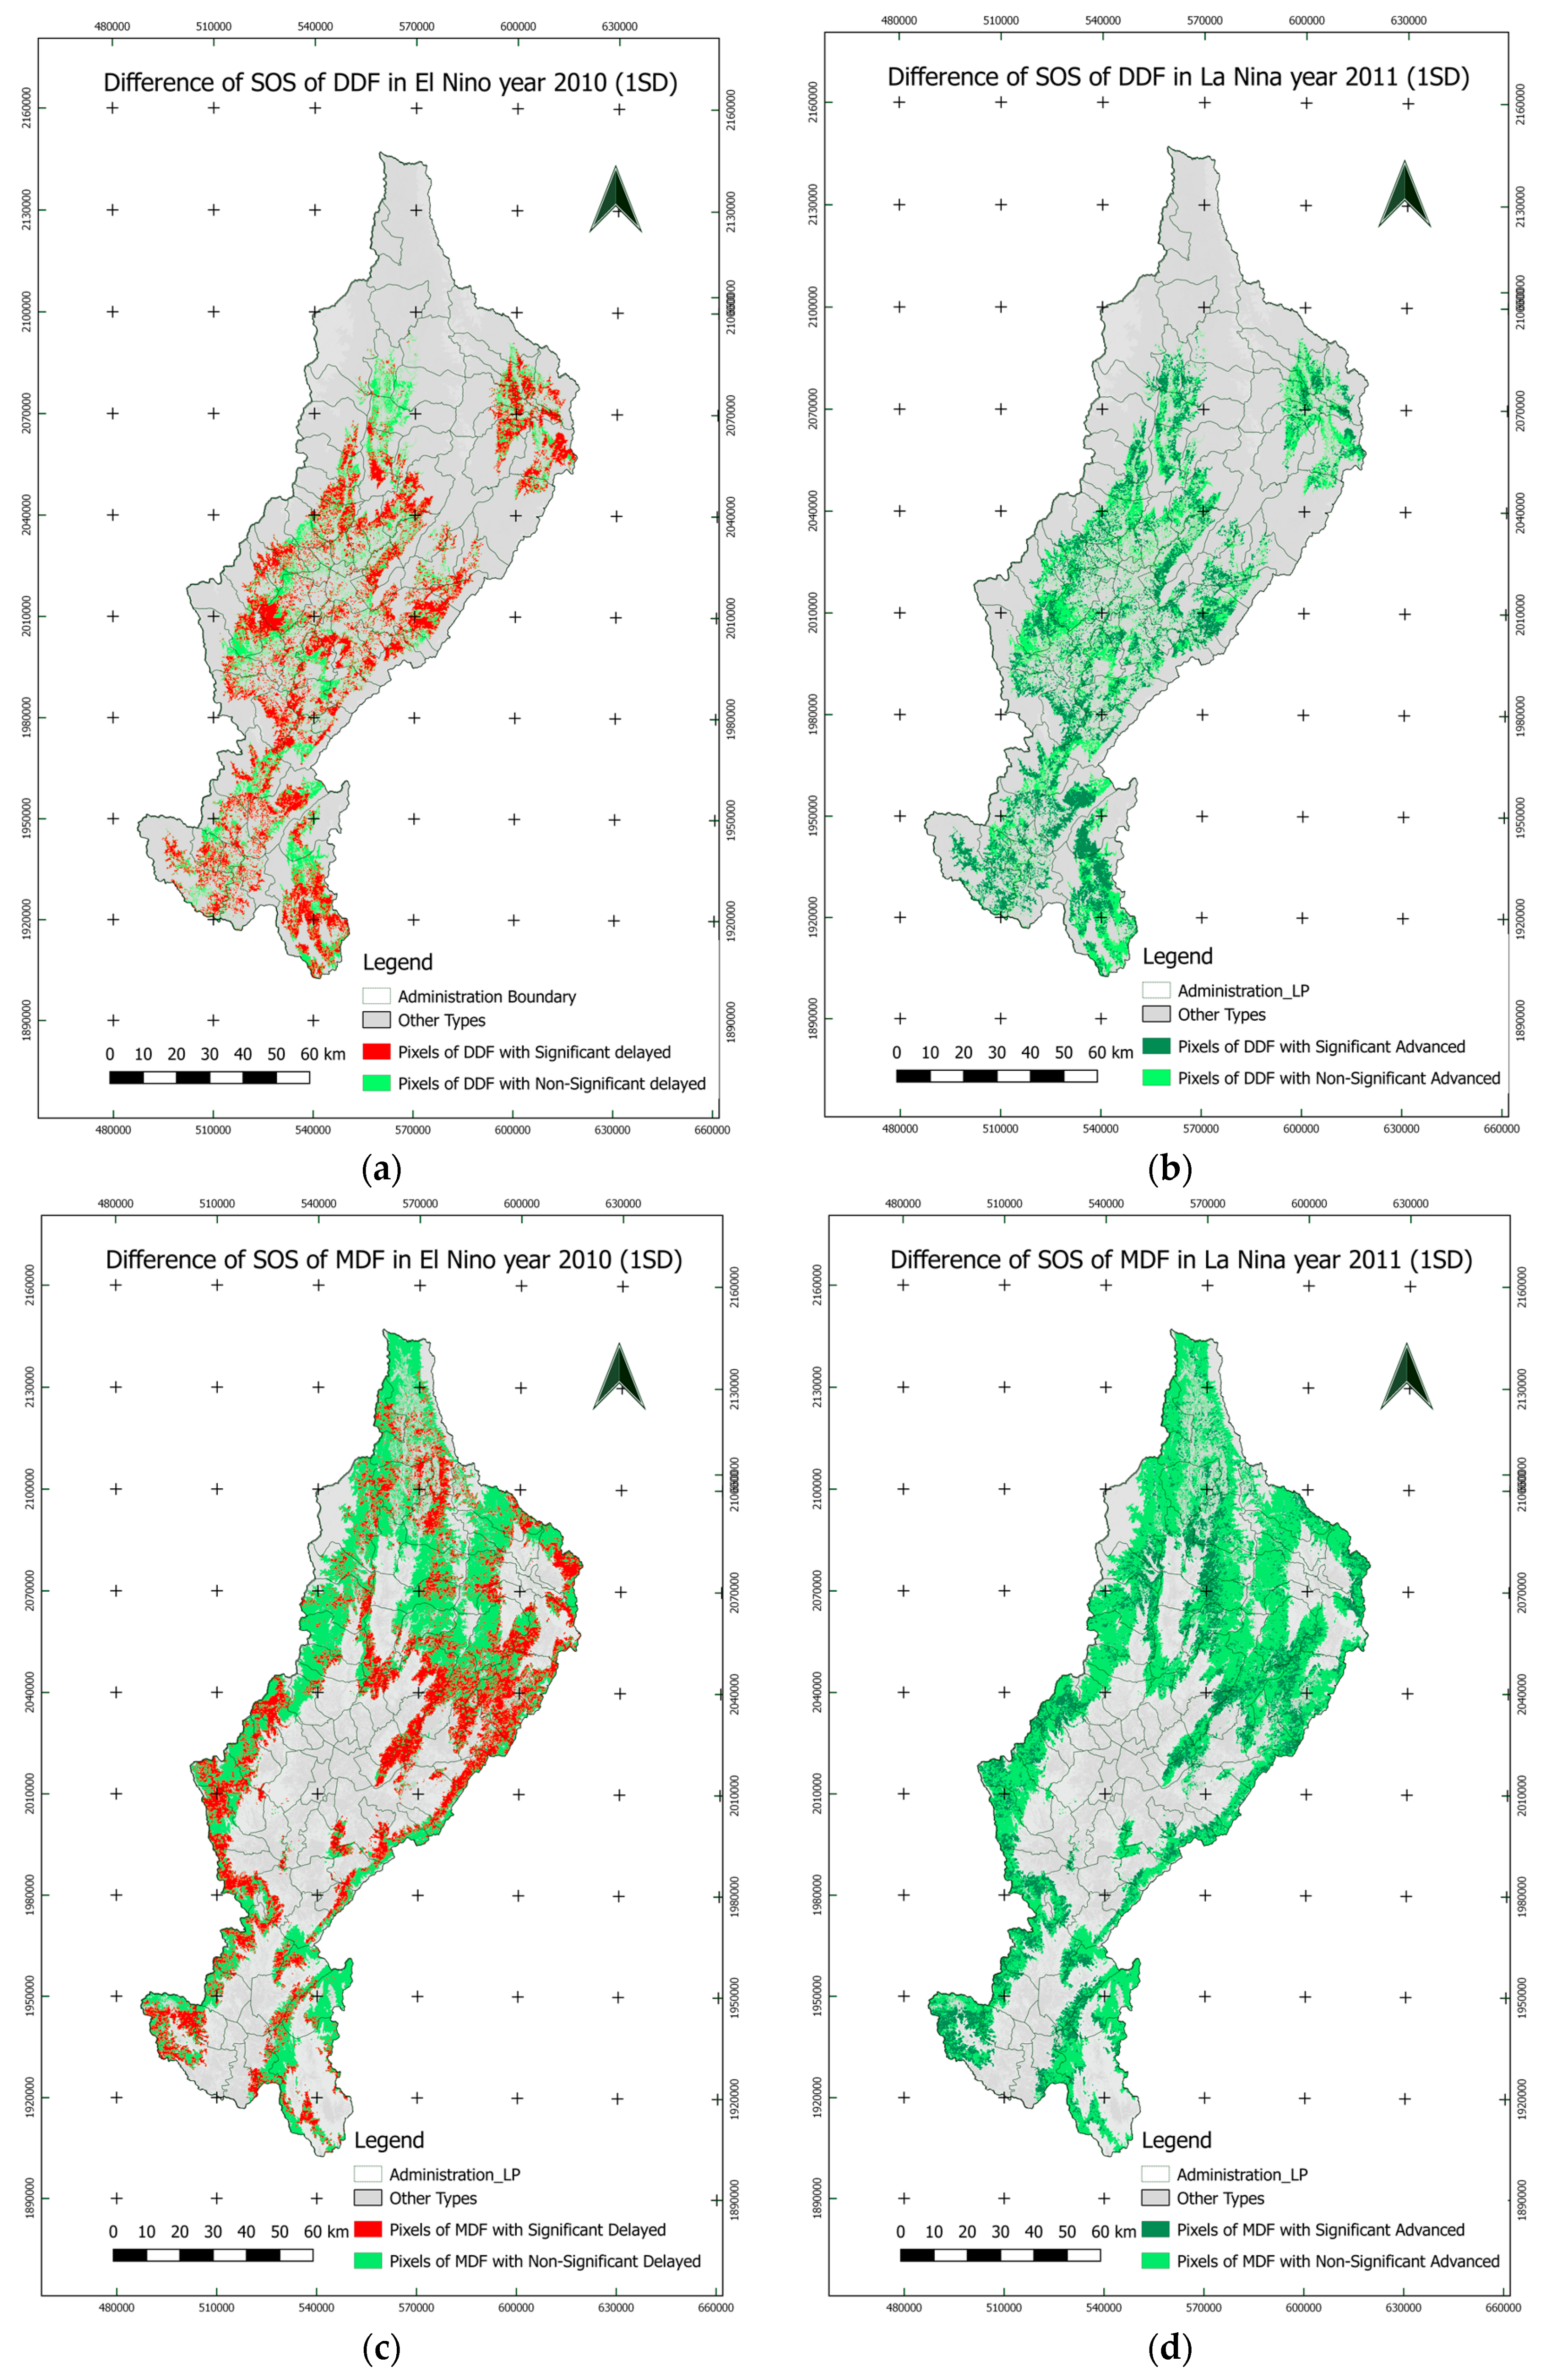
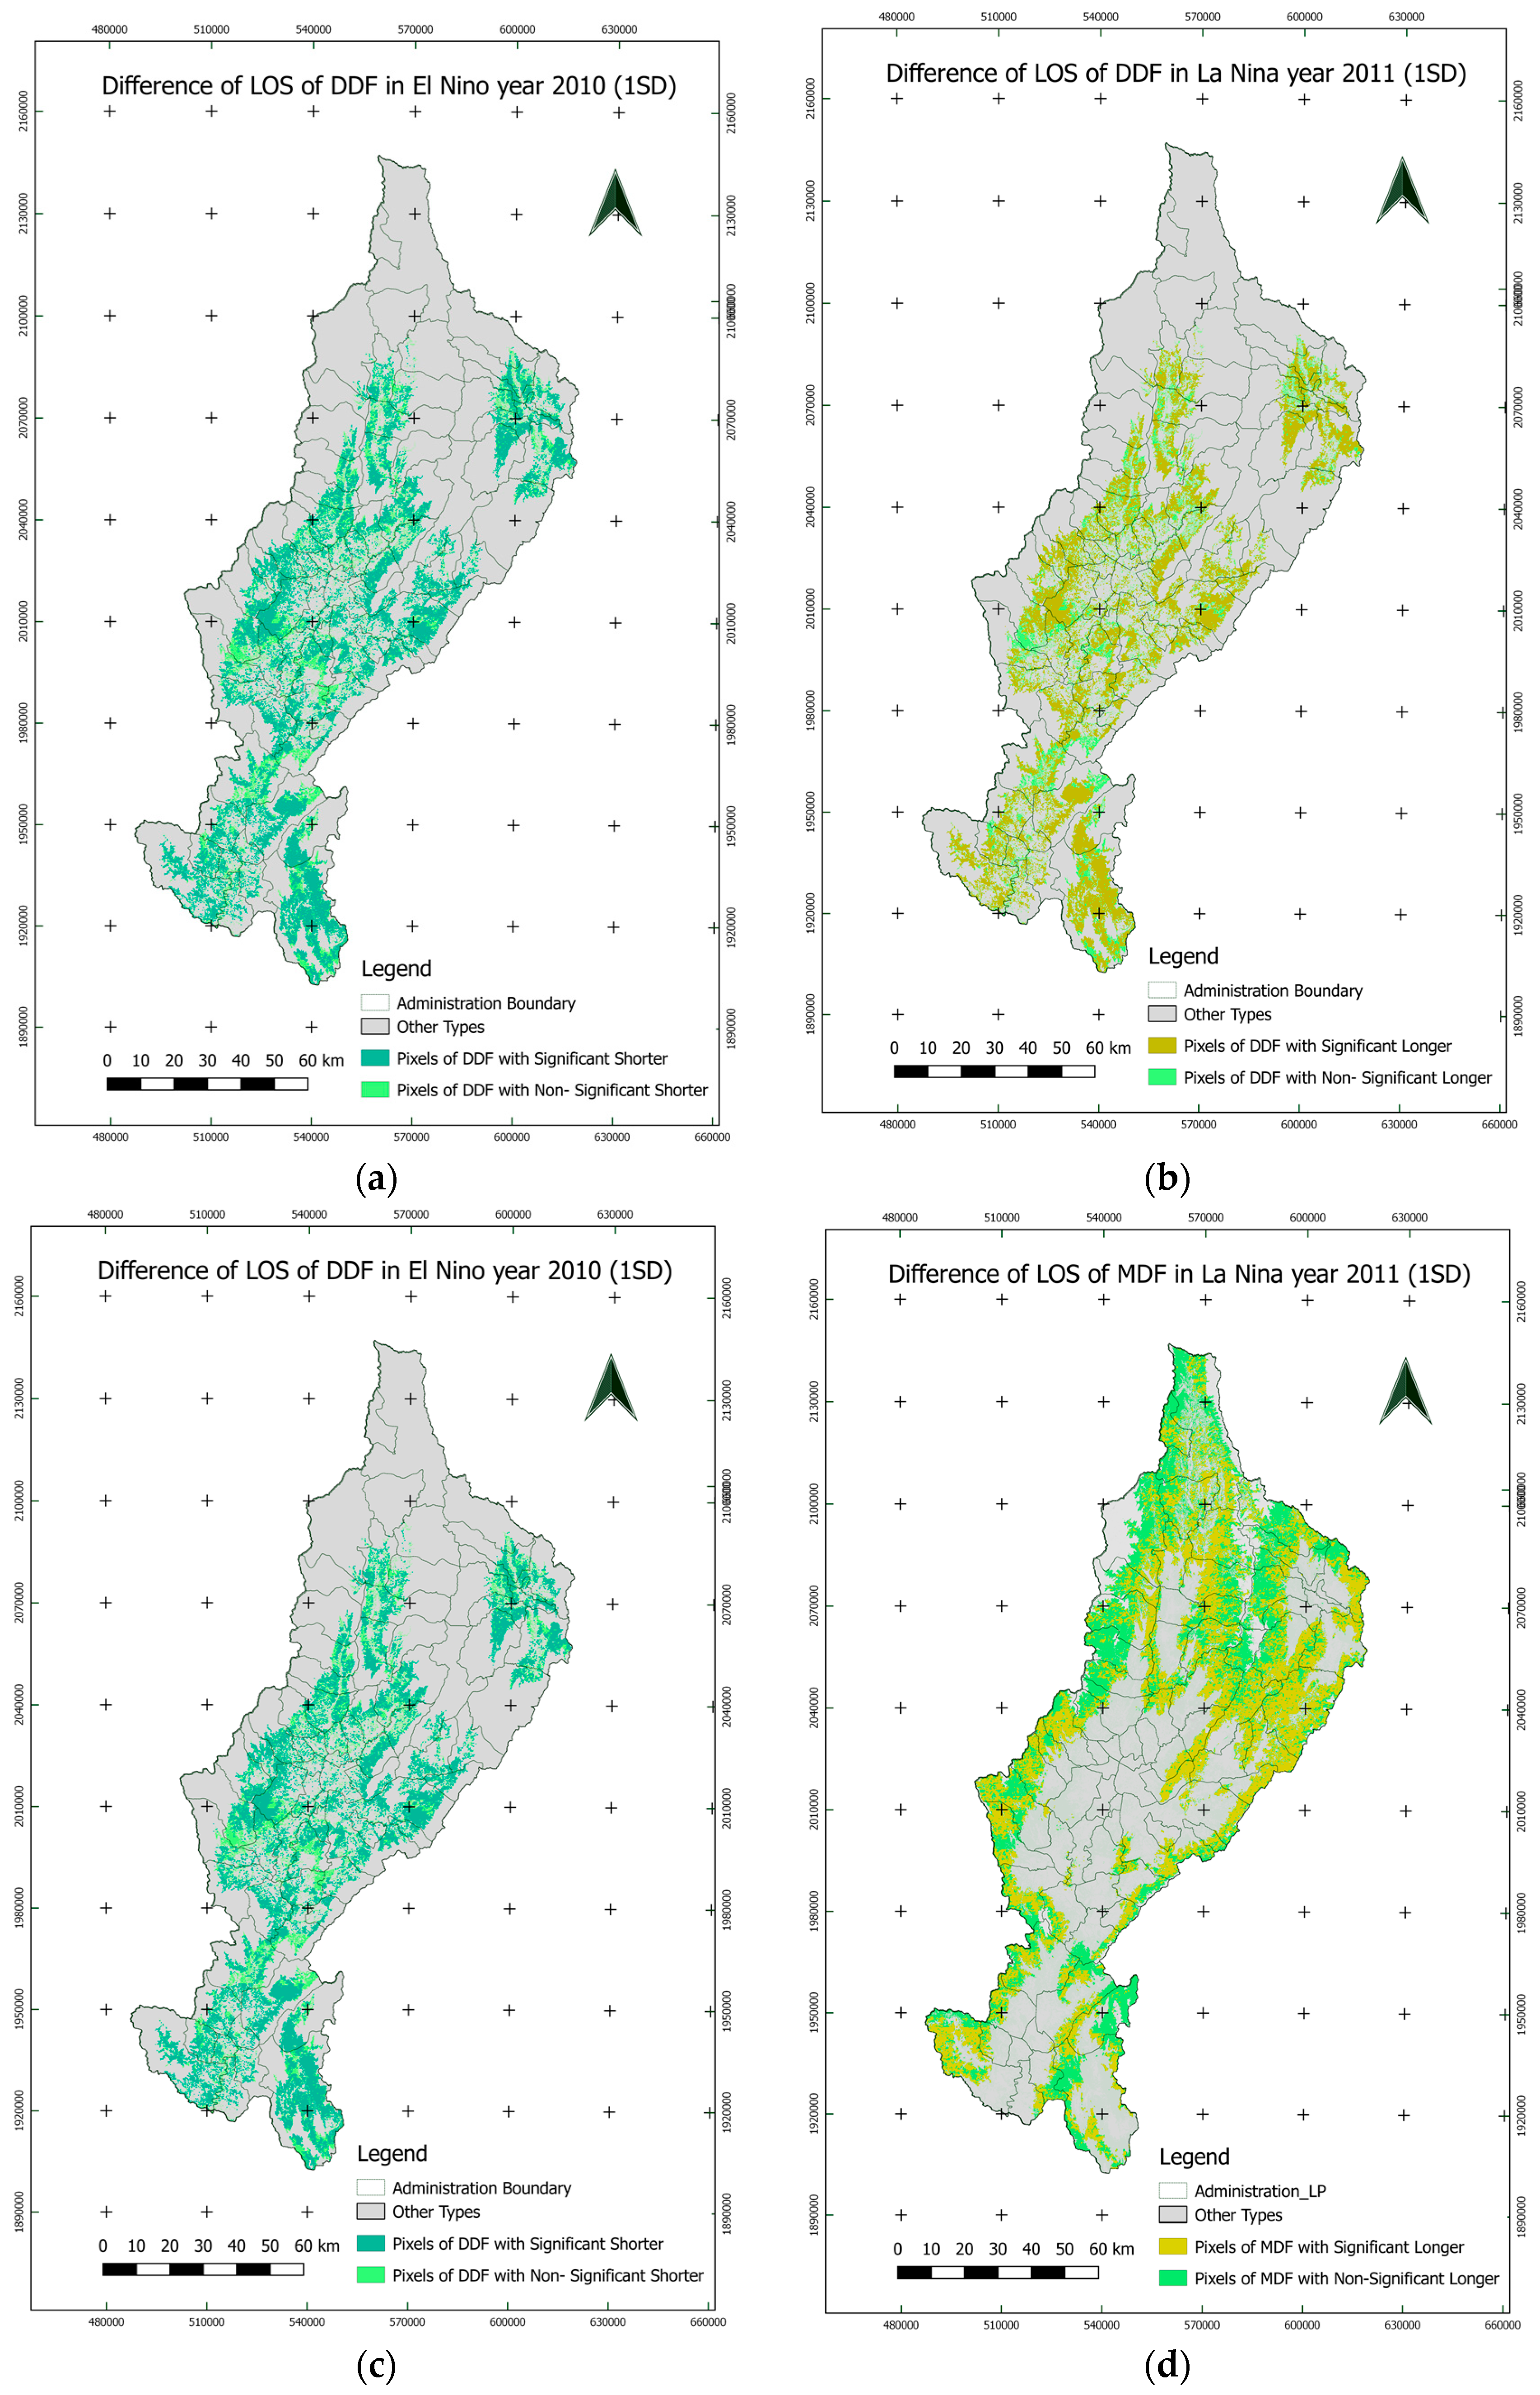
3.4.2. Spatial Variations

In order to investigate more details of phenological metrics for two different deciduous forest types (DDF and MDF), we created the mask for different forest types, then phenological metrics for each forest types were extracted and analyzed separately (Figure 12 and Figure 13). We can see that the earliest SOS DDF   was in March (DOY 80–90) which mainly occurred in southern part of Lampang. The latest SOS DDF   mainly appeared in May (DOY 130–140). This mainly occurred in the northern part of Lampang which may be caused by differences in precipitation and/or altitude (Figure 12). On the other hand, the average SOS MDF   ranged between DOY 80 and DOY 140. Similar to SOS DDF , SOS MDF   occurred earlier in the lower altitude of the southern part compared to northern parts of Lampang (Figure 12).
For LOS, LOS DDF   mainly ranged from 280 to 330 days while LOS MDF   from 290 to 340 days. There is no obvious difference in LOS DDF   and LOS MDF   between northern and southern parts as those found in SOS (Figure 13). There is a slight difference of phenology (SOS and LOS) between DDF and MDF, and their responses to ENSO year is analyzed below. The average SOS DDF   in neutral years during 2001–2015 occurred at DOY 106.4 ± 7, similarily to SOS MDF   at DOY 106 ± 7. On the other hand, the average of LOS DDF   in neutral years was about 307 ± 14 days, slightly shorter than the LOS MDF   with 319 ± 13 days (Table 2).
Overall, the growing season ( SOS DDF ) started on the 106 ± 7 DOY during the neutral years, delayed to 132 DOY during El Niño (Year 2010) and advanced to 87 DOY in La Niña year (Year 2011). It was delayed about 19 to 33 days in El Niño and was earlier about 13 to 27 days in La Niña (1SD). SOS MDF   started almost same time as of SOS DDF on the 107 ± 7 DOY during the neutral years but was delayed to 127 DOY and advanced to 92 DOY during El Niño and La Niña years, respectively. The SOS MDF   was delayed by about 12 to 28 days in El Niño and was earlier by about 8 to 22 days in La Niña (1SD).
The LOS of these tropical deciduous forests, as indicated by the presence of live canopy, was significantly shorter in that El Niño year compared to neutral years in this study. The results from ANOVA test confirmed that the difference in SOS or LOS between ENSO and neutral years is statistically significant (p ≤ 0.05). During the El Niño (Year 2010), SOS DDF   and SOS MDF   was delayed about 35 days and 29 days, respectively and LOS DDF   and LOS MDF   was 31 days and 29 days shorter than the neutral years, respectively. On the other hand, during La Niña (Year 2011) SOS DDF   and SOS MDF   was 24 and 23 days advanced, whereas LOS DDF   and LOS MDF   was 15 and 9 days, respectively, longer than in the neutral years (p ≤ 0.05). However, we acknowledge that the large sample sizes may result in significant test even if the difference is small and biologically insignificant.
The analysis presented here showed a significant impact of extreme climate events (El Niño and La Niña years) on the timing of leaf flush and the length of growing season in two tropical deciduous forest types in northern Thailand. Moreover, the degree and nature of impact was different between the forest types. In this study, during the El Niño year, the anomaly of maximum temperature significantly increased and summer monsoon rainfall significantly decreased (Figure 5). Suepa et al. [43] also indicated that at there is significant reduction of vegetation growth during EL Niño year. The mechanisms controlling leaf phenology in dry tropical forest are related to water limitation as opposed to light limitation in tropical rainforests [9]. A previous study at the same location [47] found that the interannual variation of the timing of leaf flush responded to increasing soil moisture during March to May. Recent studies of climate impacts on leaf phenology in deciduous species within Asian monsoon and neotropical climate regions observed that differences in rehydration processes following the dry season associated with differences in micro-sites water availability were key in determining the primary factors controlling leaf flush and its response to rainfall [50,51]. In our study, higher maximum temperature and lower precipitation during summer (March, April) likely result in higher water stress during the dry season, which leads to a significant delay in start of growing season during El Niño. In contrast, the higher precipitation and lower maximum temperature in dry season leads to advanced SOS during La Niña year.
The response of tropical deciduous forest was also found in the other El Niño years (e.g., in 2004, Figure 5) where anomaly temperature was higher (+0.37 °C) and precipitation was much lower (−373.3 mm) than neutral years. The average of SOS DDF   and SOS MDF   in 2004 were 122 ± 12 DOY and 120 ± 13 DOY, a delay of 16 and 13 days, respectively. The average of LOS DDF   and LOS MDF   were 277 ± 18 days and 291 ± 18 days, 30 and 28 days respectively shorter compared to the neutral years. This result confirms the effect of El Niño to shifting of tropical deciduous forest phenology metrics. From the analysis we did not find a significant difference in SOS and LOS between DDF and MDF in El Niño year. However, LOS of DDF was significantly longer (15 days) than that LOS of MDF (8 days) in La Niña years (Table 2).
In other years, La Niña (e.g., 2006) where anomaly temperature was close to zero and precipitation was much higher than the average, the variations of tropical deciduous forest phenology metrics were small. It could be explained by very small variation of maximum temperature anomaly and precipitation anomaly in March and April of year 2006. Differences in phenological response to ENSO events between the two forest types were likely related to variations in soil moisture and elevation. The deciduous dipterocarp forests and the teak plantation area are generally located in lower elevation areas ranging from 300 m to 800 m, while mixed deciduous forest extends mostly from 800 m to 1000 m [20]. At the lower elevation, deciduous dipterocarp forest canopy is more open and soils tend to be drier with thinner organic layers and coarser texture relative to the mixed deciduous forest [20]. This is consistent with lower NDVI values during the dry season in the DDF forest type relative to the MDF (Figure 9). It is noted that this study does not consider other related factors that may affect phenology as solar radiation, species diversity, soil layer and soil moisture, which should be addressed in follow-up studies. Further investigation could reveal how the micro-climate, forest species, and soil moisture differ along elevation gradients. Long-term field measurements at different topographic locations would help to enhance our understanding of micro-climatic impact on this forest ecosystem.

4. Conclusions

It is important to gain a better understanding of the phenological responses of tropical deciduous forests to extreme climate events as it will help inform the development of adaptation strategies to reduce the risk declining forest health associated with future climate change. In this study, various data types including meteorological observation, remote sensing, forest inventory maps, digital elevation models, and in situ LAI observation were applied to evaluate the response of tropical deciduous forest to extreme climate anomalies including ENSO events.
The results indicate that phenological metrics of tropical deciduous forest (including dry dipterocarp forest and mixed deciduous forest) varied in response to precipitation and temperature anomalies associated with ENSO events. During the El Niño, significant delay of SOS DDF   and SOS MDF (20–26 days) and shorter of LOS DDF   and LOS MDF   (26–28 days) were found in most of areas whereas the larger difference was found in DDF. During the La Niña, significant advancement of SOS DDF   and SOS MDF (15–20 days) and longer of LOS DDF   and LOS MDF (8–15 days) were found in most of areas whereas the larger was difference found in DDF. Since frequency and intensity of extreme climate events including ENSO are predicted to increase in the future, tropical deciduous forests may become increasingly vulnerable. Furthermore, climatic impacts on the distribution and productivity of this large region could have significant feedback on global climate systems.

Author Contributions

P.K.D., A.C., U.P. and P.V. provided the overall idea for this research and designed the methodology and wrote the manuscript. P.K.D., U.P., A.S., S.P., and K.L. planned and carried out the field survey for topographic correction, forest classification, accuracy assessment. P.K.D. implemented the analysis on the effect of ENSO to forest phenology. K.T. provided and suggested the data for validation of phenology. M.Y.L. provided comments and edited on the paper.

Funding

This research was funded by the United States Agency for International Development (USAID) and the National Science Foundation under the Partnership for Enhanced Engagement in Research (PEER) program (Grant number PGA-2000003836). This study is part of a project entitled “Analysis of historic forest carbon changes in Myanmar and Thailand and the contribution of climate variability and extreme weather events”.

Acknowledgments

We gratefully thank M. Alber for supports to this project. The research was carried out in collaboration with the Royal Forest Department, Thailand. We thank N. Yoshifuji of Forestry and Forest Products Research Institute, who provided LAI data at Mae Mo teak plantation and R. Kaewthongrach King Mongkut’s University of Technology Thonburi for supports of specific site information.

Conflicts of Interest

The authors declare no conflict of interest.

References

  1. U.S. DOE. Research Priorities for Tropical Ecosystems Under Climate Change Workshop Report; DOE/SC-0153; U.S. Department of Energy Office of Science: Washington, DC, USA, 2012.
  2. European Climate Foundation. The UN Intergovernmental Panel on Climate Change (IPCC) Fifth Assessment Report (AR5): Implications for Business; European Climate Foundation: Cambridge, UK, 2013. [Google Scholar]
  3. Nakagawa, M.; Tanaka, K.; Nakashizuka, T.; Ohkubo, T.; Kato, T.; Maeda, T.; Sato, K.; Miguchi, H.; Nagamasu, H.; Ogino, K.; et al. Impact of Severe Drought Associated with the 1997–1998 El Niño in a Tropical Forest in Sarawak. J. Trop. Ecol. 2000, 16, 355–367. [Google Scholar] [CrossRef]
  4. Asner, G.P.; Townsend, A. Satellite Observation of El Nino Effects Effects on Amazon Forest Phenology and Productivity. Geophys. Res. Lett. 2000, 27, 981–984. [Google Scholar] [CrossRef]
  5. FAO. Forest Resources Assessment 1990—Non-Tropical Developing Countries Mediterranean Region; FAO: Rome, Italy, 1990. [Google Scholar]
  6. Cavaleri, M.A.; Coble, A.P.; Ryan, M.G.; Bauerle, W.L.; Loescher, H.W.; Oberbauer, S.F. Tropical Rainforest Carbon Sink Declines during El Niño as a Result of Reduced Photosynthesis and Increased Respiration Rates. New Phytol. 2017, 216, 136–149. [Google Scholar] [CrossRef] [PubMed]
  7. Rolim, S.G.; Jesus, R.M.; Nascimento, H.E.M.; Do Couto, H.T.Z.; Chambers, J.Q. Biomass Change in an Atlantic Tropical Moist Forest: The ENSO Effect in Permanent Sample Plots over a 22-Year Period. Oecologia 2005, 142, 238–246. [Google Scholar] [CrossRef] [PubMed]
  8. Holmgren, M.; Scheffer, M.; Ezcurra, E.; Gutiérrez, J.R.; Mohren, G.M.J. El Niño Effects on the Dynamics of Terrestrial Ecosystems. Trends Ecol. Evol. 2001, 16, 89–94. [Google Scholar] [CrossRef]
  9. Pau, S.; Okin, G.S.; Gillespie, T.W. Asynchronous Response of Tropical Forest Leaf Phenology to Seasonal and El Niño-Driven Drought. PLoS ONE 2010, 5, e11325. [Google Scholar] [CrossRef] [PubMed]
  10. Slik, J.W.F. El Nino Droughts and Their Effects on Tree Species Composition and Diversity in Tropical Rain Forests. Oecologia 2004, 141, 114–120. [Google Scholar] [CrossRef] [PubMed]
  11. Patra, P.K.; Ishizawa, M.; Maksyutov, S.; Nakazawa, T.; Inoue, G. Role of Biomass Burning and Climate Anomalies for Land-Atmosphere Carbon Fluxes Based on Inverse Modeling of Atmospheric CO2. Global Biogeochem. Cycles 2005, 19, 1–10. [Google Scholar] [CrossRef]
  12. Li, J.; Fan, K.; Xu, Z. Asymmetric Response in Northeast Asia of Summer NDVI to the Preceding ENSO Cycle. Clim. Dyn. 2016, 47, 2765–2783. [Google Scholar] [CrossRef]
  13. Richardson, A.D.; Keenan, T.F.; Migliavacca, M.; Ryu, Y.; Sonnentag, O.; Toomey, M. Climate Change, Phenology, and Phenological Control of Vegetation Feedbacks to the Climate System. Agric. For. Meteorol. 2013, 169, 156–173. [Google Scholar] [CrossRef]
  14. Saigusa, N.; Yamamoto, S.; Hirata, R.; Ohtani, Y.; Ide, R.; Asanuma, J.; Gamo, M.; Hirano, T.; Kondo, H.; Kosugi, Y.; et al. Temporal and Spatial Variations in the Seasonal Patterns of CO2 Flux in Boreal, Temperate, and Tropical Forests in East Asia. Agric. For. Meteorol. 2008, 148, 700–713. [Google Scholar] [CrossRef]
  15. Nanda, A.; Prakash, H.M.; Suresh, H.S.; Murthy, Y.L.K. Canopy, Understorey Leaf Phenology and Seasonality in Tropical Dry Forest, Southern India. Adv. For. Lett. 2016, 5. [Google Scholar] [CrossRef]
  16. Igarashi, Y.; Kumagai, T.; Yoshifuji, N.; Sato, T.; Tanaka, N.; Tanaka, K.; Suzuki, M.; Tantasirin, C. Environmental Control of Canopy Stomatal Conductance in a Tropical Deciduous Forest in Northern Thailand. Agric. For. Meteorol. 2015, 202, 1–10. [Google Scholar] [CrossRef]
  17. Royal Forest Department of Thailand. Forestry in Thailand; Royal Forest Department of Thailand: Bangkok, Thailand, 2009. [Google Scholar]
  18. Vaidhayakarn, C.; Maxwell, J.F. Ecological Status of the Lowland Deciduous Forest in Chang Kian. J. Sci. Technol. 2010, 4, 268–317. [Google Scholar]
  19. Kirtphaiboon, S.; Wongwises, P.; Limsakul, A.; Sooktawee, S.; Humphries, U. Rainfall Variability over Thailand Related to the El Nino-Southern Oscillation (ENSO). J. Sustain. Energy Environ. 2014, 5, 37–42. [Google Scholar]
  20. Maxwell, J.F.; Elliot, S.; Anusarnsunthorn, V. The Vegetation of Jae Sawn National Park, Lampang Province, Thailand. Nat. Hist. Bull. Siam Soc. 1997, 45, 71–97. [Google Scholar]
  21. Land Processes Distributed Active Archive Center - LP DAAC, USGS. Available online: https://lpdaac.usgs.gov/products/modis_products_table/mod09q1 (accessed on 01 July 2017).
  22. Land Processes Distributed Active Archive Center - LP DAAC, USGS. Available online: https://lpdaac.usgs.gov/products/modis_products_table/mod09a1 (accessed on 01 July 2017).
  23. Hoan, N.T.; Tateishi, R. Global MODIS 250 M Dataset for 10 Years (2003–2012) User’s Manual; Chiba University: Chiba, Japan, 2013. [Google Scholar]
  24. Tucker, C.J. Red and photographic infrared linear combinations for monitoring vegetation. Remote Sens. Environ. 1979, 8, 127–150. [Google Scholar] [CrossRef] [Green Version]
  25. The Land Processes Distributed Active Archive Center. Available online: https://lpdaac.usgs.gov/data_ Access/glovis (accessed on 10 April 2017).
  26. The Shuttle Radar Topographic Mission (SRTM). Available online: https://lta.cr.usgs.gov/SRTM (accessed on 22 October 2017).
  27. Wu, Q.; Jin, Y.; Fan, H. Evaluating and Comparing Performances of Topographic Correction Methods Based on Multi-Source DEMs and Landsat-8 OLI Data. Int. J. Remote Sens. 2016, 37, 4712–4730. [Google Scholar] [CrossRef]
  28. Pimple, U.; Sitthi, A.; Simonetti, D.; Pungkul, S.; Leadprathom, K.; Chidthaisong, A. Topographic Correction of Landsat TM-5 and Landsat OLI-8 Imagery to Improve the Performance of Forest Classification in the Mountainous Terrain of Northeast Thailand. Sustainability 2017, 9, 258. [Google Scholar] [CrossRef]
  29. Feng, S.; Hu, Q.; Qian, W. Quality Control of Daily Meteorological Data in China, 1951–2000: A New Dataset. Int. J. Climatol. 2004, 24, 853–870. [Google Scholar] [CrossRef]
  30. Peterson, T.C.; Russell, V.; Richard, S.; Vyachevslav, R. Global Historical Climatology Network (GHCN) Quality Control of Monthly Temperature Data. Int. J. Climatol. 1998, 1179, 1169–1179. [Google Scholar] [CrossRef]
  31. Friedl, M.A.; Gray, J.M.; Melaas, E.K.; Richardson, A.D.; Hufkens, K.; Keenan, T.F.; Bailey, A.; O’Keefe, J.A. Tale of Two Springs: Using Recent Climate Anomalies to Characterize the Sensitivity of Temperate Forest Phenology to Climate Change. Environ. Res. Lett. 2014, 9, 054006. [Google Scholar] [CrossRef]
  32. Wolf, S.; Baldocchi, D.; Wolf, S.; Keenan, T.F.; Fisher, J.B.; Baldocchi, D.D.; Desai, A.R. Warm Spring Reduced Carbon Cycle Impact of the 2012 US Summer Drought Warm Spring Reduced Carbon Cycle Impact of the 2012 US. Summer Drought. 2016, 113, 5880–5885. [Google Scholar]
  33. Bruce, C.M.; Hilbert, D.W. Pre-Processing Methodology for Application to Landsat TM/ETM + Imagery of the Wet Tropics; Cooperative Research Centre for Tropical Rainforest Ecology and Management, Rainforest CRC: Cairns, Australia, 2004. [Google Scholar]
  34. Foga, S.; Scaramuzza, P.L.; Guo, S.; Zhu, Z.; Dilley, R.D.; Beckmann, T.; Schmidt, G.L.; Dwyer, J.L.; Joseph Hughes, M.; Laue, B. Cloud Detection Algorithm Comparison and Validation for Operational Landsat Data Products. Remote Sens. Environ. 2017, 194, 379–390. [Google Scholar] [CrossRef]
  35. Zhu, Z.; Woodcock, C.E. Object-Based Cloud and Cloud Shadow Detection in Landsat Imagery. Remote Sens. Environ. 2012, 118, 83–94. [Google Scholar] [CrossRef]
  36. Robinson, N.P.; Allred, B.W.; Jones, M.O.; Moreno, A.; Kimball, J.S.; Naugle, D.E.; Erickson, T.A.; Richardson, A.D. A Dynamic Landsat Derived Normalized Difference Vegetation Index (NDVI) Product for the Conterminous United States. Remote Sens. 2017, 9, 863. [Google Scholar] [CrossRef]
  37. Pimple, U.; Simonetti, D.; Sitthi, A.; Pungkul, S.; Leadprathom, K.; Skupek, H.; Som-ard, J.; Gond, V.; Towprayoon, S. Google Earth Engine Based Three Decadal Landsat Imagery Analysis for Mapping of Mangrove Forests and Its Surroundings in the Trat Province of Thailand. J. Comput. Commun. 2018, 6, 247–264. [Google Scholar] [CrossRef]
  38. Otsu, N.A. Threshold Selection Method from Gray-Level Histograms. IEEE Trans. Syst. Man. Cybern. 1979, 9, 62–66. [Google Scholar] [CrossRef]
  39. Millard, K.; Richardson, M. On the Importance of Training Data Sample Selection in Random Forest Image Classification: A Case Study in Peatland Ecosystem Mapping. Remote Sens. 2015, 7, 8489–8515. [Google Scholar] [CrossRef] [Green Version]
  40. Olofsson, P.; Foody, G.M.; Herold, M.; Stehman, S.V.; Woodcock, C.E.; Wulder, M.A. Good Practices for Estimating Area and Assessing Accuracy of Land Change. Remote Sens. Environ. 2014, 148, 42–57. [Google Scholar] [CrossRef]
  41. Jönsson, P.; Eklundh, L. TIMESAT—A Program for Analyzing Time-Series of Satellite Sensor Data. Comput. Geosci. 2004, 30, 833–845. [Google Scholar] [CrossRef]
  42. Xu, L.; Li, B.; Yuan, Y.; Gao, X.; Zhang, T. A Temporal-Spatial Iteration Method to Reconstruct NDVI Time Series Datasets. Remote Sens. 2015, 7, 8906–8924. [Google Scholar] [CrossRef] [Green Version]
  43. Suepa, T.; Qi, J.; Lawawirojwong, S.; Messina, J.P. Understanding Spatio-Temporal Variation of Vegetation Phenology and Rainfall Seasonality in the Monsoon Southeast Asia. Environ. Res. 2016, 147, 621–629. [Google Scholar] [CrossRef] [PubMed]
  44. He, Y.; Fan, G.F.; Zhang, X.W.; Li, Z.Q.; Gao, D.W. Vegetation Phenological Variation and Its Response to Climate Changes in Zhejiang Province. J. Nat. Resour. 2013, 2, 220–233. [Google Scholar]
  45. Chen, J.; Chen, J.; Jo, P. A Simple Method for Reconstructing a High- Quality NDVI Time-Series Data Set Based on the Savitzky-Golay Filter A Simple Method for Reconstructing a High-Quality NDVI Time-Series Data Set Based on the Savitzky—Golay Filter. Remote Sens. Environ. 2004, 91, 332–344. [Google Scholar] [CrossRef]
  46. Palacios-Orueta, A.; Huesca, M.; Whiting, M.L.; Litago, J.; Khanna, S.; Garcia, M.; Ustin, S.L. Derivation of Phenological Metrics by Function Fitting to Time-Series of Spectral Shape Indexes AS1 and AS2: Mapping Cotton Phenological Stages Using MODIS Time Series. Remote Sens. Environ. 2012, 126, 148–159. [Google Scholar] [CrossRef]
  47. Yoshifuji, N.; Igarashi, Y.; Tanaka, N.; Tanaka, K.; Sato, T.; Tantasirin, C.; Suzuki, M. Inter-Annual Variation in the Response of Leaf-out Onset to Soil Moisture Increase in a Teak Plantation in Northern Thailand. Int. J. Biometeorol. 2014, 58, 2025–2029. [Google Scholar] [CrossRef] [PubMed]
  48. Dannenberg, M.P.; Song, C.; Hwang, T.; Wise, E.K. Empirical Evidence of El Nino-Southern Oscillation Influence on Land Surface Phenology and Productivity in the Western United States. Remote Sens. Environ. 2015, 159, 167–180. [Google Scholar] [CrossRef]
  49. Potithep, S.; Nagai, S.; Nasahara, K.N.; Muraoka, H.; Suzuki, R. Two Separate Periods of the LAI-VIs Relationships Using in Situ Measurements in a Deciduous Broadleaf Forest. Agric. For. Meteorol. 2013, 169, 148–155. [Google Scholar] [CrossRef]
  50. Borchert, R. Water Status and Development of Tropical Trees During Seasonal Drought. Trees. 1994, 8, 115–124. [Google Scholar] [CrossRef]
  51. Elliott, S.; Baker, P.J.; Borchert, R. Leaf Flushing during the Dry Season: The Paradox of Asian Monsoon Forests. Glob. Ecol. Biogeogr. 2006, 15, 248–257. [Google Scholar] [CrossRef]
Figure 1. Location of study area and extent of Thailand forest map (Thai Royal Forest Department 2007/2008); the red dot shows the location of climate station; the blue dot shows the location of site observation where the in situ leaf area index (LAI) was collected.
Forests 09 00448 g001
Figure 2. The flowchart of methodology in this study.
Forests 09 00448 g002
Figure 3. Location of training and validation points in Lampang. A total 458 points, 320 points (70%) randomly selected for training data set and 138 points (30%) for validation data samples.
Forests 09 00448 g003
Figure 4. Daily temperature and precipitation records at Lampang station during 2001–2016.
Forests 09 00448 g004
Figure 5. Annual maximum temperature anomaly (a) and precipitation anomaly (b) at Lampang station during 2001–2016.
Forests 09 00448 g005
Figure 6. Forest classification map in Lampang (2017).
Forests 09 00448 g006
Figure 7. (a) Time series of in situ LAI against NDVI based on satellite data period 2001–2012; (b) the scatter plot of in situ LAI and NDVI based on satellite. The solid line shows the exponential relationship (R2 = 0.80).
Forests 09 00448 g007
Figure 8. The variation in temporal of phenological metrics derived from LAI and NDVI observations period 2001–2011; (a) relationship between SO S LAI and SO S NDVI and (b) relationship between LO S LAI and LO S NDVI .
Forests 09 00448 g008
Figure 9. Example of seasonal different in NDVI timing values of DDF (green) and MDF (red) period 2001–2016.
Forests 09 00448 g009
Figure 10. Inter-annual variations of tropical deciduous forest phenology metrics in different forest types period 2000–2015; (a) Start of growing season (SOS); (b) length of growing season (LOS).
Forests 09 00448 g010
Figure 11. An example of difference in phenological metrics among El Niño (Year 2010), La Niña (Year 2011) and Neutral years at group pixels of MDF derived from MODIS NDVI.
Forests 09 00448 g011
Figure 12. The spatial difference of SOS DDF   and SOS MDF   between El Niño (a,c) and La Niña (b,d) respectively, compared to that of the neutral year. The significant difference is based on 1SD.
Forests 09 00448 g012
Figure 13. The spatial different of LOS DDF     and LOS MDF   between neutral year to El Niño (a,c), La Niña (b,d) respectively. The significant difference is based on 1SD.
Forests 09 00448 g013
Table 1. Specifications of Operational Land Imager-8 (OLI) imagery used in this study.
NoLandsat Path/RowDate Acquired
1Landsat OLI-8 130/4716-01-2017
2Landsat OLI-8 130/4716-01-2017
3Landsat OLI-8 131/4708-02-2017
4Landsat OLI-8 131/4708-02-2017
Table 2. Results of phenological metrics difference during extreme climate events across two forest types in Lampang, Northern of Thailand. The percentage showing the pixels which significant different in temporal between average neutral years and ENSO year.
Neutral Year (Mean ± 1SD)El Niño Year (2010)La Niña Year (2011)The Area Size Delayed by El Niño (2010) (±Ha, 1SD)The Areasize Advanced by La Niña (2011) (±Ha, 1SD)
SOS DDF (DOY)106.4 ± 7.1131.886.5168,337.5 (75.3%)147,718.8 (66.0%)
SOS MDF   (DOY)106.9 ± 6.9126.992.4210,662.5 (65.8%)153,762.5 (48.0%)
LOS DDF (Day)306.9 ± 13.9279.0321.9214,806.3 (96.0%)221,818.8 (99.2%)
LOS MDF (Day)319.0 ± 12.5292.7327.3307,262.5 (96.0%)307,931.3 (96.2%)

