Reducing Seismic Vulnerability and Energy Demand of Cities through Green Infrastructure


Department of Civil Engineering and Architecture, University of Catania, Via S. Sofia 64, 95123 Catania CT, Italy
*
Author to whom correspondence should be addressed.
Sustainability 2018, 10(8), 2591; https://doi.org/10.3390/su10082591
Submission received: 12 June 2018
/
Revised: 19 July 2018
/
Accepted: 20 July 2018
/
Published: 24 July 2018
(This article belongs to the Special Issue Energy and Seismic Renovation Strategies for Sustainable Cities)
Abstract
:Historically, urbanization processes in Italy resulted in built environments with high levels of seismic vulnerability, low energy efficiency and a lack of green spaces. The latter represent the main providers of ecosystem services in cities and play a relevant role in reducing the effects of climate change by the regulation of microclimate and urban heat islands that are responsible for building energy consumption. Despite their importance in providing ecosystem services, the implementation of green infrastructure challenges limited financial resources for the public acquisition of private plots. This paper proposes a strategy to implement an urban green infrastructure aimed at generating a double positive effect on cities by triggering seismic retrofitting and the reduction of cooling energy demand of the existing urban fabric. This is proposed through a transfer of development rights program where landowners gain economic incentives to adopt seismic retrofitting interventions and, at the same time, public administrations implement the green infrastructure in the portion of areas transferred to the municipality. The energy efficiency of buildings closer to the green infrastructure, therefore, benefits from the cooling effects of this new greenery. The strategy is tested under different scenarios of acquisition of private land by public administrations in the metropolitan area of Catania (Italy).
1. Introduction
In urban contexts, there is a growing interest in using and deploying natural ecosystems to provide solutions to several urban issues and improve the overall sustainability of urban environments [1]. These nature-based solutions provide sustainable, cost-effective, multi-purpose, and flexible alternatives for various planning objectives and can significantly enhance the resilience of cities [2]. Furthermore, by reshaping the built environment, nature-based solutions can enhance the inclusivity, equitability, and livability of cities, regenerate deprived districts through urban regeneration programs, improve mental and physical health and quality of life for citizens, reduce urban violence, and decrease social tensions through better social cohesion (particularly for some vulnerable social groups, such as children, the elderly, and people of low socio-economic status) [3].
Among nature-based solutions, green infrastructure is a natural, semi-natural and artificial network of multifunctional ecological systems within, around and between urban areas, at all spatial scales [4]. This definition emphasizes the holistic ecosystem vision of urban environments (including the abiotic, biotic and cultural functions) and claims for multi-scale approaches able to take into account the scale-dependent relationships of ecological processes occurring in cities, with particular reference to human health and the well-being of citizens and residents.
Green infrastructure can comprise several urban ecosystems including parks and woodland, blue areas (lakes and streams), greenery, semi-natural areas and other urban features such as green roofs and street trees. In particular, for high-density urban contexts, green infrastructure aims at the following actions: (i) environmental protection and integration of agriculture into urban context, providing specific new agricultural land-use types such as agricultural parks, community supported agriculture, and allotment gardens; (ii) development of suburban green areas in order to provide a more equal distribution of public parks and gardens; and (iii) enhancement of current urban green spaces by improving quality, usability, and accessibility [5]. Ecosystems included in the green infrastructure provide important functions and relative services, such as CO2 sequestration, production of O2, reduction of air pollutants and noise, regulation of microclimate and heat island effect, flood damage reduction, filtering water, pollination and supply of recreational value, and play a fundamental role in health, well-being, and social safety [6,7,8].
This paper focuses on the services of regulation of a microclimate, mainly provided by urban vegetation [9]. Urban vegetation can bring beneficial microclimatic effects, including air temperature reduction, which eases the urban heat island effect. The microclimatic benefits of trees are obtained through several physical processes [10,11]: (1) solar heat gains on windows, walls, roofs, and urban surfaces, including human bodies, are lowered through shading; (2) the buildings’ long-wave exchanges are reduced at lower surface temperatures through shading; (3) the dry-bulb temperatures are lowered through evapotranspiration processes; and (4) latent cooling is increased due to the addition of moisture to the air through evapotranspiration. Estimating the cooling effect that can be obtained with different configurations of new greenery is, therefore, a crucial step in enhancing the regulating capacity of urban environments and therefore planning cities more resilient to climate change.
2. Implementation of a Green Infrastructure for Reducing Seismic Vulnerability and Enhancing Energy Efficiency
2.1. Challenges for Planning a Green Infrastructure
Despite its importance in providing the aforementioned ecosystem services, green infrastructure faces several difficulties and limitations for its real development and management, especially in dense urban contexts. The most relevant of these challenges is the public acquisition of the land where green infrastructure will be designed and implemented. This is mainly due to the lack of available areas belonging to municipalities or other public bodies that could be used to develop the green infrastructure. This may dramatically hamper the economic feasibility of implementation, as the direct public acquisitions of land may be economically unsustainable for local administration and often face resistance from private landowners [12].
The issue of economic feasibility for managing public intervention and providing accessible public green spaces could be addressed through incentive-based approaches, including the transfer of development rights (TDR) [13,14]. TDR allows the sale and transfer of development rights from a specific parcel of land to other properties. Future use of the original parcel is then protected from development by a permanent conservation easement or deed restriction prohibiting development. A TDR programme defines an area to be protected from development (sending area) and one where development will be allowed to occur (receiving area) [15,16]. Landowners can transfer the rights to develop one parcel of land to another. As a consequence, the parcel from which the development rights are being transferred can no longer be developed, or developed only in a limited way [15]. Private landowners will get economic incentives from selling developing rights and the opportunity to adopt retrofitting measures aimed at the reduction of seismic vulnerability. This issue can be convenient for districts characterized by multi-storey apartment buildings and shared open setback yards.
2.2. Seismic Vulnerability and Energy Efficiency of Existing Urban Fabric
The assessment of seismic risk of buildings is a complex task requiring the contributions of different scientific fields (from social science to engineering and economic sciences) to evaluate the three main parameters of exposure, vulnerability and seismic hazard [17,18].
Many urban contexts in Europe and especially in Italy face a strong seismic risk. The Italian Institute for Statistics indicates that more than 60% of Italian buildings were built without seismic provisions [19] and 50% of the residential stock is earthquake-prone [20]. Actions, norms and policies aimed at reducing seismic risk to target not only single buildings but, more significantly, be tailored for different portions of urban contexts, at different scales, from single buildings, to blocks, neighborhoods and entire urban areas [21].
To this end, urban policies and actions must be designed to minimise damage caused by earthquakes through reducing vulnerability and specifically, exposure to heritage buildings. In particular, the reduction of vulnerability is a key issue in the debate related to seismic risk reduction [18,22].
Different approaches are available to face seismic vulnerability, such the adoption of specific seismic binding norms, urban planning, and enhancing construction practices. However, in Italy building replacement is still limited [20] and, therefore, seismic retrofitting of existing vulnerable buildings is an essential way to reduce earthquake damage [23]. Retrofitting of historical and modern residential fabric can be an economically efficient approach if compared to post-earthquake re-construction or recovery [24].
An analog situation can be found when looking at the current energy efficiency of Italy’s building stock, where more than 1/3 of the overall demand for energy can be attributed to the household and tertiary sector [20]. This high energy demand urges the adoption of energy retrofitting measures and policies at different political and administrative levels.
Many retrofitting technologies and approaches are available, and they can be categorised into three main categories: supply side management, demand side management, and change of energy consumption patterns due to human habits [25]. The choice of which technology, policy or measure should be used is a multi-objective problem with many variables, constraints and limitations. The optimal solution can be considered as a trade-off among a number of factors, such as energy, economics, technical, environmental, regulations, social, etc. [25].
However, seismic and energy retrofitting policies have to face a number of complex issues related to the required economic efforts, technical feasibility, number of actors involved, the political coordination among different administrative levels, the need of involving many disciplines and local requirements [20,23]. At the national level fiscal incentives are currently proposed, especially in the form of a tax credit (up to 65% in 10 years) to those willing to implement retrofitting actions. However, the required costs for the investment are still far from the possibilities of the majority of people, so alternative mechanisms to support seismic and energy retrofitting are still needed [26]. Urban planning strategies should, therefore, foster and support retrofitting measures for low-income people and to facilitate the engagement of building owners in retrofitting activities [20].
2.3. A Green Infrastructure Strategy for Reducing Seismic Vulnerability and Increasing Energy Efficiency
We propose in this paper a strategy for implementing the components of a green infrastructure aimed at triggering seismic retrofitting and energy demand reduction of urban fabrics through a TDR programme. Typically, in a TDR programme, development rights are assigned to strips of private land parcels that are designated for accommodating the green infrastructure. Development rights can be then transferred from these portions of parcels to other urban zones and used for new developments. As a result of the sale of the development rights, the involved parcels of urban fabric can be seismic-retrofitted, the strips transferred to public property for placing new components of a green infrastructure, and the new greenery provide cooling effects and generate a considerable decrease of energy demand in adjacent buildings.
The amount of development rights to be assigned to strips of land parcels is identified according to an economic feasibility assessment tool (see Section 3.2.3). To ensure the economic feasibility of the seismic retrofitting, this tool enables the quantification of equitable development rights to be assigned to each private parcel taking into account the amount of current developed volume of buildings, size of open spaces to be potentially left, seismic retrofitting costs, and economic rate of development rights to be sold.
3. Materials and Methods
3.1. A Case Study in the Catania Metropolitan Area (Italy)
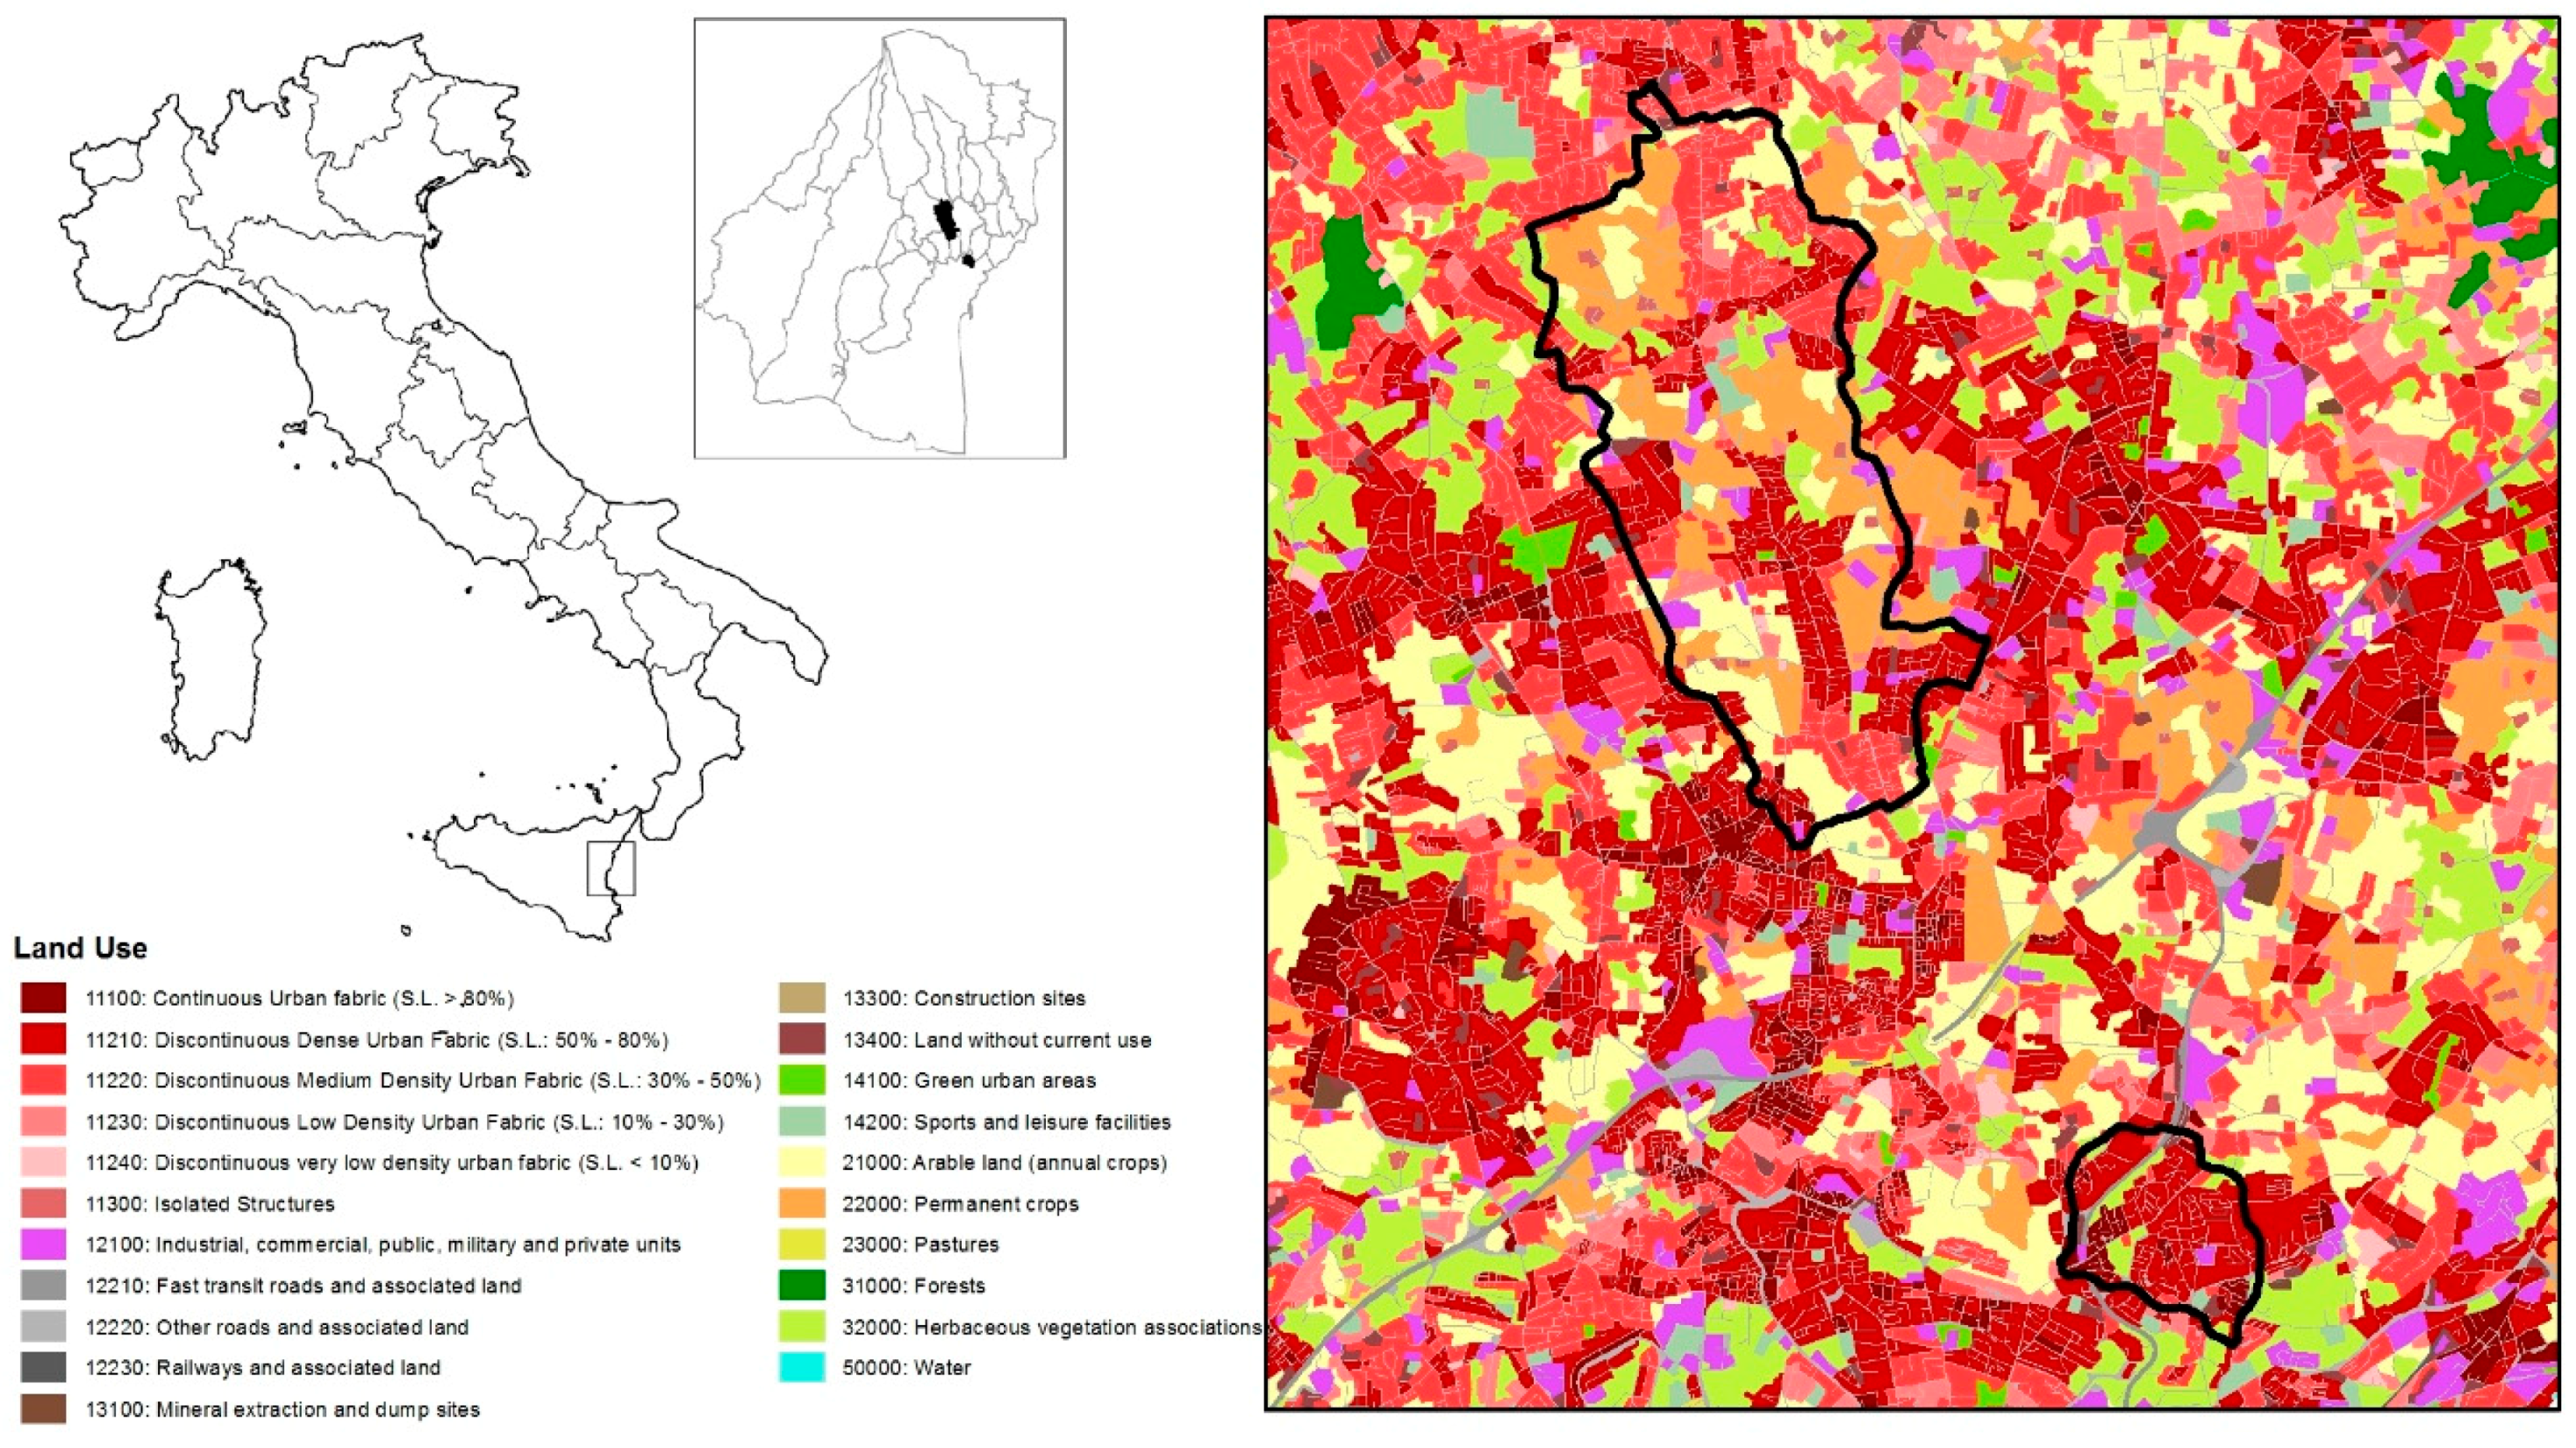
The case study investigated in this work is located in the metropolitan area of Catania, the largest in Sicily. Catania has experienced dramatic urban growth in recent decades, and is characterized by a high urban density and severe lack of public green spaces. In 40 years (1961–2001), the total population of 27 municipalities included in the metropolitan area grew more than 27% in terms of built-up areas. In 2017, approximately 60% of its total population lived outside the main city, indicating progressive population expansion beyond the city center. We chose the municipality of Tremestieri Etneo (Figure 1), as a representative area where urbanization processes have been characterized by multi-storey builidings urban development [27]. Furthermore, the entire metro area is one of the areas most exposed to seismic risk in Italy.
3.2. Method
The method is composed of four different phases: (1) urban growth and urban morphology analyses to identify building age classes and categorization of urban morphology types in order to select the most suitable type of urban fabric to apply the proposed strategy of green infrastructure; (2) a land-use/land-ownership analysis to identify the land-use and landownership asset of each compound; (3) An economic feasibility assessment tool to quantify the equitable development rights to be assigned to private land parcels and the size of open spaces to be transferred to public property, taking into account different economic costs of seismic retrofitting and urban development parameters; (4) a microclimate model to evaluate the potential cooling effect of new vegetation in the green infrastructure, estimating the reduction of energy demand for typical multi-storey buildings.
3.2.1. Urban Growth and Urban Morphology Analyses (First Phase)
The analyses of urban growth and urban morphology are a key phase because seismic vulnerability and energy demand options depend on the age and form of the urban fabric [28].
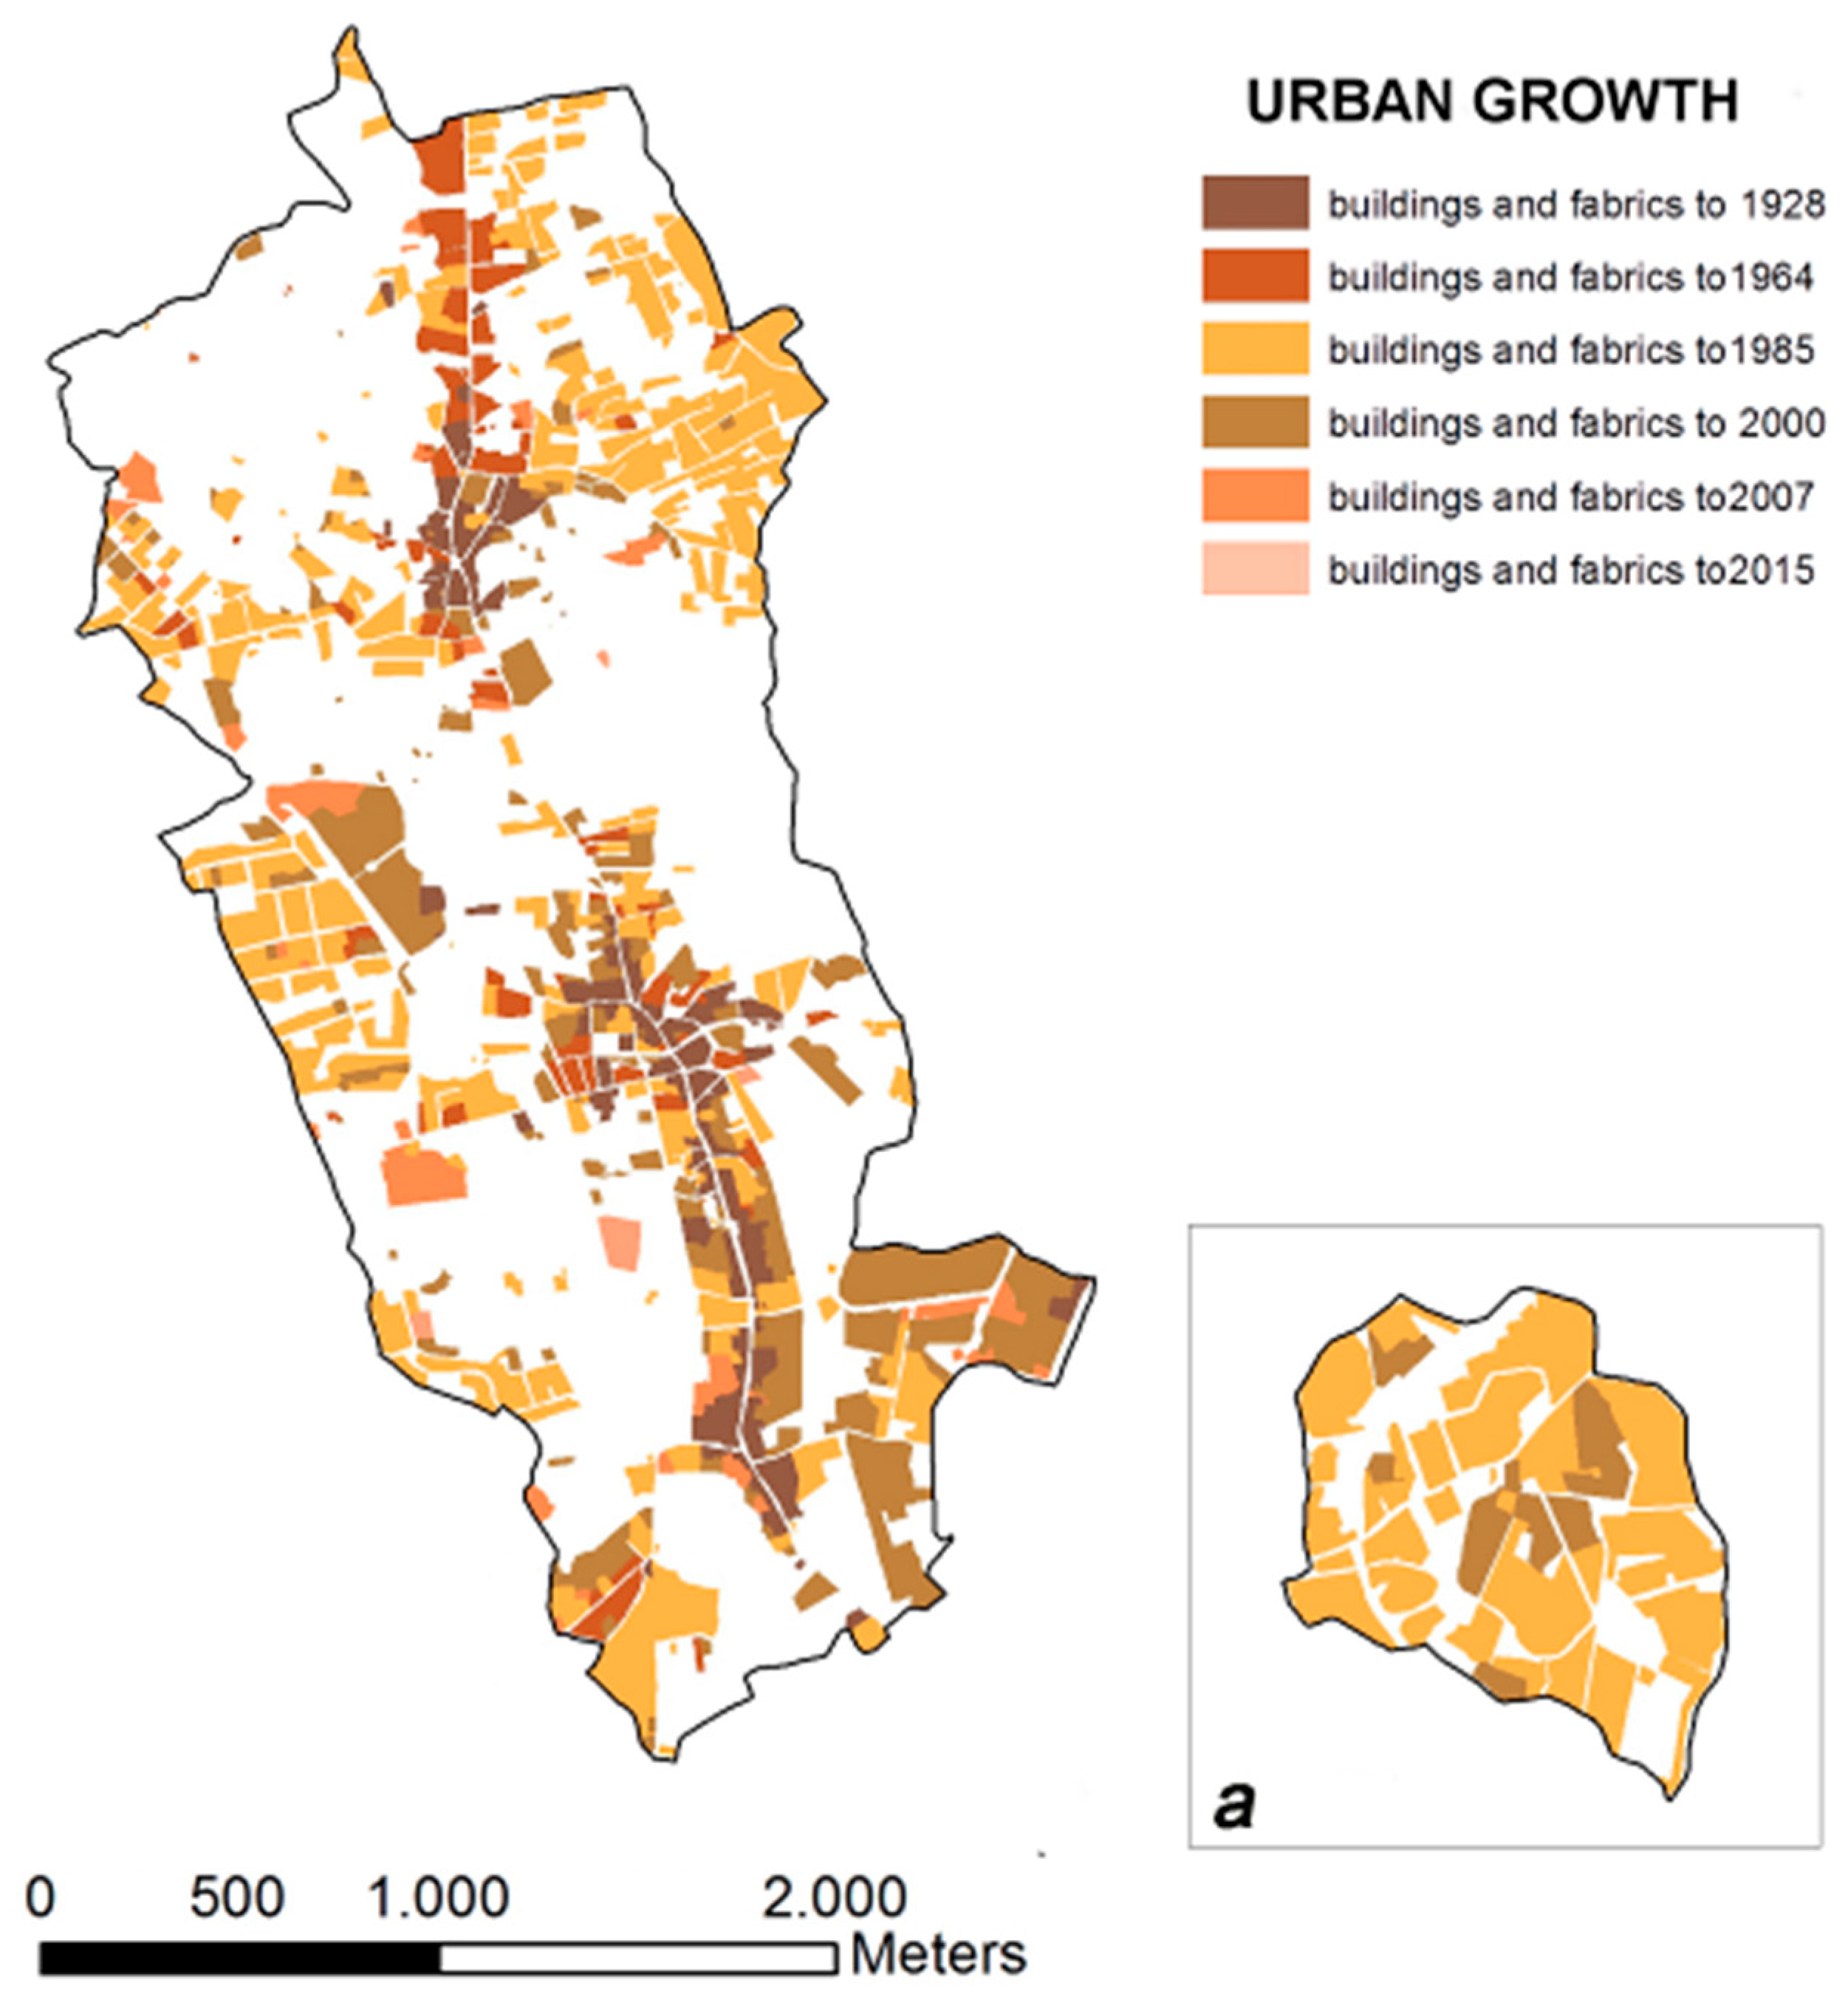
Urban growth analysis was developed at block and sub-block level through the examination of the mean building age of urban fabrics and identifying six age classes: buildings and fabric built until 1928, 1964, 1985, 2000, 2007 and 2015. These years represent the available topographic sources used to map urban growth. Buildings belonging to different age classes were characterised by different materials and construction technologies (stonemasonry, mix of stonemasonry and steel structures, reinforced concrete structures) that show different levels of resistance to seismic activity [29]. In particular, buildings built-up to 1928 were mainly stonemasonry buildings while reinforced concrete buildings appeared in the period 1928–1964. In Italy, the first regulation requiring the evaluation of the seismic actions on reinforced concrete buildings was introduced in 1975. The DM 3/3/1975 Act represented a fundamental innovation in the analytical procedures by taking into account the dynamic properties of the structures [30]. However, the very first set of technical indications for designing reinforced concrete buildings in seismic zones was introduced in 1986 by the DM 24/1/1986. This act provided the first requirements concerning structural maximum allowable deformation under seismic actions. Nevertheless, more comprehensive and reliable seismic design concepts only appeared in Italy in 1996 through the DM 16/1/1996 Code that introduced the capacity design concept, even based on non-structural damage limitation [30].
Thus, norms and regulations have significantly shaped the seismic features of reinforced concrete buildings over the past decades. Buildings built-up to 1985 (before the DM 24/1/1986 Act) can be considered as more vulnerable to seismic events compared to buildings constructed from 1986 and even more after the implementation of DM 16/1/1996 Code. In this study, according to the available six interval classes of building age, reinforced concrete buildings belonging to the age classes of 1964 and 1985 have been considered more vulnerable than buildings belonging to the age classes of 2000, 2007 and 2015 and, consequently, can be prior targets of seismic retrofitting policies.
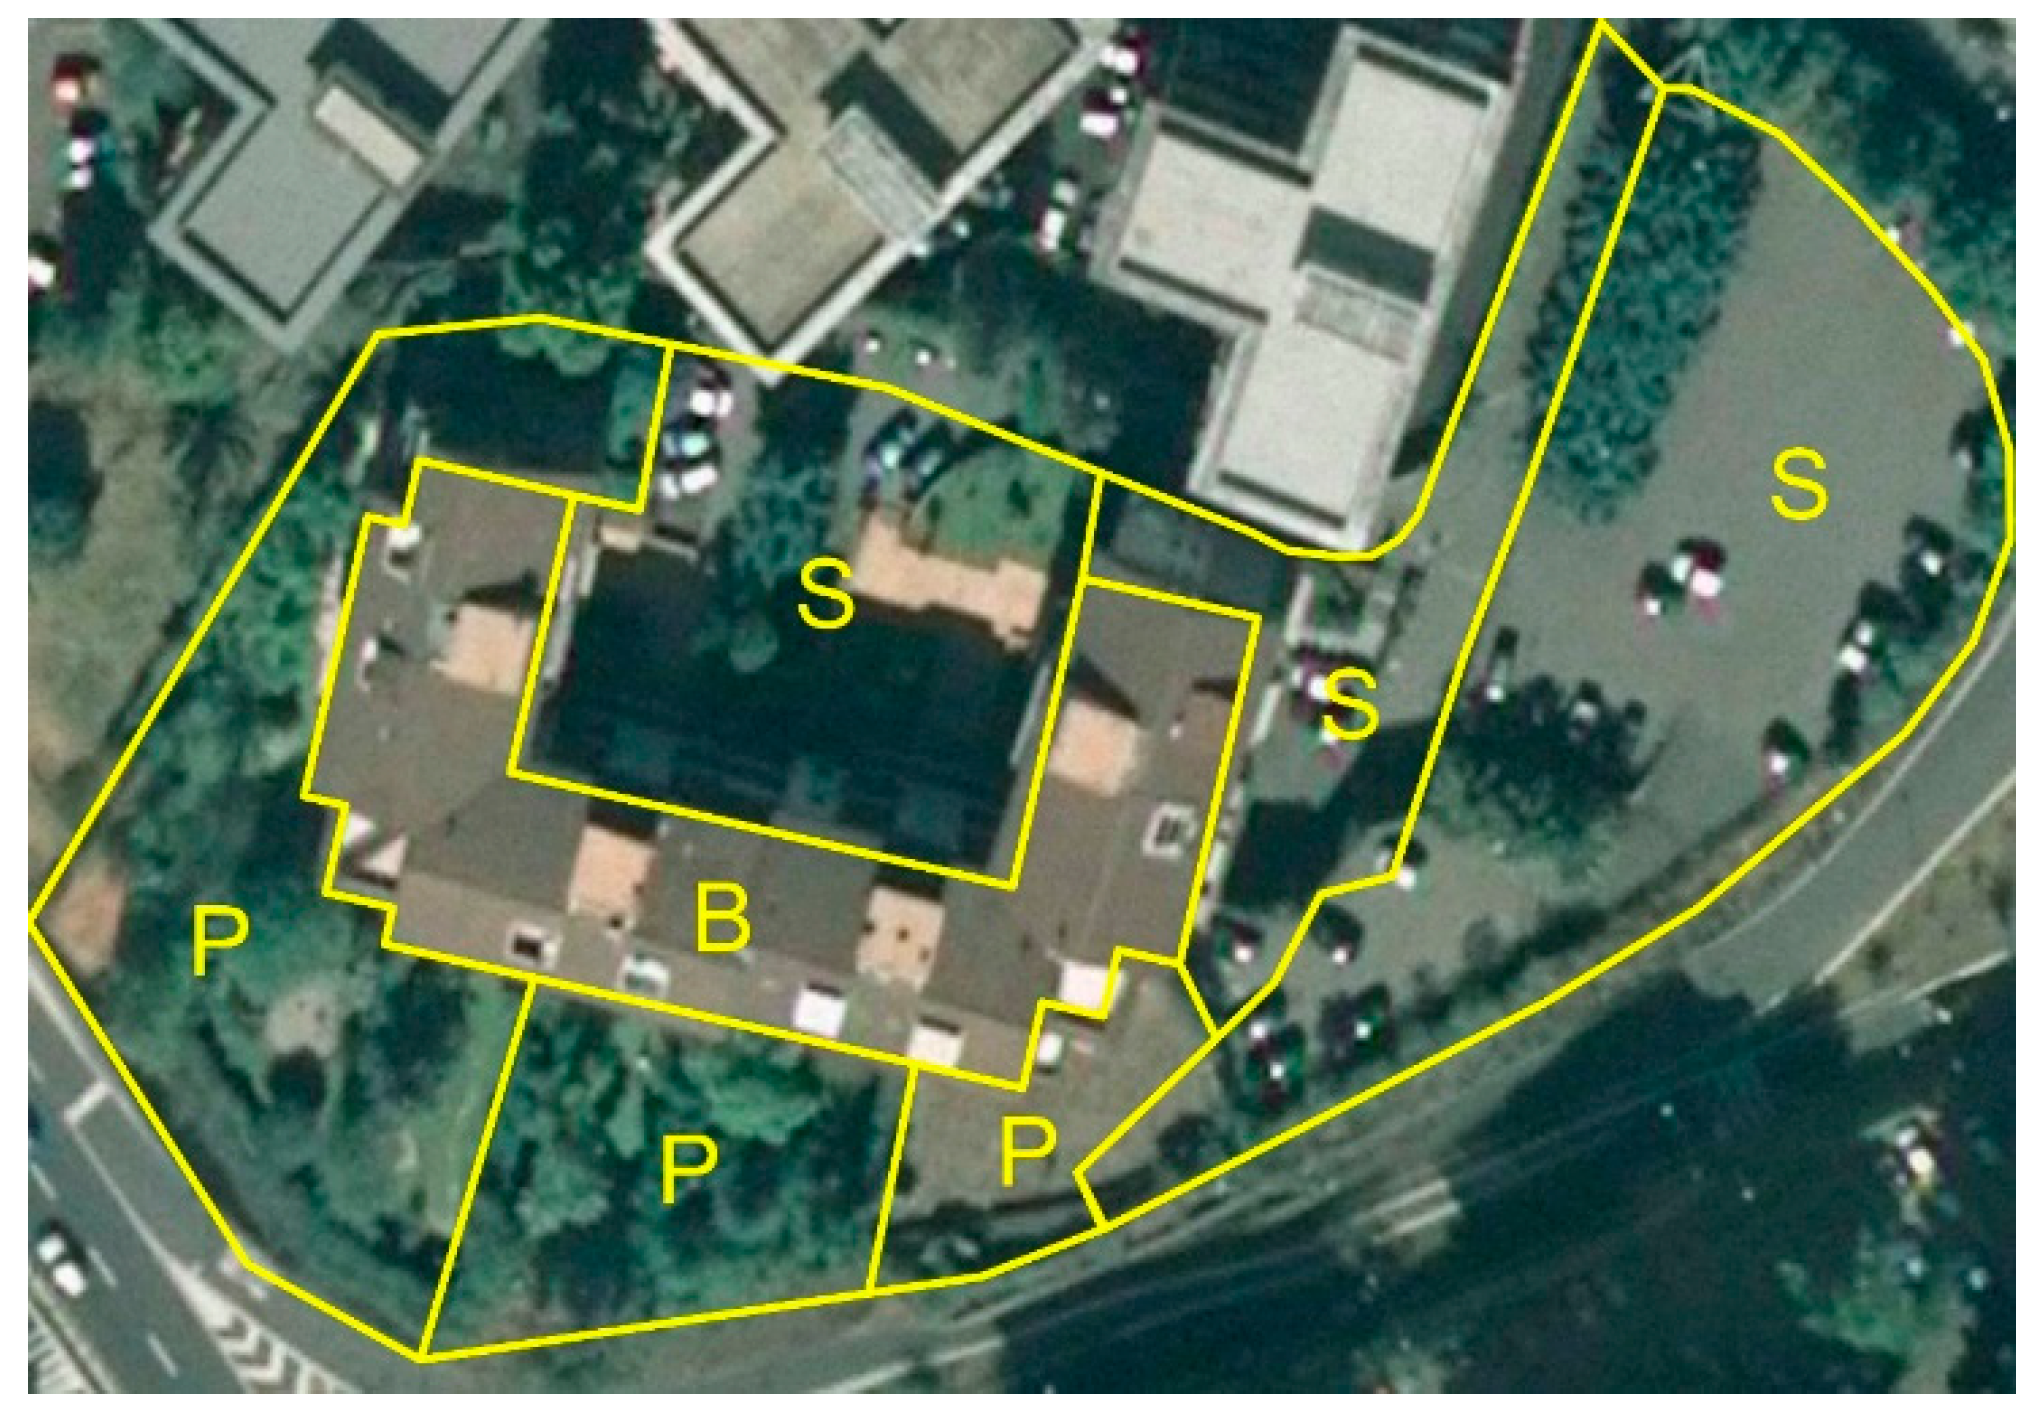
Urban morphology analysis identified those buildings where the green infrastructure strategy could be implemented. This was developed at block and sub-block level taking into account results from the previous urban growth analysis and considered two additional features: type of buildings, such as detached or semi-detached houses, terraced houses, multi-storey apartments, towers; and the relationship among buildings, streets and public and private open spaces, that can be characterized by interior courtyards or front/rear/side setback yards, sidewalks, parking lots, or small urban gardens. Different combinations of these features produced varied morphological layouts and built-up density. Building coverage ratio and percentage of open spaces were measured to identify urban morphology types. The urban morphology analysis was based on a regional topographic map (1:10,000) and a more detailed municipal topographic map (1:2000). Here the green infrastructure strategy was implemented for regular and irregular blocks with multi-storey buildings of reinforced concrete frame structures. Regular and irregular blocks are composed of different compounds, defined as gated residential units of buildings and related open spaces. These compounds are characterized by very large residential population, multiple private properties (apartments, garages), spaces with shared assets such as lobbies, staircases, lifts and adjacent open setback yards (walkways, green spaces, and park plots) (Figure 2).
3.2.2. Land-Use/Land-Ownership Analysis (Second Phase)
Since regular and irregular blocks with multi-storey buildings morphology type can be composed by a mix of both private and shared land uses, the land-use and the land-ownership asset of each compound were analyzed to verify the presence of open spaces that can be transferred to public property in the TDR programme. This was performed by visual interpretation of available high resolution orthophotos on sample areas for each of the selected three morphology types. Three land-use types were chosen and identified in each morphology type: buildings, private adjacent setback yards, and shared open spaces (walkways, green spaces, and park plots) (Figure 2). Among these land-use types, the shared open spaces represent those portions that could be left to public property against corresponding economic benefits in the TDR programme.
3.2.3. Economic Feasibility Assessment Tool (Third Phase)
The implementation of a suitable and realistic TDR programme represents a crucial phase in the proposed strategy. This is based on the assignment of development rights to the shared open spaces within the compounds that could be designated for the green infrastructure. Development rights could be transferred from these private parcels to other urban zones and used for new development. Landowners of the compounds could also sell development rights to other private developers obtaining economic earnings for covering the costs of the seismic-retrofitting. Finally, the shared open spaces could be transferred to the municipality which will plant the new greenery, thus generating a cooling effect through the shading effect of trees on adjacent buildings and a consequent decrease in their energy demand.
In the third phase, the economic viability of the TDR programme was evaluated. This was accomplished through a tool that was developed to quantify the equitable development rights to be assigned to each compound for leaving to become public property a percentage of the shared open spaces, transferring to other privates and developers the virtual amount of development while gaining economic revenues for future seismic retrofitting (Table 1).
To evaluate the economic feasibility, the tool sets the values of three main input parameters. First, a virtual floor area ratio (VFA) of 4.50 m3/m2 was identified over the land parcel of shared open spaces to be transferred (TFA) in terms of amount of development to be transferred (VT). This value of VFA represents the mean value in existing buildings calculated as the ratio between the developed volume (V) and the land parcel unit area (LPA). Second, a seismic retrofitting rate (SRR) was defined as 70 €/m3, in accordance to the value indicated by the Italian Urban Developers National Association [31]. This allows evaluation of the total retrofitting costs of buildings within the compound taking into account the number of storeys (S) and the total amount of developed volume (V). Finally, the provided economic rate of development rights ERT = 150 €/m3 allows the evaluation of potential economic revenues (ERV) to be gained after selling. ERT was been calculated according to the economic feasibility of new development that will occur in other parts of the urban settlement where the virtual development rights will be allocated. Indeed, developers buying these rights have to deal with further costs while striving for a final economic profit ≥25% that is considered by Italian Urban Developers National Association as a reasonable percentage value of investment profit [31]. According to the tool, the overall seismic retrofitting costs can be achieved when the final balance (B) between economic earnings from development rights (ERV) and the total retrofitting costs (SRC) is ≥0.
3.2.4. Potential Local Cooling Effect of Trees and Relative Building Energy Demand Reduction (Fourth Phase)
The interactions among urban vegetation, urban structures, and urban climate generate different microclimate conditions that also need to be evaluated for each urban context studied. Typically, vegetation can lower both the air temperature and wind speed of the surrounding microclimate, reducing the cooling load, but current research agrees that the cooling effect in small areas is obtained mainly through shading [10]. Other factors that inhibit the penetration of solar radiation, besides shading, may also play a role in determining the cooling effect of an urban green space. The geometric configuration may also affect temperature variations, as happens for non-wooded building structures [32]. Although a cooling effect has been reported even for small green areas [33], the extent of this effect on neighbouring buildings is less evident and subject to limited research [34].
We postulated that the implementation of green infrastructure in portions of private shared open spaces as a result of the TDR programme could result in a relevant energy saving through the shading effect of the new trees that are planted. To quantify the possible energy savings, we considered the model by [10], who analysed the dynamic interaction between microclimate and buildings. These authors simulated the optimal position of trees around a building through parametric design in order to estimate the energy saving that could be achieved through the shading effect of trees on the buildings. Results of the simulations resulted in an energy saving ranging from a minimum of 11% when locating only 1 tree to a maximum of 48.5% when locating 5 trees around buildings, therefore highlighting that a limited amount of greenery is able to achieve a relevant energy saving.
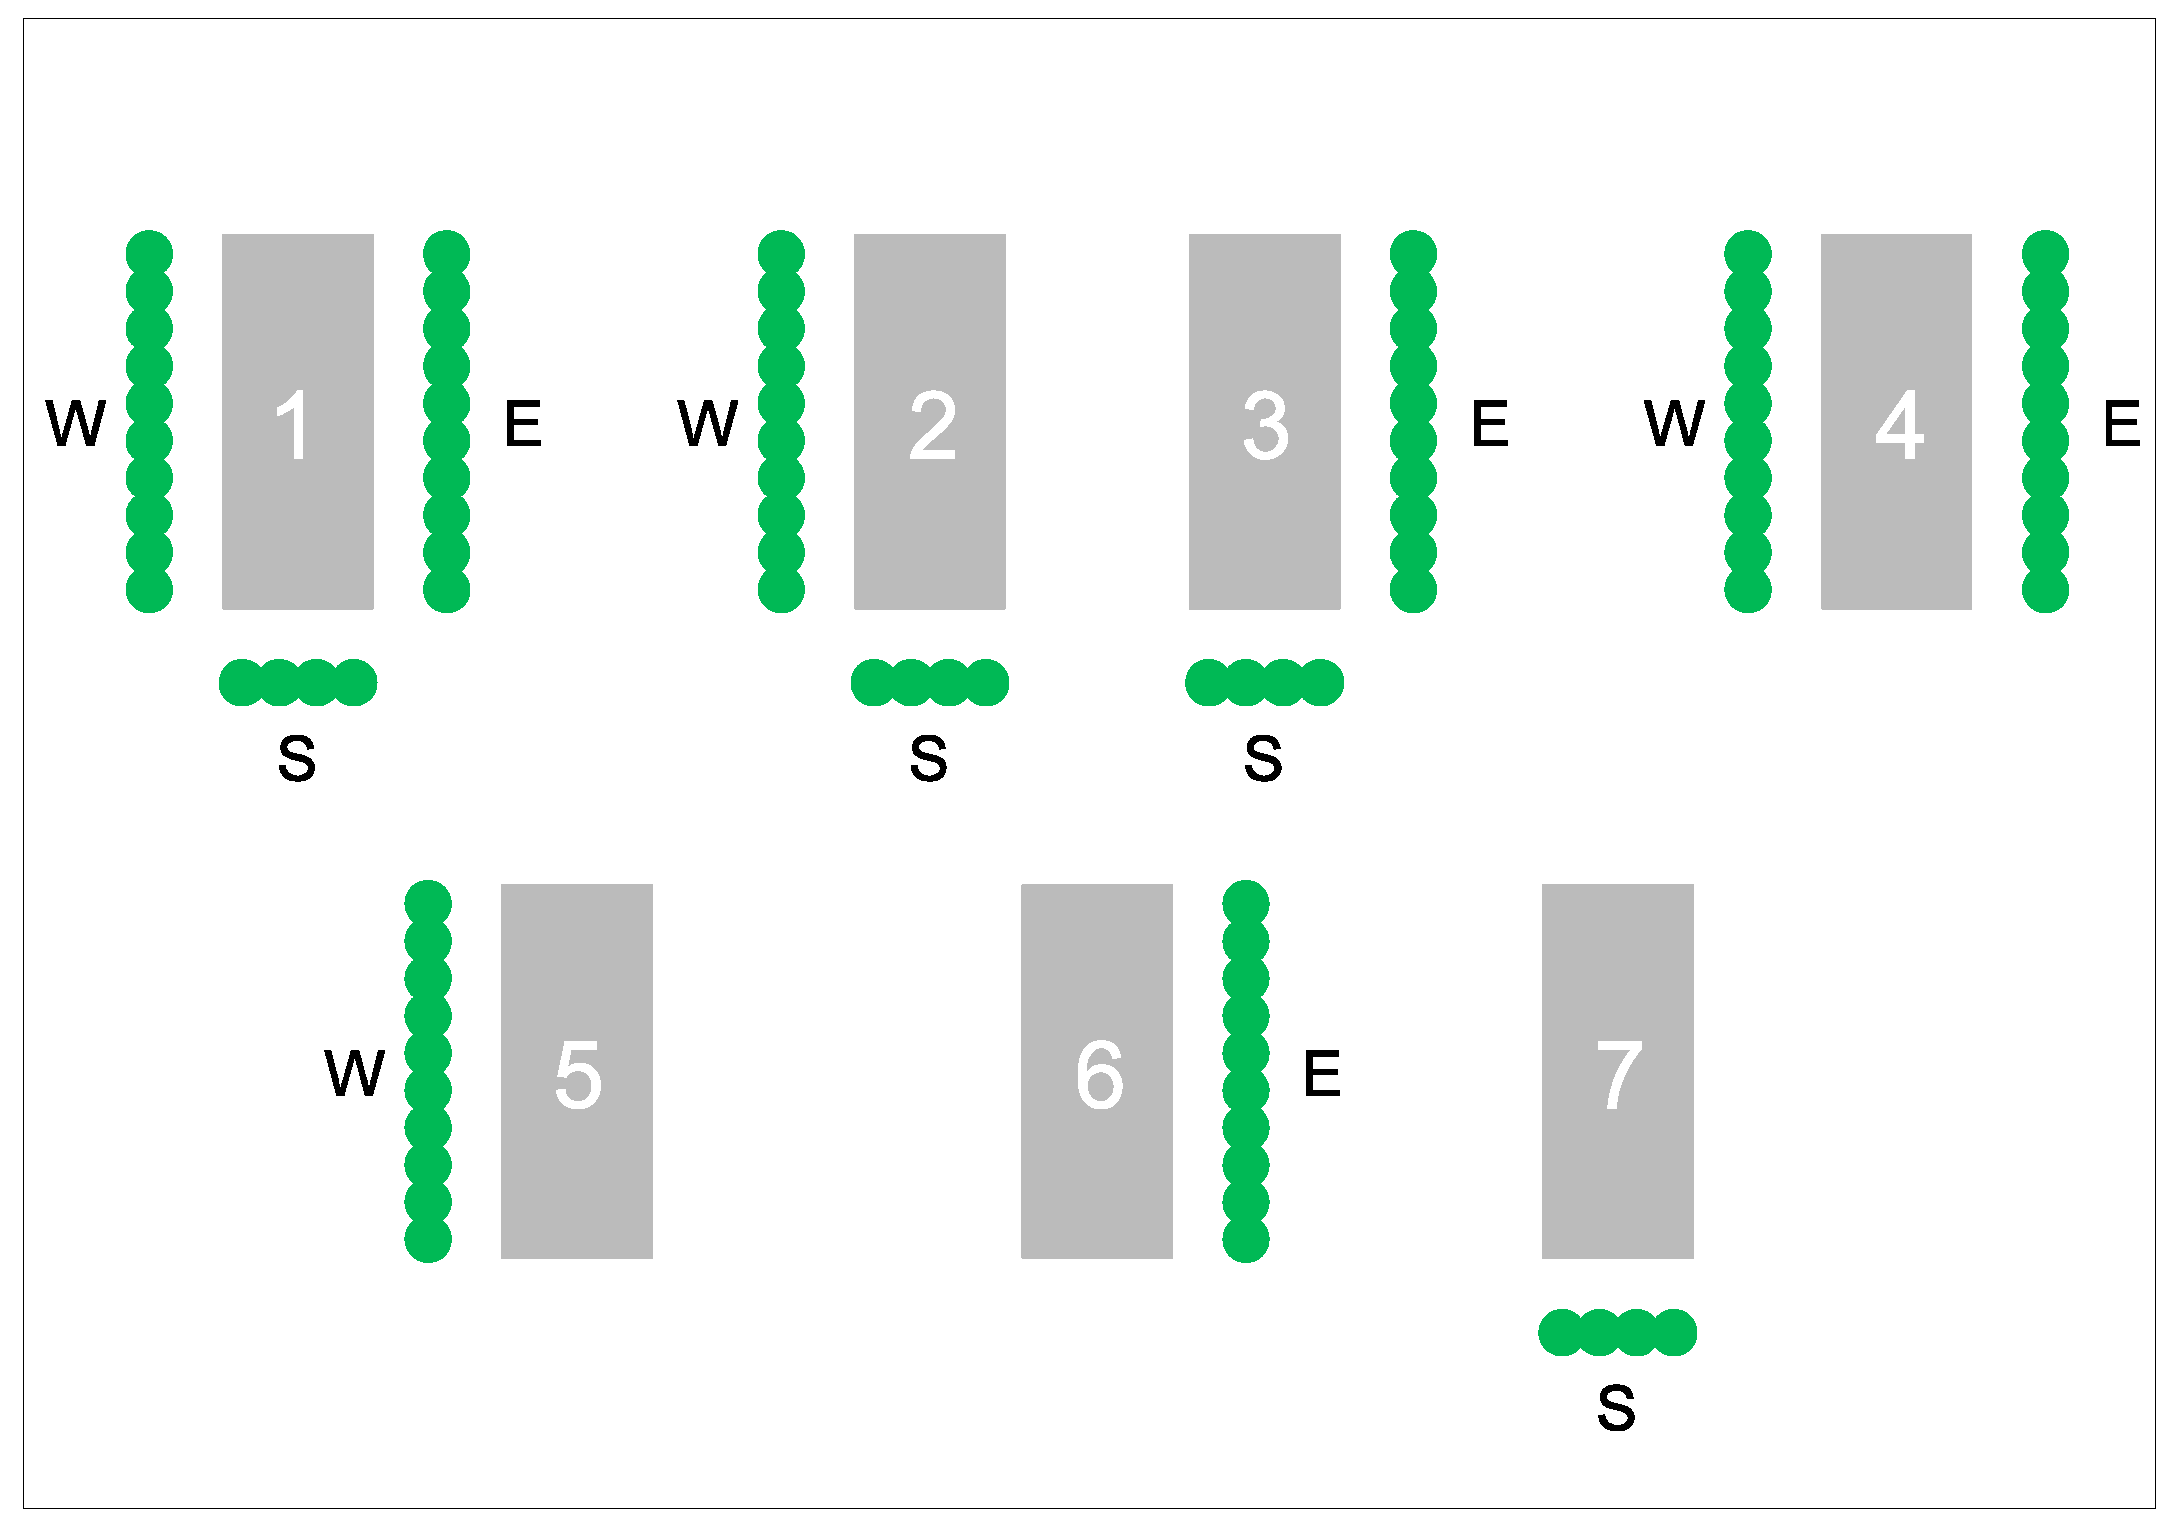
Figure 3 reports the possible configurations of the position of trees with respect to the buildings studied in this paper. Table 2 shows the relative energy savings (in %) according to those configurations as modelled by [35], for the configurations 1, 4, 6 and 7. Configurations 2, 3 and 5 were not taken into account as they were not assessed by [35].
4. Results
Urban growth analysis showed that in the tested municipality the majority of the urban fabric was developed after 1964 (56% in terms of building area, BA), with a first impressive boost in the period 1964–1985 and a second in the period 1985–2000 [32] (Figure 4, Table 3).
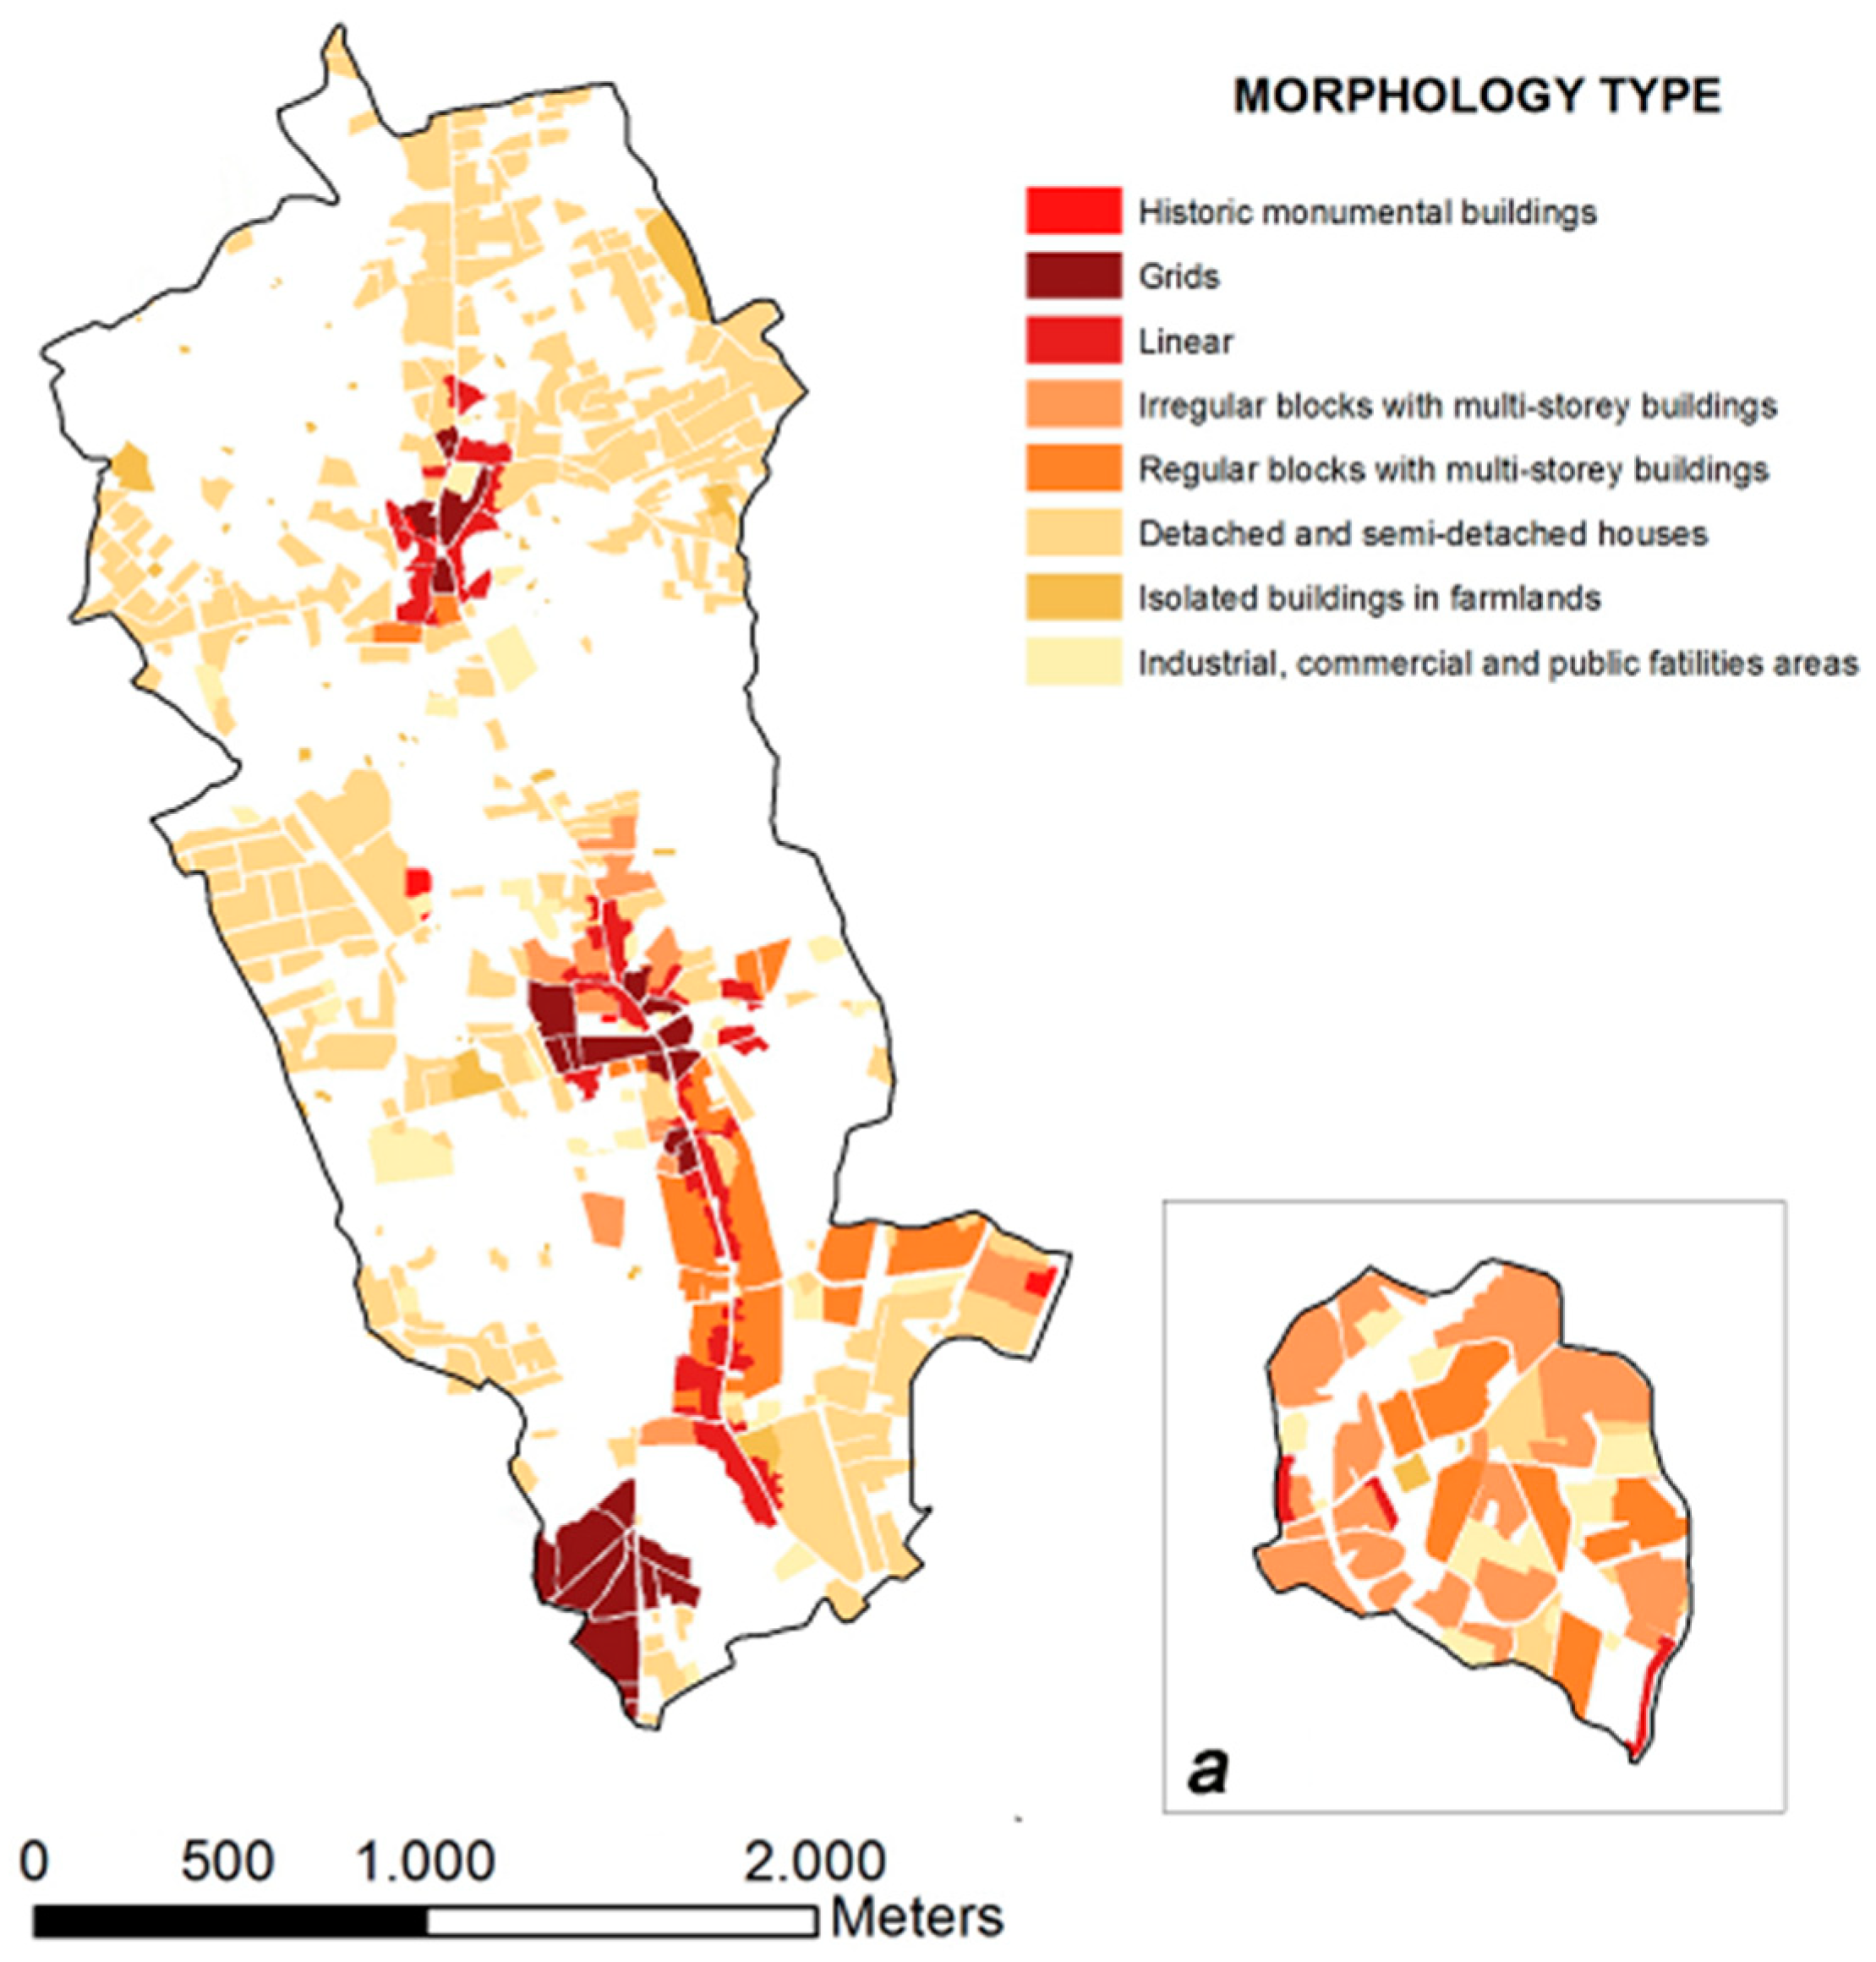
Urban morphology analysis identified eight urban morphology types within the study area, sub-divided into two sub-classes: historical and modern urban fabrics. Modern urban fabric includes more categories, since a great variety of buildings typologies have been used since the 1960s. These are often characterised by urban patterns with multi-storey apartment buildings set back from streets and including private or semi-private open spaces. Urban morphology analysis was mapped in Figure 5 and summarised in Table 4 [36]. The category of Regular and Irregular blocks with multi-storey buildings represents almost 30% of the urban fabric, with a total of 132 compounds.
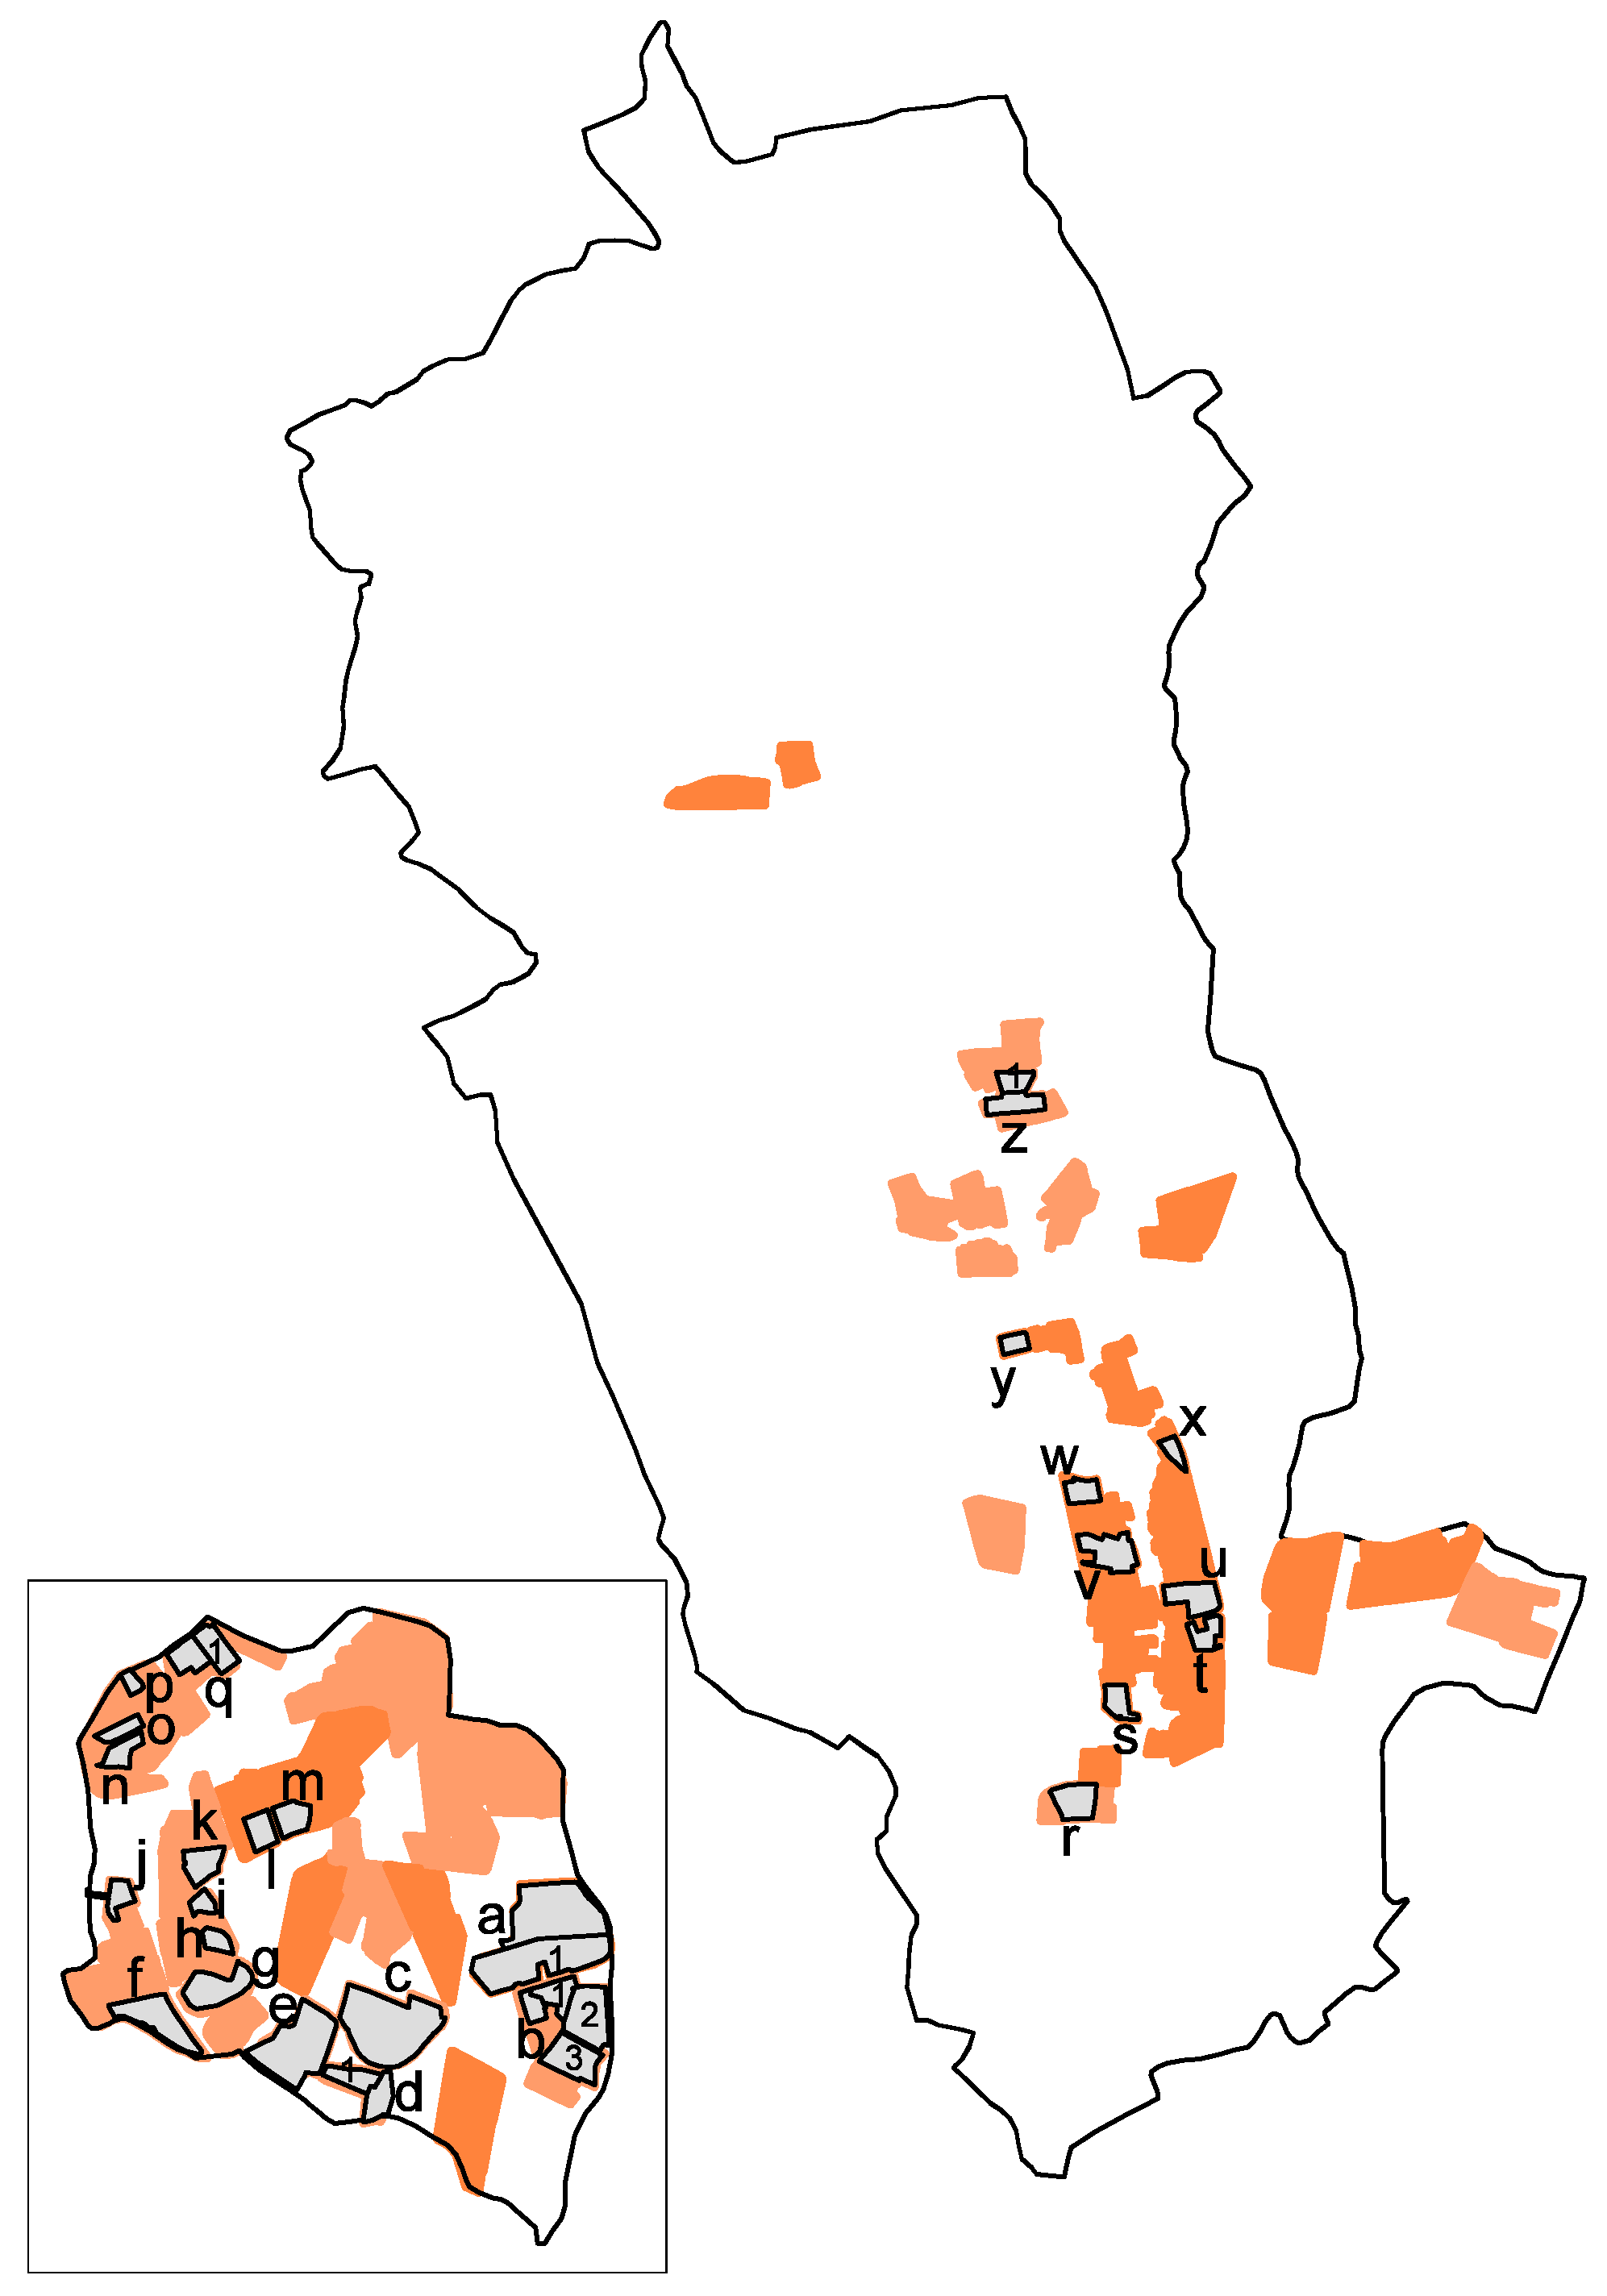
15 patches were further detected and then excluded from the evaluation because they belonged to other morphological types and were mixed-up with the Regular and Irregular ones. The amount of shared open spaces (walkways, green spaces, and park plots) was also evaluated to understand the suitability of compounds for the proposed strategy. As a result, 49 compounds out of the remaining 117 were evaluated as not suitable because they lacked or showed an insufficient quantity of shared open spaces to be left as public property against the assignment of development rights as quantified by the strategy. Another 35 compounds belonged to the age classes 2000, 2007 and 2015 (see Figure 5) and, therefore, were considered as not a priority for seismic retrofitting actions compared to the reinforced concrete buildings belonging to the age classes of 1928, 1964 and 1985. As a final result, 33 compounds out of the initial 132 were evaluated as being seismically vulnerable and thus suitable for urban transformation and eligible for the proposed strategy (Figure 6).
These compounds show different features in terms of land parcel unit area, building coverage ratio, amount of developed building volume, and open spaces floor area. The economic feasibility assessment tool presented in Section 3.2.3 assigned a virtual floor area ratio (VFA) = 4.50 m3/m2 to the shared open spaces designated for being left to public property, and estimated an economic rate of development rights (ERT) = 150 €/m3, and a seismic retrofitting rate SRR= 70 €/m3. As an example, Table 5 reports the results of the application of the tool for the compound a.1.
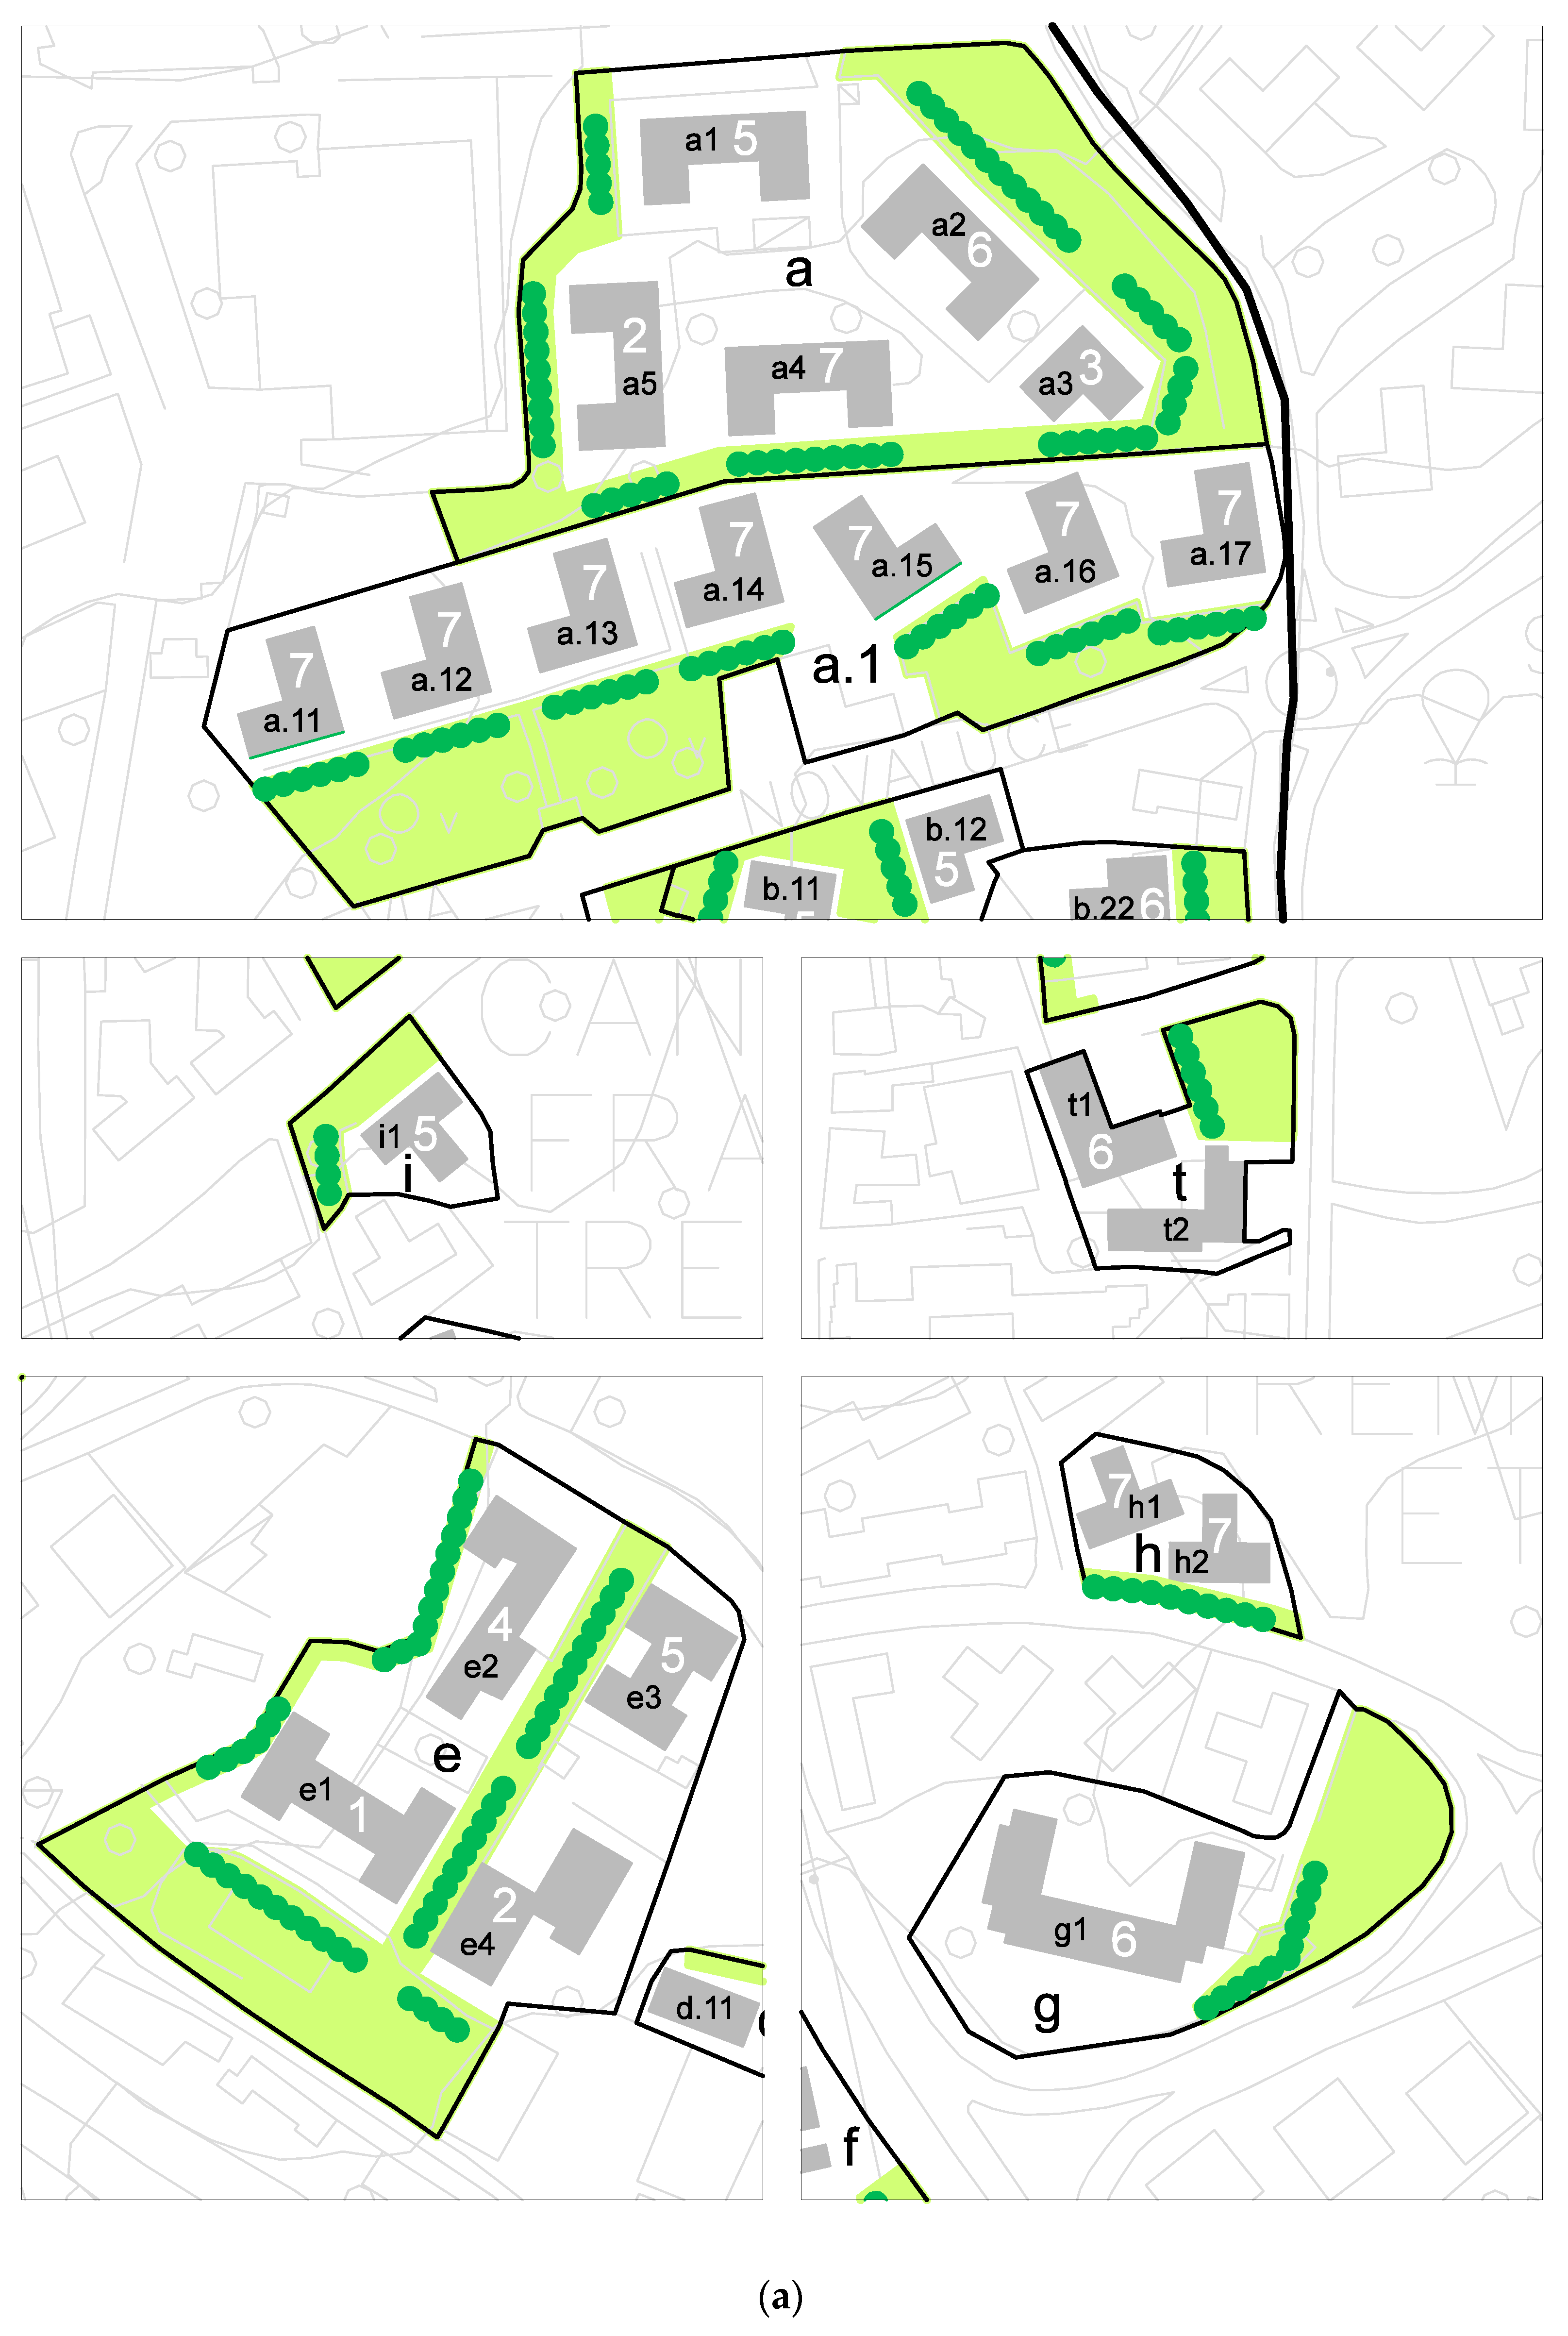
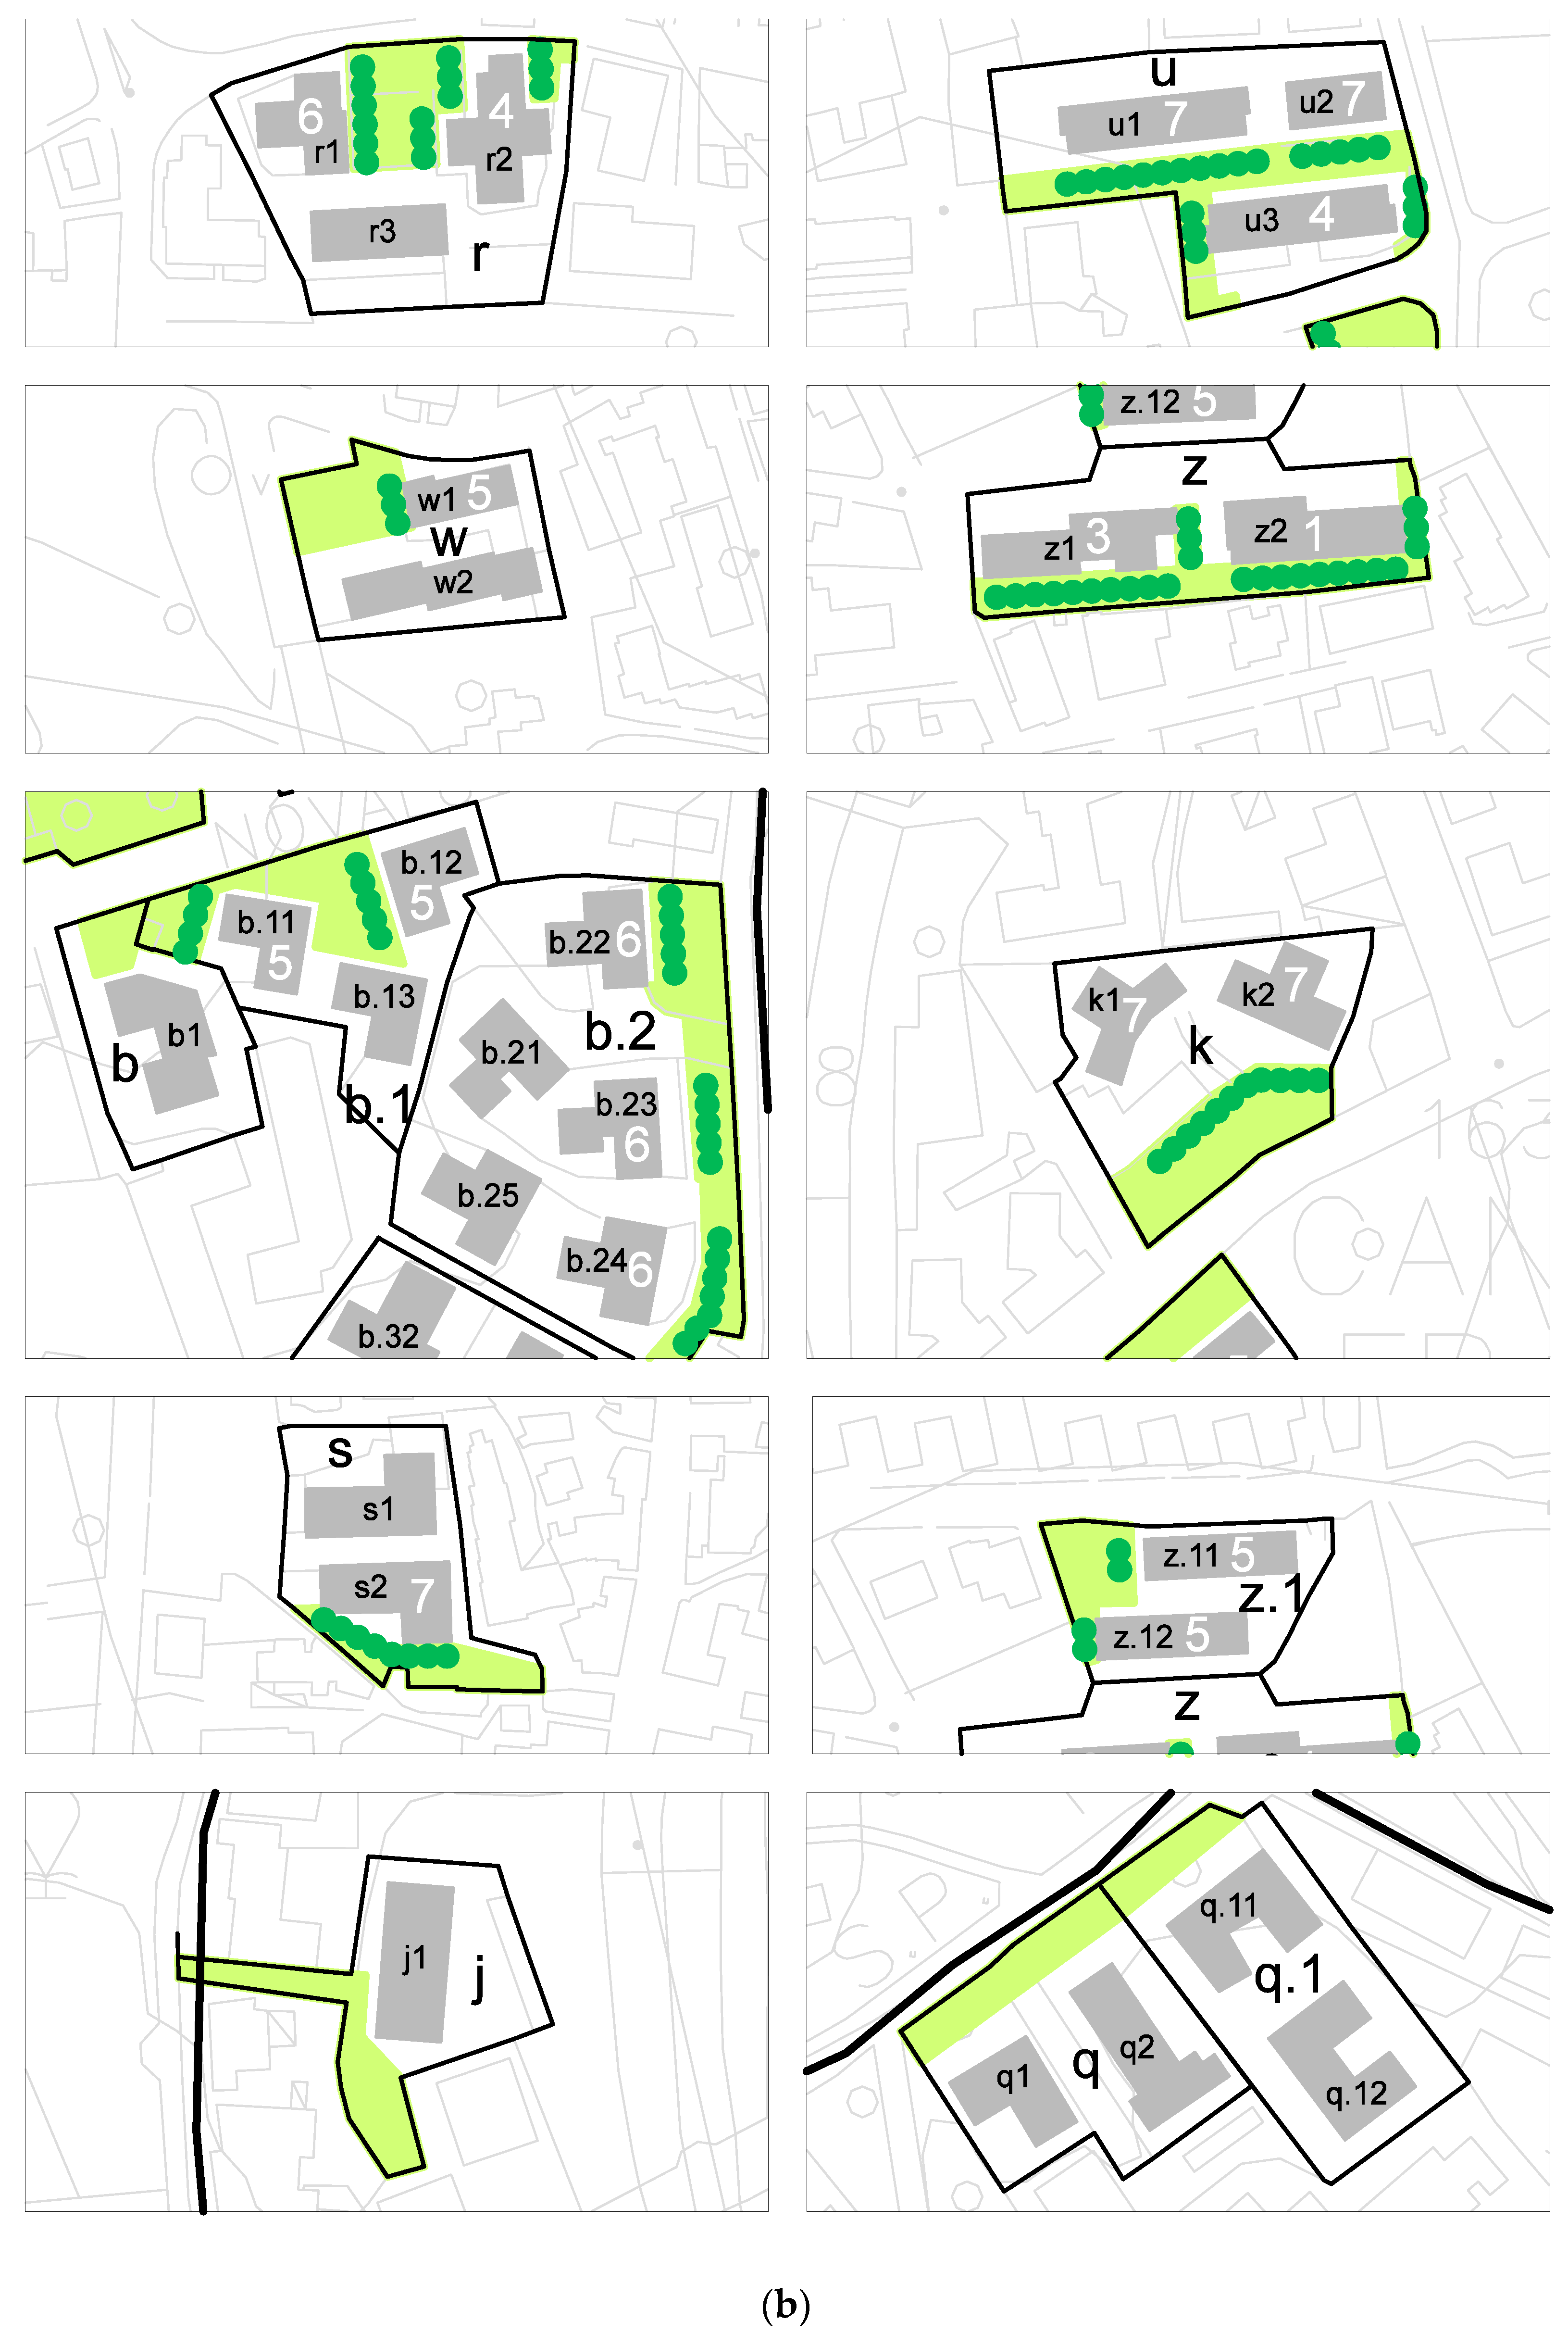
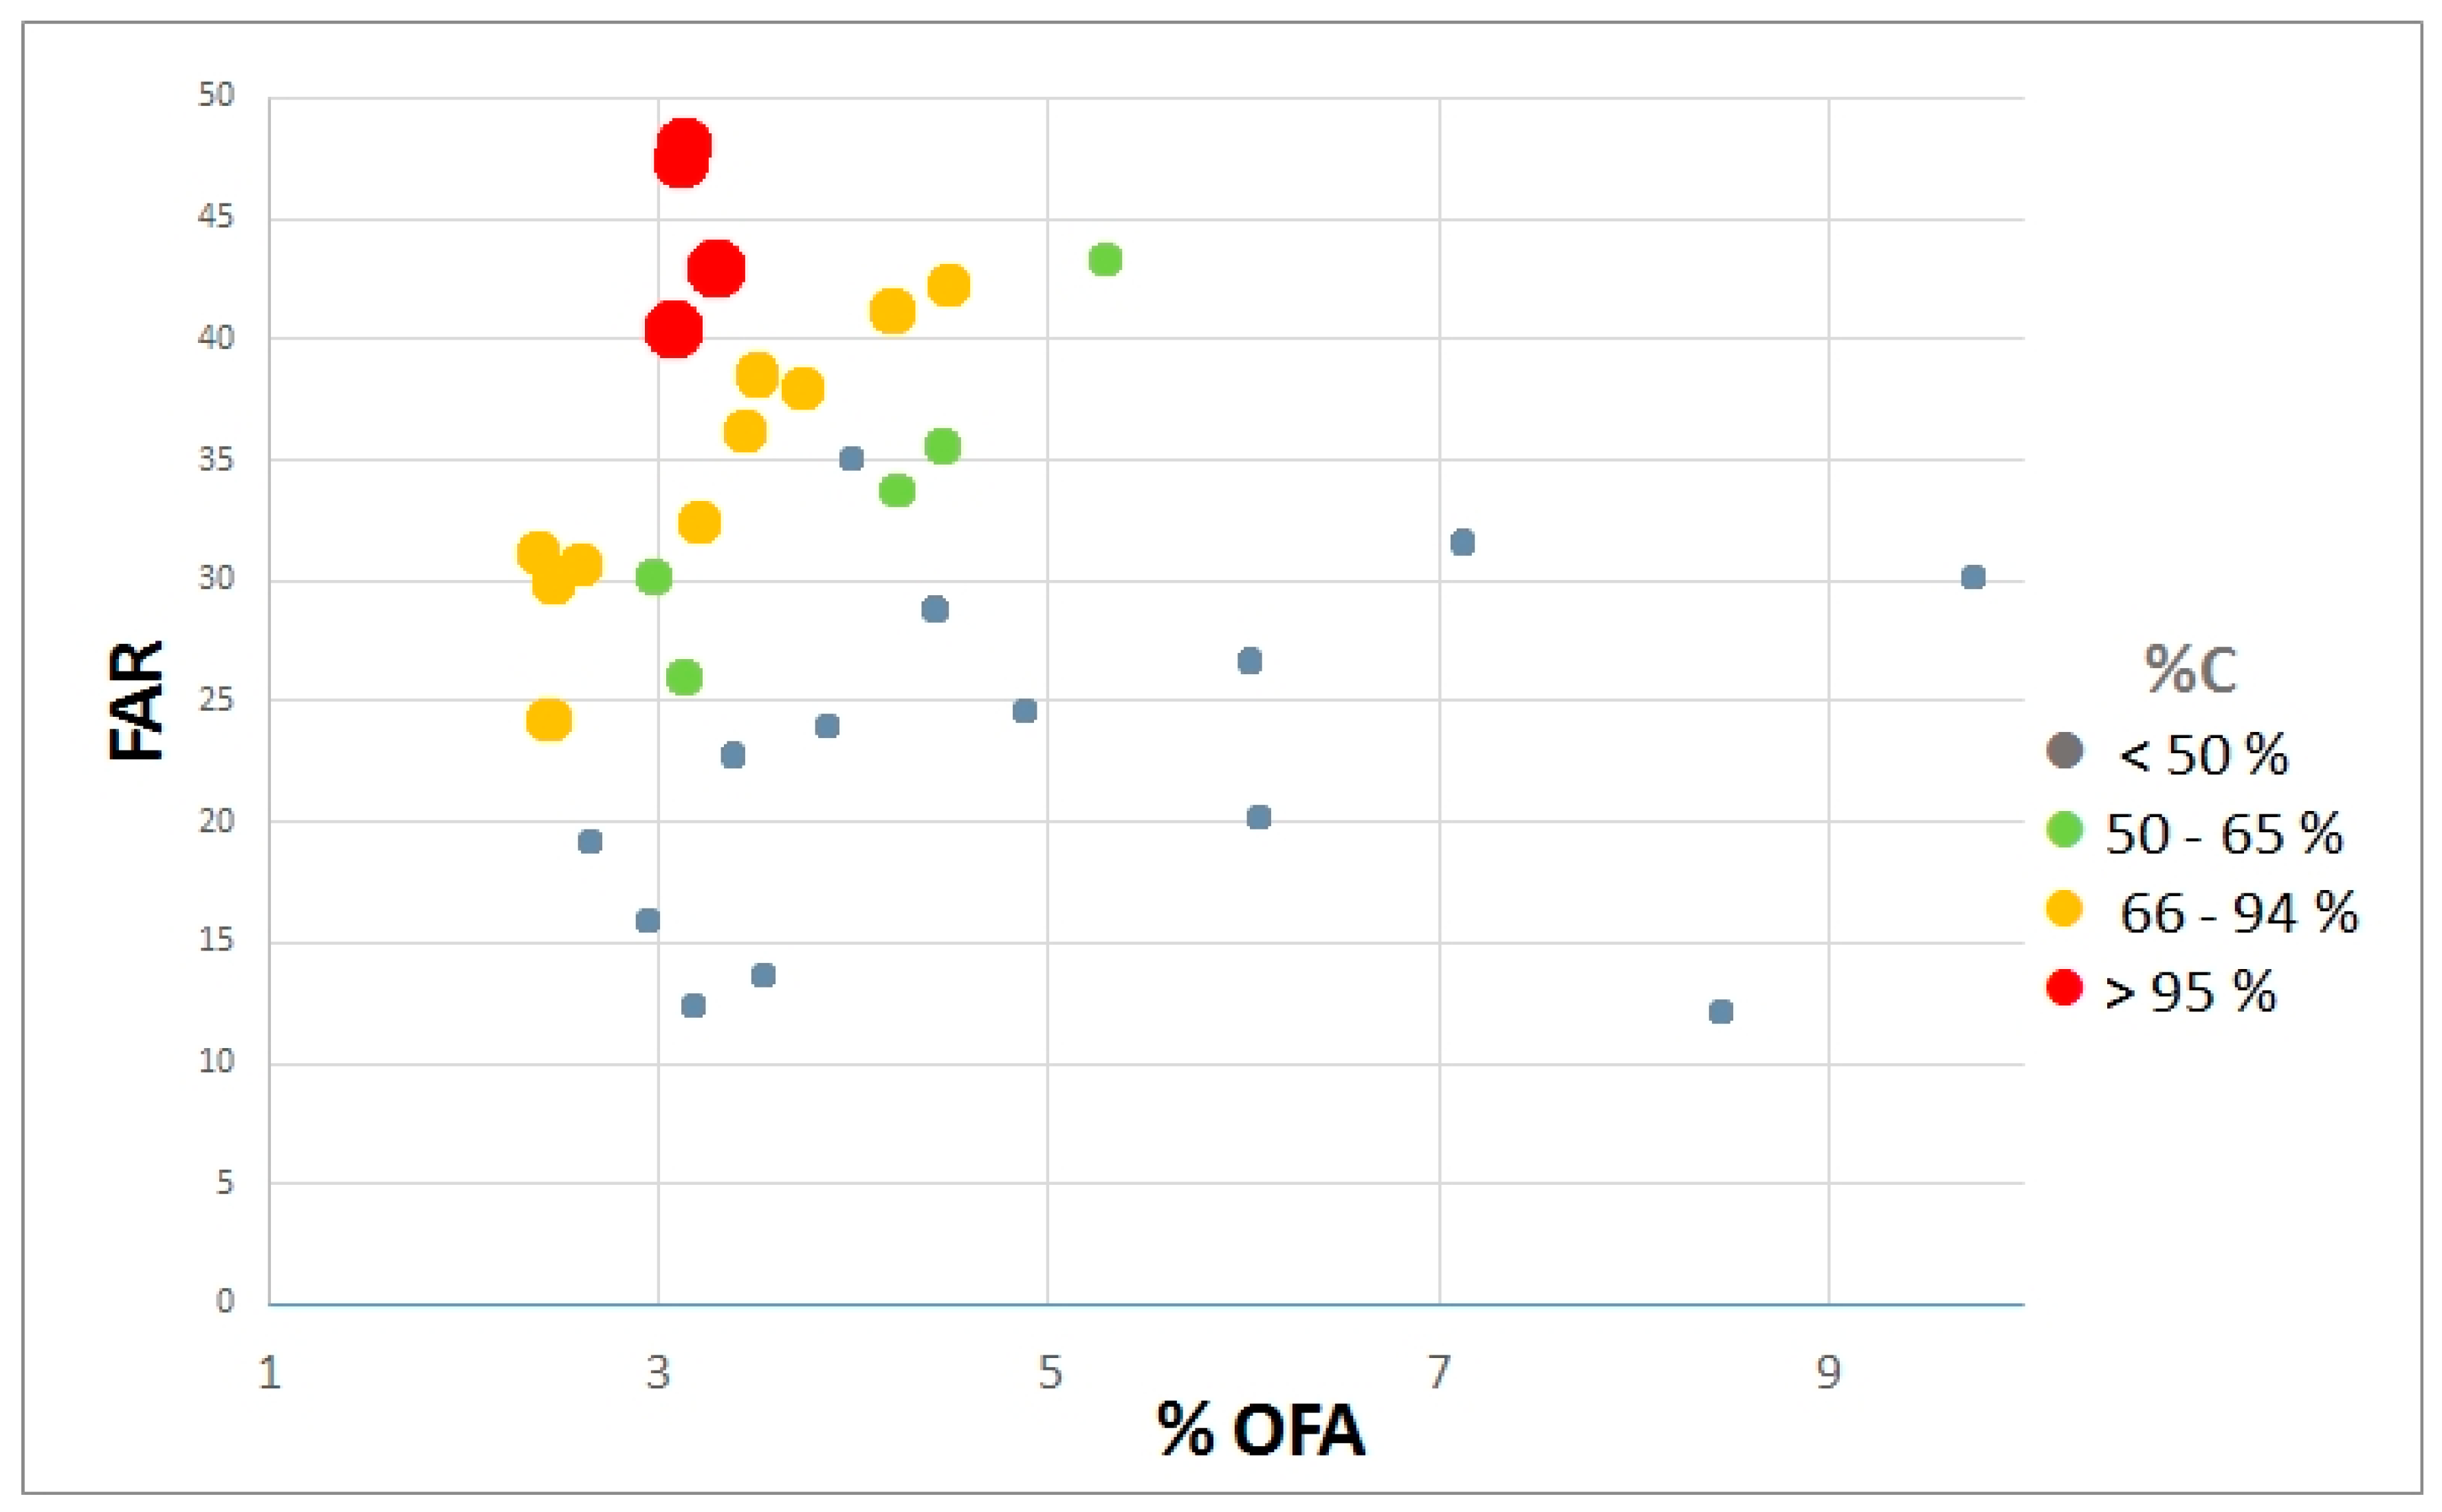
The tool showed that the overall seismic retrofitting costs can be covered at 95–100% (final balance B ≥ 0) when floor area ratio (FAR) ≤ 3.3 m3/m2 and % open spaces floor area (% OFA) ≥ 40% (compounds a, a1, i, t) (Figure 7a). Values of % OFA ≥ 24% and FAR ≤ 4.5 m3/m2 determine at least 2/3 of costs coverage (66%) and can cover up to a maximum of 94% that means a final balance < 0; this is the case of the compounds e, g (Figure 7b), d.1, j, n, r, u, v, w, z (Figure 7b). When FAR ≤ 5.3 m3/m2 and % OFA ≤ 26% costs coverage are covered at least 50% and up to 65%: this is the case of the compound b.1, d, k, s, z.1 (Figure 7b). In all other remaining compounds (b, b.2, b.3, c, f, h, l, m, o, p, q, q.1, x, y), values of FAR and % OFA imply that potential economic earnings from development rights can no longer balance the total retrofitting costs with a percentage of cost coverage % C decreasing from 49% to about 8%. As a final result, in the 12% of the total amount of compounds (4 out of 33) seismic retrofitting is economically viable and can be fully funded (Table 6). For most of the compounds (30%, 10 compounds) retrofitting can be undertaken through covering 66% up to 94% of the total costs; 15% of the compounds (5) can get economic restoration and covering from 50% to 65% of the retrofitting costs. The remaining 47% of the compounds can be considered disadvantaged and the seismic retrofitting resulted to be not economically viable (Table 7). Plotting the values of the four seismic retrofitting costs coverage (% C) classes (>50%, 50–64%, 65–94%, >95%), Figure 8 shows that corresponding values of FAR and % OFA identify four clusters and that the economic feasibility of the compounds transformation increases according to the increasing values of FAR and the decreasing values of % OFA.
Following the model reported in Section 3.2.4, the 33 selected compounds were analysed to evaluate the potential local cooling effect of the new trees in reducing the buildings’ energy demand. Alongside the shared open spaces of each compound, seven configurations of shading trees were identified (Figure 3). The possible layouts of new trees to be planted around each building depend on the spatial relationship between buildings and the available shared open spaces. Among the 93 buildings in the 33 compounds, configuration #7 (S, South) resulted in being the most suitable for 27 buildings, configuration #6 (E, East) for 13 buildings, configuration #5 (W, West) for 14 buildings, and configuration #4 (E + W), configuration #3 (S + E), configuration #2 (S + W) and configuration #1 (S + E + W) were suitable for 3 buildings each. For the remaining 27 buildings, no configuration of shading trees can be proposed because of the lack of surrounding shared open spaces (Table 8).
The highest values of energy demand reduction (varying from 37.3–41.8% up to 44.4–48.5%) involve a total 6% of the buildings (respectively, configurations #4 and #1) and producing significant results in terms of cooling by shading and, therefore, decreasing the relative energy demands.
For most of the buildings (more than 29%), the range of energy demand reduction is 11.1–12.8% (configuration #7) while for almost 14% of the buildings the percentage of energy reduction varies from 19.2% to 21.2% (Table 9).
Within each compound, the number of buildings benefitting from the shading effect of the trees, varies according to the amount of surrounding shared open spaces (Table 10). It can be seen that for 15 compounds (45.45%), the total amount of existing buildings (100%) can benefit from reduced energy demand while the percentage of beneficiary buildings decreased from 83.33% up to 60% in another 5 compounds. Moreover, in 8 compounds (24.24% of the total), only 50% of the buildings can be surrounded by shading trees. While in the remaining 5 compounds (15.15%) the lack of surrounding shared open space does not allow any plantation of shading trees.
5. Discussions
5.1. A Multi-Benefits Strategy Depending on Economic Viability
Overall, the benefits could be considered as the result of many intertwined attributes of the built environment, such as built-up density, building coverage ratio and percentage of open spaces within the blocks. Regular and Irregular blocks with multi-storey buildings include compounds that present different proportions and spatial arrangements of built-up areas and shared open spaces. Especially for dense urban contexts lacking green spaces, the peculiarities of these compounds may represent an opportunity for implementing a green infrastructure: they include open spaces with shared property assets that can be transferred to public property against the provision of development rights and can be used as areas in which to implement the green infrastructure.
The urban transformations of the future imply the potential achievement of new open spaces without financial efforts for local administrations. This could represent the basis for designing and implementing a new public green network of walking and cycling routes crossing-over the urban fabric. On the other hand, the landowners of the compounds, who have left their own shared open spaces to public property, could obtain as compensation a suitable amount of development rights to be sold to other private landowners and/or developers. The latter would be then able to transfer and use the development rights in other urban areas to increase the square footage and the height of existing buildings or developing new residential units.
The application of the strategy also returned a scenario of hundreds of small private open spaces scattered within the city that could be potentially transferred to public property and linked to existing roads, parking areas, playgrounds and existing small gardens. Even though the positive effects of just a few trees around each building was recognised, a green infrastructure strategy incorporating plantations of longer treelines could provide urban greenery and deliver a wider set of ecosystem services [37].
The multi-scale impact (from municipal level to building level) was the most significant feature of the proposed strategy. The possibility to improve the seismic safety and the energy efficiency of the built-up environment from neighbourhood level to the smallest scale of the single building, while enhancing the ecosystem performance of the overall urban fabric, represents a relevant opportunity for any planning strategy and transformation action. The urgent issue of making cities more sustainable, efficient, healthy and safer places [7] can only be addressed through a strategy which is grounded on an economic feasibility assessment of urban transformation and ensures the viability of the fragmented property assets balancing public/private costs and benefits [15].
Indeed, the economic feasibility of the proposed green infrastructure strategy might be affected by different market factors such as land and property prices that often depend strictly on local real estate dynamics [38]. Investigation of the economic land value of existing shared open spaces and the final market value of the potential up-zoning or new developments is crucial for better identifying the appropriate amount of development rights to be assigned to the compounds. Thus, the correct identification of the economic rate of development rights (ERT), through a specific local market prices survey, is required to trigger the transfer of development rights from compounds to other urban areas to be developed. Landowners of compounds would be willing to sell their own development rights whether the economic earnings will be enough to cover the seismic retrofitting costs. On the other hand, developers could buy the available development rights whether their cost will allow an adequate economic profit compared to the final market value of the new developments.
5.2. Achieving Seismic Retrofitting and Reduction of Cooling Energy Demand
Concerning seismic retrofitting, the results highlight that half of the total compounds would need some seismic retrofitting but only 25% were suitable according to the availability of shared open spaces. More specifically, seismic retrofitting was found to be economically viable in more than 40% of these selected compounds, allowing landowners to be funded for more than 2/3 of the total costs. The availability of such funds to be shared among the landowners is a key issue for the viability of a seismic retrofitting due to the multi-fragmented ownership of each compound. The large amount of single private properties in the compound such as apartments and garages, mixed up with shared assets such as lobbies, staircases and lifts but also walkways, green spaces and park plots, represents a real obstacle for implementing any kind of intervention. A property asset with a high number of private landowners implies a challenging decision that needs to address the willingness and the financial means of all owners in the compound [39]. However, these results appear promising because efforts to reduce the seismic vulnerability of the existing real estate are limited and urban policies for seismic risk mitigation are still at an early stage of development [20].
At the building scale, results show that more than 50% could benefit from the cooling effect of the trees if planted alongside the public acquired open spaces. According to the results, planting a treeline simultaneously alongside east, west and south sides (or just east and west sides) of the buildings could lead to a reduction of energy demand of up to 48.5%: locating trees alongside these orientations represents the best option to obstruct solar radiation in summertime, provide a shading effect on buildings, while reducing the local temperature around.
The reduction of buildings’ energy demand has been evaluated according to the study conducted by [35] that clearly showed the potential cooling effect of different tree layouts around buildings. Investigation in other similar research has detected different approaches and models for evaluating the trees’ shade effect on cooling energy reduction. These studies confirmed and validated the trees shading effect on the reduction of building cooling energy demand with different results that depend on the different urban environments, land-use configurations, and micro-climate conditions. For example, [40] highlighted that shaded building by greenery have a greater inertia in warming up and demonstrated how shading can result in an important saving of money for cooling (up to 218 € in the case study of Akure, Nigeria). Reference [41] valuated that the savings associated with urban shade trees can be up to $200 per tree (including the carbon sequestration effect). Reference [42] compared two identical buildings in Alabama (USA) and calculated that the unshaded building under full sunlight during the summer period required more than 2.6 times the amount of cooling energy than a shaded one. Moreover, a further but limited cooling effect could be provided by the evapotranspiration process of greenery, that could decrease local temperature in the surrounding of the buildings proportionally to the amount of tree canopy. Reference [43] quantified an energy saving of 15% when a scenario of shading and transpiration was considered.
Finally, tree species should be chosen and placed in order to properly shade the entire facades of the buildings and, therefore, maximise the reduction of energy demand: to this end, deciduous trees allowing for solar gain during the wintertime could be preferred, yet differences in cooling effects can be observed among different species [44,45].
5.3. Limitations
Beside the positive relevance of the results, the proposed strategy also shows some limitations. Implementing a green infrastructure is not always viable and may be strongly affected by the quality and amount of the open spaces to be acquired. The size, shape and location of the shared open spaces within the compounds were not always considered suitable for conversion into components of a green network. Their reduced size and narrow shape could negatively affect the design of the green intervention while their location, remoteness and interrelationship with the private residential buildings could affect the real possibility to connect open spaces to existing public gardens and roads. Moreover, the amount and the geographical distribution of these open spaces (which could be concentrated in specific areas) could generate some inequality in the provision of new urban green spaces at municipal level [46].
Although not all the possible configurations of greenery around the buildings were assessed (Figure 3), we choose those configurations that limited the number of trees to be located and that, therefore, represented more economical solutions in terms of financial resources needed for their deployment.
The implementation of retrofitting actions would generate new development of more than +50% of the total current development volume of the compounds. This is dependent on the amount of development rights to be granted to private compounds as a compensation for leaving their shared open spaces. The total amount of development depends on the number of compounds which could be retrofitted. In this case study, seismic retrofitting is viable for a very small proportion of compounds (6% of the selected ones, more than 1% of the total compounds) and this means that a limited amount of new developments could be transferred to other areas to be developed. When the number of compounds to be retrofitted would be higher, this amount of development could exceed the real need of the municipality and generate unsustainable scenarios of excessive soil sealing. In these cases, to limit the new development, a priority plan should be used to reduce the number of compounds to be retrofitted by selecting those most vulnerable and exposed in terms of the number of residents.
We also have to underline that cost of retrofitting interventions could be dependent on the level of seismic risk and, therefore, not be constant when changing the geographical contexts or city. This is especially true for stonemasonry buildings that require higher retrofitting cost [18]. In this method we have used a value (the seismic retrofitting rate) derived by the Italian Urban Developers National Association [31] that is suitable for a high-risk seismic context, but this value could be different in other cities.
However, the use of a constant cost for a city represents a reasonable choice, as the green infrastructure strategy is supposed to be implemented in a single municipality. Within a single city, only the availability of high-resolution information on soils and other geological features (i.e., obtained by a detailed seismic zonation) or spatial survey of building types (which is not the objectives of our paper) would allow differentiated costs of retrofitting to be obtained.
The reduction of energy demand is limited to the summertime period and for a proportion of buildings within each compound. Results of the proposed method show that shading effects provided by tree plantation could not be extended to all buildings in the same compound. This would imply unbalanced benefits for only a few landowners—those benefiting from the energy demand reduction of their buildings—against the transfer of shared open spaces property belonging to all landowners in the compound.
Also, the method presents some specific limitations. The land-ownership analysis (second phase), based on the visual interpretation of available high-resolution orthophotos on sample areas for each of the selected three morphology types, could be more time-consuming at a wider scale than the municipal level, due the large amount of compounds to be analysed. Thus, the method, as proposed, is particularly effective only at a municipal scale. Moreover, the economic feasibility assessment tool (third phase) is based on the assumption of three basic input parameters. Different values of these parameters could affect the results and the final findings of the research. To overcome this issue, a next step of the proposed study could include a sensitivity analysis of these input parameters for improving the quality and the reliability of the economic evaluation.
6. Conclusions
Seismic vulnerability and energy inefficiency in existing urban fabric represent challenging issues for local spatial planning targeting more livable, healthy and safer cities. When urban fabric lacks public green space and is characterized by compounds with multi-storey buildings and several individual landowners sharing the same property, the real opportunities to undertake any sustainable urban transformation could be nearly null. The double nature of the compound property asset, characterised by single private properties mixed up to shared ownership properties, implies complex decision processes when planning an intervention at compound level. In these respects, the willingness and availability of financial means to contribute to any intervention could be different and conflicting among landowners concerned and could affect and even prevent the implementation of the compound transformation.
Such complexity calls planners and policy makers to have a better understanding of the morphological features and property assets of urban contexts while claiming new approaches and policies for managing urban transformation. In this perspective, the proposed study represents an innovative urban strategy able to combine the needs of implementing public green infrastructure for cities lacking green spaces with the need for seismic retrofitting and the reduction of cooling energy demand of private existing buildings. The strategy is based on an economic feasibility assessment of the urban transformation which ensures viability in fragmented property assets while balancing public and private costs and benefits.
The proposed strategy presents a scenario in which landowners of the compound leave portions of shared open spaces to public property and obtain, as a compensation, an equitable amount of development rights to be sold to other private landowners and/or developers. Economic earnings deriving from selling development rights constitute a shared budget for funding a seismic retrofitting intervention of the buildings belonging to the compound. The developers transfer the purchased development rights in other urban areas for increasing the square footage and the height of existing buildings or developing new residential units. Local administrators acquire new open spaces without financial efforts and implement a new green infrastructure.
Finally, new greenery to be located alongside these new public areas provides further benefits to private buildings in terms of a significant reduction of cooling energy demand through the shading effect. Such a multi-scale strategy, acting from municipal level to building level, would allow the regeneration of vulnerable, inefficient and seismically unsafe portions of the city and increase the number and quality of ecosystem services provided by the new green infrastructure.
Author Contributions
Funding
This research received no external funding.
Conflicts of Interest
The authors declare no conflict of interest.
References
- Cohen-Shacham, E.; Walters, G.; Janzen, C.; Maginnis, S. Nature-Based Solutions to Address Global Societal Challenges; IUCN: Gland, Switzerland, 2016; ISBN 978-2-8317-1812-5. [Google Scholar]
- Nesshöver, C.; Assmuth, T.; Irvine, K.N.; Rusch, G.M.; Waylen, K.A.; Delbaere, B.; Haase, D.; Jones-Walters, L.; Keune, H.; Kovacs, E.; et al. The science, policy and practice of nature-based solutions: An interdisciplinary perspective. Sci. Total Environ. 2017, 579, 1215–1227. [Google Scholar] [CrossRef] [PubMed]
- Fan, P.; Ouyang, Z.; Basnou, C.; Pino, J.; Park, H.; Chen, J. Nature-based solutions for urban landscapes under post-industrialization and globalization: Barcelona versus shanghai. Environ. Res. 2017, 156, 272–283. [Google Scholar] [CrossRef] [PubMed]
- Tzoulas, K.; Korpela, K.; Venn, S.; Yli-Pelkonen, V.; Kazmierczak, A.; Niemela, J.; James, P. Promoting ecosystems and human health using green infrastructure: A literature review. Landsc. Urban Plan. 2007, 81, 167–178. [Google Scholar] [CrossRef]
- O’Brien, L.; DeVreese, R.; Kern, M.; Sievanen, T.; Stojanova, B.; Atmis, E. Cultural ecosystem benefits of urban and peri-urban green infrastructure across different European countries. Urban For. Urban Green. 2017, 24, 236–248. [Google Scholar] [CrossRef]
- La Rosa, D.; Privitera, R. Characterization of non-urbanized areas for land-use planning of agricultural and green infrastructure in urban contexts. Landsc. Urban Plan. 2013, 109, 94–106. [Google Scholar] [CrossRef]
- Wild, T.; Henneberry, J.M.; Gill, L. Comprehending the multiple ‘values’ of green infrastructure-valuing nature-based solutions for urban water management, from multiple perspectives. Environ. Res. 2017, 158, 179–187. [Google Scholar] [CrossRef] [PubMed]
- Pappalardo, V.; La Rosa, D.; Campisano, A.; La Greca, P. The potential of green infrastructure application in urban runoff control for land use planning: A preliminary evaluation from a southern Italy case study. Ecosyst. Serv. 2017, 26, 345–354. [Google Scholar] [CrossRef]
- McHale, M.R.; McPherson, E.G.; Burke, I.C. The potential of urban tree plantings to be cost effective in carbon credit markets. Urban For. Urban Green. 2007, 6, 49–60. [Google Scholar] [CrossRef]
- Givoni, B. Impact of planted areas on urban environmental quality: A review. Atmos. Environ. 1991, 25, 289–299. [Google Scholar] [CrossRef]
- Bowler, D.E.; Buyung-Ali, L.; Knight, T.M.; Pullin, A.S. Urban greening to cool towns and cities: A systematic review of the empirical evidence. Landsc. Urban Plan. 2010, 97, 147–155. [Google Scholar] [CrossRef]
- Bengston, D.N.; Fletcher, J.O.; Nelson, K.C. Public policies for managing urban growth and protecting open space: Policy instruments and lessons learned in the United States. Landsc. Urban Plan. 2004, 69, 271–286. [Google Scholar] [CrossRef]
- Brabec, E.; Smith, C. Agricultural land fragmentation: The spatial effects of three land protection strategies in the eastern United States. Landsc. Urban Plan. 2002, 58, 255–268. [Google Scholar] [CrossRef]
- Nelson, A.C.; Pruetz, R.; Woodruff, D.; Nicholas, J.C.; Juergensmeyer, J.C.; Witten, J. The TDR Handbook—Designing and Implementing Transfer of Development Rights Programs; Island Press: Washington, DC, USA, 2012; p. 344. ISBN 978-1597269810. [Google Scholar]
- Martinico, F.; La Rosa, D.; Privitera, R. Green oriented urban development for urban ecosystem services provision in a medium sized city in southern Italy. iForest 2014, 7, 385–395. [Google Scholar] [CrossRef]
- Pruetz, R.; Pruetz, E. Transfer of Development Rights Turns 40. Plan. Environ. Law 2007, 59, 3–11. [Google Scholar] [CrossRef]
- Scawthorn, C. A Brief History of Seismic Risk Assessment. In Risk Assessment, Modeling and Decision Support -Strategic Directions; Bostrom, A., French, S., Gottlieb, S., Eds.; Springer: Berlin, Germany, 2008; pp. 5–81. ISBN 978-3-540-71158-2. [Google Scholar]
- Crowley, H.; Colombi, M.; Borzi, B.; Faravelli, M.; Onida, M.; Lopez, V.; Polli, D. Comparison of seismic risk maps for Italy. Bull. Earthq. Eng. 2009, 7, 149–180. [Google Scholar] [CrossRef] [Green Version]
- ANCE/CRESME. Lo Stato del Territorio Italiano, Insediamento e Rischio Sismico e Idrogeologico 2012; ANCE: Roma, Italy, 2012; Available online: www.ance.it/docs/docDownload.aspx?id=8495 (accessed on 18 July 2018).
- La Greca, P.; Margani, G. Seismic and Energy Renovation Measures for Sustainable Cities: A Critical Analysis of the Italian Scenario. Sustainability 2018, 10, 254. [Google Scholar] [CrossRef]
- Frolova, N.I.; Larionov, V.I.; Bonnin, J.; Sushchev, S.P.; Ugarov, A.N.; Kozlov, M.A. Seismic risk assessment and mapping at different levels. Nat. Hazards 2016, 8, 43–62. [Google Scholar] [CrossRef]
- Maio, R.; Ferreira, T.M.; Vicente, R.; Estêvão, J. Seismic vulnerability assessment of historical urban centres: Case study of the old city centre of Faro, Portugal. J. Risk Res. 2015, 19, 551–580. [Google Scholar] [CrossRef]
- Segal, E.; Negev, M.; Feitelson, E.; Zaychik, D. Devising ‘policy packages’ for seismic retrofitting of residences. Nat. Hazards 2017, 89, 497–519. [Google Scholar] [CrossRef]
- Bernknopf, R.; Amos, P. Measuring earthquake risk concentration for hazard mitigation. Nat. Hazards 2014, 74, 2163–2192. [Google Scholar] [CrossRef]
- Ma, Z.; Cooper, P.; Daly, D.; Ledo, L. Existing building retrofits: Methodology and state-of-the-art. Energy Build. 2012, 55, 889–902. [Google Scholar] [CrossRef]
- Gooding, L.; Gul, M.S. Energy efficiency retrofitting services supply chains: A review of evolving demands from housing policy. Energy Strateg. Rev. 2016, 11–12, 29–40. [Google Scholar] [CrossRef]
- Privitera, R.; La Rosa, D. Enhancing carbon sequestration potential of urban green spaces through transfer of development rights strategy. Acta Geobalc. 2018, 4, 17–23. [Google Scholar] [CrossRef]
- Ko, Y. Urban Form and Residential Energy Use. A Review of Design Principles and Research Findings. J. Plan. Lit. 2013, 28, 327–335. [Google Scholar] [CrossRef]
- Ministero Delle Infrastrutture e Dei Trasporti. Linee Guida Per la Classificazione del Rischio Sismico Delle Costruzioni 2017. Available online: http://www.mit.gov.it/normativa/decreto-ministeriale-numero-65-del-07032017 (accessed on 18 July 2018).
- Ricci, P.; De Luca, F.; Verderame, G.M. 6th April 2009 L’Aquila earthquake, Italy: Reinforced concrete building performance. Bull. Earthq. Eng. 2011, 9, 285–305. [Google Scholar] [CrossRef]
- ANCE. Adeguamento Antisismico. In Sicurezza Strutturale Per Gli Edifici Residenziali in Cemento Armato Costruiti Prima Dell’entrata in Vigore Della Normativa Sismica; ANCE: Catania, Italy, 2012; Available online: http://www.consultaingegnerisicilia.it/download/Studio%20adeguamento%20antisismico.pdf (accessed on 11 June 2018).
- Ng, E.; Chen, L.; Wang, Y.; Yuan, C. A study on the cooling effects of greening in a high-density city: An experience from Hong Kong. Build. Environ. 2012, 47, 256–271. [Google Scholar] [CrossRef]
- Shashua-Bar, L.; Hoffman, M.E. Vegetation as a climatic component in the design of an urban street: An empirical model for predicting the cooling effect of urban green areas with trees. Energy Build. 2000, 31, 221–235. [Google Scholar] [CrossRef]
- Palme, M.; Inostroza, L.; Villacreses, G.; Lobato-Cordero, A.; Carrasco, C. From urban climate to energy consumption. Enhancing building performance simulation by including the urban heat island effect. Energy Build. 2017, 145, 107–120. [Google Scholar] [CrossRef]
- Calcerano, F.; Martinelli, L. Numerical optimisation through dynamic simulation of the position of trees around a stand-alone building to reduce cooling energy consumption. Energy Build. 2016, 112, 234–243. [Google Scholar] [CrossRef]
- Privitera, R.; Palermo, V.; Martinico, F.; Fichera, A.; La Rosa, D. Towards lower carbon cities: Urban morphology contribution in climate change adaptation strategies. Eur. Plan. Stud. 2018, 26, 812–837. [Google Scholar] [CrossRef]
- Graça, M.; Alves, P.; Gonçalves, J.; Nowak, D.J.; Hoehn Farinha-Marques, R.P.; Cunha, M. Assessing how green space types affect ecosystem services delivery in Porto, Portugal. Landsc. Urban Plan. 2017, 170, 195–208. [Google Scholar] [CrossRef]
- Linkous, E.R. Transfer of development rights in theory and practice: The restructuring of TDR to incentivize development. Land Use Policy 2016, 51, 162–171. [Google Scholar] [CrossRef]
- Webb, B.; Webber, S. The implications of condominium neighbourhoods for long-term urban revitalization. Cities 2017, 61, 48–57. [Google Scholar] [CrossRef]
- Balogun, A.A.; Morakinyo, T.E.; Adegun, O.B. Effect of tree-shading on energy demand of two similar buildings. Energy Build. 2014, 81, 305–315. [Google Scholar] [CrossRef]
- Akbari, H. Shade trees reduce building energy use and CO2 emissions from power plants. Environ. Pollut. 2002, 116, 119–126. [Google Scholar] [CrossRef]
- Laband, D.; Sophocleus, V. An experimental analysis of the impact of tree shade on electricity consumption. Arboric. Urban For. 2009, 35, 197–202. [Google Scholar]
- Hsieh, C.H.; Li, J.J.; Zhang, L.; Schweglerd, B. Effects of tree shading and transpiration on building cooling energy use. Energy Build. 2018, 159, 382–397. [Google Scholar] [CrossRef]
- Akbari, H.; Dan, K.M.; Sarah, B.E.; Hanford, J.W. Peak power and cooling energy savings of shade trees. Energy Build. 1997, 25, 139–148. [Google Scholar] [CrossRef]
- Lin, B.S.; Lin, Y.J. Cooling Effect of Shade Trees with Different Characteristics in a Subtropical Urban Park. HortScience 2010, 45, 83–86. [Google Scholar]
- La Rosa, D.; Takatori, C.; Shimizu, H.; Privitera, R. A planning framework to evaluate demands and preferences by different social groups for accessibility to urban greenspaces. Sustain. Cities Soc. 2018, 36, 346–362. [Google Scholar] [CrossRef]
Figure 1.
Localization and land-use the municipality of Tremesteri Etneo within the Metropolitan area of Catania (Italy) (source: Urban Atlas 2012).
Figure 1.
Localization and land-use the municipality of Tremesteri Etneo within the Metropolitan area of Catania (Italy) (source: Urban Atlas 2012).

Figure 2.
Landownership Analysis. Visual interpretation of high-resolution orthophoto (25 cm, 1:10,000) on a sample Compound (B = building, P = private open space, S = shared open space).
Figure 2.
Landownership Analysis. Visual interpretation of high-resolution orthophoto (25 cm, 1:10,000) on a sample Compound (B = building, P = private open space, S = shared open space).

Figure 3.
Possible configurations (W = West, E = East, S = South) of shading trees (in green) around buildings (in grey).
Figure 3.
Possible configurations (W = West, E = East, S = South) of shading trees (in green) around buildings (in grey).

Figure 4.
Urban growth map of the municipality of Tremestieri Etneo, Catania (Italy); (a) enclave of the municipality located at the south-east end of the territory.
Figure 4.
Urban growth map of the municipality of Tremestieri Etneo, Catania (Italy); (a) enclave of the municipality located at the south-east end of the territory.

Figure 5.
Urban morphology map of the municipality of Tremestieri Etneo, Catania (Italy); (a) enclave of the municipality located at the south-east end of the territory.
Figure 5.
Urban morphology map of the municipality of Tremestieri Etneo, Catania (Italy); (a) enclave of the municipality located at the south-east end of the territory.

Figure 6.
Thirty-three selected compounds (from a to z.1, in grey) out of the initial 132 belonging to the morphology category of Regular (dark orange) and Irregular (light orange) Blocks with multi-storey buildings.
Figure 6.
Thirty-three selected compounds (from a to z.1, in grey) out of the initial 132 belonging to the morphology category of Regular (dark orange) and Irregular (light orange) Blocks with multi-storey buildings.

Figure 7.
(a) Compounds a, a.1, i, t (seismic retrofitting costs coverage = 95–100%); compounds e, g, h (seismic retrofitting costs coverage = 66–94%). Buildings in dark grey, shared open spaces in light green, private adjacent setback yards in white, trees line in dark green. (b) Compounds r, u, w, z (seismic retrofitting costs coverage = 66–94%); compounds b.1, k, s, z.1 (seismic retrofitting costs coverage = 50–65%); compounds j, q, q1 (seismic retrofitting costs coverage = 8–49%). Buildings in dark grey, shared open spaces in light green, private adjacent setback yards in white, treelines in dark green.


Figure 8.
Distribution of seismic retrofitting costs coverage (% C) according to the values of FAR (m3/m2) and % OFA (%).
Figure 8.
Distribution of seismic retrofitting costs coverage (% C) according to the values of FAR (m3/m2) and % OFA (%).


Table 1.
Economic feasibility assessment tool for seismic retrofitting intervention.
| Economic Feasibility Assessment Tool—Seismic Retrofitting | ||
|---|---|---|
| Compound Morphology Parameters | Buildings Area | BA |
| Land Parcel unit Area | LPA | |
| Buildings Coverage Ratio | BCR = BA/LPA | |
| gross height of single storey | h | |
| number of Storeys | S | |
| total building Height | H = h × S | |
| amount of developed Volume | V = BA × H | |
| Floor Area Ratio | FAR | |
| Open spaces floor area | OFA = LPA − BFA | |
| % of open spaces to be transferred | % OFA | |
| Floor Area to be transferred | TFA = OFA × % OFA | |
| Input Parameters | Seismic retrofitting rate | SRR |
| Seismic retrofitting cost | SRC = SRR × V | |
| Virtual Floor Area Ratio | VFA | |
| amount of development to be tranferred | VT = VFA × TFA | |
| % increasing of new development | % V = VT/V | |
| economic rate of development rights | ERT | |
| Costs Coverage Parameters | economic revenues from development rights | ERV = ERT × VT |
| percentage of costs Coverage | % C = ERV/SRC | |
| final Balance | B = ERV − SRC | |
Table 2.
Energy reduction for configuration of trees (Calcerano and Martinelli, 2016).
| #Configuration of Shading Trees | Range of Energy Demand Reduction (%) |
|---|---|
| 1 (W + E + S) | 44.4–48.5 |
| 4 (W + E) | 37.3–41.8 |
| 6 (E) | 19.2–21.2 |
| 7 (S) | 11.1–12.8 |
Table 3.
Size and proportion of buildings and urban fabric alongside in the period 1928–2015.
| Buildings and Urban Fabric to | Area (m2) | Area (%) |
|---|---|---|
| 1928 | 257,761 | 9.47 |
| 1964 | 213,667 | 7.85 |
| 1985 | 1,337,113 | 49.10 |
| 2000 | 774,885 | 28.46 |
| 2007 | 121,269 | 4.45 |
| 2015 | 18,294 | 0.67 |
| Total | 2,722,989 | 100.00 |
Table 4.
Size and proportion of each urban morphology type within the urban fabric.
| Urban Morphology Types | Area (m2) | Area (%) |
|---|---|---|
| Historic monumental buildings | 10,263.30 | 0.37 |
| Grids | 183,251.90 | 6.60 |
| Linear | 176,763.30 | 6.36 |
| Irregular blocks with multi-storey buildings | 440,140.00 | 15.85 |
| Regular blocks with multi-storey buildings | 345,091.70 | 12.42 |
| Detached and semi-detached houses | 1,324,738.70 | 47.69 |
| Isolated buildings in farmlands | 73,722.90 | 2.65 |
| Industrial, commercial and public utilities areas | 223,569.20 | 8.05 |
| Total | 2,777,541.00 | 100.00 |
Table 5.
Economic feasibility assessment. Results from the compound a.1.
| Economic Feasibility Assessment—#Compound a.1 | |||
|---|---|---|---|
| Buildings area | BA | 3867.00 | m2 |
| Land parcel unit area | LPA | 18,858.00 | m2 |
| Buildings coverage ratio | BCR = BA/LPA | 20.51 | % |
| Gross height of single storey | h | 3.00 | m |
| Number of storeys | S | 5.00 | |
| Total building height | H = h × S | 15.00 | m |
| Amount of developed volume | V = BFA × H | 58,005.00 | m3 |
| Floor area ratio | FAR | 3.08 | m3/m2 |
| Open spaces floor area | OFA = LPA − BFA | 14,991.00 | m2 |
| % of open spaces to be transferred | % OFA | 40.42 | % |
| Floor area to be transferred | TFA = OFA × % OFA | 6060.00 | m2 |
| Seismic retrofitting rate | SRR | 70.00 | €/m3 |
| Seismic retrofitting cost | SRC = SRR × V | 4,060,350.00 | € |
| Virtual floor area ratio | VFA | 4.50 | m3/m2 |
| Amount of development to be tranferred | VT = VFA × TFA | 27,270.00 | m3 |
| % increasing of new development | % V = VT/V | 47.01 | % |
| Economic rate of development rights | ERT | 150.00 | €/m3 |
| Economic revenues from development rights | ERV = ERT × VT | 4,090,500.00 | € |
| Percentage of costs coverage | % C = ERV/SRC | 100.74 | % |
| Final balance | B = ERV − SRC | 30,150.00 | € |
Table 6.
Morphology parameters and percentage of costs coverage for the 33 selected compounds.
| #Compound | Floor Area Ratio (FAR) m3/m2 | % Open Spaces to Be Transferred (% OFA) | % of Costs Coverage (% C) |
|---|---|---|---|
| a | 3.29 | 42.91 | 102.68 |
| a.1 | 3.08 | 42.91 | 100.74 |
| b | 3.18 | 12.41 | 27.68 |
| b.1 | 4.46 | 35.60 | 54.16 |
| b.2 | 3.87 | 24.00 | 44.44 |
| b.3 | 4.88 | 24.60 | 32.80 |
| c | 2.94 | 15.88 | 39.23 |
| d | 5.29 | 43.30 | 55.76 |
| d.1 | 4.49 | 42.21 | 68.10 |
| e | 3.74 | 37.97 | 77.69 |
| f | 4.42 | 28.84 | 47.51 |
| g | 3.21 | 32.37 | 79.80 |
| h | 6.08 | 20.24 | 21.25 |
| i | 3.13 | 48.05 | 117.15 |
| j | 3.44 | 36.24 | 78.30 |
| k | 4.22 | 33.72 | 61.54 |
| l | 9.74 | 30.13 | 16.00 |
| m | 8.44 | 12.16 | 8.30 |
| n | 4.20 | 41.16 | 68.02 |
| o | 7.12 | 31.58 | 25.88 |
| p | 6.04 | 26.68 | 28.33 |
| q | 3,38 | 22,78 | 46,63 |
| q.1 | 3.53 | 13.63 | 26.24 |
| r | 2.44 | 24.25 | 69.91 |
| s | 3.13 | 25.96 | 52.21 |
| t | 3.12 | 47.43 | 95.93 |
| u | 2.39 | 31.18 | 92.62 |
| v | 2.46 | 29.86 | 85.17 |
| w | 2.61 | 30.61 | 80.45 |
| x | 2.65 | 19.22 | 49.42 |
| y | 3.99 | 35.02 | 47.04 |
| z | 3.51 | 38.53 | 75.03 |
| z.1 | 2.98 | 30.15 | 65.31 |
Table 7.
Viability of seismic retrofitting (% of costs coverage) for each selected compound.
| #Compound | Number of Compounds | % Compounds | % of Costs Coverage (% C) |
|---|---|---|---|
| a, a.1, i, t | 4 | 12.12 | 95–100% |
| d.1, e, g, j, n, r, u, v, w, z | 10 | 30.30 | 66–94% |
| b.1, d, k, s, z.1 | 5 | 15.15 | 50–65% |
| b, b.2, b.3, c, f, h, l, m, o, p, q, q.1, x, y | 14 | 42.42 | 8–49% |
Table 8.
Number and percentage of buildings per each configuration of shading trees.
| #Configuration of Shading Trees | Number of Buildings | % of Buildings |
|---|---|---|
| 1 | 3 | 3.23 |
| 2 | 3 | 3.23 |
| 3 | 3 | 3.23 |
| 4 | 3 | 3.23 |
| 5 | 14 | 15.05 |
| 6 | 13 | 13.98 |
| 7 | 27 | 29.03 |
| / | 27 | 29.03 |
| Total | 93 | 100 |
Table 9.
Percentage of energy demand reduction per each building within the configuration of shading trees #1, 4, 6, 7.
Table 9.
Percentage of energy demand reduction per each building within the configuration of shading trees #1, 4, 6, 7.
| Range of Energy Demand Reduction (%) | #Configuration of Shading Trees | Number of Buildings | % of Buildings |
|---|---|---|---|
| 44.4–48.5 | 1 | 3 | 3.23 |
| 37.3–41.8 | 4 | 3 | 3.23 |
| 19.2–21.2 | 6 | 13 | 13.98 |
| 11.1–12.8 | 7 | 27 | 29.03 |
Table 10.
Proportion of buildings benefiting from the shading effect of the trees within each compound.
Table 10.
Proportion of buildings benefiting from the shading effect of the trees within each compound.
| % of Buildings Benefitting from Shading Trees | Number of Compounds | % of Compounds |
|---|---|---|
| 100 | 15 | 45.45 |
| 83.33–60 | 5 | 15.15 |
| 50 | 8 | 24.24 |
| / | 5 | 15.15 |
© 2018 by the authors. Licensee MDPI, Basel, Switzerland. This article is an open access article distributed under the terms and conditions of the Creative Commons Attribution (CC BY) license (http://creativecommons.org/licenses/by/4.0/).
Share and Cite
MDPI and ACS Style
Privitera, R.; La Rosa, D. Reducing Seismic Vulnerability and Energy Demand of Cities through Green Infrastructure. Sustainability 2018, 10, 2591. https://doi.org/10.3390/su10082591
AMA Style
Privitera R, La Rosa D. Reducing Seismic Vulnerability and Energy Demand of Cities through Green Infrastructure. Sustainability. 2018; 10(8):2591. https://doi.org/10.3390/su10082591
Chicago/Turabian StylePrivitera, Riccardo, and Daniele La Rosa. 2018. "Reducing Seismic Vulnerability and Energy Demand of Cities through Green Infrastructure" Sustainability 10, no. 8: 2591. https://doi.org/10.3390/su10082591
Note that from the first issue of 2016, this journal uses article numbers instead of page numbers. See further details here.