Article

The Role of Clay Swelling and Mineral Neoformation in the Stabilization of High Plasticity Soils Treated with the Fly Ash- and Metakaolin-Based Geopolymers

by
Mahmoud A. Mahrous
1,*,
Branimir Šegvić
2,
Giovanni Zanoni
2,
Suraj D. Khadka
1,
Sanjaya Senadheera
1 and
Priyantha W. Jayawickrama
1
1
Department of Civil, Environmental and Construction Engineering, Texas Tech University, P.O. Box 41023, Lubbock, TX 79409, USA
2
Department of Geosciences, Texas Tech University, 1200 Memorial Circle, Lubbock, TX 79409, USA
*
Author to whom correspondence should be addressed.
Minerals 2018, 8(4), 146; https://doi.org/10.3390/min8040146
Submission received: 23 February 2018 / Revised: 29 March 2018 / Accepted: 2 April 2018 / Published: 7 April 2018
(This article belongs to the Special Issue Geopolymers)

Abstract

:
In the southern U.S. states, expansive soils are frequently encountered, presenting an important hazard in geotechnical engineering. This research relies on mineralogical and geochemical clues to explain the swelling behavior of smectite-rich, high-plasticity soils, documented in a series of geomechanical swelling tests that were performed on the soils stabilized with the metakaolin (MKG) and fly ash (FAG) based geopolymers. These geopolymers were mixed with the soil at several concentration levels. The lowest swelling percentage was shown to correspond to the sample stabilized with 12% FAG and was attributed to the neoformation of calcium silicate hydrates that acted as a cementitious material, preventing the soil from expanding by occupying the pore space, thus binding the clay particles together. Conversely, the 12% MKG-stabilized soil exhibited enormous expansion, which was explained by montmorillonite swelling to the point that it gradually began to lose its structural periodicity. The relatively high abundance of the newly formed feldspathoids in MKG-treated samples is believed to have greatly contributed to the overall soil expansion. Finally, the cation exchange capacity tests showed that the percentage of Na+ and Ca2+, as well as the pH value, exercised strong control on the swelling behavior of smectitic soils.

1. Introduction

Expandable clays are frequent in soils and as such stand as a potential hazard in engineering due to the swelling and shrinkage behavior that they exhibit upon changes in the soil moisture content. Expansive soils are encountered throughout the world and are virtually omnipresent in the soils in the United States. According to the estimate of the New York State Division of Homeland Security and Emergency Services, in 2013 one-quarter of all homes in the country experienced some damage caused by soil expansion. In addition to residence objects, billions of dollars are lost annually as a result of infrastructure deterioration (roads, pipelines, bridges, and other structures). Due to the favorable mechanical properties, thermal stability, and chemical resistance, geopolymers have been extensively studied as tools for soil stabilization [1,2,3], concrete production [4,5], and in the preparation of insulating foams [6]. The raw materials needed for geopolymer production, which account for fly ash, silica fume, metakaolin, rice husk ash, and red mud, are largely available [7,8,9]. In addition, the production of geopolymers requires low energy consumption, which is a consequence of their low synthesis temperature that normally does not exceed 90 °C [10].
Geopolymers present structural chains that are formed through the reaction between the aluminosilicate source (low Ca content) and alkali-rich solutions (activators) at room temperature [11]. The aluminosilicate source may be a naturally occurring mineral, such as kaolinite, or the industrial by-products mentioned above [12]. The choice of the source material is controlled by a variety of factors, such as the cost, availability, and the type of application. The most common alkaline activators used in geopolymer synthesis are combinations of NaOH or KOH and Na2SiO3 or K2O3Si [12]. The process of geopolymerization is triggered by the replacement of H+ ion from the surface of a solid with monovalent cations (K+ or Na+) available from the solution [10]. In strong alkaline solutions, the aluminosilicates are rapidly dissolved to form the free SiO4 and AlO4 tetrahedra. Continuous addition of water will facilitate the reaction leading to the breakdown of the aluminosilicate structure. The SiO4 and AlO4 tetrahedra will thereafter establish a range of alternative spatial arrangements that can be grouped into three types of monolithic geopolymer products: –SiO4–AlO4– polysialate (PS), –SiO4–AlO4–SiO4– polysialatesiloxo (PSS), and –SiO4–AlO4–SiO4–SiO4– polysialatedisiloxo (PSDS) [3]. The empirical formula for geopolymers may be approximated as follows: Mn [–(SiO2)z–AlO2]n·wH2O, where z stands for the Si/Al molar ratio, M is the monovalent cation, n is the degree of polymerization, and w is the amount of water [13,14].
Recent investigations on soils stabilized with metakaolin- or fly ash-based geopolymers reported a clear increase in soil mechanical strength, failure strain, and Young’s modulus following treatment with metakaolin or fly ash geopolymers [10,15]. The microstructure and mineralogical analysis based on X-ray diffraction (XRD) and scanning electron microscopy (SEM) investigations corroborated a link between mechanical strength improvement and the binding effect of geopolymer gels. As a result, the soil becomes more homogeneous compared even to soil stabilized with cement [16].
Metakaolin (MK)- and class C fly ash (FAC)-based geopolymers are the two soil stabilizers whose interaction with natural soils are analyzed in this study. Metakaolin has a complex amorphous structure, which is a product of dehydroxylation of the 1:1 clay mineral kaolinite [17]. MK is widely used to synthesize geopolymers largely because of its high reactivity [10]. Fly ash, an industrial by-product from coal burning, is also used to synthesize geopolymers because it possesses a high content of the glassy aluminosilicate component [10]. Little research, however, has focused on the clay minerals in soil and their behavior with the addition of geopolymers. The majority of available literature on soil stabilization has reported on the enhanced geomechanical properties of soil that result from geopolymer addition (e.g., soil strength and long-term durability) [18]. This study, on the other hand, examines the swelling performance of the high plasticity montmorillonite-rich soil treated with various amounts of MK- and FAC-based geopolymers and with NaOH and Na2SiO3 as the alkaline activators. We further report on the possible link between the swelling of smectite and soil expansion, shedding more light on a relationship between the two. The dependence of the mineralogical characteristics of soil and its geotechnical properties (i.e., swelling and strength) following treatment with different geopolymers is discussed in depth. The study is essentially based on a detailed XRD investigation of in-house prepared soils treated with a range of geopolymer compositions. In addition to mineralogical studies, a standard cation exchange capacity (CEC) test was performed, allowing further insight into the composition and layer charge of soil smectites, which are believed to greatly influence the total swelling behavior of analyzed soils (e.g., [19]). The study will further examine the possibility of the formation of newly formed minerals or cementitious phases that might put constraints on the total soil swelling. Finally, the mineralogical inquiry undertaken herein is expected to provide meaningful answers to the contrasting swelling test results provided by Khadka et al. [20] where MKG-treated soils showed an aggressive swelling behavior compared to the moderate expansion shown by FAG-treated soils.

2. Materials and Methods

2.1. Soil

Soil samples were obtained from the Atlanta district in the northeastern part of the U.S. state of Texas. The soil was firstly processed by removing the coarse particles to obtain a uniform clay specimen for further examination. Such prepared soil was placed in the oven at 43 °C for 24 h to remove moisture. Thereafter, the soil was sieved to discard the remaining non-clay partials. The fraction not exceeding 425 µm (No. 40 sieve) served as a base of the soil prepared for further treatment. The plasticity index (PI) of the soil was 53.41% while the liquid and plastic limits were measured to 82.2% and 28.8%, respectively [ASTM D4318] [21]. Soil material was classified according to the Unified Soil Classification System (USCS) [22] as a high-plasticity clay (CH), which exhibits a high potential for swelling behavior in the presence of moisture.

2.2. Geopolymer Synthesis

The raw materials for geopolymer synthesis were acquired from the Metakaolin Company (Blaine, WA, USA). Chemical compositions of metakaolin and class C fly ash were provided by the company and were determined by X-ray fluorescence (Table 1). The chemical makeup of the raw “Atlanta” clay was determined using a Thermo Scientific ARL PERFORM’X sequential X-ray fluorescence spectrometer installed at the Department of Geosciences of Texas Tech University. The instrument operated in a standardless mode supported by a proprietary Uniquant software. The elemental concentrations were measured on powder samples prepared as fused disks and are expressed in Table 1. The following compounds were utilized as geopolymer activators: (1) NaOH solution with density of 1.53 gm/cc and full chemical composition consisted of 50 wt % NaOH, 50 wt % H2O, Na2CO = 0.3 wt % max, Cl = 0.01 wt % max, Fe = 5 ppm max, Ni = 0.01% max, PO4 = 5 ppm, and K = 0.05% max, (2) Na2SiO3 solution with 1.39 gm/cc specific gravity at 20 °C, pH = 11.3, Na2O = 10.60 wt %, SiO2 = 26.50 wt %, and H2O = 62.90 wt %. A mixture of NaOH and Na2SiO3 was prepared to maintain a Si:Al molar ratio of 1.67 as well as the Na:Al molar ratio of 1.07. It was noticed that upon mixing the NaOH with distilled water, a large amount of heat was produced. Therefore, the mixture (NaOH + H2O) was left to rest to allow the heat to evanesce prior to adding the mixture to the metakaolin and fly ash to prepare the geopolymer.

2.3. Soil Preparation

The dry soil sample was mixed with water to reach the optimum moisture content (OMC) of 30.8%. The OMC was determined in a series of geomechanical experiments performed on the same set of samples [20]. Then, the soil was sealed in a container for at least 16 h to equilibrate. The next step included the addition of geopolymers (FAG, MKG) in the proportion of 6%, 9%, and 12% by dry weight of soil. Full details of geopolymer mixtures are provided in (Table 2). Samples were reacted in cylinder molds measuring 6.9 cm × 10.2 cm and were cured for 7 days at room temperature. Finally, such prepared samples were placed for 7 days over a porous stone to allow the soil to absorb moisture in order to measure the soil swelling at saturated conditions. Each sample was confined from the side using a metallic ring to force the soil to absorb water from the bottom via the porous stone. Khadka et al. [20] described in detail the soil preparation and methods used to perform mechanical swelling measurements and unconfined compressive tests. The results of the swelling test obtained from Khadka et al. [20] for clay samples stabilized with different percentages of MKG and FAG along with an untreated soil sample are presented in Figure 1. Swelling data provided in Figure 1 represent an average of two measurements performed on two replicates with the standard deviation values of 1.85 (untreated soil), 0.15 (6% MK-treated soil), 1.39 (9% MK-treated soil), 15.04 (12% MK-treated soil), 0.83 (6% FA-treated soil), 1.99 (9% FA-treated soil), and 0.91 (12% FA-treated soil) [20].

2.4. Cation Exchange Capacity (CEC)

The CEC was determined according to the exchangeable soil cations method using NH4OAc (pH 7) as a reagent [23,24]. Soil pH and electric conductivity were measured following the 1:1 soil:water soil suspension method [25,26,27,28]. The CEC test was carried out for an untreated soil sample and for six samples stabilized with different percentages of MKG and FAG. All the aforementioned CEC analyses were performed by the commercial Ward Laboratories (Kearney, NE, USA).

2.5. X-ray Powder Diffraction (XRD)

Semi-quantitative XRD analyses were carried out on a set of nine samples, which included the untreated natural soil sample, original aluminosilicate source (FAC and MK), and a series of six samples of treated soil. The treated soil samples were gently crushed and powdered in an agate mortar and were thereupon placed in the sample holder. This was done with great care because of their inconsistency due to water saturation. All samples were scanned using a step mode (10 s per 0.02° 2θ) over the range of 3° to 50° 2θ (U = 30 kV, I = 15 mA; CuKα radiation) using a Rigaku Miniflex II installed at the Department of Geosciences, Texas Tech University, USA. Diffraction patterns were interpreted with the help of the Rigaku PDXL-Integrated X-ray powder diffraction software (v. 2.7.2.0, Tokyo, Japan) by comparing the experimental peaks with the published files provided by the International Centre for Diffraction Data (JCPDS 2000) [29].
XRD analyses on the natural soil sample were additionally performed on the <2 μm fraction. Such an approach resulted in a detailed speciation of clay minerals present in the soil. The clay fraction was separated from the crushed material by centrifugation. Na-metaphosphate was added to disperse the clays, followed by disaggregation using an ultrasonic bath. The clay fraction was further separated by centrifugation and saturated by Mg using a solution of 10 mL of ~4 M MgCl2 to ensure a uniform cation exchange [30]. To minimize the free-ion content, the clay suspensions were washed and centrifuged with distilled water at least three times. The clay suspension was left to dry at 50 °C prior to the transfer to porous ceramic tile. The measurement was taken in an air-dried condition and after saturation with ethylene glycol.

3. Results and Discussion

3.1. CEC Geochemistry

A summary of the CEC results for untreated and soils treated with different percentages of MKG and FAG is given in Table 3. The CEC analysis shows that the untreated soil sample had an initial CEC value of 58.1 meq/100 g and base saturation cation percentages of 85%, 10%, and 3% corresponding to Ca2+, Mg2+, and Na+, respectively (Table 3). The CEC increased for samples treated with FAG from 65.9 meq/100 g for 6% stabilizer to 72.2 meq/100 g for 12% stabilizer, whereas the sample stabilized with 6% MKG stabilizer measured 67.1 meq/100 g and 72.7 meq/100 g for 12% MKG stabilizer (Figure 2a). Generally, MKG- and FAG-treated soils had higher CEC values than the untreated soils, which are attributed to the geopolymer addition and subsequent replacement of Ca2+ and Mg2+ by Na+ during the cation exchange process. Taking into account the high Na+ content in the soil solutions, this exchange proceeded despite the higher charge of Ca2+ and Mg2+ with regard to Na+. A similar observation was made by Al-Rawas et al. [31] who observed a higher swelling in the case of the soil treated with a copper slag.
The first observation based on CEC measurements points to a clear increase in the Na+ concentration in the base saturation from 3% for untreated soil to 42% after the addition of 12% FAG. In turn, the concentration of Ca2+ decreased from 85% for the untreated soil to 55% for the soil treated with FAG (Table 3). In general, the samples stabilized with FAG showed higher Ca2+ concentrations in CEC base saturation compared with samples stabilized with MKG. This is in line with the higher content of CaO (21.09%) documented in FAC compared to MK (0.20%) (Table 1). Therefore, the difference between FAG and MKG in Ca2+ percentage in the CEC analysis could be attributed to the CaO content in the aluminosilicate source used in the preparation of FAG and MKG. However, the difference in the content of Ca2+ in the base saturation in both the FAG- and MKG-treated samples was not significant. This may be explained by a non- instantaneous dissolution of Ca2+ in FAC in the activator solution (NaOH), which seems to be the case for MKG [32].
Figure 2b,c shows the variation in the Ca2+ and Na+ content with the additions of MKG and FAG stabilizers. All samples depicted a tendency toward a decrease or increase in the concentration of Ca2+ and Na+, respectively, following an increase in stabilizer abundance. The highest measured values of Na+ were documented in samples treated with 12% MKG while the highest content of Ca2+ was detected in soils subjected to the addition of 6% FAG. Figure 2d shows a variation in the pH values upon the addition of different stabilizers. Broadly speaking, the pH increased with the addition of FAG and MKG (Table 3). The highest pH value (10.1) was obtained from the soil stabilized with 12% FAG, while the soils stabilized with 12% MKG measured a pH of 9.9, and non-stabilized soils had the lowest pH value (7.4). Despite the fact that the FAG and MKG treated soils both featured the same amount of NaOH + Na2SiO3, still, slightly higher pH values were documented in FAG samples. This phenomenon is attributed to the hydration of CaO present in the FAC, which in turn made the solution rather basic. This was clearly documented in FAG soils having a relatively high Ca content of 21.09%. A gradual increase in pH may also be attributed to the addition of NaOH and Na2SiO3 to the solution that were originally utilized to synthesize the aluminosilicate source (MK and FAC).

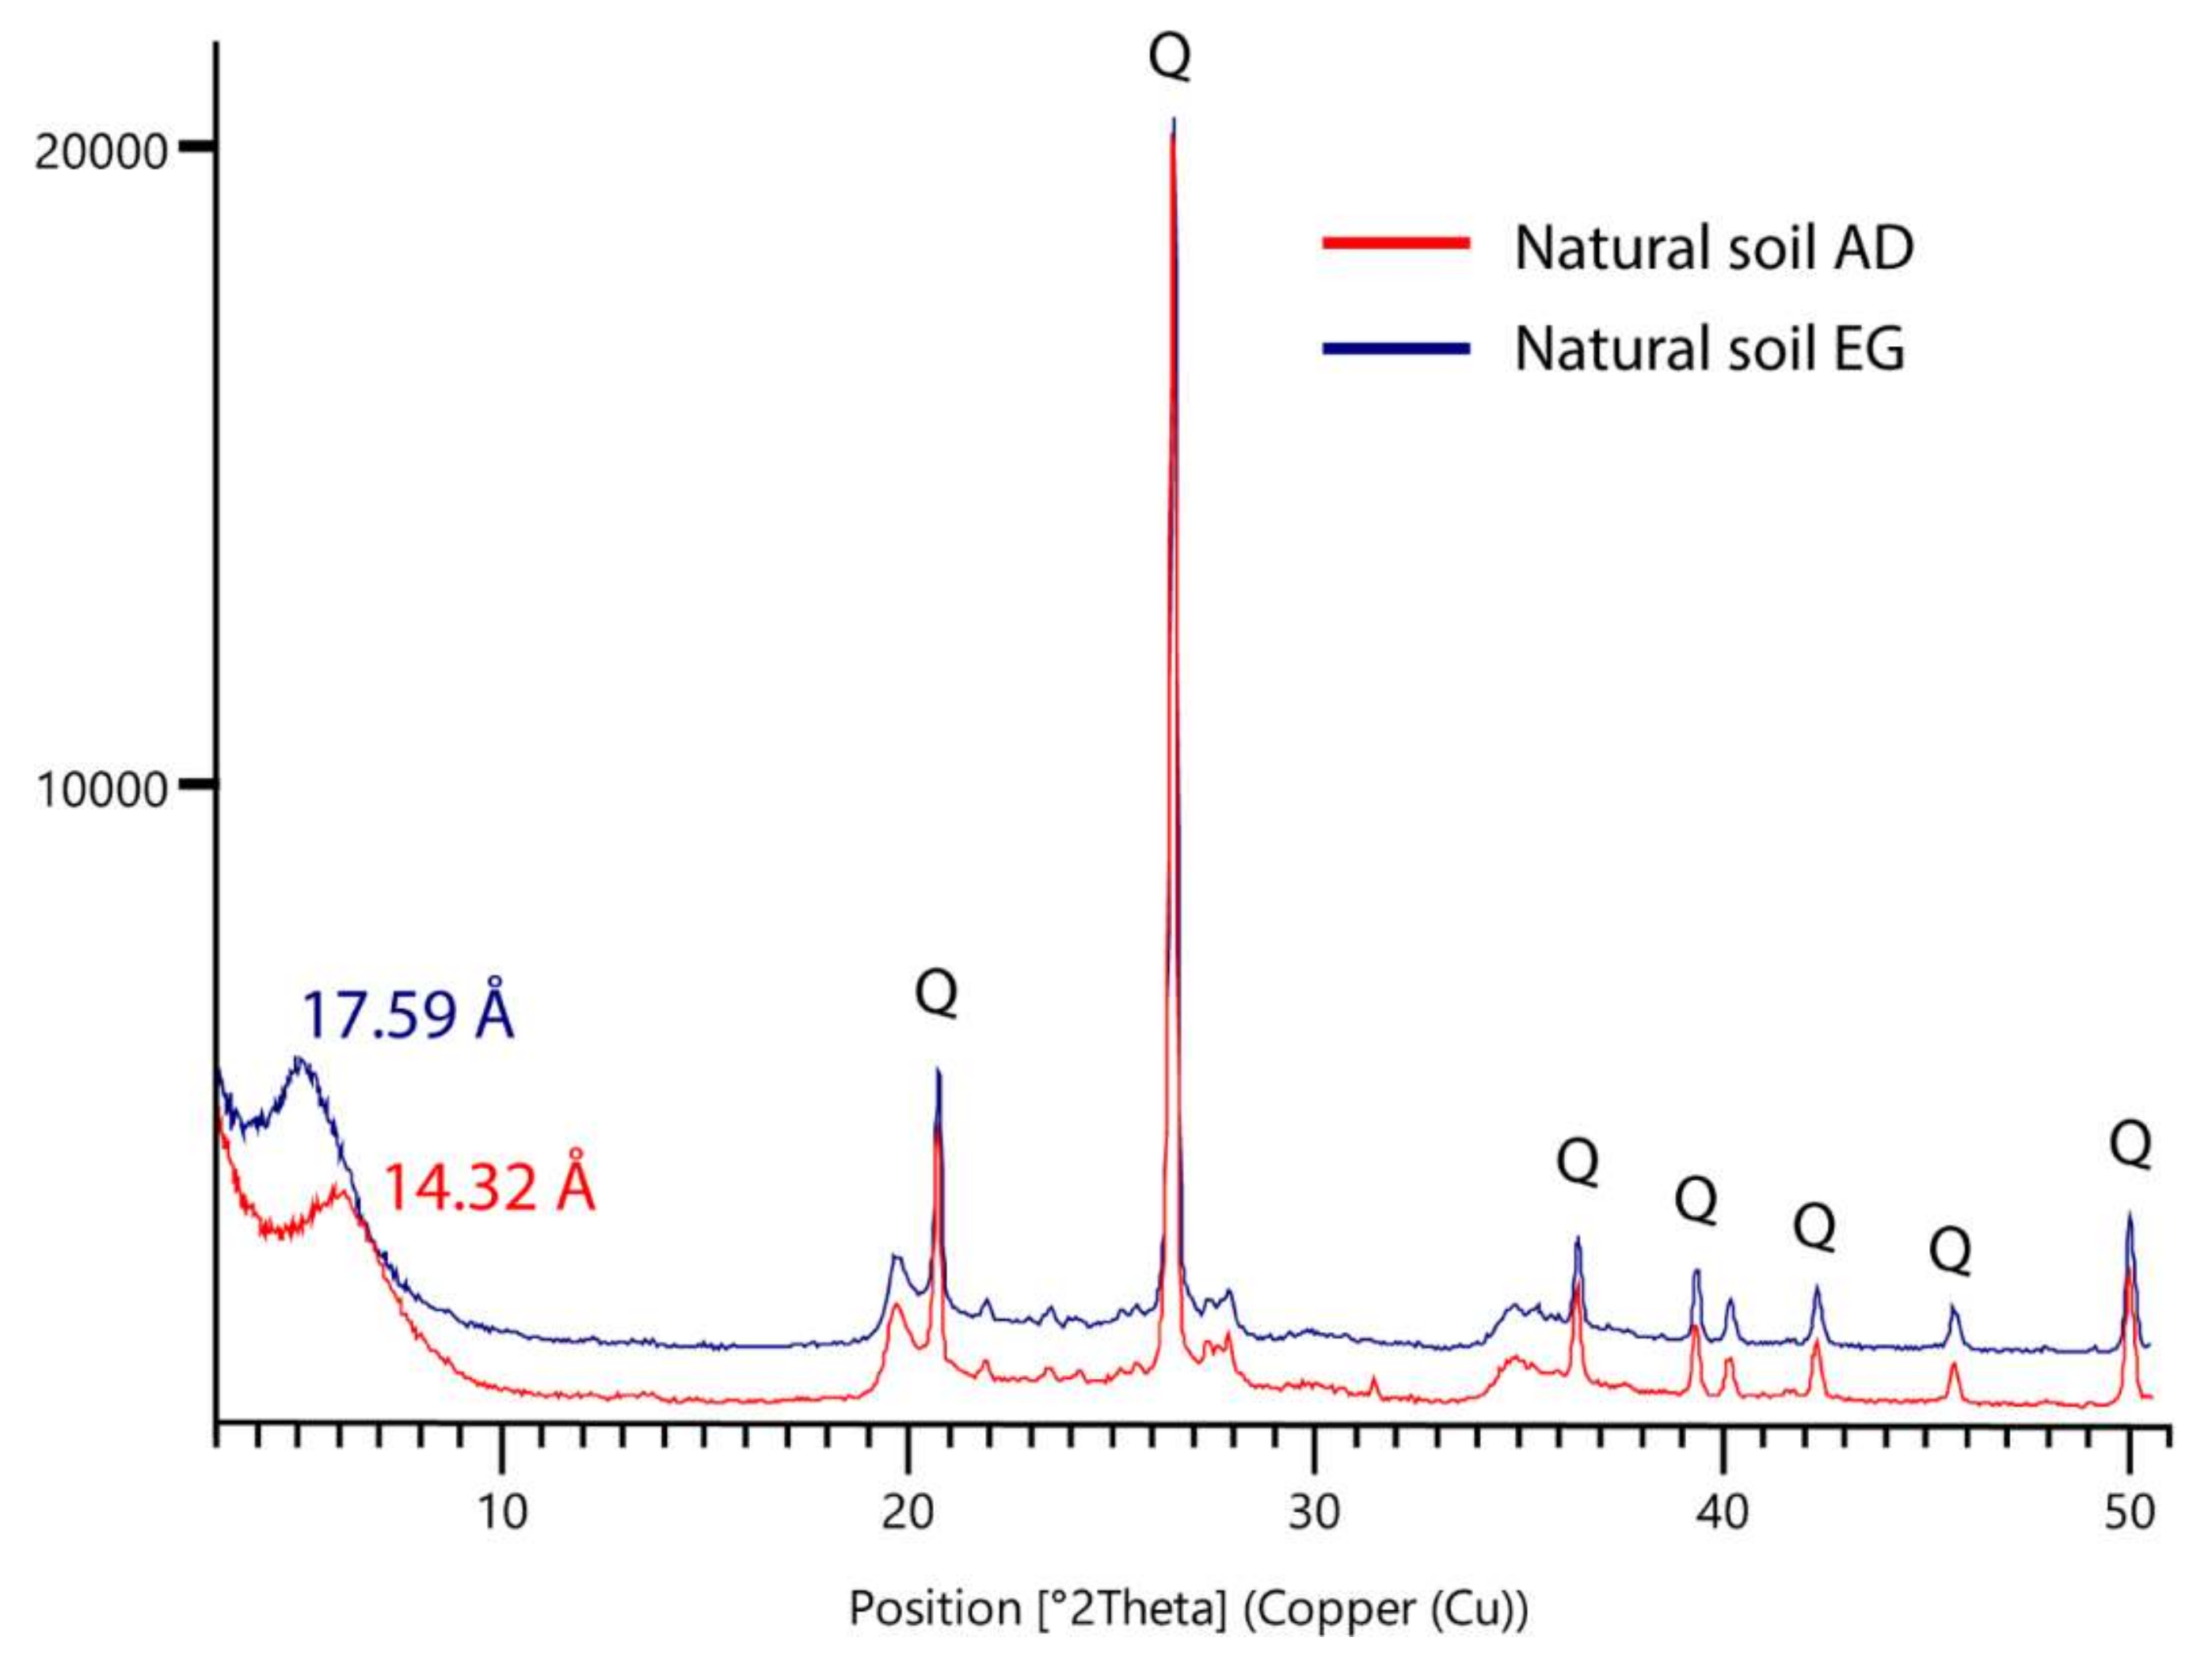
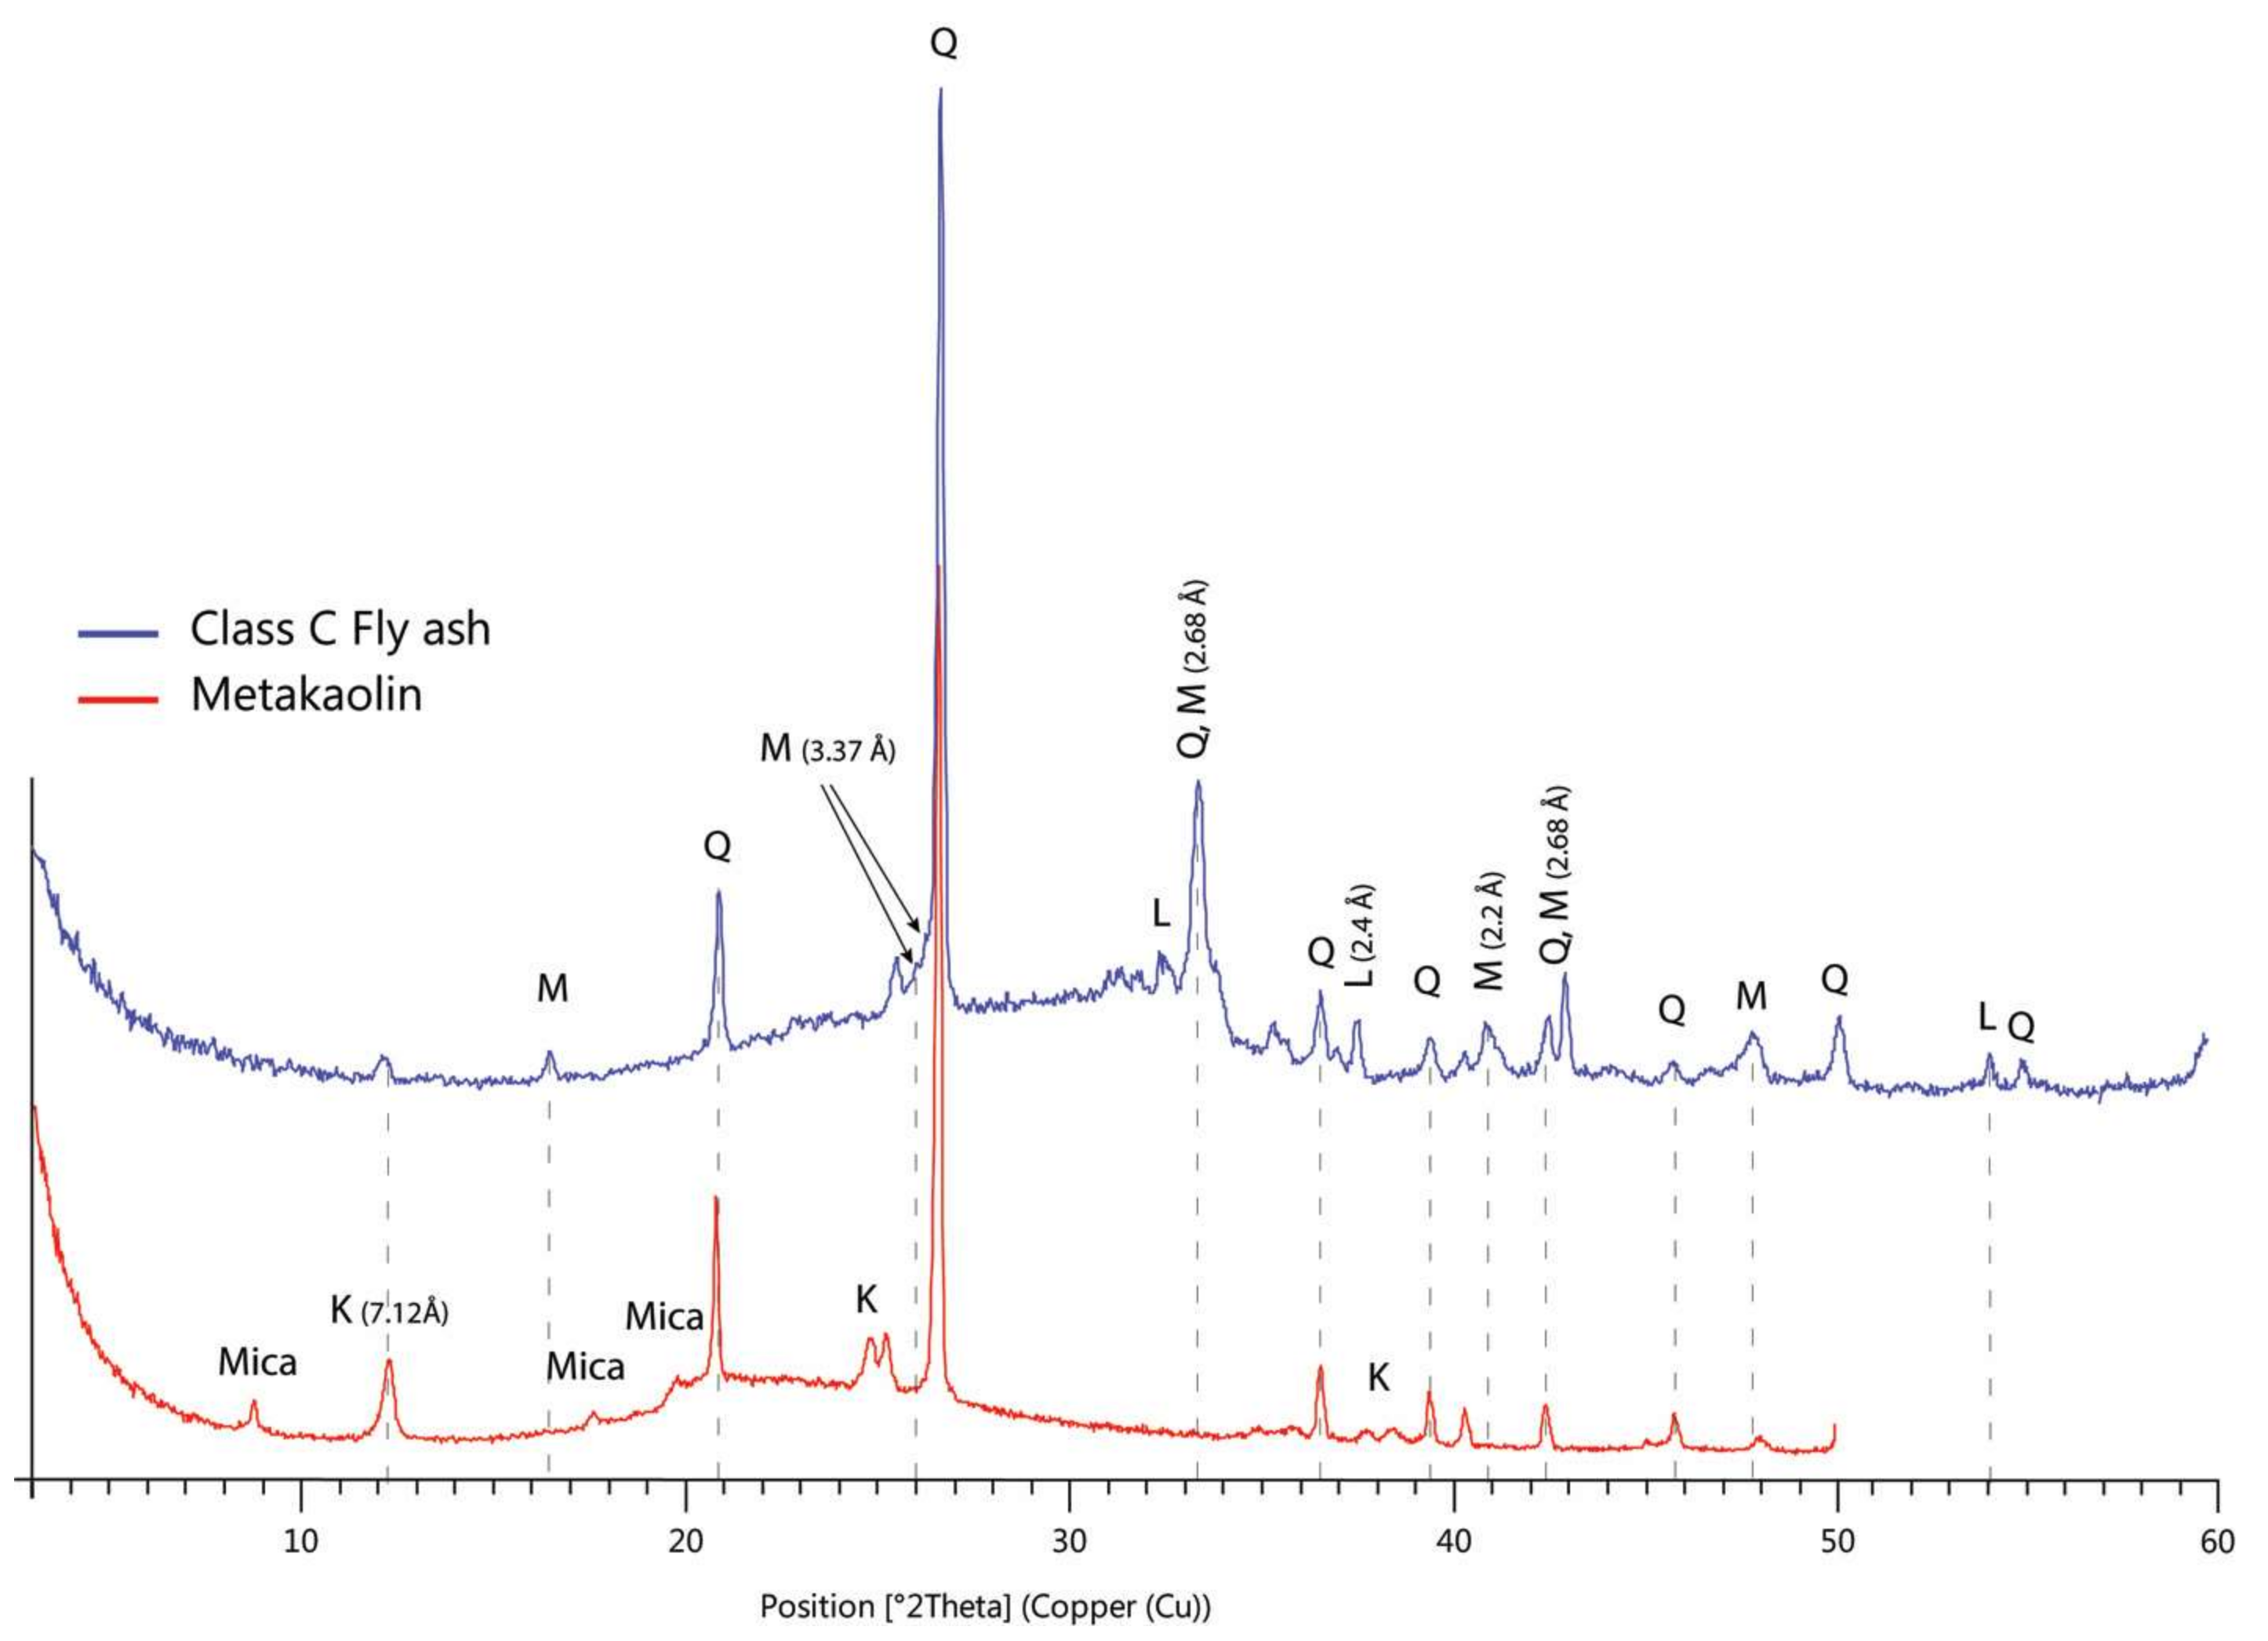
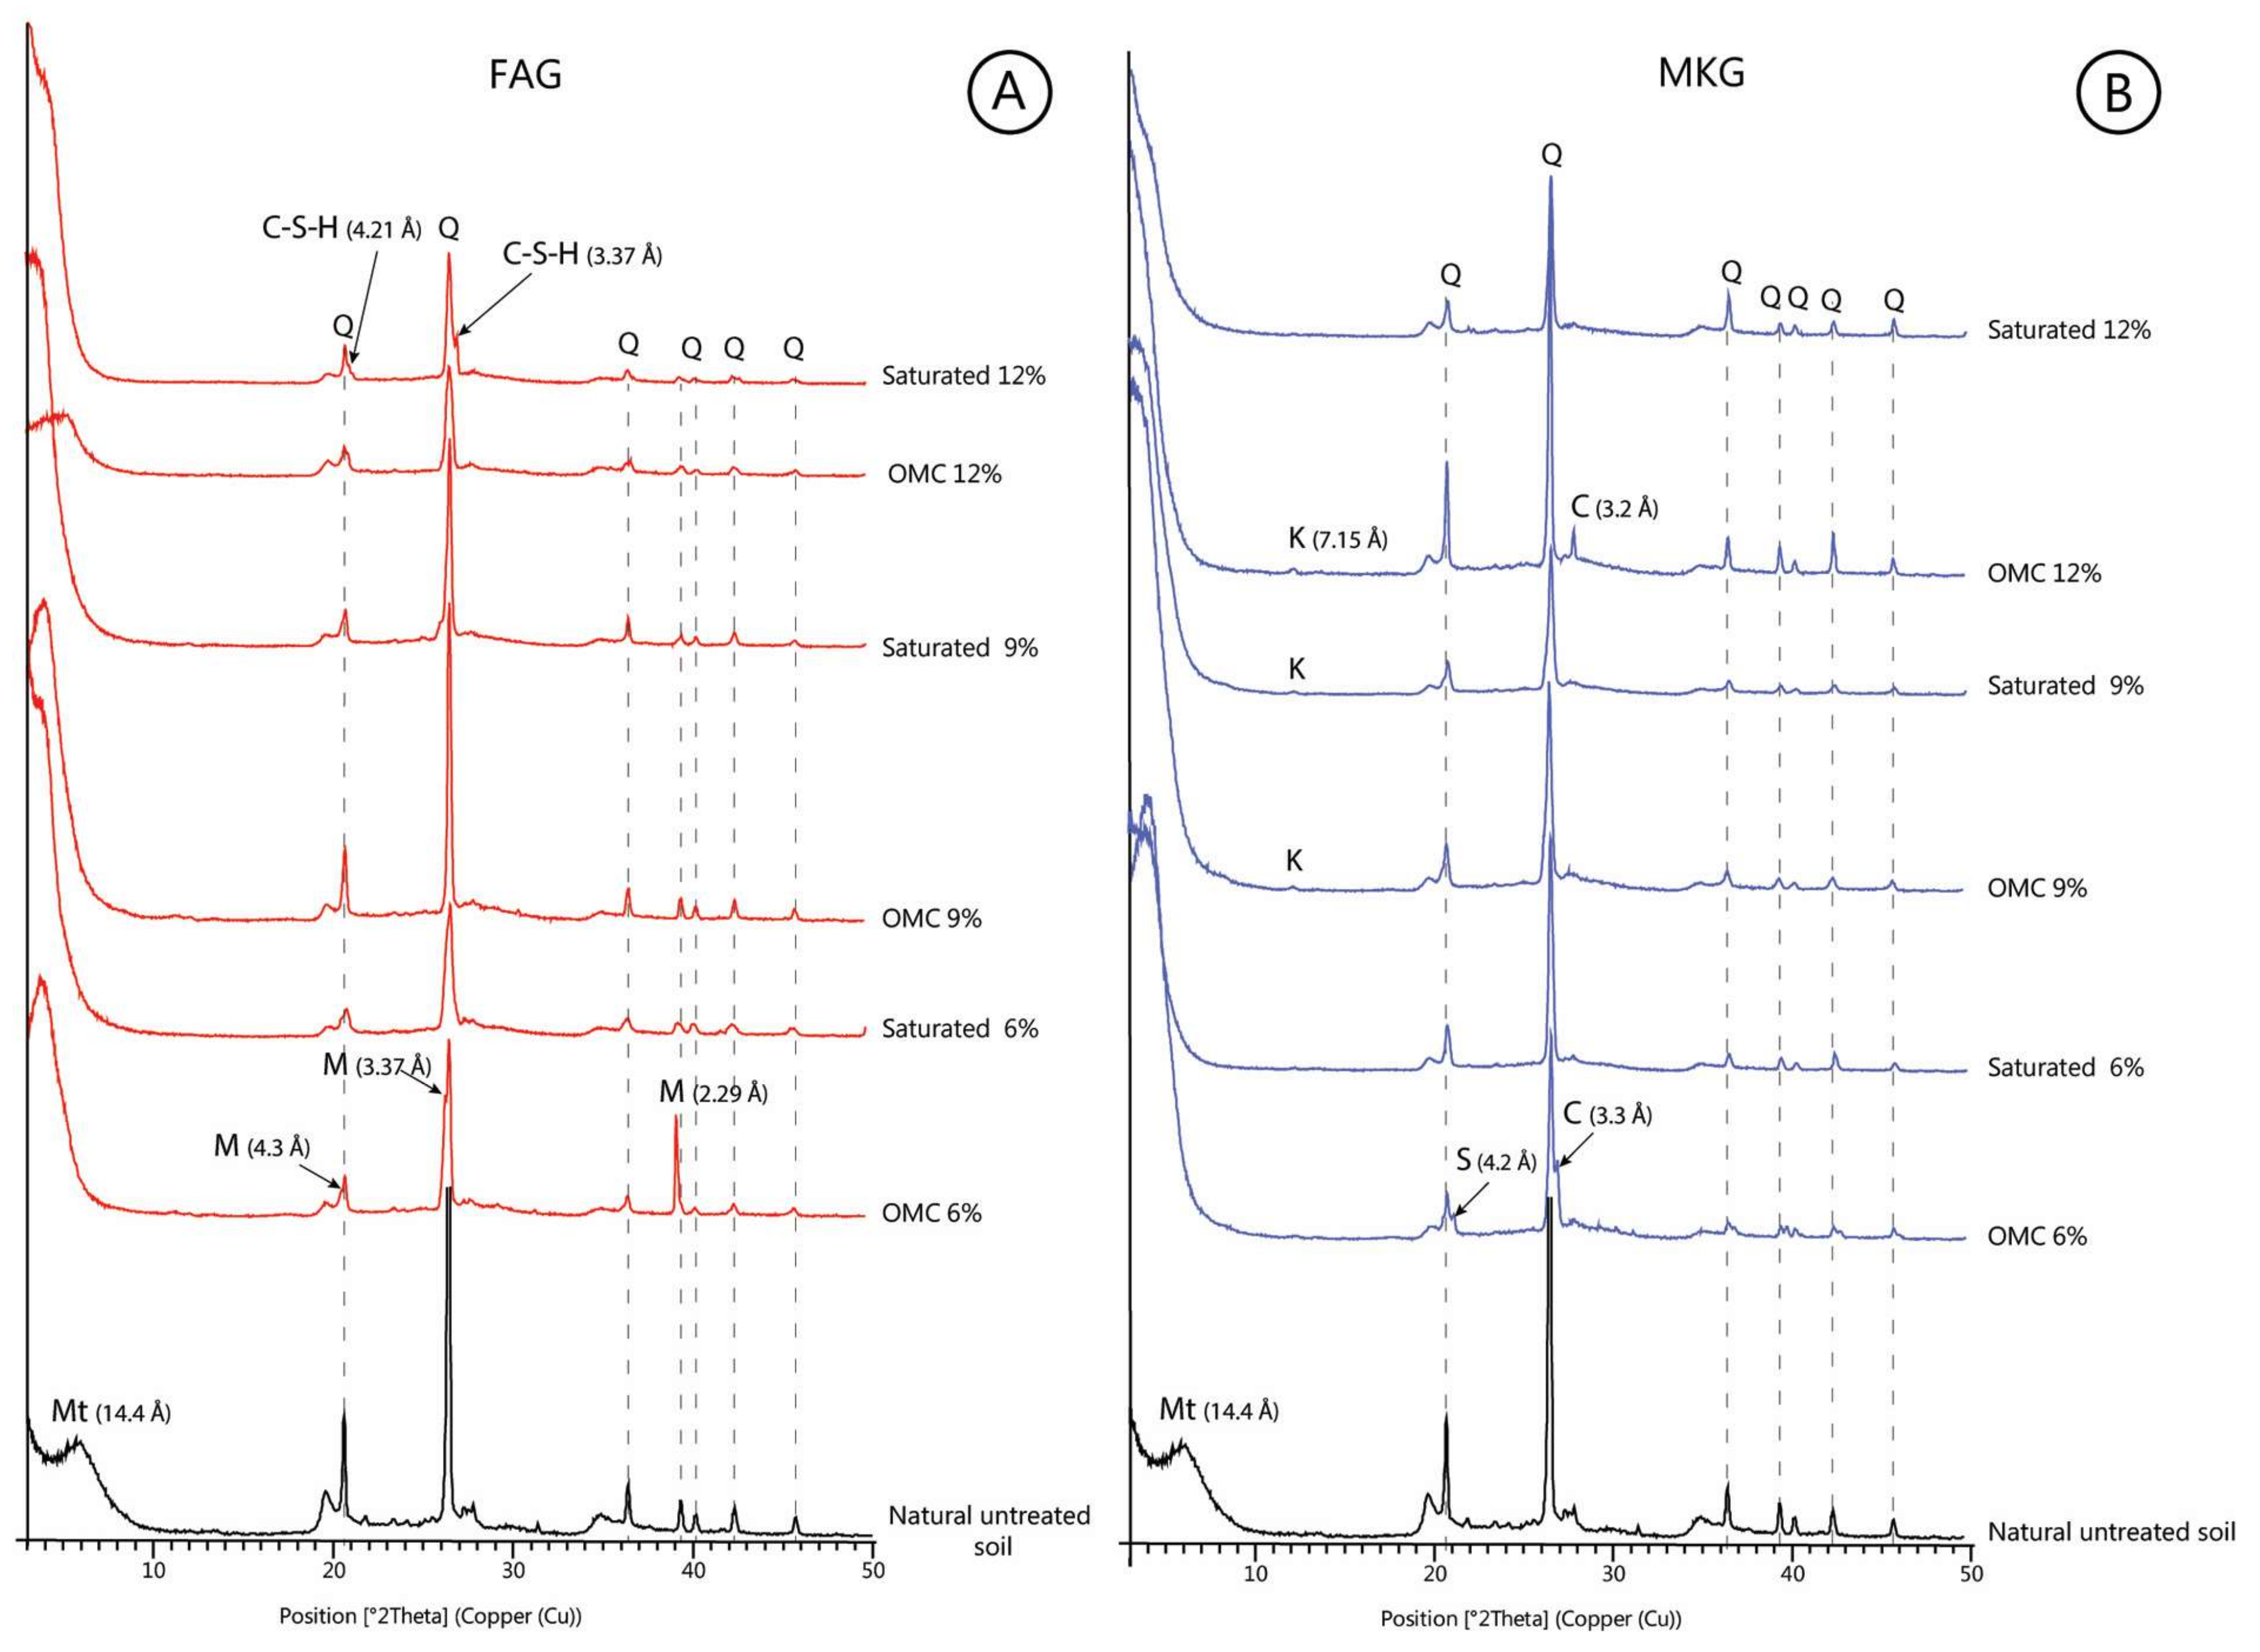
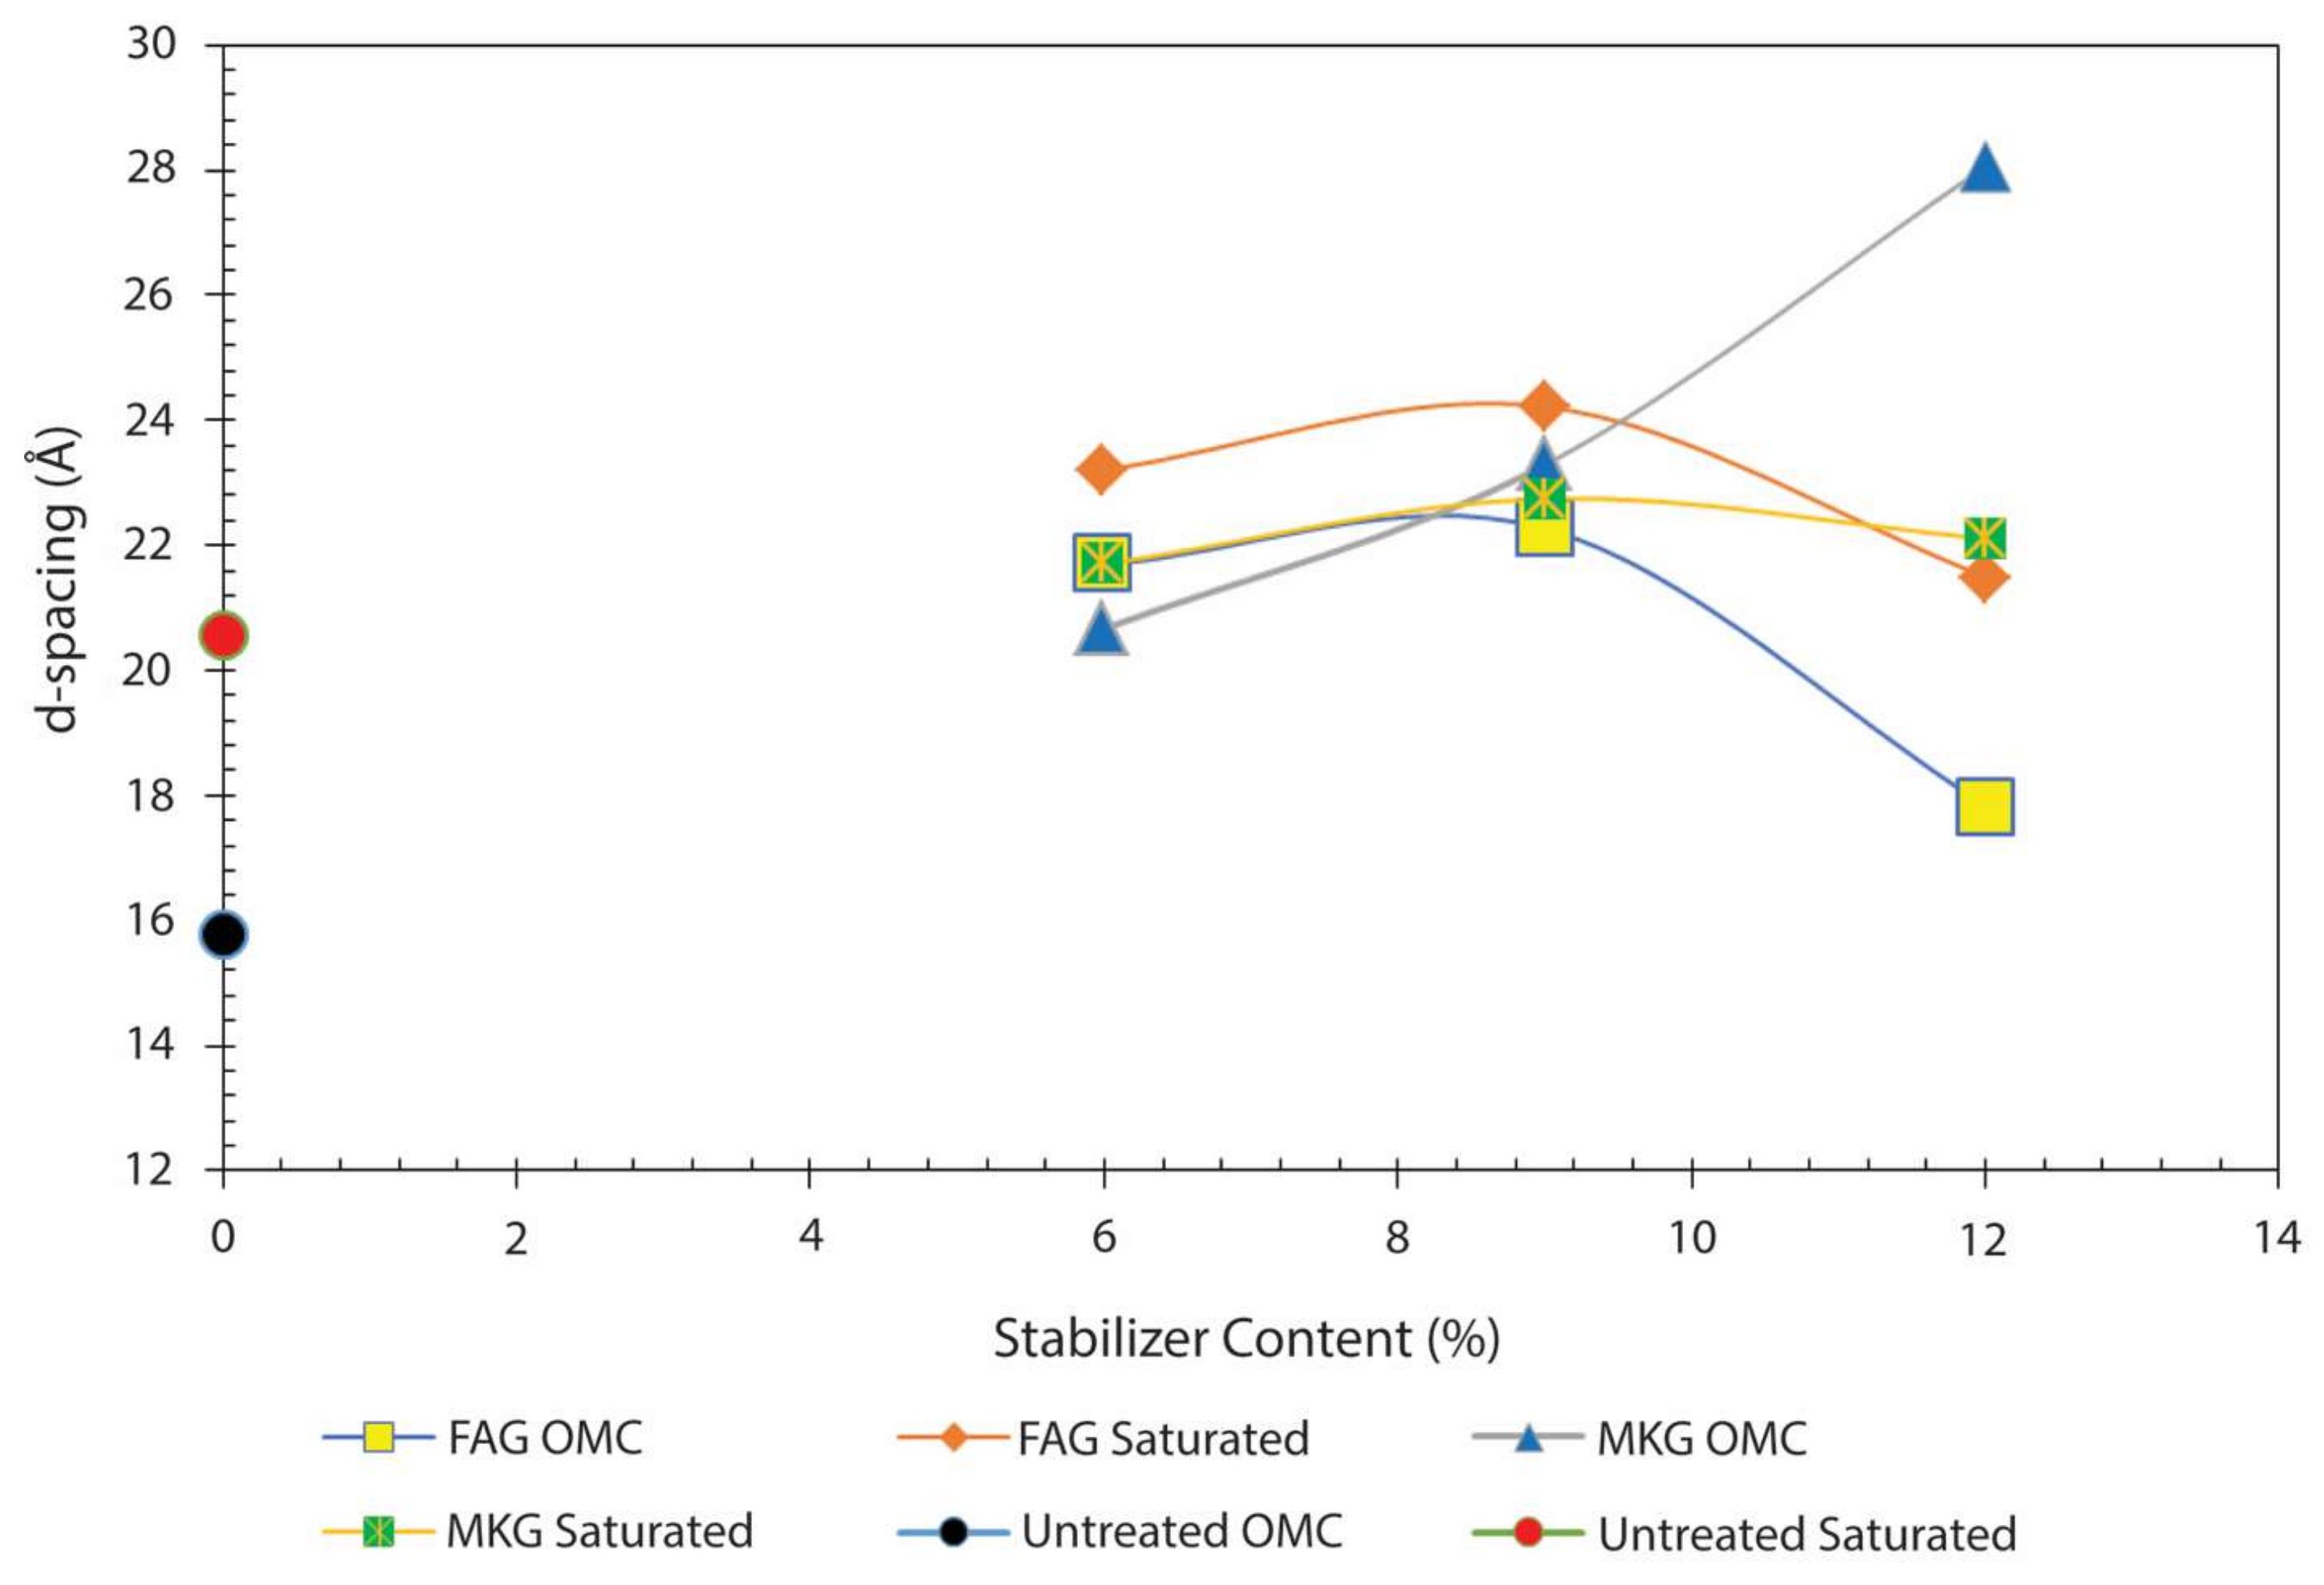
3.2. Mineralogy of Natural and Treated Soils

The X-ray powder diffraction measurements conducted on the natural soil sample before and after ethylene glycol (EG) treatment are shown in Figure 3. Natural soil was treated with EG to identify the type of clay minerals present in the soil sample. The peak shift, corresponding to a spacing increase from 14.32 Å to 17.59 Å upon adding EG to the natural soil, renders an indication of smectite clay behavior. Semi-quantification (RIR method) showed about 39.5% of montmorillonite and 50.3% of quartz, while the rest belonged to feldspar. The powdered FAC and MK were X-rayed to infer the mineralogy of the aluminosilicate source. The principal phases in FAC were quartz, lime, and mullite, while the MK consisted of quartz, kaolinite, and mica (Figure 4). Additionally, MK contained a significant amount of amorphous matter, which resulted from the high-temperature transformations of kaolinite.
The X-ray diffraction patterns of untreated soil compared to soils treated with MKG and FAG at OMC, as well as the saturation conditions, are shown in Figure 5. The fraction of original peaks gained intensity and newly formed peaks emerged in the soils treated with MKG and FAG. The position of main diffraction maxima documented in FAC and MK are provided in Table 4. The XRD patterns of stabilized soils showed a significant change in peak intensity of montmorillonite with regard to the natural soil samples. These reflexes were further enhanced in soils stabilized with FAG at saturation conditions compared to OMC, whereas soils stabilized with MKG showed an opposite trend. Higher montmorillonite reflexes from the soil treated with FAG at the saturation condition are associated with the lower dissolution rates of CaO in FAC, which leads to the reduced Ca2+ availability [32]. The prolonged curing time at hydrated conditions accelerated the dissolution of CaO, which in turn resulted in a higher content of Ca2+ in the montmorillonite interlayer space [33]. Calcium has a capability to bind more water in the interlayer region thus promoting a higher periodicity of neighboring layers, which contributes to the overall peak intensity. Conversely, MK has a lower CaO content and higher Al2O3 compared to FAC (Table 1). As a result, the dissolution of MK provided a small amount of Ca2+ and higher amount of Al to the soil solution. It follows that Ca2+ released from the MK solution was consumed entirely during the process of cationic exchange between the soil solution and montmorillonite exchangeable sites at OMC. The newly released alumina did not exercise any major impact on the diffraction pattern of montmorillonite in the soil treated with MKG, which is in line with the current experimental and modeling studies favoring the major impact of the nature and type of interlayer cations, as well as their hydration states, on XRD intensities of clay minerals [34,35].
XRD reflexes of quartz showed reduced intensities following the addition of MKG and FAG in OMC and saturation conditions compared to the natural soil (Figure 4 and Figure 5). The presence of cations such as Na+ and K+ at higher pH accelerates the dissolution of quartz and amorphous silica at ambient and hydrothermal temperatures [36]. Therefore, one may hypothesize that the change in pH, as a result of higher concentrations of Na+ released from the geopolymers, led to the reduction in the quartz amounts in the analyzed samples. Consequently, the lowest intensity of quartz was documented in the sample treated with 12% FAG while the sample treated with 12% MKG had the highest pH and Na+ content (Table 3). This finding is corroborated by Maraghechi et al. [37] suggesting a linear increase of silica dissolution with an increase of pH with a maximum reached at pH = 14. Newly emerged XRD peaks documented in the samples stabilized with 6% and 12% FAG, as well as 6%, 9%, and 12% MKG, may thus be associated with the dissolution of quartz and in turn higher silica availability.
In the soil stabilized with 6% FAG at OMC, an increase in the XRD peak intensity of mullite (Al6Si2O13) XRD was observed compared to the relative intensity of mullite in the original FAC geopolymer (Figure 4). The diffraction maxima of mullite were documented at 4.3 Å, 3.37 Å, and 2.29 Å. Following the addition of 9% and 12% FAG in OMC and saturated conditions, the mullite content apparently dropped below the XRD detection limit. Mullite is a phase composed of approximately 72% Al and 28% Si [38]. It is rarely found in nature and is known to be the only stable intermediate phase in the alumina–silica system at atmospheric pressure [38]. Mullite is an excellent structural material due to its high temperature stability, strength and creep resistance, low dielectric constant, and high electrical insulation capabilities. The FAC originally contained 20.04% of Al2O3 and, therefore, the higher mullite reflexes may be attributed to the availability of Al and Si in the soil solution that resulted from the dissolution of FAC in the highly alkaline environment. It is reasonable to hypothesize that an increase in mullite content could explain a low swelling of 3.8% following the soil stabilization with 6% FAG (Figure 1). The sample stabilized with 9% FAG did not show the presence of newly formed phases. Swelling of 6.4% was shown to be the highest among the samples stabilized with FAG. As the stabilizer content increased to 12% FAG at saturation conditions, the new diffraction maxima emerged at 4.21 Å and 3.37 Å (Figure 5). These reflexes were interpreted to stand for cementitious products such as C–S–H gel, which is usually formed as a result of the reaction between Ca2+ from FAC and dissolved SiO2 [32]. These two peaks are well defined and yet they have low intensities because CaO dissolves slowly in FAC at high alkaline conditions [32]. Another indication of slower dissolution rates of Ca2+ is the absence of Ca(OH)2 which would otherwise readily form at sufficient Ca2+ concentrations at given pH conditions. Similar findings were confirmed by Oh et al. [32] and Cristelo et al. [39]. The results presented herein suggest that the longer curing time (7 days OMC + 7 days saturation condition) provided enough time for the hydration product (C–S–H) to form (Figure 5). A similar observation was documented by Maraghechi et al. [37] reporting that for Ca and silica-saturated soils at high pH the dissolution of silica proceeded at lower rates due to the formation of a dense, low porosity, and strongly bonded C–S–H layer that prevented the diffusion of OH and alkali ions toward the quartz structure. Going back to the reported data, the percentage of silica was significantly higher than the content of alumina (Table 1). As the reaction evolves, the silica is being continuously dissolved in the matrix while the aluminum source diminishes, ultimately resulting in increased Si/Al ratios. Significant amounts of dissolved Al–Si complexes will diffuse from the solid surfaces and react with the Ca2+ available in the soil solution to form a C–S–H gel [39]. One may infer that the sample stabilized with 12% FAG had the lowest swelling percentage of 3% due to the formation of C–S–H that bonded the clay particles together and prevented them from swelling (Figure 1).
The X-ray diffraction pattern of soils stabilized with 6% MKG at OMC showed the formation of new minerals that may be correlated with the dissolution of quartz (i.e., lower intensities of quartz). As in the case of FAG, the reduction in the quartz content provides a source of silica for new minerals to form. The peak formed at 4.2 Å could correspond to sodalite (Na8Al6Si6O24Cl2), which is formed from the dissolved alumina and silica in the presence of sodium hydroxide. Another peak observed at 3.3 Å has a somewhat stronger intensity and may correspond to cancrinite (Na6Ca2Al6Si6O24(CO3)2). Both minerals belong to the group of feldspathoids, which present anhydrous tectosilicates highly resembling feldspars with a somewhat different structure and lower silicate content [40]. Swelling of the soil sample stabilized with 6% MKG could be thus attributed to dispersion of clay particles and new mineral formations (i.e., sodalite and cancrite) as reported by Chavali et al. [41] for kaolinite-rich soils. Namely, having prismatic to spherical crystal morphologies, occasionally even partially hydrated [42], these newly formed crystallites might have substantially added to the overall soil volume. Barely-detectable kaolinite (7.15 Å, Figure 5) was formed after the addition of 9% at OMC and at saturation conditions and 12% MKG at OMC and then disappeared again following full saturation. This is attributed to the recrystallization of kaolinite from metakaolin or, alternatively, some minor kaolinite not obliterated by thermal treatment might have remained [43,44]. A well-defined, newly formed XRD reflex of presumably cancrinite (Na6Ca2Al6Si6O24(CO3)2) was observed at 3.2 Å in the soil treated with 12% MKG at saturated conditions (Figure 5). The sample stabilized with 9% MKG did not exhibit formation of newly formed minerals that could induce swelling and yet this sample showed a higher swelling compared to the sample stabilized with 9% FAG. Such an increase in volume may be attributed to the dispersive behavior of the soil that resulted from saturation with Na+ and the formation of the high alkaline environment after the addition of 9% MKG (Table 3). Strong peak intensity of cancrinite in the soil treated with 12% MKG is explained by kaolinite recrystallization in a Na-rich environment. Chavali et al. [41] and Zhao et al. [45] reported on the transformation of kaolinite to sodalite and cancrinite as a result of the addition of NaOH. Similar results were observed by Lapides and Heller [46] who noticed that the so-called X and A zeolites present the main crystalline products formed from the reaction of metakaolin and colloidal silica with NaOH. Moreover, Gougazeh and Buhl [44] concluded that zeolite A may form from activated metakaolin from the natural Jordanian kaolinite following the treatment with various concentrations of NaOH at 100 °C for 20 h. Several researchers have concluded that a range of hydrous and anhydrous framework silicates may be formed through the interaction between kaolinitic clays and alkali solutions [47,48,49,50]. Thus, the high swelling (81.8%) observed in the soil sample stabilized with the 12% MKG might be associated with the crystallization of cancrinite (Figure 1). In brief, the swelling reported in the samples that were stabilized with different percentages of MKG must have been facilitated by the formation of newly formed tectosilicates and subsequent soil particle dispersion. The latter usually takes place in an environment saturated with Na+.
A summary of the changes in d100-spacing values of montmorillonite for untreated and MKG-and FAG-treated soils at 7 days OMC and saturation conditions is presented in Figure 6. The pristine soil had a basal spacing of 15.77 Å, which increased to 20.55 Å after the 7-day saturation. In the soil samples treated with 6%, 9%, and 12% FAG, the d-spacing values were 21.69 Å, 22.27 Å, and 17.84 Å, respectively. Furthermore, the d-spacing values of soil samples measured at saturated conditions and treated with 6%, 9%, and 12% FAG were 23.21 Å, 24.22 Å, and 21.50 Å, respectively. One may notice that the d-spacing generally increased in all samples after the soil was saturated for 7 days, which is due to the presence of an excessive amount of water in the clay mineral interlayer regions. The sample treated with 12% FAG showed the lowest d-spacing value explained by the high Ca content in the interlayer exchangeable sites of montmorillonite (Table 1) and the formation of cementitious C–S–H. The lowest swelling reported for the soil treated with 12% FAG is thus attributed to limited smectite swelling and C–S–H cementation that hindered the expansion of the soil particles. On the other hand, the soil samples treated with 6%, 9%, and 12% MKG at OMC were reported to have d-spacing values of 20.67 Å, 23.29 Å, and 28.06 Å, respectively. After the saturation for 7 days, these values were 21.70 Å, 22.75 Å, and 22.11 Å, respectively. It follows that montmorillonite d-spacing slightly increased for samples treated with 6% MKG, whereas it decreased in the case of samples treated with 9% and 12% MKG. This is explained by instantaneous smectite expansion once water becomes available. This line of reasoning is supported by the work of Aksu et al. [51] who reported an instantaneous montmorillonite volume change that increased 39% after the clays were placed in contact with water. Further, under OMC, Na+ substituted Ca2+ once the alkaline activators were added to the soil, which resulted in a negative charge increase, thus leading to a higher affinity of the clay particles toward water molecules. This, however, was not the case with the soil treated with 6% MKG because the amount of Na+ was insufficient to expel Ca2+ from the montmorillonite interlayer space.

4. Conclusions

The mineralogical and chemical behavior of high-plasticity soils obtained from the Atlanta District (GPS: 33.6086N, 94.715625W; vicinity of Spring Hill, TX, USA) upon the addition of different contents of FAG and MKG stabilizers were investigated by XRD and CEC measurements. Based on the study presented in this paper, the following conclusions were derived:
1-
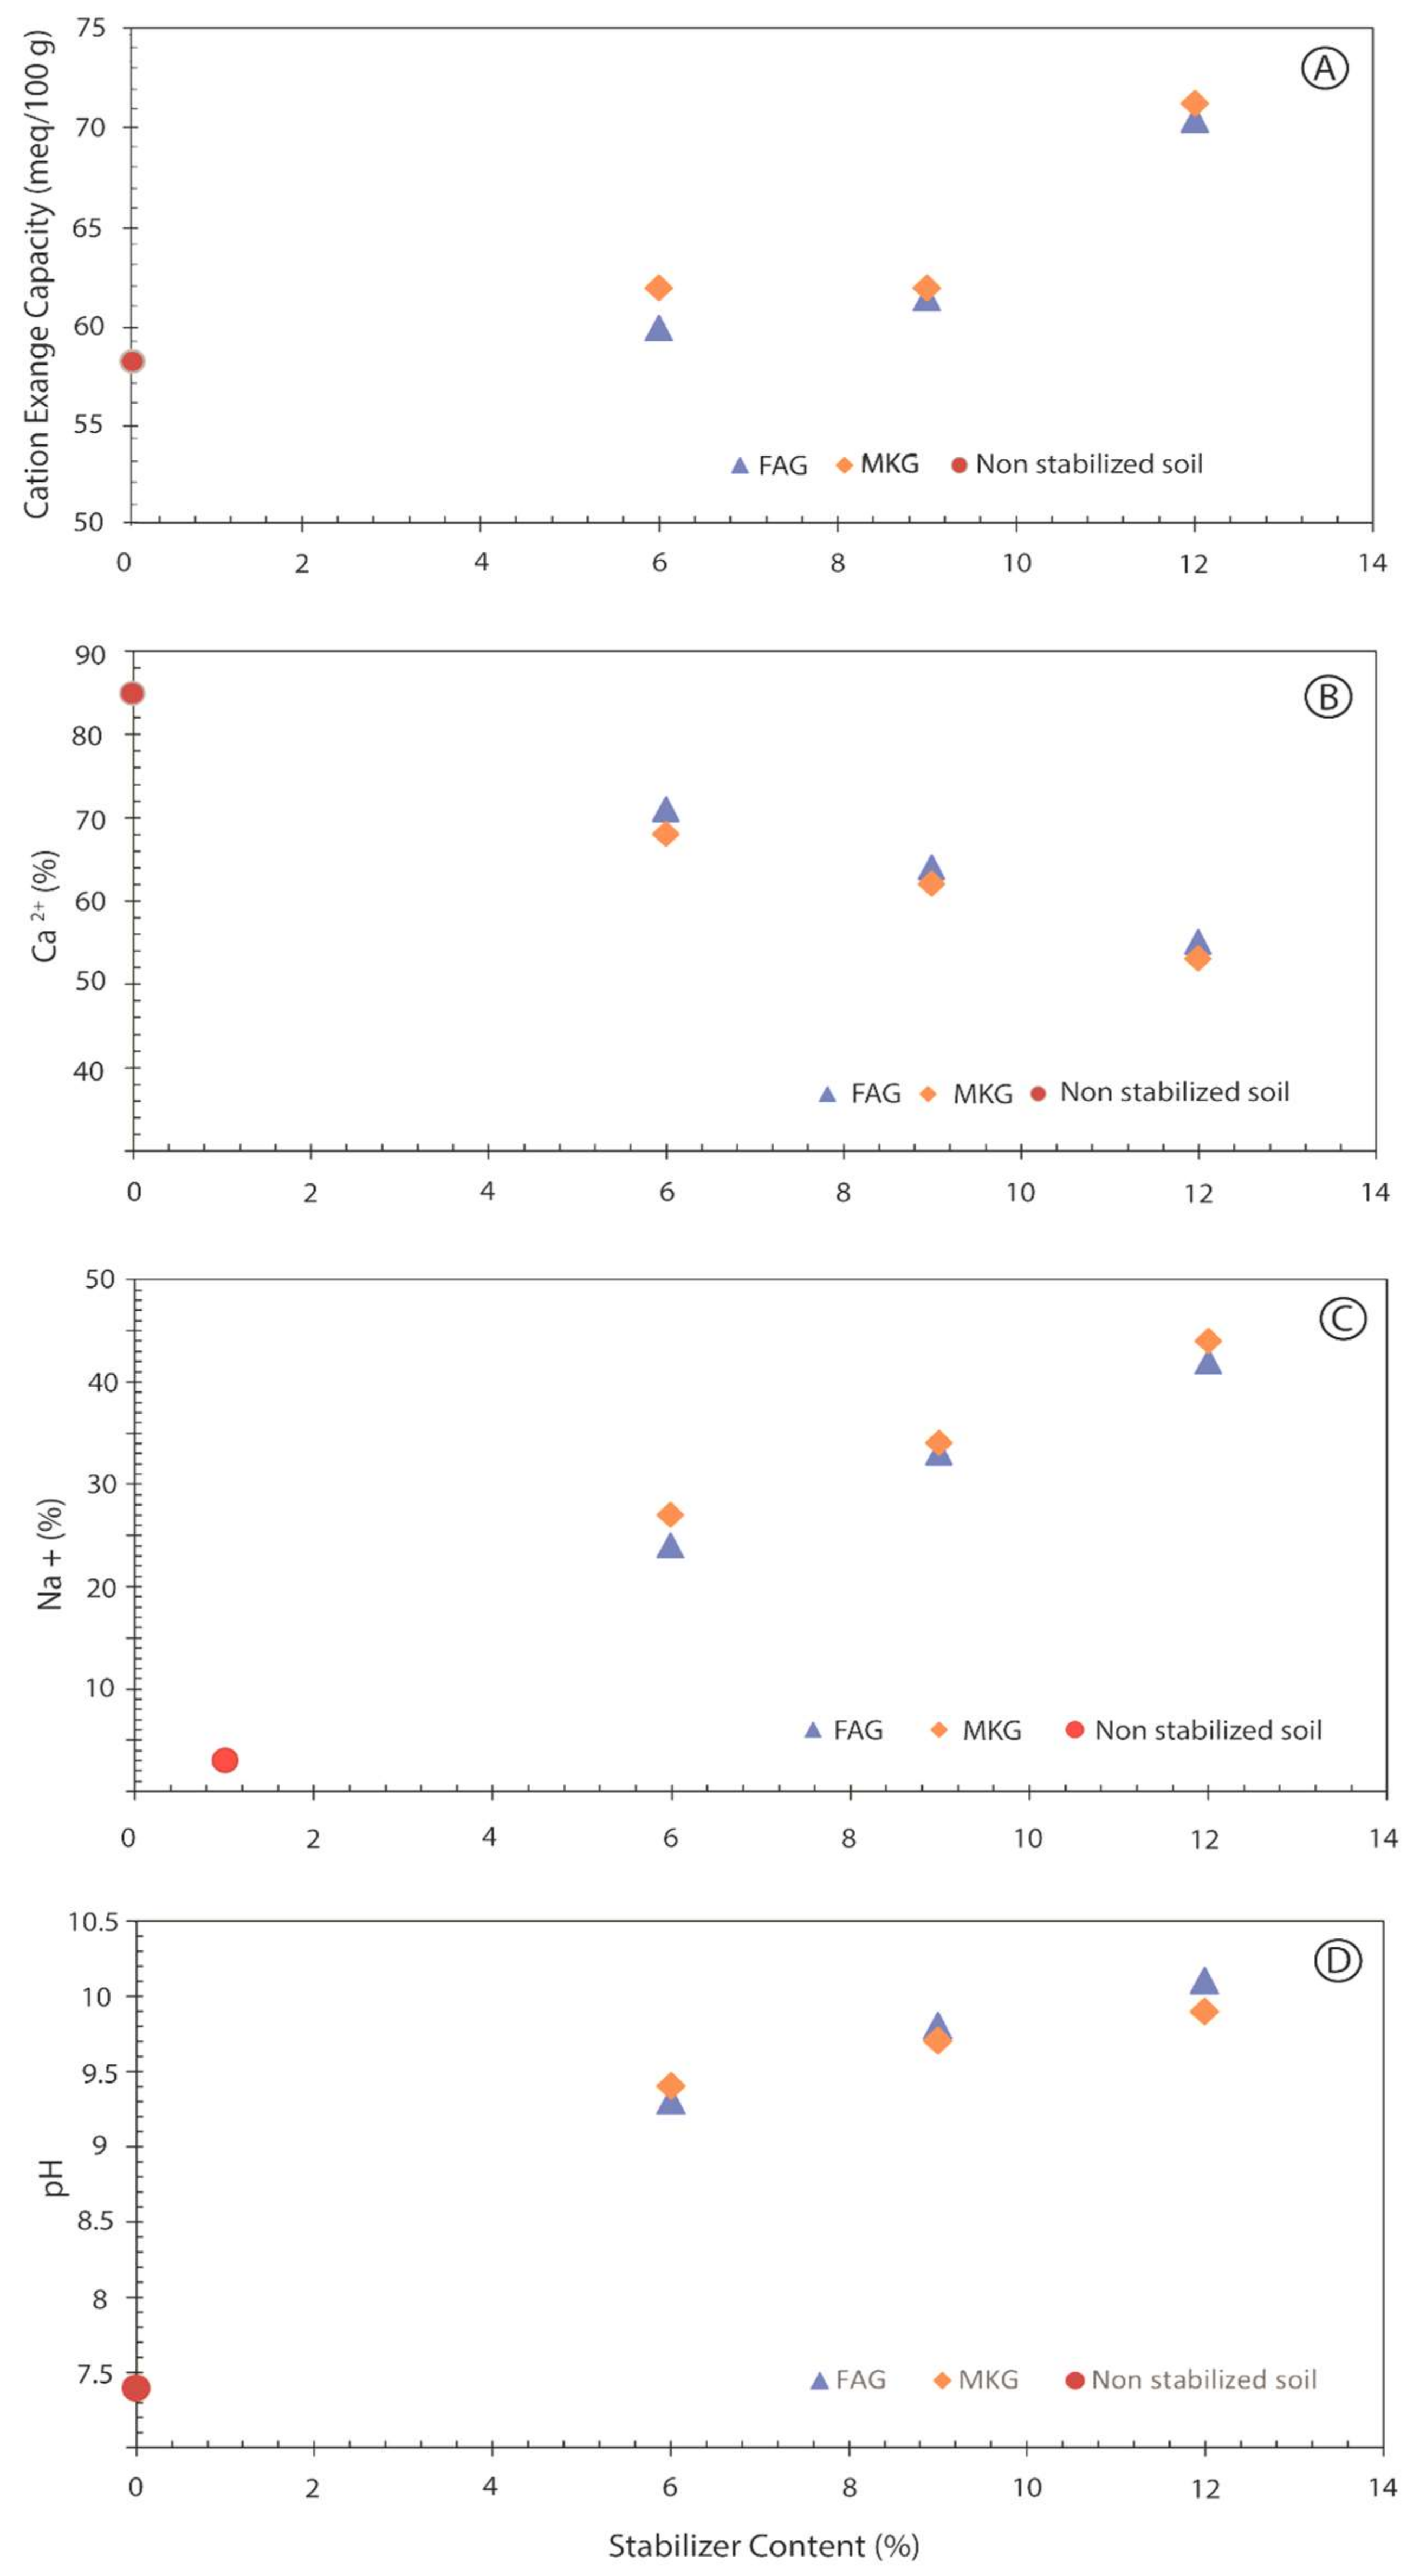
The pH values increased for all stabilized soils upon increasing the stabilizer content, which is attributed to the alkali content of the additives.
2-
Geopolymer-stabilized soils exhibited a significant reduction in Ca2+ content in the base saturation, which is correlated to increased Na+ availability as a result of stabilizer addition. Increased Na+ concentrations might have facilitated clay particle dispersion and swelling of stabilized soil.
3-
Soils stabilized with MKG showed slightly higher values of CEC, pH, Na+, and lower Ca2+ compared to the samples stabilized with FAG, thus contributing to higher swelling of the soil treated with MKG.
4-
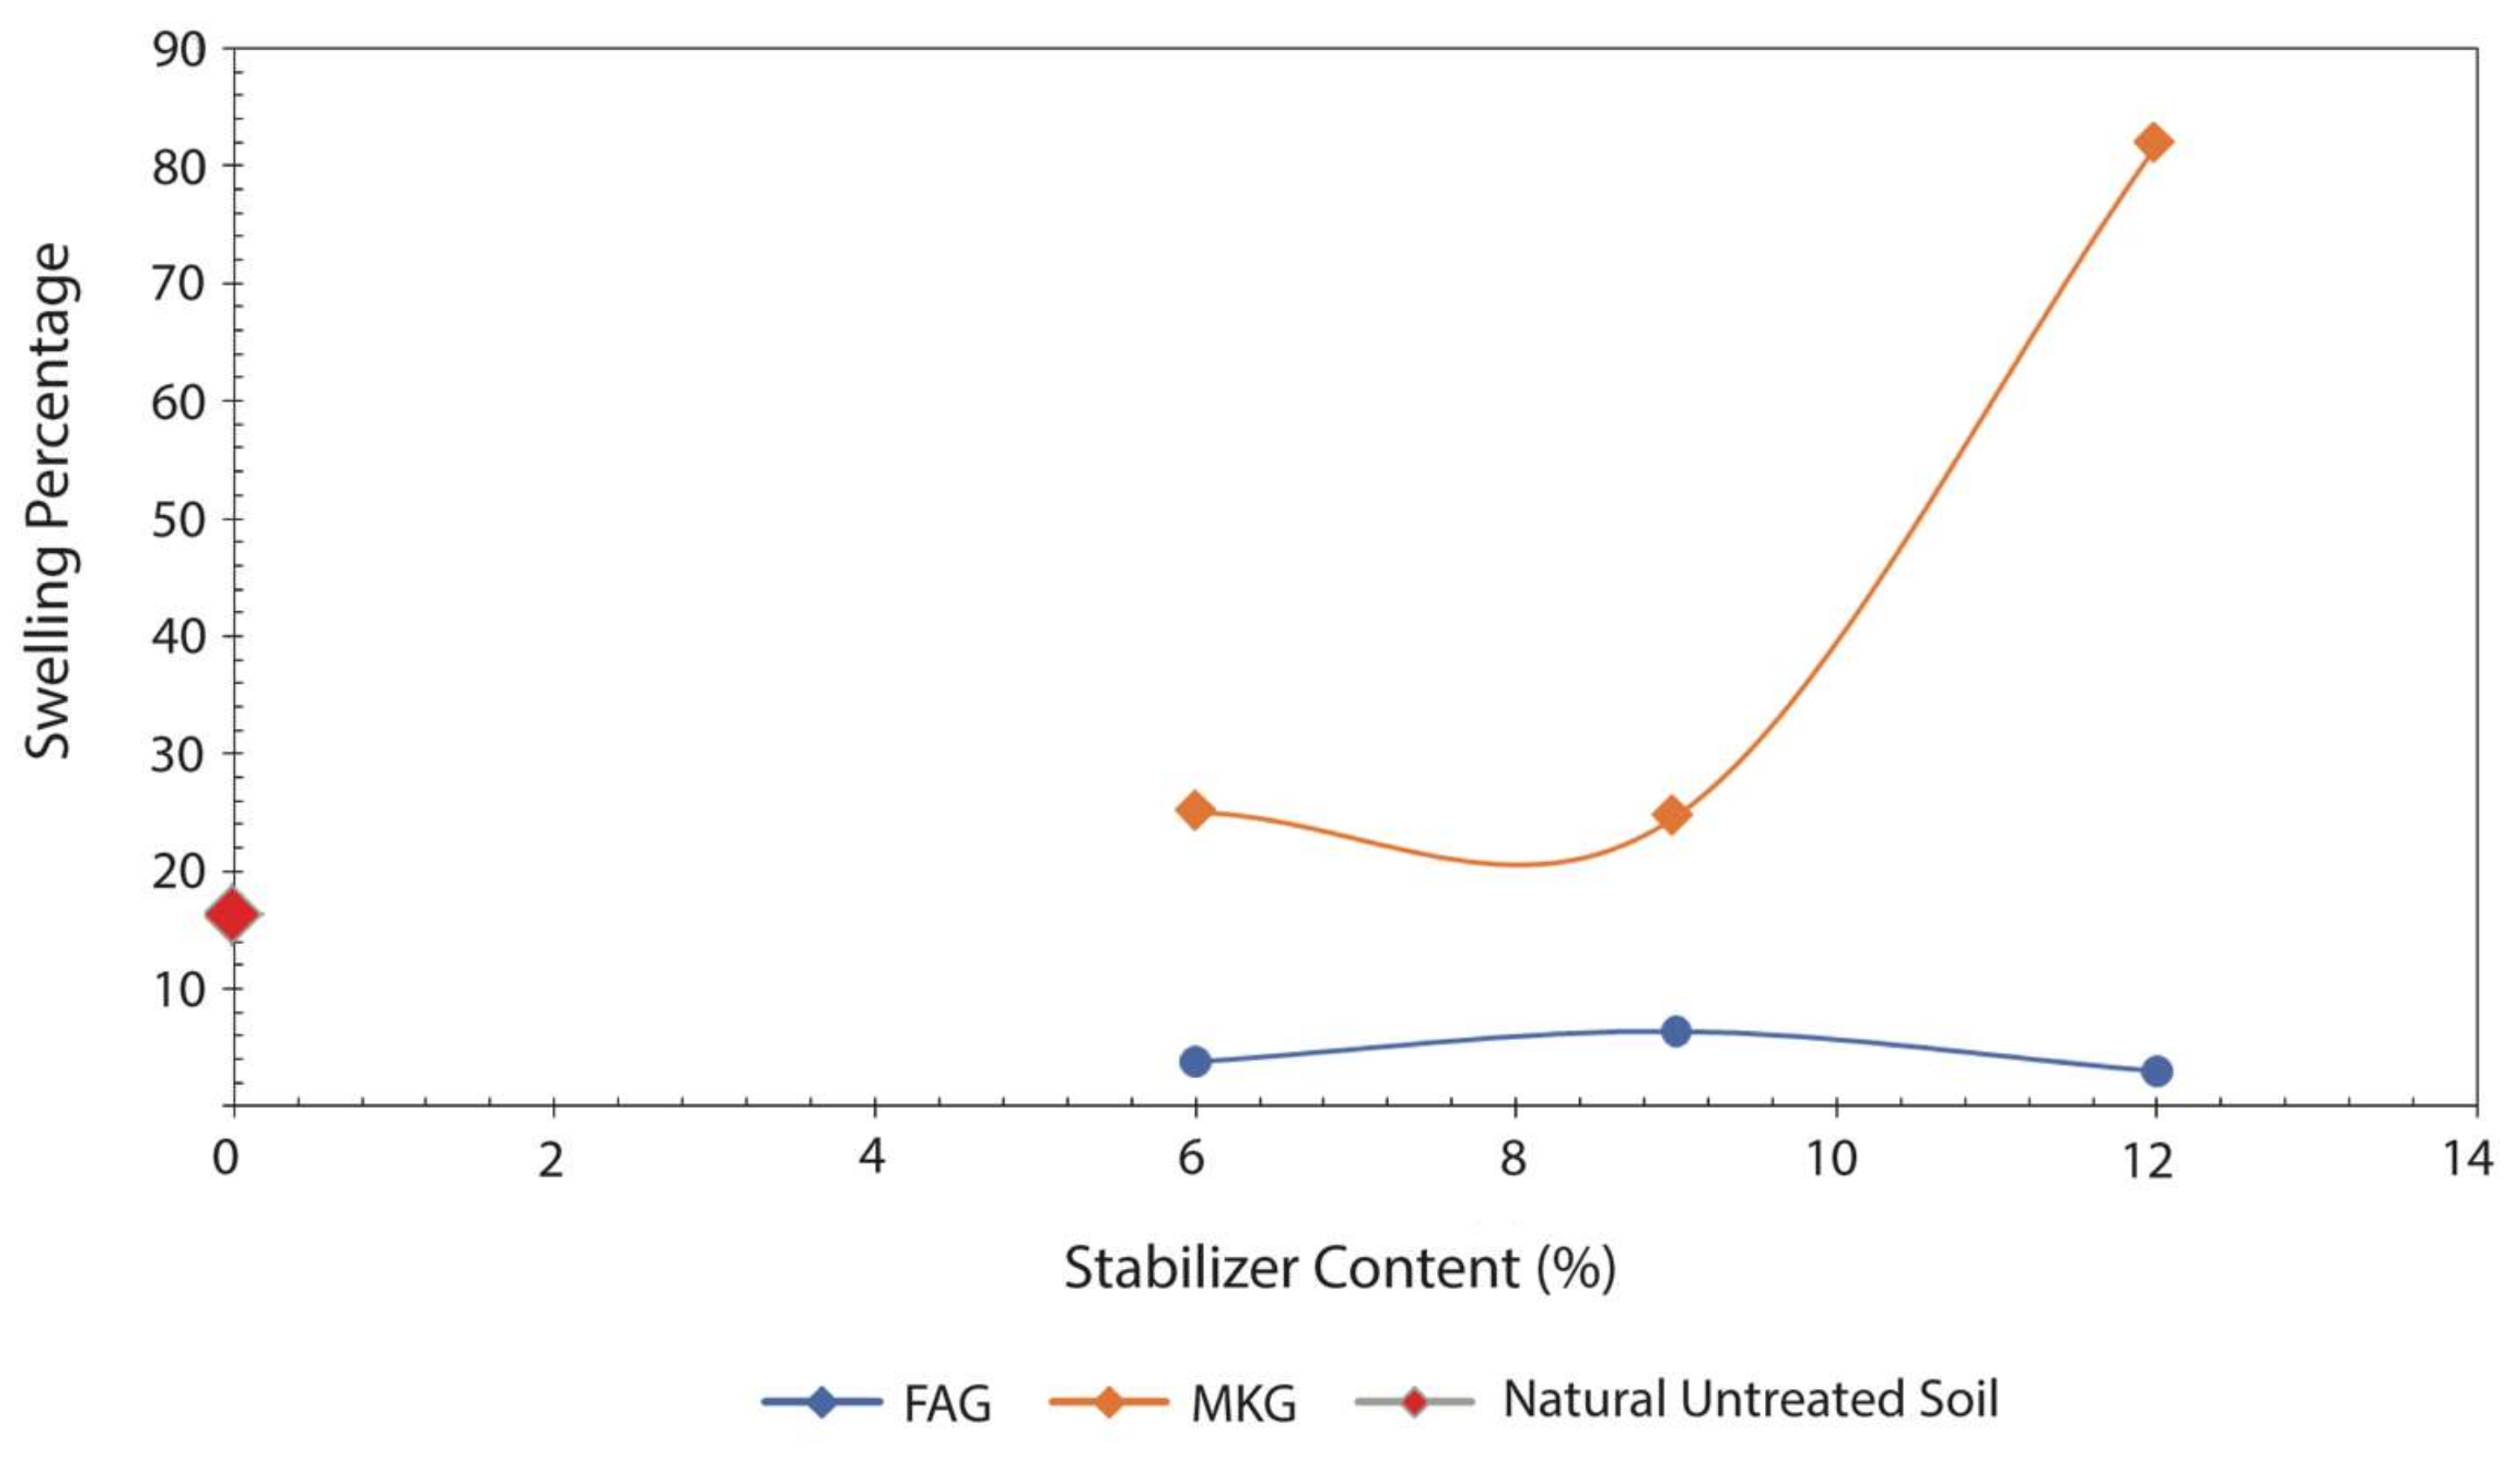
Soils stabilized with the 12% FAG exhibited the lowest degree of swelling due to the reduced expansion of the soil smectite and the formation of cementitious calcium silicate hydrate (C–S–H). The former is explained by an increase in the availability of Ca2+ accommodated at the exchangeable sites of montmorillonite. The newly formed C–S–H gel strengthened the soil structure by occupying the soil pore spaces and mechanically bound the clay particles, thus precluding any further swelling of the soil smectite.
5-
An abnormal swelling of soil samples stabilized with the 6% and 12% MKG is attributed to an instantaneous swelling of montmorillonite and subsequent formation of feldspathoids (sodalite and cancrinite) as suggested by the interpretation of the XRD patterns.
6-
The study proved that the CEC test in combination with XRD mineralogy could be used as a cost-effective and quick tool to explain the swelling behavior of soils stabilized with chemical additives such as MKG and FAG.
7-
Further analyses are needed, especially electron microbeam investigation, to corroborate the conclusions based on the XRD and basic geochemical inquiry.

Acknowledgments

The authors acknowledge financial support from the Texas Department of Transportation. We further extend our gratitude to Callum Hetherington (Geosciences Department, Texas Tech University) for his support and technical contribution. Texas Tech University’s support to publish in an open access journal is greatly appreciated (Open Access Initiative -FY2018, awarded to B.Š.). Finally, we thank Darko Tibljaš and anonymous reviewers for their helpful and detailed comments.

Author Contributions

M.A.M. preformed sample preparation, laboratory work, data analyses and manuscript writing under the supervision of G.Z. and B.Š. who were also heavily involved in all stages of preparing this paper. S.D.K. assisted with the soil sample acquisition and preparation. S.S. and P.W.J. conceived this research within the scope of a larger project of geopolymer application in the stabilization of the soils of Texas.

Conflicts of Interest

The authors declare no conflict of interest.

References

  1. Hamzah, H.N.; Al Bakri Abdullah, M.M.; Cheng Yong, H.; Arif Zainol, M.R.R.; Hussin, K. Review of Soil Stabilization Techniques: Geopolymerization Method one of the New Technique. Key Eng. Mater. 2015, 660, 298–304. [Google Scholar] [CrossRef]
  2. Giannopoulou, I.; Dimas, D.; Maragos, I.; Panias, D. Utilization of solid by-products for the development of inorganic polymeric construction materials. Glob. Nest J. 2009, 11, 127–136. [Google Scholar]
  3. Zhang, Y.; Zhang, W.; Sun, W.; Li, Z.; Liu, Z. Preparation of metakaolin based geopolymer and its three-dimensional pore structural characterization. J. Wuhan Univ. Technol. Mater. Sci. Ed. 2015, 30, 550–555. [Google Scholar] [CrossRef]
  4. Abdullah, M.M.A.B.; Hussin, K.; Bnhussain, M.; Ismail, K.N.; Yahya, Z.; Abdul Razak, R. Fly Ash-based Geopolymer Lightweight Concrete Using Foaming Agent. Int. J. Mol. Sci. 2012, 13, 7186–7198. [Google Scholar] [CrossRef] [PubMed]
  5. Shaikh, F.U.A.; Vimonsatit, V. Compressive strength of fly-ash-based geopolymer concrete at elevated temperatures. Fire Mater. 2015, 39, 174–188. [Google Scholar] [CrossRef]
  6. Hajimohammadi, A.; Ngo, T.; Mendis, P.; Nguyen, T.; Kashani, A.; van Deventer, J.S.J. Pore characteristics in one-part mix geopolymers foamed by H2O2: The impact of mix design. Mater. Des. 2017, 130, 381–391. [Google Scholar] [CrossRef]
  7. Duxson, P.; Provis, J.L.; Lukey, G.C.; van Deventer, J.S.J. The role of inorganic polymer technology in the development of ‘green concrete’. Cem. Concr. Res. 2007, 37, 1590–1597. [Google Scholar] [CrossRef]
  8. Hajimohammadi, A.; van Deventer, J.S.J. Solid Reactant-Based Geopolymers from Rice Hull Ash and Sodium Aluminate. Waste Biomass Valor 2017, 8, 2131–2140. [Google Scholar] [CrossRef]
  9. Zhang, M.; Guo, H.; El-Korchi, T.; Zhang, G.; Tao, M. Experimental feasibility study of geopolymer as the next-generation soil stabilizer. Constr. Build. Mater. 2013, 47, 1468–1478. [Google Scholar] [CrossRef]
  10. Sindhunata; van Deventer, J.S.J.; Lukey, G.C.; Xu, H. Effect of Curing Temperature and Silicate Concentration on Fly-Ash-Based Geopolymerization. Ind. Eng. Chem. Res. 2006, 45, 3559–3568. [Google Scholar] [CrossRef]
  11. Davidovits, J. Geopolymers: Inorganic polymeric new materials. J. Therm. Anal. 1991, 37, 1633–1656. [Google Scholar] [CrossRef]
  12. Rangan, B.V. Geopolymer concrete for environmental protection. Indian Concr. J. 2014, 88, 41–59. [Google Scholar]
  13. Barbosa, V.; Mackenzie, K.; Thaumaturgo, C. Synthesis and Characterisation of Materials Based on Inorganic Polymers of Alumina and Silica: Sodium Polysialate Polymers. Int. J. Inorg. Mater. 2000, 2, 309–317. [Google Scholar] [CrossRef]
  14. Davidovits, J. Geopolymer Chemistry and Properties. In Proceedings of the 1st International Conference on Geopolymer ’88, Compiegne, France, 1–3 June 1988; Volume 1, pp. 25–48. [Google Scholar]
  15. Rios, S.; Ramos, C.; da Fonseca, A.V.; Cruz, N.; Rodrigues, C. Colombian Soil Stabilized with Geopolymers for Low Cost Roads. Procedia Eng. 2016, 143, 1392–1400. [Google Scholar] [CrossRef]
  16. Locat, J.; Bérubé, M.-A.; Choquette, M. Laboratory investigations on the lime stabilization of sensitive clays: Shear strength development. Can. Geotech. J. 1990, 27, 294–304. [Google Scholar] [CrossRef]
  17. Yeskis, D.; van Groos, A.F.K.; Guggenheim, S. The dehydroxylation of kaolinite. Am. Mineral. 1985, 70, 159–164. [Google Scholar]
  18. Alehyen, S.; Achouri, M.E.L.; Taibi, M. Characterization, microstructure and properties of fly ash-based geopolymer. J. Mater. Environ. Sci. 2017, 8, 1783–1796. Available online: http://www.jmaterenvironsci.com/Document/vol8/vol8_N5/190-JMES-2930-Alehyen.pdf (accessed on 20 February 2018).
  19. Millot, G. Geology of Clays: Weathering Sedimentology Geochemistry; Springer Science & Business Media: Berlin, Germany, 2013; ISBN 978-3-662-41609-9. [Google Scholar]
  20. Khadka, S.D.; Jayawickrama, P.W.; Senadheera, S. Shrink/Swell Behavior of High Plastic Clay Treated with Geopolymer. Transp. Res. Rec. J. Transp. Res. Board 2018. accepted for publication. [Google Scholar]
  21. American Society for Testing and Material (ASTM International). Standard Test Methods for Liquid Limit, Plastic Limit, and Plasticity Index of Soils; D4318-00; ASTM International: West Conshohocken, PA, USA, 2010. [Google Scholar]
  22. American Society for Testing and Material (ASTM International). Classification of Soils for Engineering Purposes: Annual Book of ASTM Standards; D 2487-83, 04.08; ASTM International: West Conshohocken, PA, USA, 1985; pp. 395–408. [Google Scholar]
  23. Haby, V.A.; Russelle, M.P.; Skoley, E.O. Testing Soils for Potassium, Calcium, and Magnesium. In Soil Testing and Plant Analysis, 3rd ed.; Westerman, R.L., Ed.; Soil Science Society of America: Madison, WI, USA, 1990; pp. 181–227. [Google Scholar]
  24. Warncke, D.; Brown, J.R. Potassium and Other Basic Cations. In Recommended Chemical Soil Test Procedures for the North Central Region; North Central Regional Publication No. 221 (revised); Brown, J.R., Ed.; University of Missouri Agricultural Experiment Station: Columbia, MO, USA, 1998; pp. 31–33. [Google Scholar]
  25. Mc Lean, E.O. Soil pH and Lime Requirement. In Methods of Soil Analysis, Chemical and Microbiological Properties-Agronomy Monograph, 2nd ed.; Page, A.L., Ed.; Soil Science Society of America: Madison, WI, USA, 1982; pp. 199–223, no. 9; Part 2. [Google Scholar]
  26. Rhoades, J.D. Soluble Salts. In Methods of Soil Analysis, Chemical and Microbiological Properties-Agronomy Monograph, 2nd ed.; Page, A.L., Ed.; Soil Science Society of America: Madison, WI, USA, 1982; pp. 167–179, no. 9; Part 2. [Google Scholar]
  27. Whitney, D.A. Soil Salinity. In Recommended Chemical Soil Test Procedures for the North Central Region; North Central Regional Publication No. 221 (revised); Brown, J.R., Ed.; University of Missouri Agricultural Experiment Station: Columbia, MO, USA, 1998; pp. 59–60. [Google Scholar]
  28. Watson, M.E.; Brown, J.R. pH and Lime Requirement. In Recommended Chemical Soil Test Procedures for the North Central Region; North Central Regional Publication No. 221 (revised); Brown, J.R., Ed.; University of Missouri Agricultural Experiment Station: Columbia, MO, USA, 1998; pp. 13–16. [Google Scholar]
  29. Joint Committee on Powder Diffraction Standards (JCPDS). Mineral Powder Diffraction File; International Center for Diffraction Data: Newtown Square, PA, USA, 1996. [Google Scholar]
  30. Zanoni, G.; Šegvić, B.; Moscariello, A. Clay mineral diagenesis in Cretaceous clastic reservoirs from West African passive margins (the South Gabon Basin) and its impact on regional geology and basin evolution history. Appl. Clay Sci. 2016, 134, 186–209. [Google Scholar] [CrossRef]
  31. Al-Rawas, A.A.; Taha, R.; Nelson, J.D.; Al-Shab, B.T.; Al-Siyabi, H. A comparative evaluation of various additives used in the stabilization of expansive soils. Geotech. Test. J. 2002, 25, 199–209. [Google Scholar]
  32. Oh, J.E.; Monteiro, P.J.M.; Jun, S.S.; Choi, S.; Clark, S.M. The evolution of strength and crystalline phases for alkali-activated ground blast furnace slag and fly ash-based geopolymers. Cem. Concr. Res. 2010, 40, 189–196. [Google Scholar] [CrossRef]
  33. Moore, D.M.; Reynolds, R.C. X-Ray Diffraction and the Identification and Analysis of Clay Minerals, 2nd ed.; Oxford University Press: Oxford, UK, 1997; ISBN 0195087135. [Google Scholar]
  34. Viani, A.; Gualtieri, A.F.; Artioli, G. The nature of disorder in montmorillonite by simulation of X-ray powder patterns. Am. Mineral. 2002, 87, 966–975. [Google Scholar] [CrossRef]
  35. Seppälä, A.; Puhakka, E.; Olin, M. Effect of layer charge on the crystalline swelling of Na+, K+ and Ca2+ montmorillonites: DFT and molecular dynamics studies. Clay Miner. 2016, 51, 197–211. [Google Scholar] [CrossRef]
  36. Knauss, K.G.; Wolery, T.J. The dissolution kinetics of quartz as a function of pH and time at 70 °C. Geochim. Cosmochim. Acta 1988, 52, 43–53. [Google Scholar] [CrossRef]
  37. Maraghechi, H.; Rajabipour, F.; Pantano, C.G.; Burgos, W.D. Effect of calcium on dissolution and precipitation reactions of amorphous silica at high alkalinity. Cem. Concr. Res. 2016, 87, 1–13. [Google Scholar] [CrossRef]
  38. Hwang, J.-Y.; Huang, X.; Hein, A.M. Synthesizing mullite from beneficiated fly ash. JOM 1994, 46, 36–39. [Google Scholar] [CrossRef]
  39. Cristelo, N.; Glendinning, S.; Fernandes, L.; Pinto, A.T. Effect of calcium content on soil stabilisation with alkaline activation. Constr. Build. Mater. 2012, 29, 167–174. [Google Scholar] [CrossRef]
  40. Deer, W.A.; Howie, R.A.; Zussman, J. Rock-Forming Minerals, Volume 4A: Framework Silicates: Feldspars, 2nd ed.; The Geological Society: London, UK, 2001. [Google Scholar]
  41. Chavali, R.V.P.; Vindula, S.K.; Ponnapureddy, H.P.R.; Babu, A.; Pillai, R.J. Swelling behavior of kaolinitic clays contaminated with alkali solutions: A micro-level study. Appl. Clay Sci. 2017, 135, 575–582. [Google Scholar] [CrossRef]
  42. Bender Koch, C. Non-Crystalline Hydrous Feldspathoids in Late Permian Carbonate Rock. Clay Minerals 1991, 26, 527–534. [Google Scholar] [CrossRef]
  43. Weitkamp, J.; Puppe, L. Catalysis and Zeolites: Fundamentals and Applications; Springer: Berlin/Heidelberg, Germany, 2010; ISBN 978-3-642-08347-1. [Google Scholar]
  44. Gougazeh, M.; Buhl, J.-C. Synthesis and characterization of zeolite A by hydrothermal transformation of natural Jordanian kaolin. J. Assoc. Arab. Univ. Basic Appl. Sci. 2014, 15, 35–42. [Google Scholar] [CrossRef] [Green Version]
  45. Zhao, H.; Deng, Y.; Harsh, J.; Flury, M.; Boyle, J. Alteration of Kaolinite to Cancrinite and Sodalite by Simulated Hanford Tank Waste and Its Impact on Cesium Retention. Clays Clay Miner. 2004, 52. [Google Scholar] [CrossRef]
  46. Lapides, I.; Heller-Kallai, L. Reactions of metakaolinite with NaOH and colloidal silica—Comparison of different samples (part 2). Appl. Clay Sci. 2007, 35, 94–98. [Google Scholar] [CrossRef]
  47. Madani, A.; Aznar, A.; Sanz, J.; Serratosa, J.M. 29Si and 27Al NMR study of zeolite formation from alkali-leached kaolinites. Influence of thermal preactivation. J. Phys. Chem. 1990, 94, 760–765. [Google Scholar] [CrossRef]
  48. Gualtieri, A.; Norby, P.; Artioli, G.; Hanson, J. Kinetics of formation of zeolite Na-A [LTA] from natural kaolinites. Phys. Chem. Min. 1997, 24, 191–199. [Google Scholar] [CrossRef]
  49. Demortier, A.; Gobeltz, N.; Lelieur, J.P.; Duhayon, C. Infrared evidence for the formation of an intermediate compound during the synthesis of zeolite Na–A from metakaolin. Int. J. Inorg. Mater. 1999, 1, 129–134. [Google Scholar] [CrossRef]
  50. Sivapullaiah, P. Induced swelling of kaolinitic soil in alkali solution. Soils Found. Tokyo 2007, 47, 59–66. [Google Scholar] [CrossRef]
  51. Aksu, I.; Bazilevskaya, E.; Karpyn, Z.T. Swelling of clay minerals in unconsolidated porous media and its impact on permeability. Geo. Res. J. 2015, 7, 1–13. [Google Scholar] [CrossRef]
Figure 1. The soil expansion test results of untreated soil in comparison to the soils stabilized with different contents of the FAG and MKG stabilizer. Data after Khadka et al. [20].
Minerals 08 00146 g001
Figure 2. Cation exchange capacity test results: (a) Cation exchange capacity versus different stabilizer content, (b) Change in Ca2+ percentage with different stabilizer content, (c) Change in Na+ percentage with different stabilizer content, and (d) Change in pH with different stabilizer content.
Minerals 08 00146 g002
Figure 3. Ethylene glycol (EG)-treated and air-dried (AD) experimental spectra. Numbers indicate the montmorillonite d001 spacing in Å.
Minerals 08 00146 g003
Figure 4. The X-ray diffraction (XRD) patterns of aluminosilicate source, class C fly ash (FAC), and metakaolin (MK). Mineral abbreviations: M: mullite; K: kaolinite; Q: quartz; L: lime (CaO).
Minerals 08 00146 g004
Figure 5. The XRD patterns of samples stabilized with different percentages of FAC and MKG at OMC and saturation conditions compared with the natural untreated sample (a) FAC-stabilized samples and (b) MKG-stabilized samples. Mineral abbreviations: M: mullite, Mt: montmorillonite; Q: quartz; C–S–H: (Ca6Si3O12·xH2O); C: cancrinite; S: sodalite; K: kaolinite.
Minerals 08 00146 g005
Figure 6. Change in the d-spacing (Å) for montmorillonite after the addition of different percentages of stabilizer (MKG and FAC) compared with untreated samples under optimum moisture content (OMC) and saturated conditions.
Minerals 08 00146 g006
Table 1. Chemical composition of metakaolin, class C fly ash, and Atlanta clay. All values are in wt %.
Material TypeSiO2Al2O3Fe2O3CaOMgONa2OK2OSO4
Metakaolin52.0043.00<2.20<0.20<0.10<0.05<0.40<0.05
Class C fly ash41.9620.045.7621.094.301.440.730.99
Atlanta clay64.2816.399.033.921.78-1.72-
Table 2. Geopolymer mixtures based on 300 g of soil sample. All values are in grams unless indicated otherwise.
Geopolymer Typeg/s (%)Aluminosilicate SourceAlkaline ActivatorsCuring Temp (°C)
MKFACNaOHNa2SiO3H2O
FAG606.62.518.240.66Ambient conditions
FAG909.893.7612.360.99
FAG12013.195.0116.481.32
MKG66.602.518.240.66
MKG99.8903.7612.360.99
MKG1213.1905.0116.481.32
Abbreviations: FAG: fly ash geopolymer; MKG: metakaolin geopolymer; g/s: geopolymer solution to soil sample weight ratio; FAC: Class C fly ash; MK: Metakaolin.
Table 3. The pH, soluble salts, cation exchange capacity (CEC), and base saturation percentage for soils treated with different amounts of FAG and MKG.
StabilizationpHSoluble Salts 1:1 dS/mSum of Cations meq/100 g% Base Saturation
HKCaMgNa
Natural soil (no stabilization)7.41.6458.10285103
FAG6%9.32.9265.90171424
9%9.83.5666.80164233
12%10.14.4272.20155242
MKG6%9.42.567.10168427
9%9.72.8467.10162334
12%9.94.6472.70153244
Abbreviations: FAG: fly ash geopolymer; MKG: metakaolin geopolymer.
Table 4. Reported phase reflexes from aluminosilicate sources (FAC and MK) and treated soils.
d-Spacing in ÅIdentified Phases
FACMK6% FAG12% FAG6% MKG12% MKG
2.2-----mullite (Al6Si2O13)
--2.29---mullite (Al6Si2O13)
2.4-----lime (CaO)
2.68-----mullite (Al6Si2O13)
-----3.2cancrinite (Na6Ca2Al6Si6O24(CO3)2)
----3.3-cancrinite (Na6Ca2Al6Si6O24(CO3)2)
3.37-3.37---mullite (Al6Si2O13)
---3.37--C–S–H (Ca6Si3O12·xH2O)
----4.2-sodalite (Na8Al6Si6O24Cl2)
---4.21--C–S–H (Ca6Si3O12·xH2O)
--4.3---mullite (Al6Si2O13)
-7.12----kaolinite (Al2Si2O5(OH)4)
-----7.15kaolinite (Al2Si2O5(OH)4)
Abbreviations: FAC: Class C fly ash; MK: Metakaolin; FAG: fly ash geopolymer; MKG: metakaolin geopolymer.

