Study on the Improvement of Expected Energy Savings and Actual Energy Savings in Apartments


Department of Architectural Engineering, Kangwon National University, Jungang-ro, Samcheok-si, Kangwon-do 24341, Korea
*
Author to whom correspondence should be addressed.
Sustainability 2018, 10(4), 1089; https://doi.org/10.3390/su10041089
Submission received: 14 February 2018
/
Revised: 30 March 2018
/
Accepted: 2 April 2018
/
Published: 5 April 2018
Abstract
:Regulating energy consumption can reduce both greenhouse gas emissions and expenditures. In order to maximize efficiency, appropriate energy protocols for buildings must be devised and implemented. This study examines predicted and real energy savings, the differences between them, and the methods which might reduce these discrepancies. Analyses for 195 high-efficiency apartment units (certified based on the energy efficiency rating system in use in Korea) indicated an average difference of 23% between predicted and real energy savings. This was found to be due to the fact that predictions failed to take variables such as Heating Type, Corridor Type, and Climate into account. By accounting for these factors, an appropriate calculation formula may be established. Using the revised calculation formula to reevaluate the predicted energy savings of 13 apartment units resulted in a reduction of 7% in the aforementioned discrepancy between predicted and real energy savings. Using the proposed formula to predict energy savings in buildings could improve accuracy, thus facilitating the setting of appropriate standards for restrictions on greenhouse gas emissions of buildings.
1. Introduction
The Paris Accord is an agreement within the United Nations Framework Convention on Climate Change that was adopted in 2015 in an effort to respond to the threat posed by greenhouse gas (GHG) emissions. It replaces the Kyoto Protocol (which expires in 2020), in which it was stipulated that only developed countries (38 in total, with Korea excluded) were obliged to reduce GHGs. In the Paris Accord however, all 195 signatory nations, including Korea, have agreed to take measures to reduce their GHG emissions.
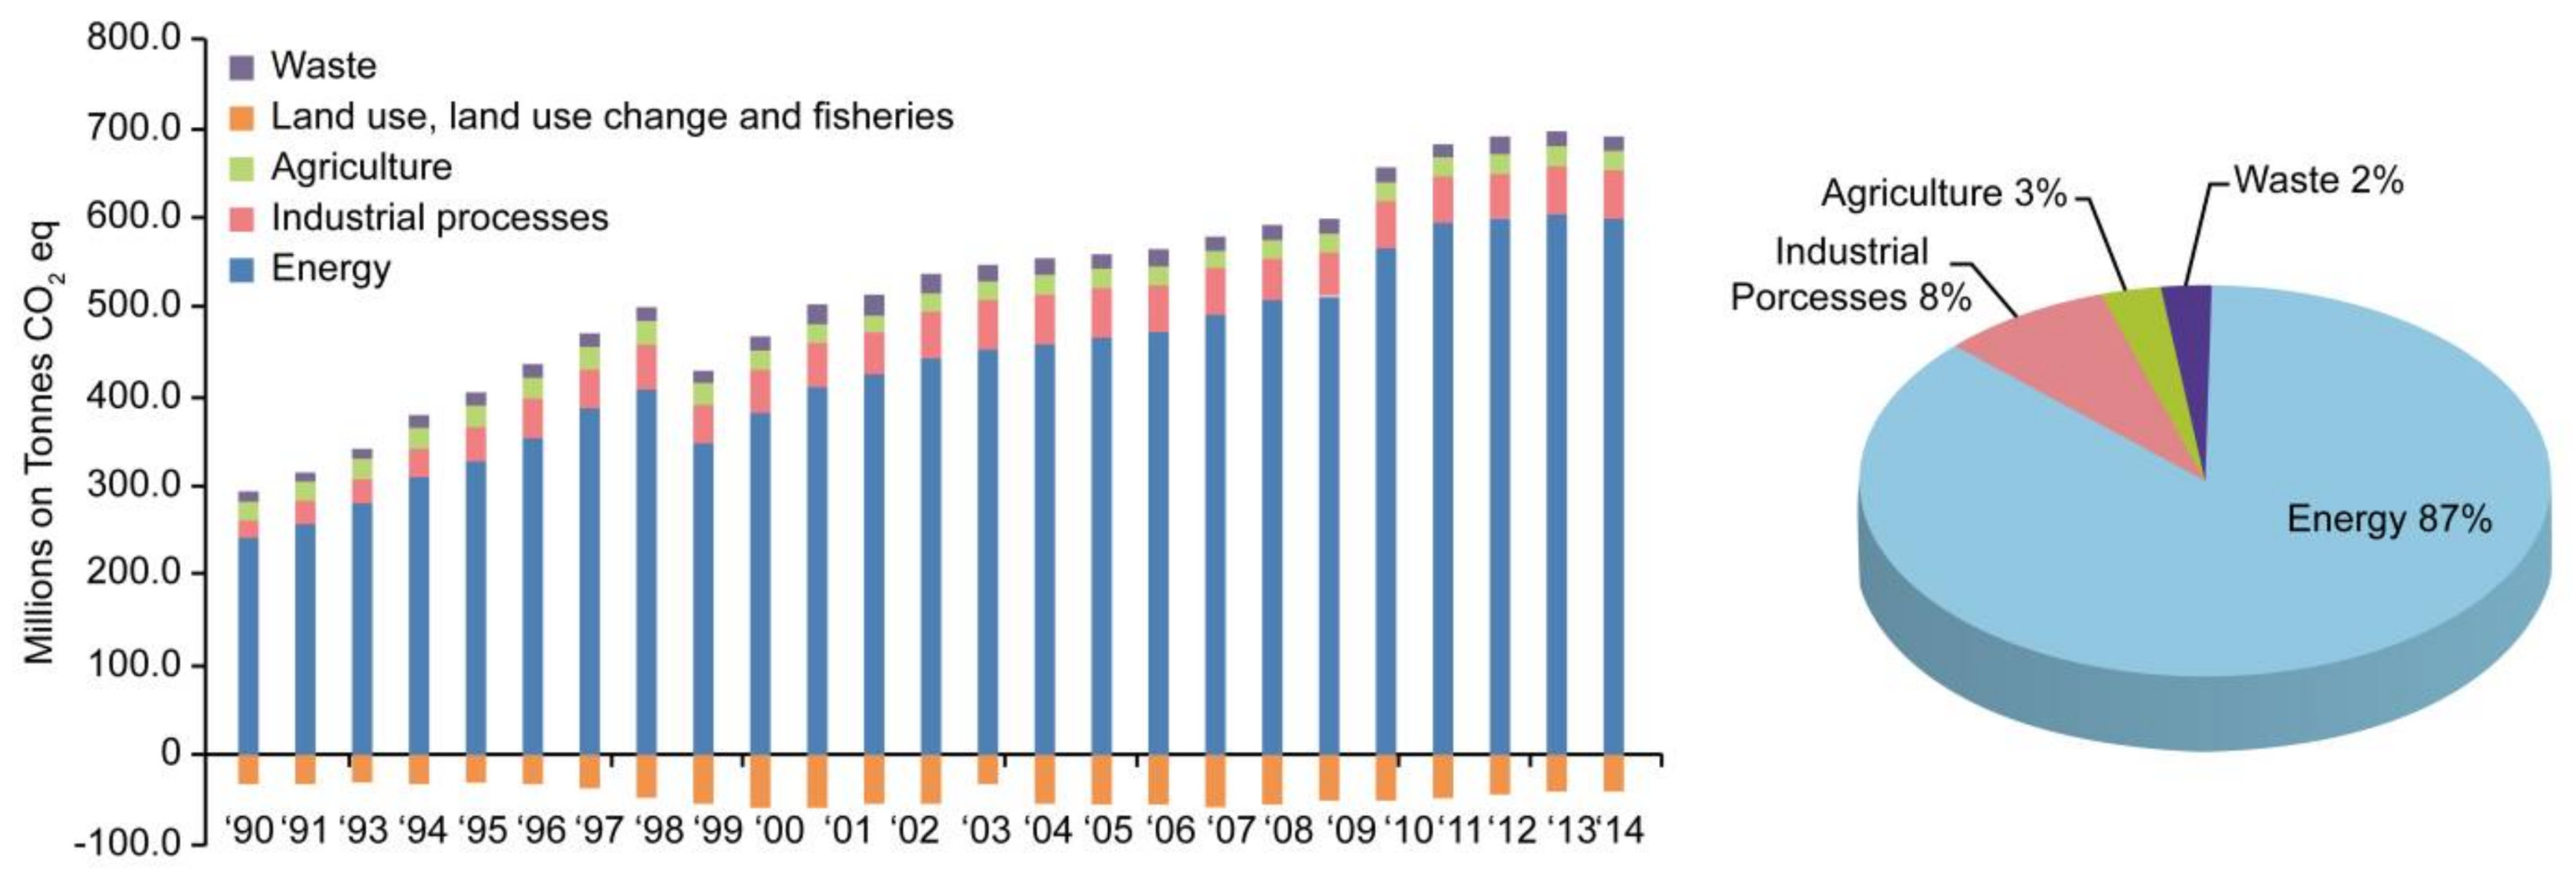
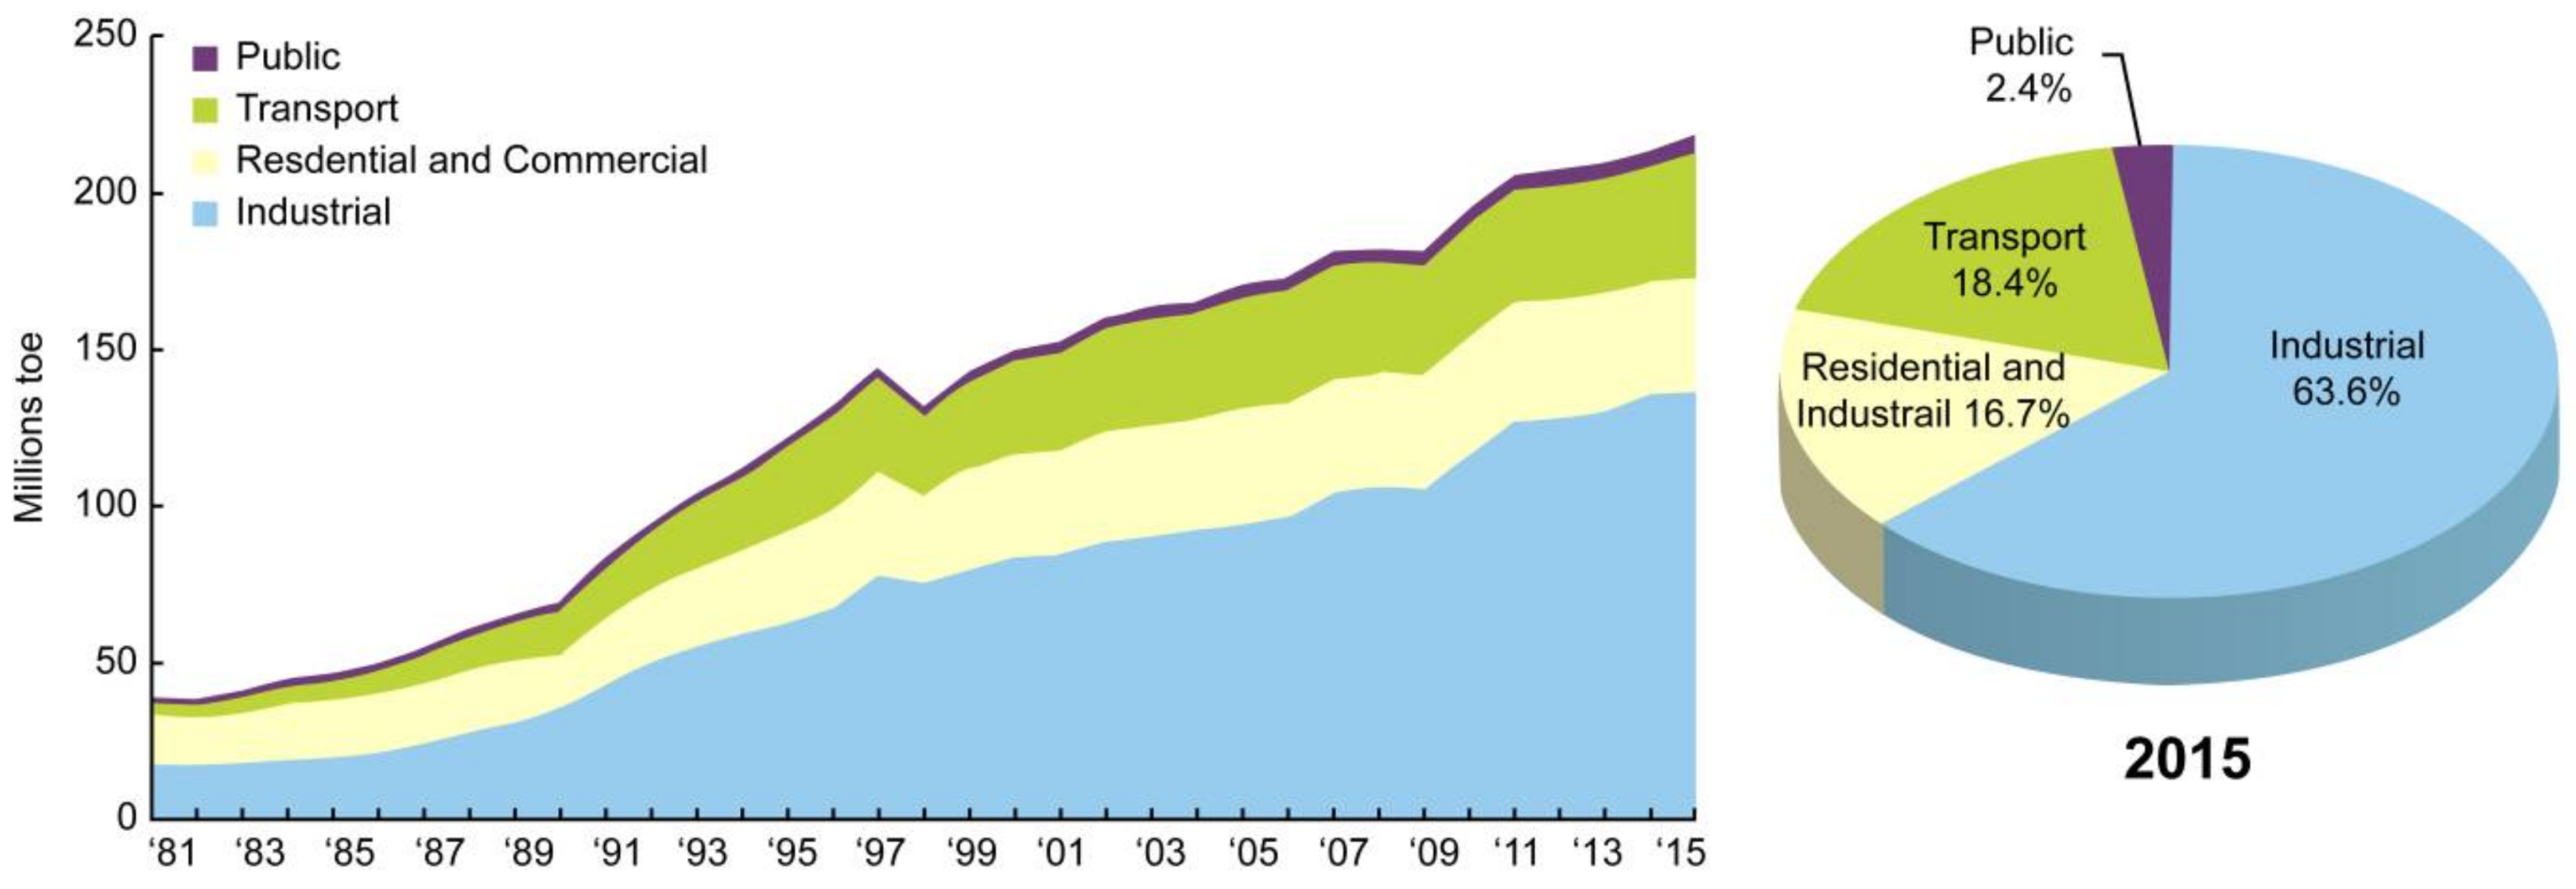
An inventory of GHG emissions by country shows that Korea is twelfth globally, and sixth among the member states of the Organization for Economic Cooperation and Development (Table 1). Figure 1 shows Korea’s GHG emissions by sector, and its industry weightings. It illustrates consistent growth in national GHG emissions since 1990. Energy production is currently the most significant contributor, and its emissions continue to grow. The Residential and Commercial sector, driven by energy use in buildings, is responsible for 16.7% of total industry-specific GHG emissions (Figure 2) [1,2].
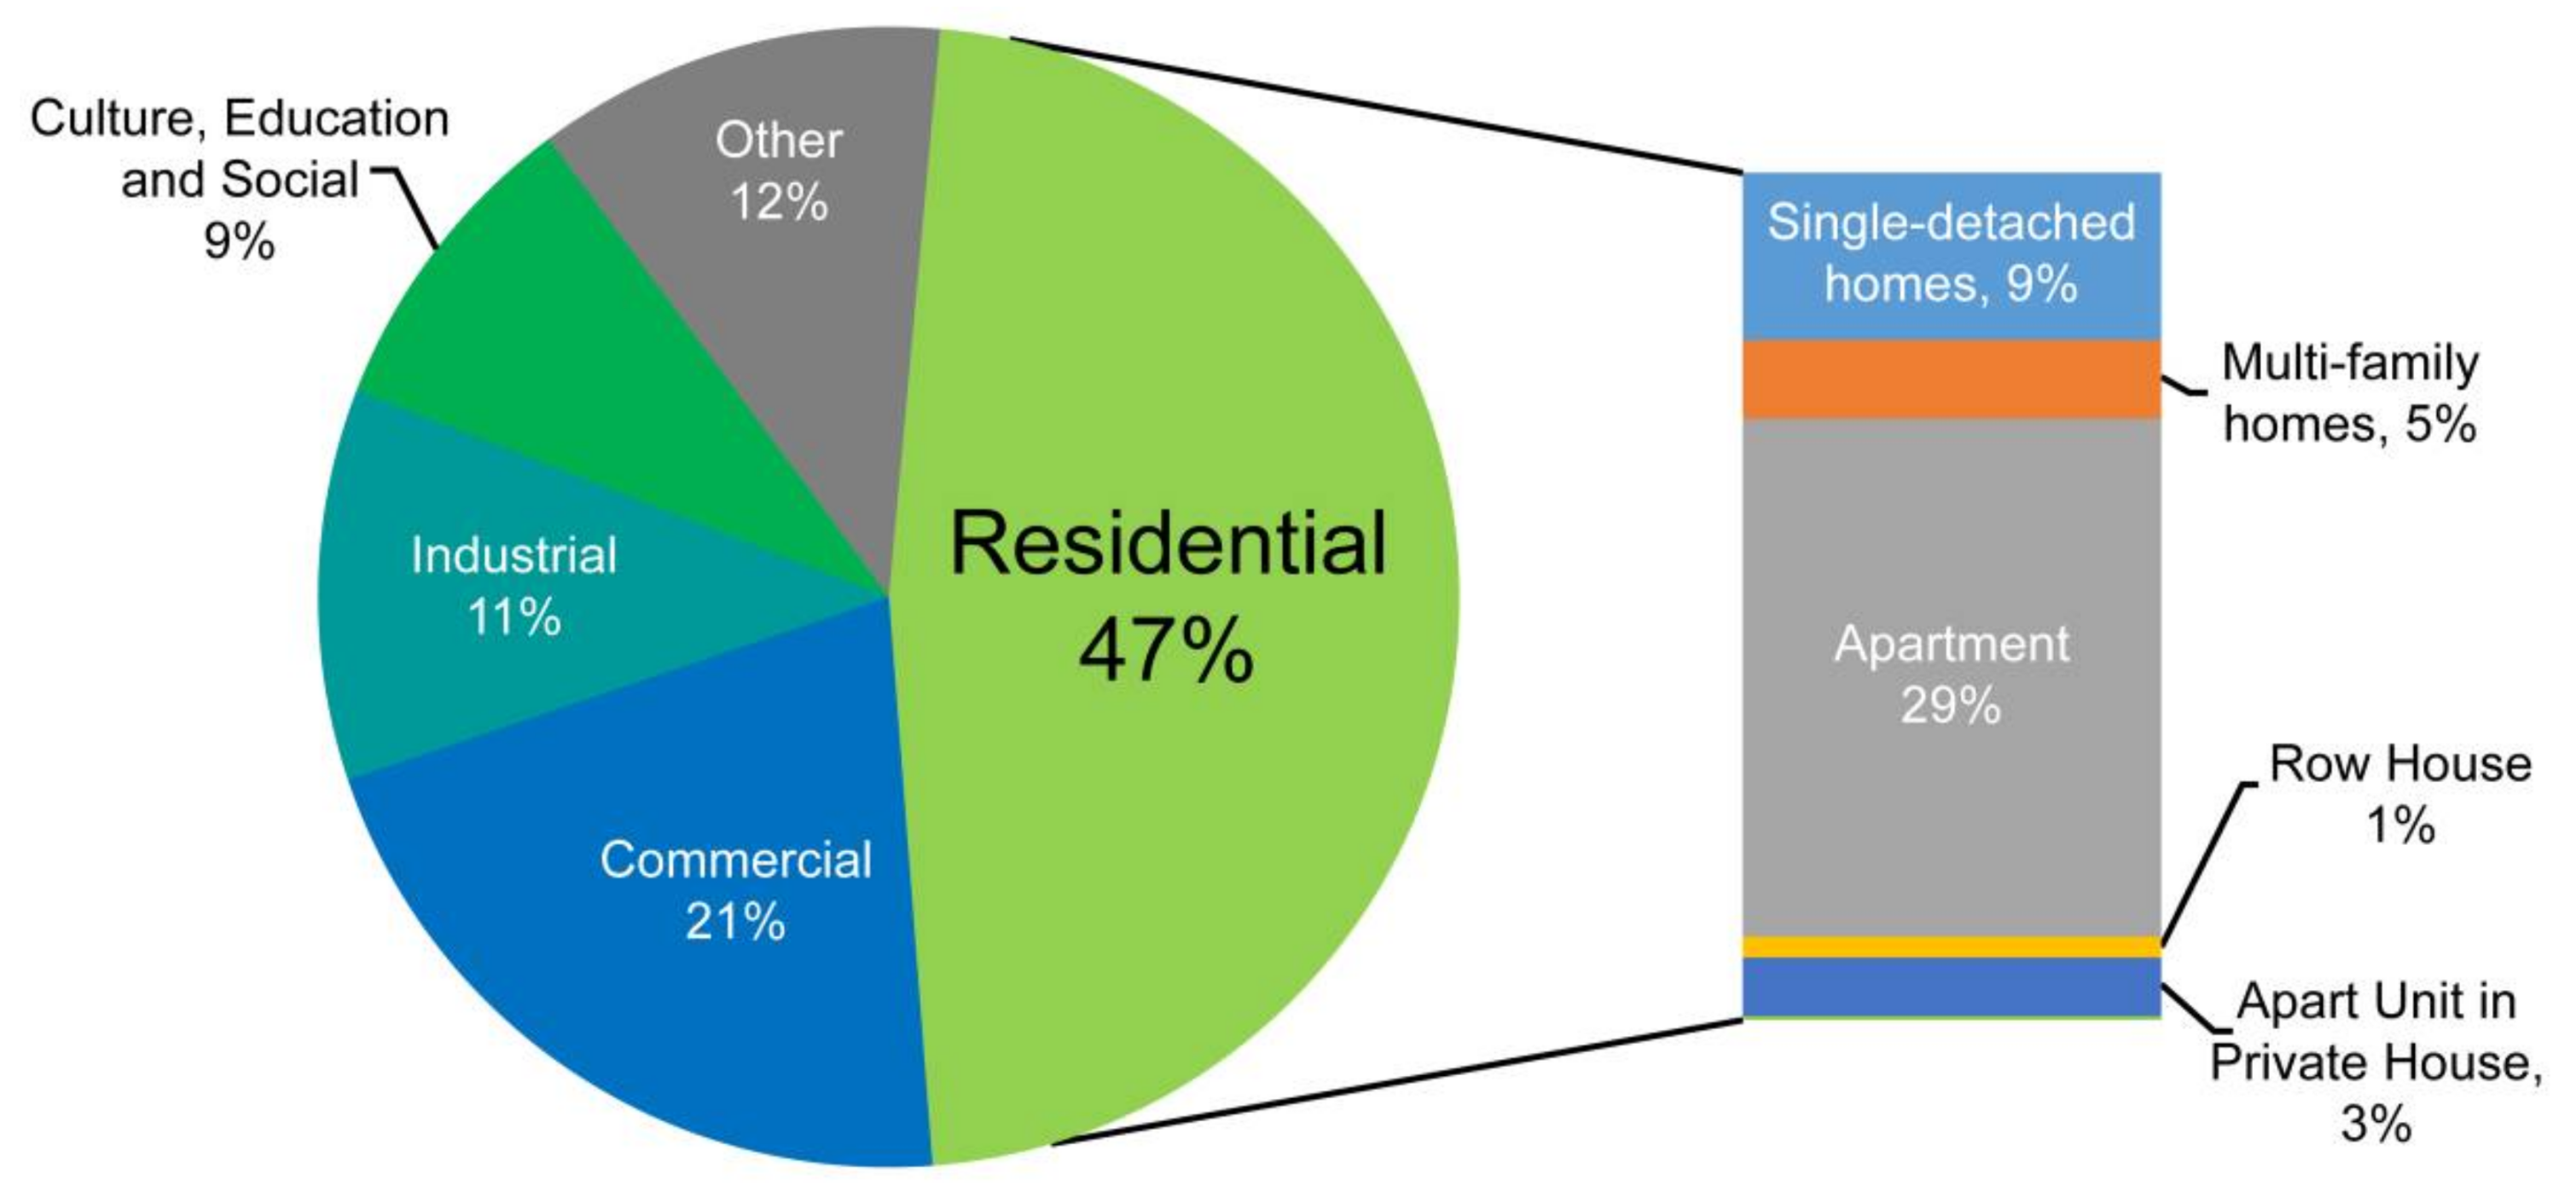
Of the overall gross floor area of Korean buildings, residential buildings account for 47%, representing the highest proportion of usage; commercial buildings are the second highest, accounting for (21%) (Figure 3). Apartments make up 61% of residential buildings, and therefore, 29% of all buildings in Korea (the single largest proportion). Hence, it is necessary to manage GHG emissions of apartments [6].
In an effort to restrict GHG emissions, Korea has enacted the Green Building Development Support Act. In addition, it operates the Green Standard for Energy and Environmental Design (G-SEED), and the Building Energy Efficiency Rating (BEER). These agencies certify buildings at the planning- and construction-stages, based on the building’s efficiency calculated by predicted energy use. They also provide Building Energy Consumption Certification (BECC) based on actual building energy usage [6,7,8,9,10].
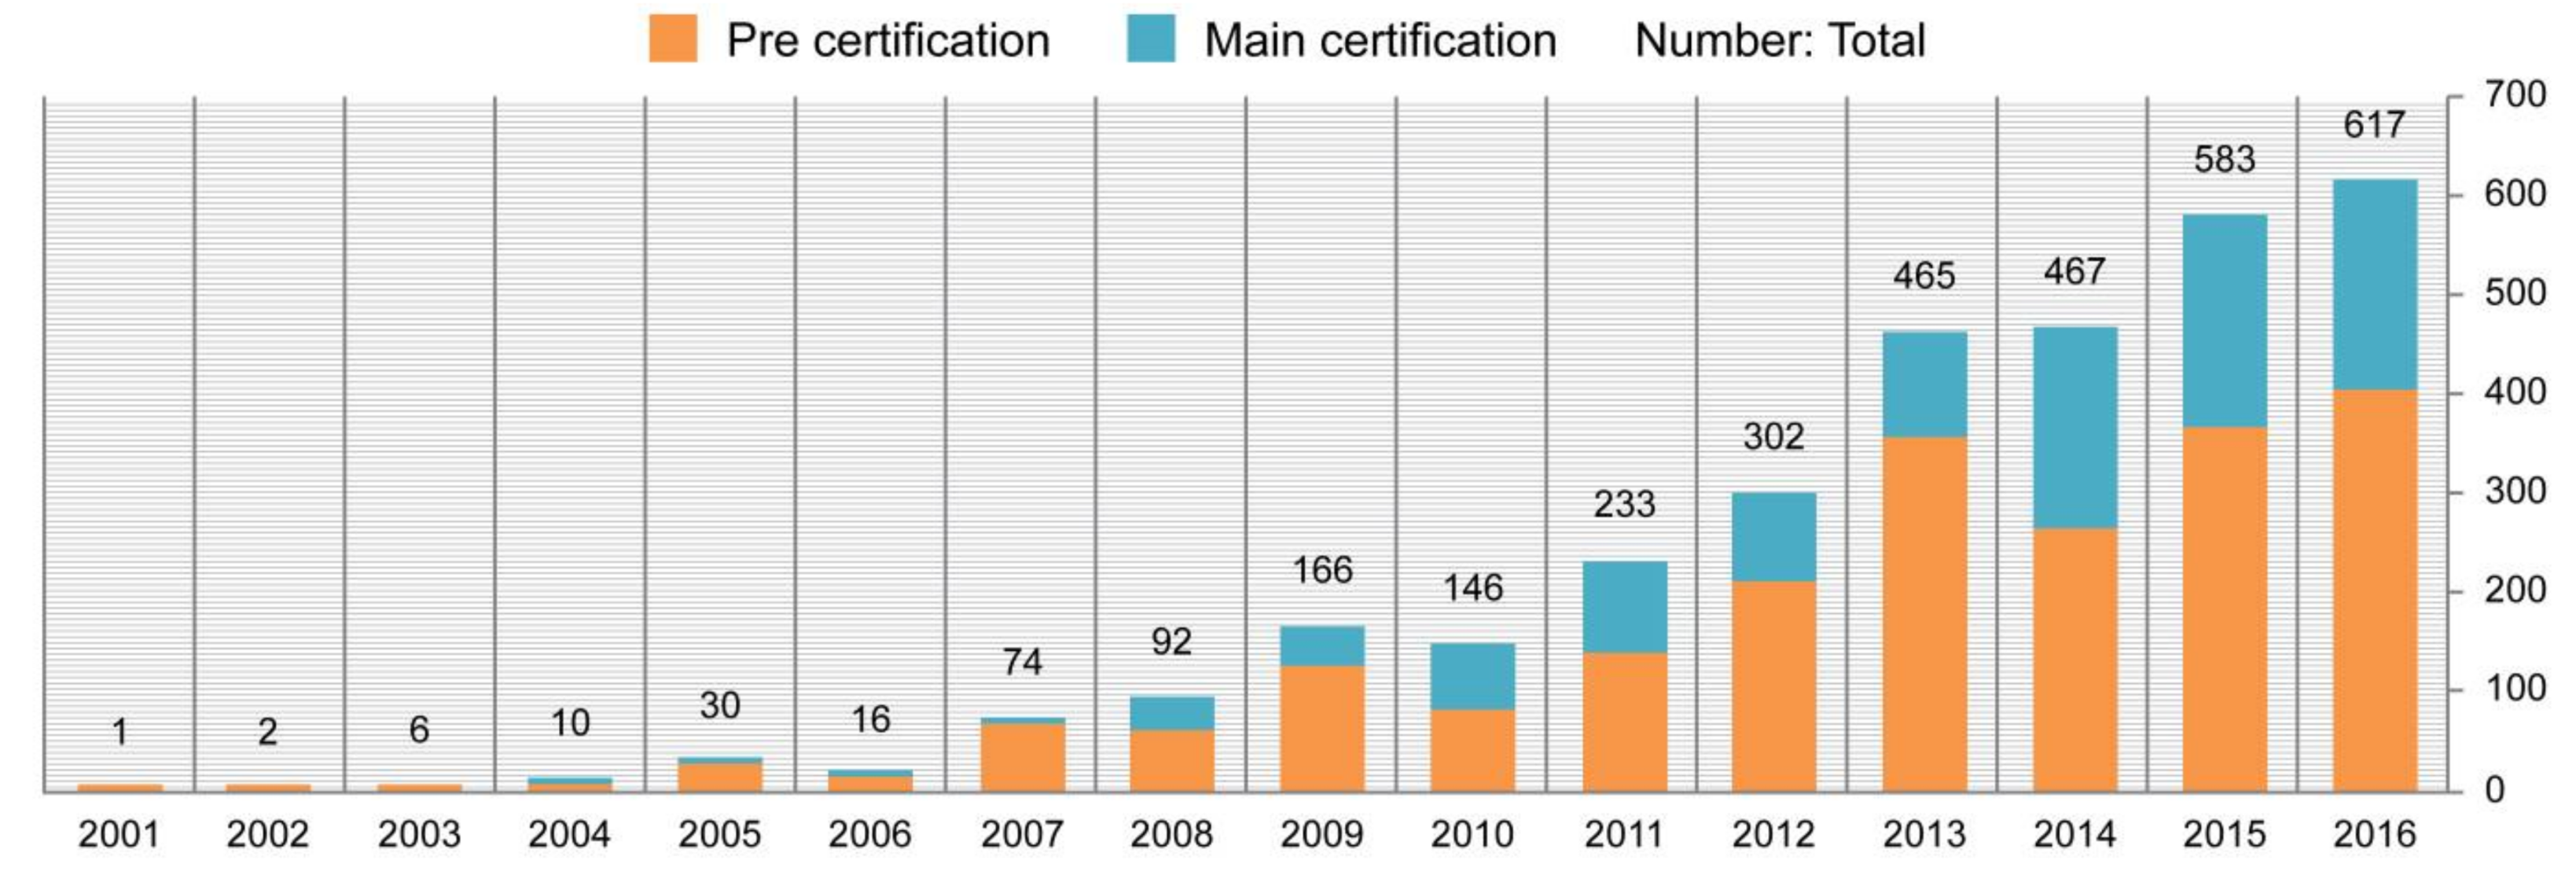
When BEER and G-SEED certifications are obtained simultaneously, incentives are provided, such as reduced property taxes, tax reductions, and increased rates of building volume per lot. Thus, the number of BEER-certified buildings in Korea has increased annually from 2010, as shown in Figure 4. However, calculations as part of the BECC for buildings with BEER certification have indicated that the actual energy consumption of certain buildings might not be in line with predictions [11].
Given the above, several previous studies have examined the importance of accurate measurements of general building energy efficiency, related technological developments, and country-specific building-related energy efficiency and performance [12,13,14,15,16,17,18,19,20]. However, as an extension of earlier research, this study compares the energy use predicted for a building prior to commissioning versus its actual energy use, together with an assessment of methods for improving the disparity between predicted and actual values.
Existing studies have focused on modifying the overall process as a way of improving the Predicted Energy savings (EP). However, in this study, the process is added to the result of the EP calculated in the BEER. It is possible to assign it to an existing building that already has an EP.
EP, Real Energy savings (ER), and the difference between the two (EP − ER = EPR) appear to be related to the omission of influential factors such as Corridor Type, Climate, and Heating Type in the BEER assessments [21,22,23,24]. Thus, increases in EPR lower the BEER reliability, rendering it impossible to set standards for appropriate actual energy use of buildings, and thus preventing the introduction of robust regulation of GHG emissions.
This study investigates the ER of 195 BEER-certified apartments in Korea, to confirm correlations between the abovementioned factors and the EPR. Moreover, it derives an improved formula for reducing the EPR, based on the obtained correlation coefficients. The formula proposed in this paper improves the accuracy of the BEER, which could support the development of guidelines for the actual energy use of buildings. The application of appropriate energy standards for buildings could promote economic gains and reduce GHG emissions through energy consumption regulation.
2. Materials and Methods
2.1. Building Energy Efficiency Management Systems Overseas
Table 2 shows the energy efficiency management system of the US, Europe and Japan compared with the energy efficiency management system in Korea. The items that assess the performance of a building vary, but all of system put a premium on the building of energy efficiency.
2.2. Building Energy Efficiency Rating (BEER)
The BEER was introduced by the Ministry of Trade, Industry, and Energy in 2011 to measure the energy efficiency of buildings. All buildings are assigned ratings based on their primary energy consumption per unit area.
There are ten different levels according to which incentives, such as local tax reductions and the relaxation of architectural standards, are assigned. The period of validity is set at ten years, during which time the building must be maintained and managed in accordance with the standards applicable to the approved rating based on energy consumption data.
The evaluation method used for the BEER calculation changed after December 2013. Previously, the EP was calculated based upon standard energy use, evaluating the energy savings (%) as shown in Equation (1). Currently, it is evaluated based on primary energy usage (kWh/m2·year). To calculate primary energy usage, the ECO2 program is used, as detailed in Equation (2) and in Figure 5.
- (kWh/m2·year)
- (kWh/m2·year)
- (m2)
- (m2)
- (kWh)
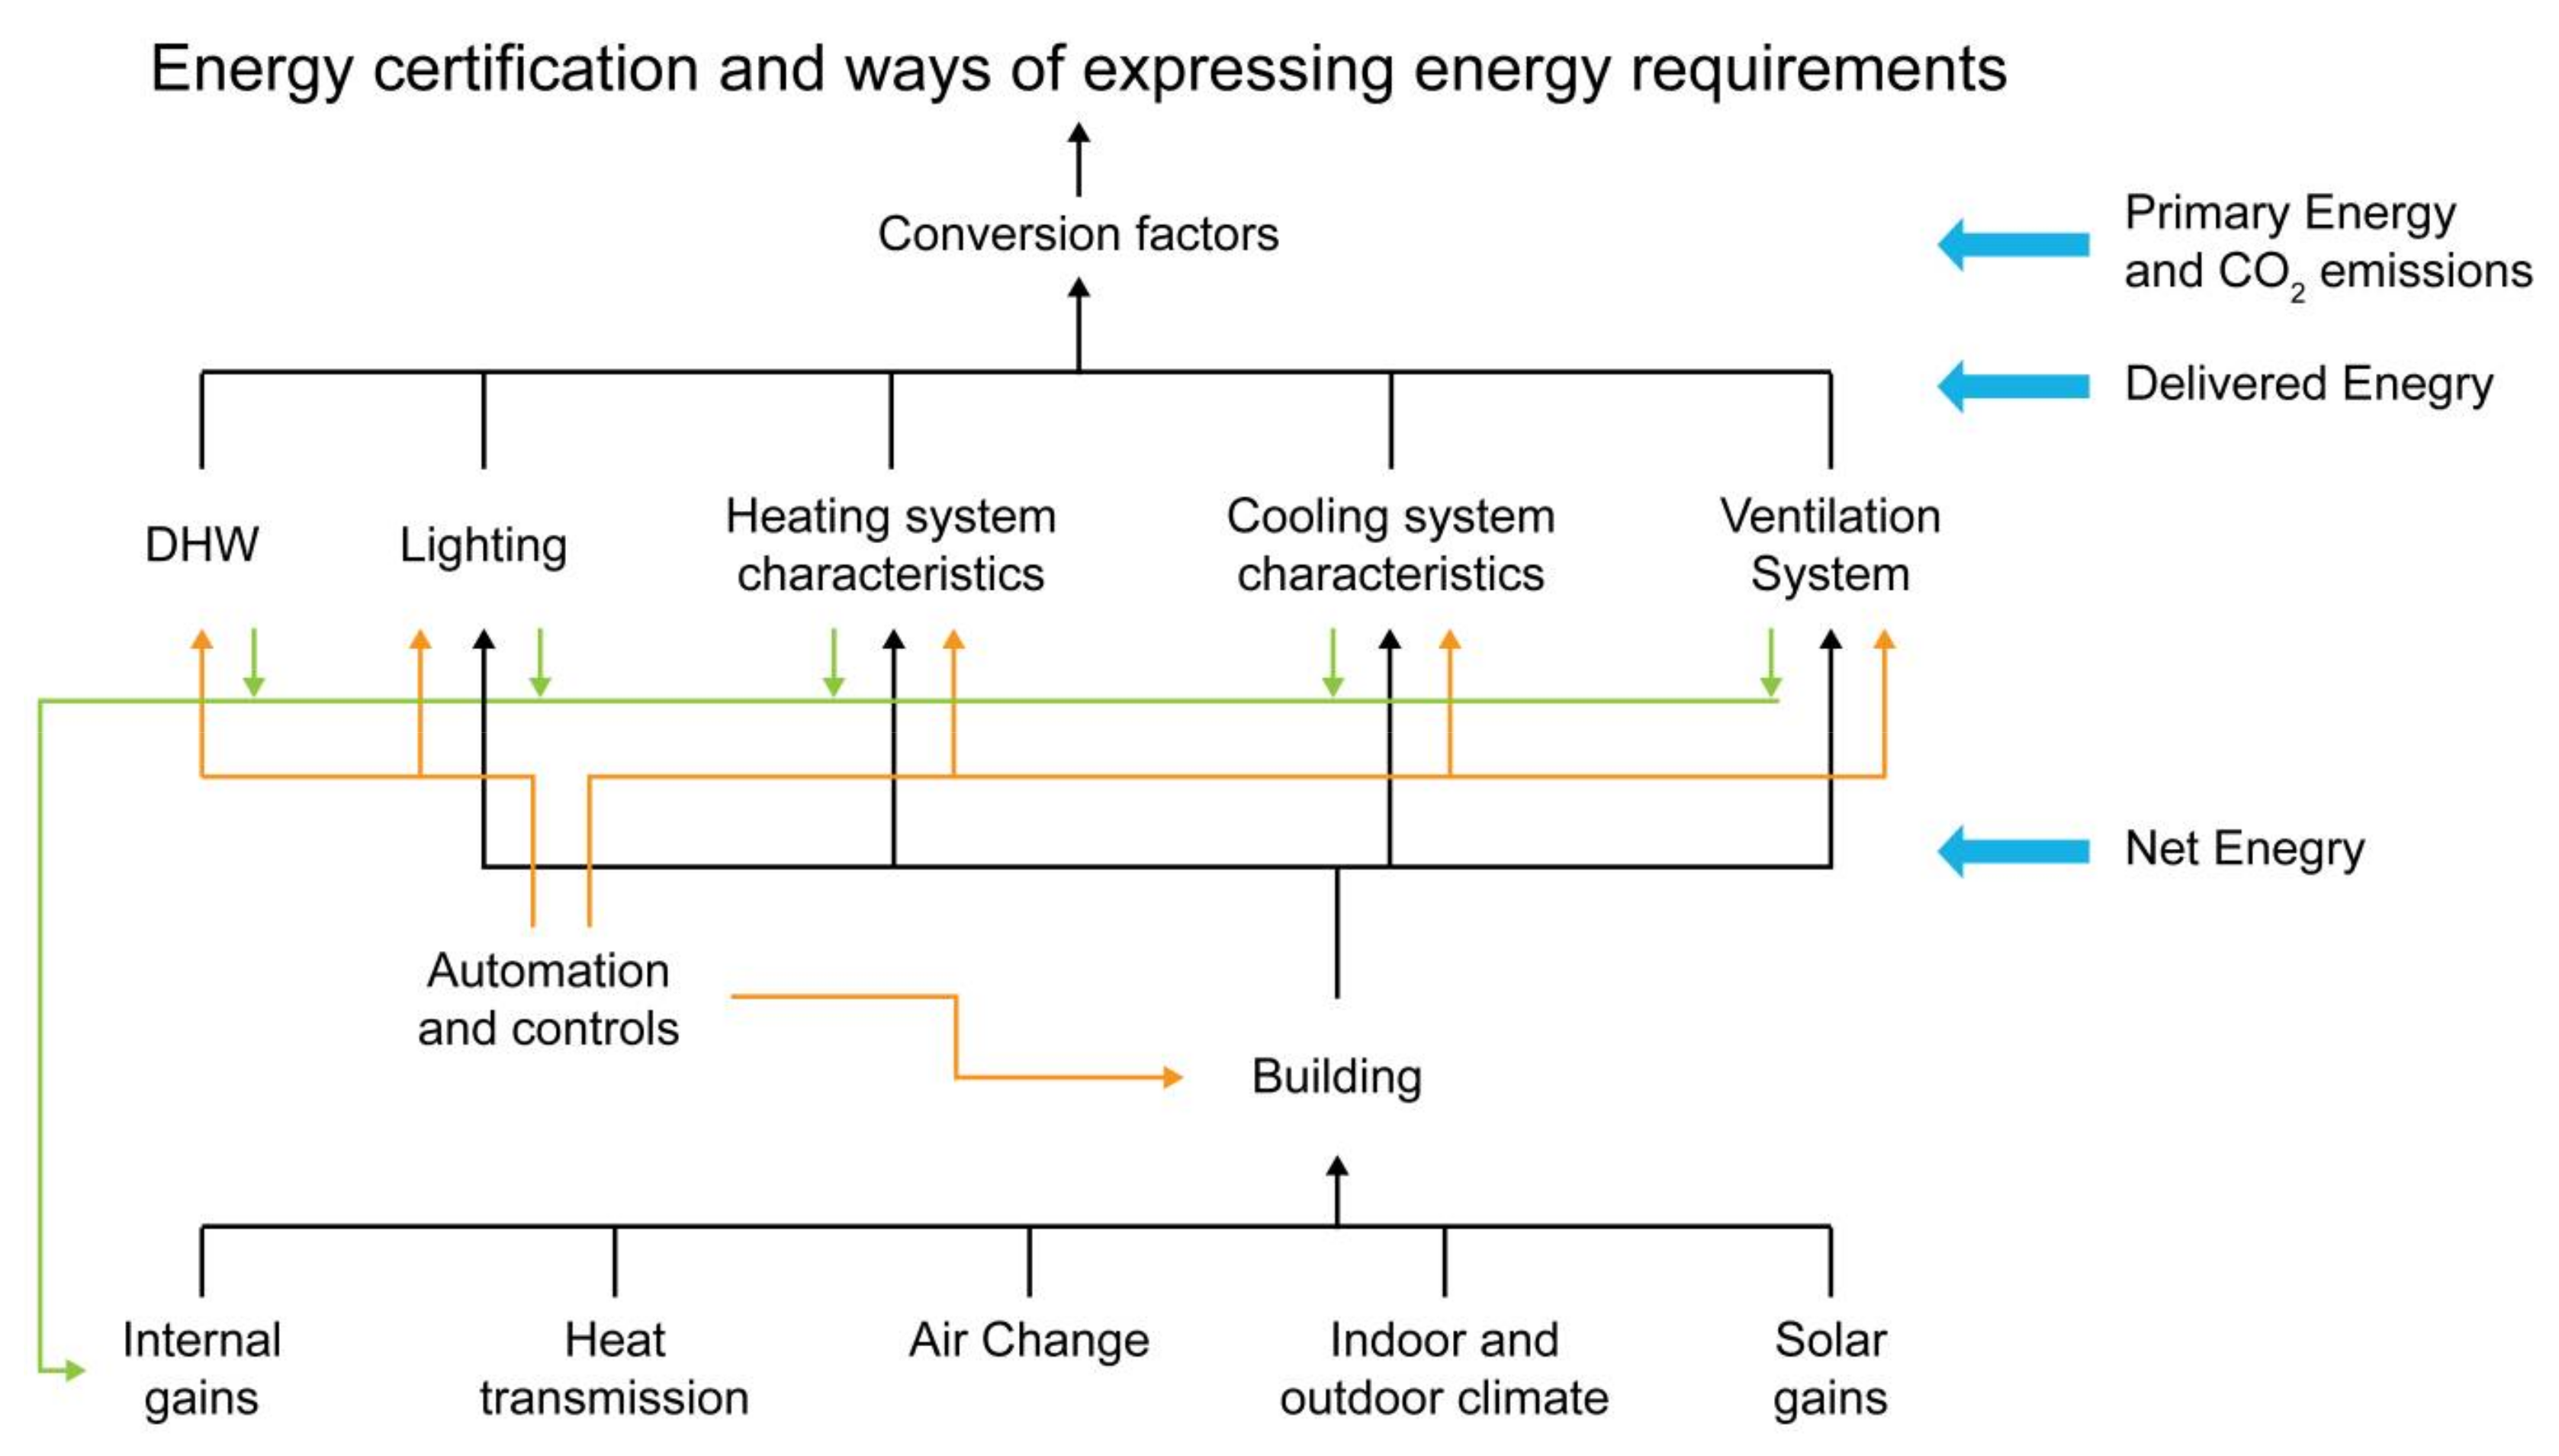
Equation (2) calculates the amount of primary energy utilized. It considers the energy utilized by heating, cooling, hot water, lighting, and ventilation by gross floor area, adds them to obtain the energy consumption per unit area, and multiplies them by the primary energy conversion factor. The calculation of primary energy consumption per unit area using the ECO2 program is calculated by following the process shown in Figure 5.
The energy efficiency rating method using ECO2 simulates the size of each room, the position and size of the window, and predicts the amount of primary energy usage by inputting information such as the degree of efficiency of heating and cooling equipment, the heating system, and the heat conduction rate. Corridor Types are not included, and weather data is based on only 13 cities. In addition, the details of the type of building elements and facilities are limited; therefore, the calculation is limited to a certification program for calculating the energy efficiency grade [35].
The primary energy consumption per unit area is calculated based on Equation (2) and Figure 5.
2.3. Building Energy Consumption Certification (BECC)
The BECC system is based on the actual energy consumption of a building. It was developed in 2013 following regulations mandating the disclosure of the energy consumption of a building, for the purposes of creating an information system relating to the building-related GHG emissions and energy consumption.
The BECC of apartments classifies ratings according to energy usage levels. The standards are applied based on regional equivalents of areas (city/province), which are in turn based on areal ranges (1–6), as shown in Table 3. Lower proportions of actual energy usage to standard energy usage indicate lower energy consumption. Ratings A–E are assigned for different building types, depending on energy usage. Energy usage rating calculations (Equation (3)) are used for BECC, where a is the actual energy usage and b is the standard usage value, which differs by region.
2.4. Study Process and Analysis Methods
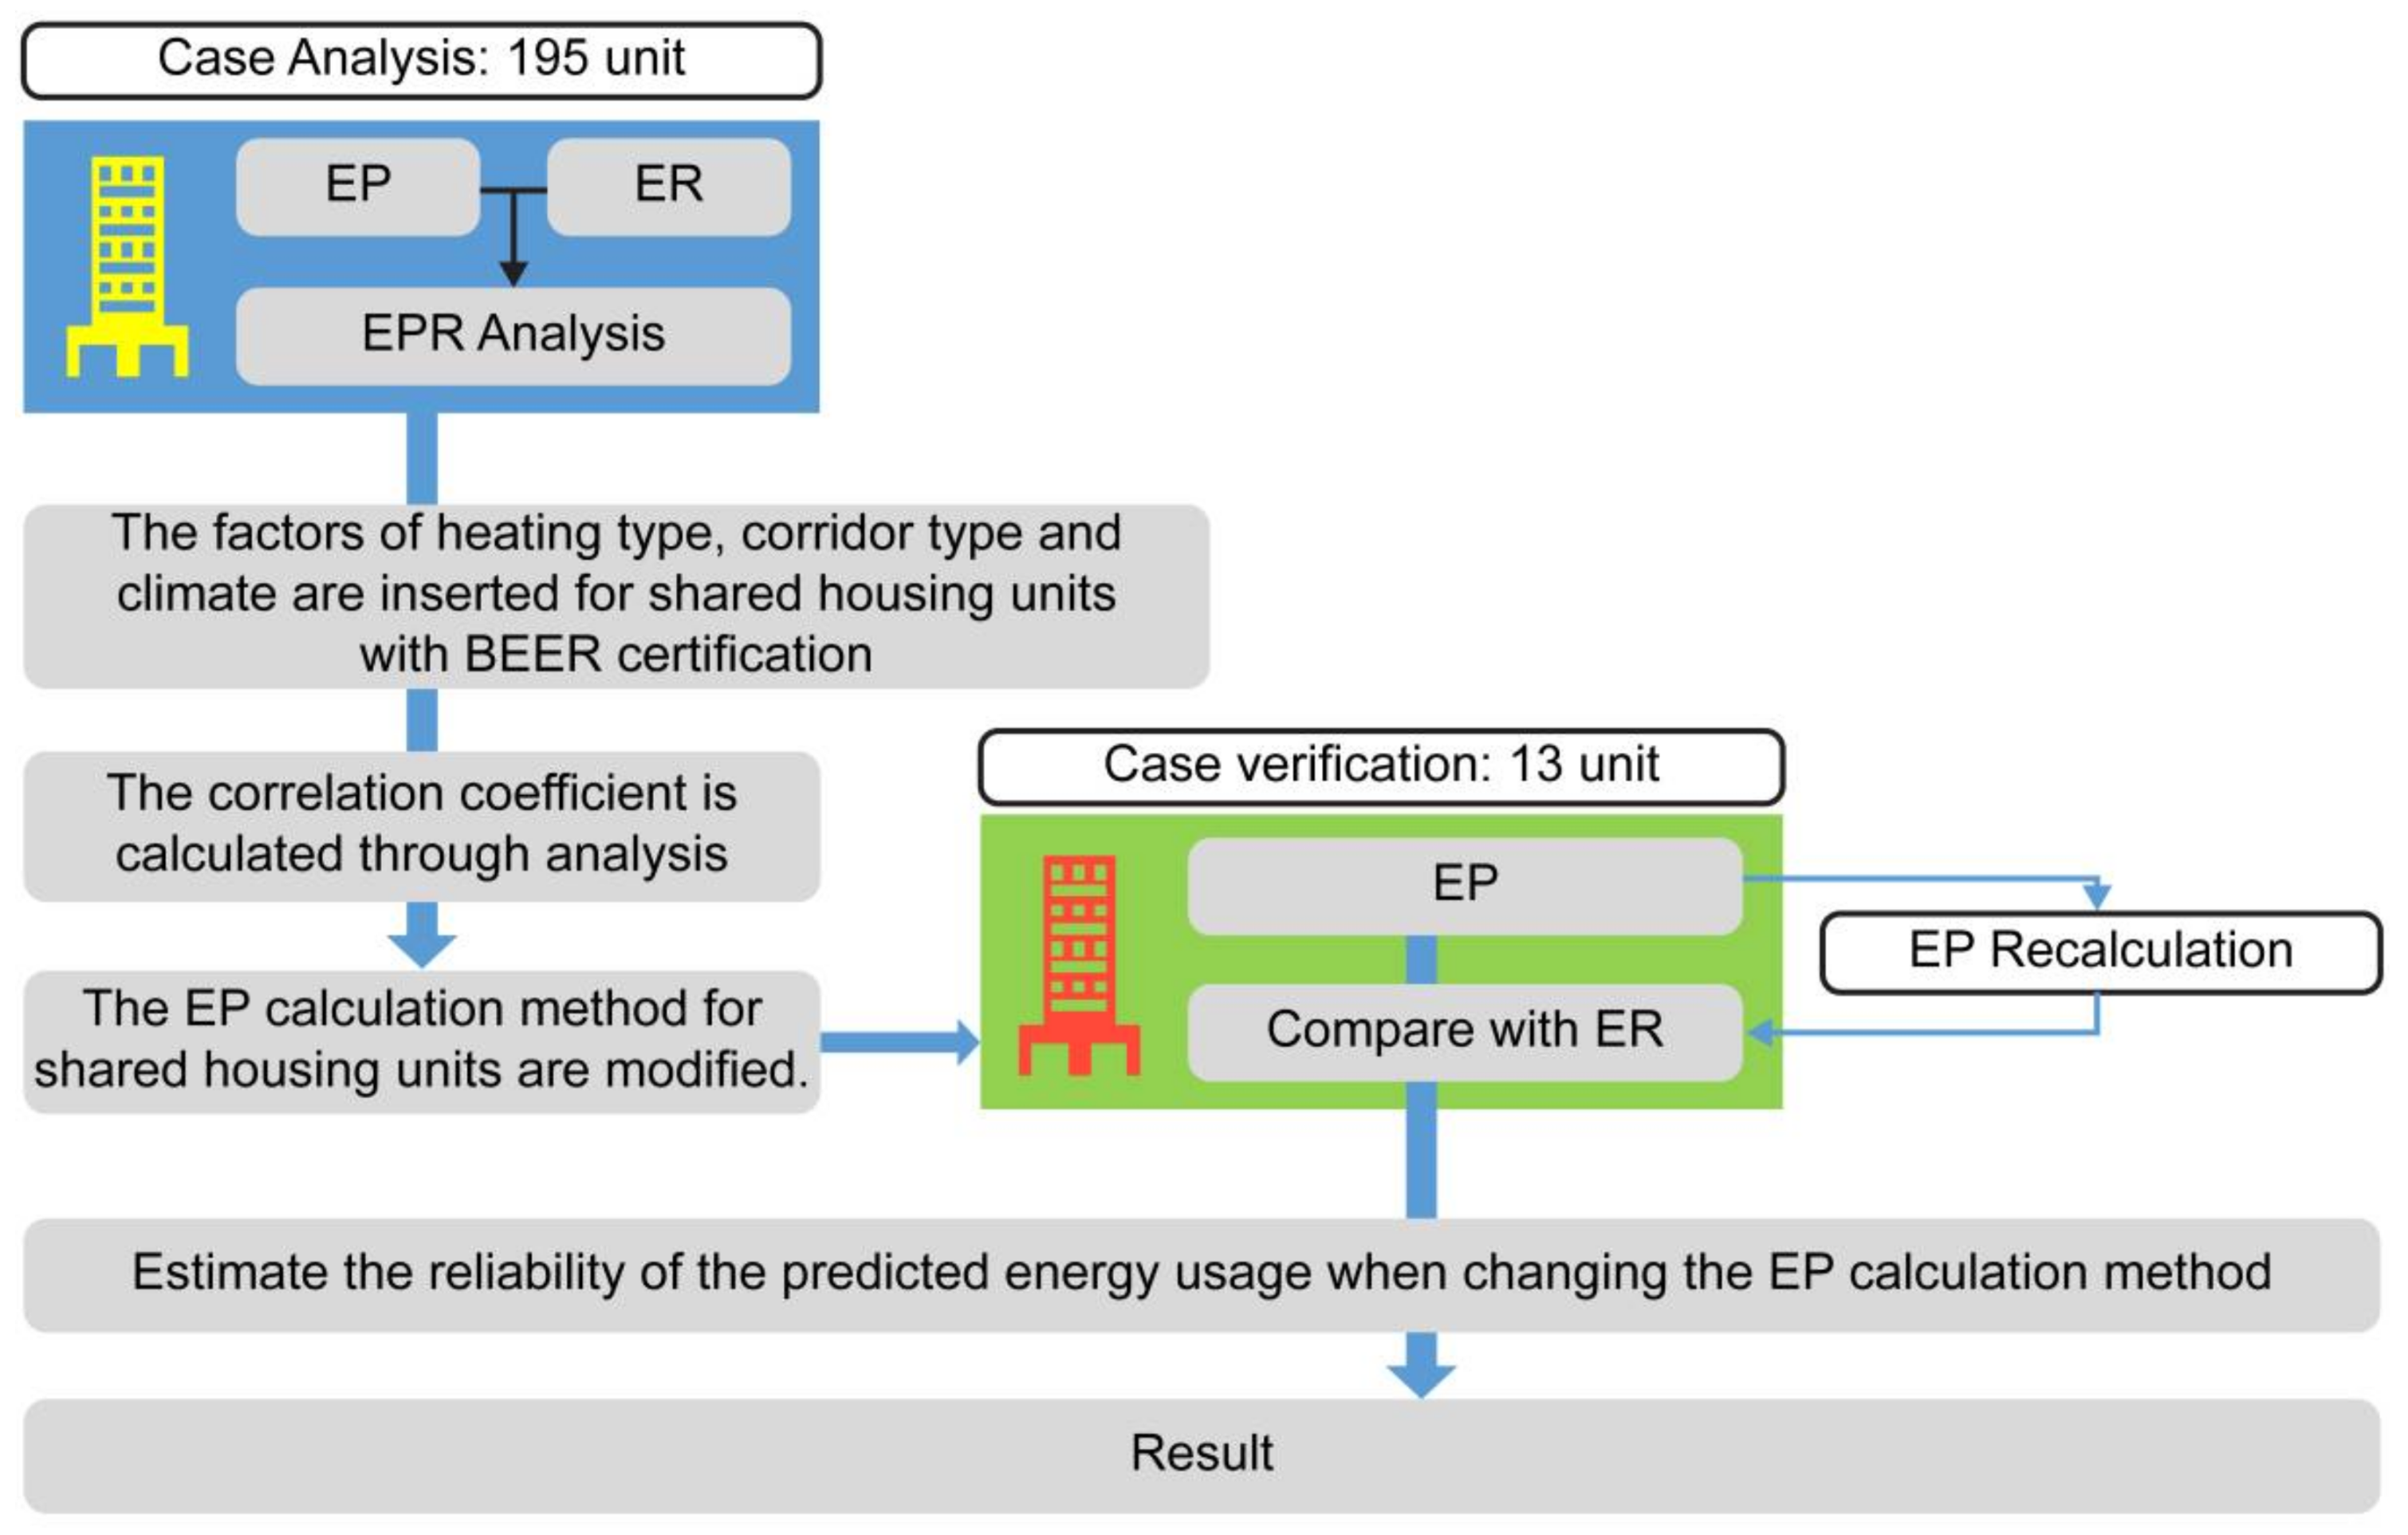
The process for analyzing the difference between EP and ER, and for improving the reliability of their measurements, is shown in Figure 6. First, the factors of Heating Type, Corridor Type, and Climate are considered for BEER-certified apartment units. Then, the correlation coefficient is calculated through analysis, and the EP calculation method for apartment units is modified.
In the selection of samples for EPR analysis, it was found that only 13 units that had received certification after December 2013 were suitable, i.e., an insufficient number for analysis of correlating factors. Therefore, units with BEER certification based on energy reduction were utilized to derive variable-specific correlation coefficients.
Depending on the evaluation criteria, the methods adopted for the extraction of the study units are shown in Table 4. The numbers of apartments receiving preliminary or full BEER certification prior to December 2016 were 2151 and 1058 units respectively [21]. Since data on apartments that received preliminary certification is limited to the construction planning stage (i.e., no data for the post-completion stage), only units with full certification were studied.
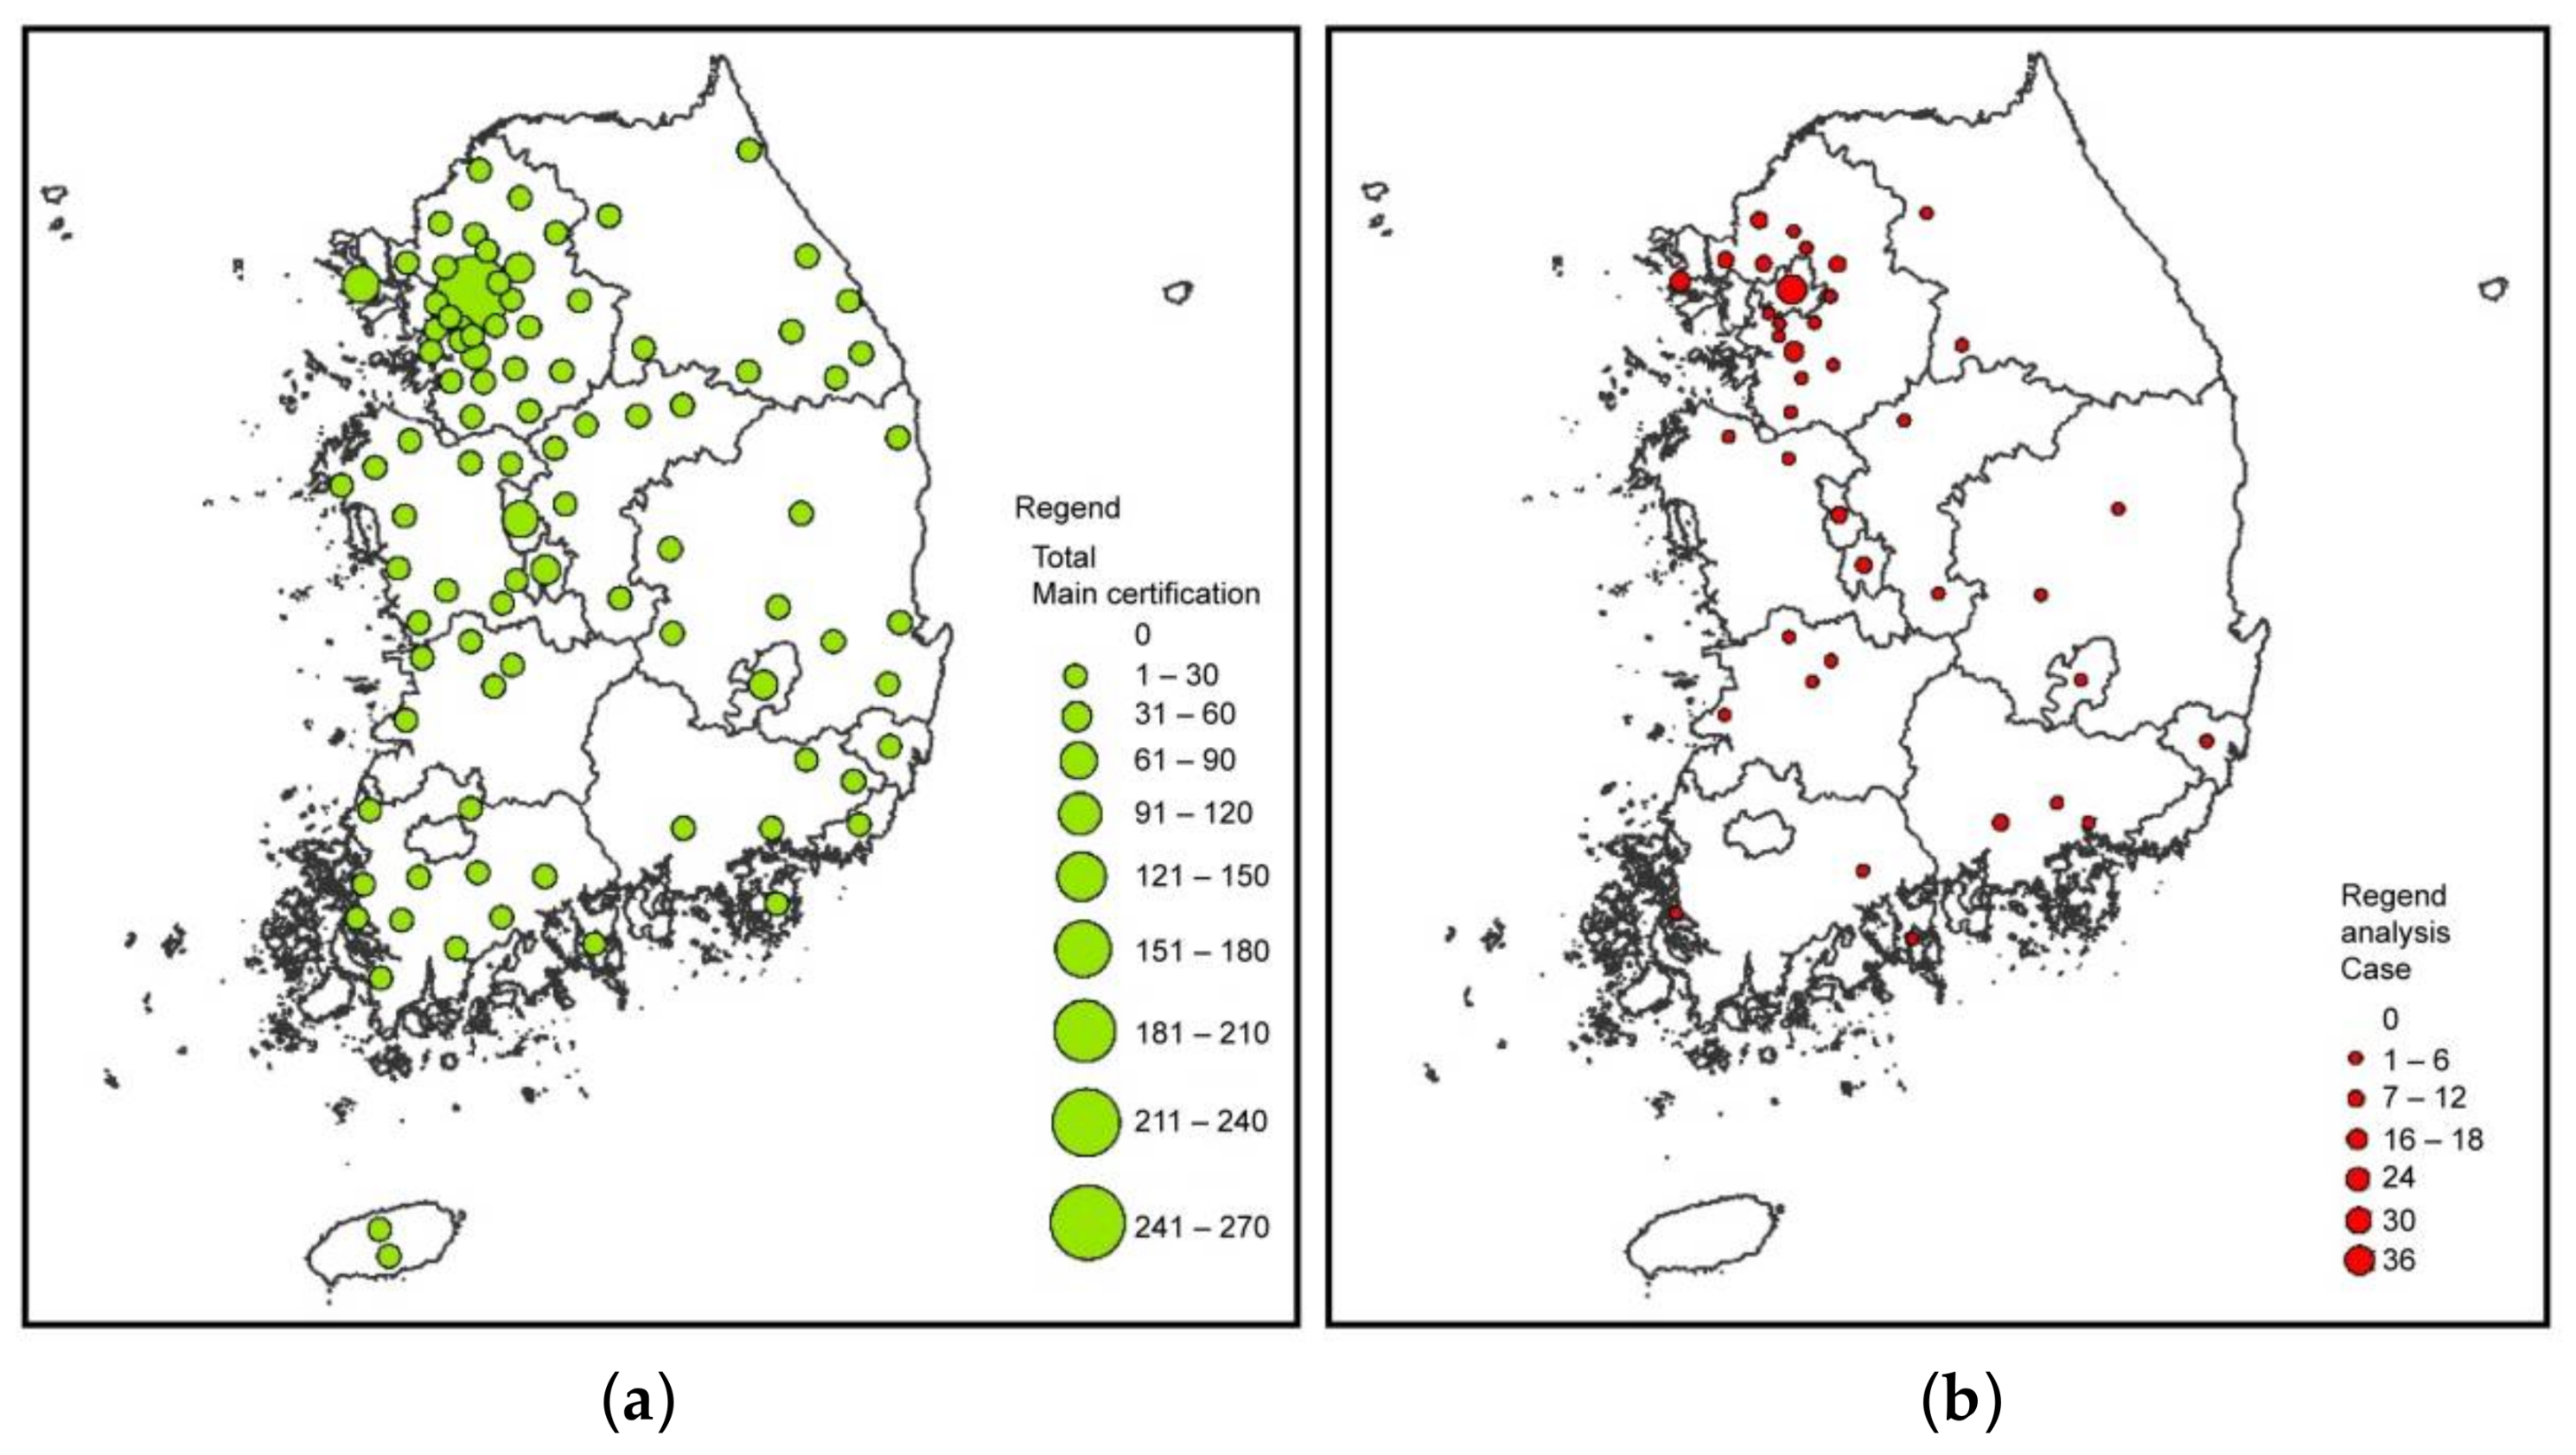
The distribution of the 195 units of the 1058 selected for analysis for correlation coefficients is shown in Figure 7.
As the data about when certification was received was based on “energy savings compared with standard houses”, the “proportion of energy usage versus standard energy usage” disclosed in the energy evaluation reports was used to compare energy efficiency during actual use.
The conversions of EP and ER for comparison are shown in Equation (4).
The regression equation was calculated using the derived correlation coefficients based on the 13 units defined under Evaluation Criteria 2 in Table 4. As these 13 units had no EP rating, these values were calculated using regression equations, and then compared and verified against the ER values. Since the ER is a constant value, the purpose of this study was to derive an improved calculation for EP, in order to reduce the difference between EP and ER (i.e., to obtain the EPR).
2.5. Analysis Methodology
Statistical analysis based on IBM Statistical Package for Social Science(SPSS) Statistics 22 was performed in order to obtain the correlation coefficients for EPR. The following categorizations were used in order to classify the main variables (Climate, Corridor Type, and Heating Type): (1) the Climate characteristics were classified based on regional classifications (city/province); (2) Corridor Type was divided into stairs, corridors, and mixed; and (3) Heating Type was classified into individual and regional heating systems.
The analysis procedure which we adopted was as follows. Step 1: in order to understand the variable-specific characteristics of the analysis target (195 units), descriptive statistics of the general characteristics (minimum and maximum values, and averages and standard deviations) were determined through basic analysis. Step 2: Differences in the averages between the two corresponding groups of EP and ER were analyzed, followed by difference tests. A p-value (hereafter, referred to as p) calculated by this process with a value <0.05 indicated that the analysis aided by this factor was significant. Step 3: A correlation analysis was conducted to identify the relationships between variables relating to EPR. Step 4: A regression analysis was conducted to identify the influence of the independent variables of Climate, Corridor Type, and Heating Type on the dependent variable EP. Step 5; The estimated EP value was calculated for the test subjects (13 units) using the estimated regression equation, which was followed by difference tests using the t-test for EPR.
The analysis targets were classified under the classifications provided by the Housing Management Information System (www.k-apt.go.kr), operated by the Ministry of Land, Infrastructure, and Transport, as shown in Table 5. The locational classifications of the apartments for the purposes of determining the Climate factor were based on city/province areas: 56.9% of the units were located in the Gyeonggi and Seoul areas. In terms of Corridor Type, there were 154 stair-style corridors (79.0%), 26 corridor-style corridors (13.3%), and 15 mixed-style corridors (7.7%). In relation to Heating Type, 129 units had regional heating (66.2%) and 66 (33.8%) had individual heating.
The average EP for the research target units was 35.87 (min value: 14.20, max value: 67.11) with a standard deviation of 8.48, and the average ER was 12.53 (min value: −16.10, max value: 46.05) with a standard deviation of 10.88. The average ERP was 23.34 (min value: −8.57, max value: 57.74) with a standard deviation of 11.18.
3. Results
3.1. Difference Tests
3.1.1. Difference Test for EP and ER
This study conducted a corresponding sample t-test to confirm whether differences existed between EP and ER. Table 6 shows the average difference between EP and ER was 23.34, with t = 29.139 (p = 0.000); thus, EP and ER were found to have differences that were statistically significant.
3.1.2. Difference Test for EPR Depending on Climate
As there were 15 measurement values by which the influence of Climate is determined, they were tested for normality to establish whether they were sampled from a normally distributed population. The results indicated that the sample sizes in Gwangju and Ulsan areas in terms of Climate each had two samples, i.e., the sample size did not satisfy the condition of normality; therefore, the nonparametric Kruskal–Wallis test was used.
The results of the nonparametric Kruskal–Wallis test on the subcategory of Climate, shown in Table 7, indicated a value of 35.940 (p = 0.001). As such, it was possible to conclude that the EPR in each region under the Climate classification was significant.
3.1.3. Difference Test for EPR Depending on Corridor Type and Heating Type
A difference test was conducted to determine the significance of Corridor Type and Heating Type on EPR. The results, as shown in Table 8, indicated that Corridor Type (F = 5.39, p = 0.005) was significant in relation to EPR; therefore, a post hoc test was required. However, Heating Type (t = 1.22, p = 0.224) was not found to be significant in relation to the EPR. The EPR of regional heating (M = 22.65) and individual heating (M = 24.64) did not differ in terms of Heating Type.
3.2. Regression Analysis of Influence on EP
Analysis of the influence of the independent variables of the general characteristics (Climate, Corridor Type, and Heating Type) on the dependent variable of EP, in accordance with each factor in Table 9, produced an F value of 4.336 (p = 0.000), indicating that the analysis was accurate. The explanatory power was approximately 30.7% (=0.181), indicating that the influence of the independent variables (Climate, Corridor Type, and Heating Type) on EP was 30.7%.
Regression analysis indicated that Corridor Type was the factor with the greatest influence on EP, followed successively by Climate and Heating Type. In accordance with the Climate classifications, it was evident that the regions of Seoul, Incheon, Daegu, Gyeonggi, Chungnam, Gyeongbuk, Jeonbuk, and Jeonnam were calculated appropriately; however, Daejeon, Gwangju, Ulsan, Sejong, Gangwon, Chungbuk, and Gyeongnam required further analysis to identify the influence of Climate. Moreover, the influence of Heating Type was not found to be significant, contradicting the initial assumption that it would influence EP. Thus, Heating Type was removed from the estimated regression equation for the recalculation of EP.
3.3. Estimated Regression Equation
The following is the estimated regression equation based on the unstandardized coefficients calculated through regression analysis:
Total energy savings = 44.030 − 11.159 × Incheon − 5.507 × Daejeon − 6.695 × Daegu − 6.990 × Gwangju − 5.917 × Ulsan − 4.277 × Sejong − 10.378 × Gyeonggi − 6.536 × Gangwon − 6.261 × Chungbuk − 13.039 × Chungnam − 11.920 × Gyeongbuk − 3.607 × Gyeongnam − 9.649 × Jeonbuk − 9.424 × Jeonnam − 3.216 × Corridor-type − 4.573 × Mixed-type
4. Discussion
4.1. Targets for Application
To verify the regression equation calculated in Section 3, the EP was estimated for the 13 BEER-certified units and the EPR was calculated. These 13 units received certification after December 2013; thus, ER information was available but EP information was not. As such, the characteristics of the apartments and calculation coefficients used to obtain EP by applying Equation (5) are presented in Table 10.
4.2. Recalculation of EP and Analysis of EPR Test Results
The estimated EP values and the results of the EPR tests for the 13 units are shown in Table 11.
This study conducted a t-test to confirm whether differences exist between EP and ER. The average difference between EP and ER was 7.19, with t = 2.936 (p = 0.012). This indicated that, compared with the average EPR of 23.34 prior to the application of the regression analysis, the difference was reduced by 16.15. Moreover, a p value of 0.13 indicated that the results of the test between EP and ER were statistically significant.
Application of the above regression equation to the BEER would lead to a reduction of EPR. Therefore, in future calculations of EP, Corridor Type and Climate must be considered. The comparison showed that the EPR values of units A, B, and D (consisting of Corridor Type, Gyeonggi, and regional heating methods) were the lowest in Table 11, while those of units L and M (comprising Corridor Type, Chungbuk, and individual heating methods) were the highest in Table 11. Units A, B, D, L, and M have the same Corridor Type in Table 10. Therefore, considering that the order magnitude of influence of the factors affecting EPR in the regression equation is Corridor Type > Climate >> Heating Type in Section 3.2, it is evident that additional research is required for Climate classification.
The ambient temperature in the Climate reference point is directly related to the energy use, in order to match indoor air temperature (cooling: 26 °C, heating 20 °C) to predict EP [6]. If there is a large difference between the outdoor and indoor temperatures, more energy must be used to reduce the temperature difference while little energy must be used if the difference is small.
4.3. Discussion
In Section 4.1, we applied a calculation formula that weighted the Corridor Type and climatic reference points in order to increase the accuracy of the EP, which is the basis of the current BEER value. Results confirmed that the accuracy achieved is higher than that of the conventional EP calculation method. From examining the EPR of the unit, which has the same Corridor Type and heating method but different Climate reference points, the EPR of the unit located in Gyeonggi province was lower than that of the unit located in Kyungbuk. Therefore, additional research on Climate reference points is needed to accurately predict the EP.
In the US, the Leadership in Energy and environmental Design uses the ASHRAE Standard to calculate the energy efficiency of buildings, and selects the nearest 51 Climate reference points. In contrast, Korea’s BEER has only 13 Climate reference points. If the number of Climate reference points is small, the distance to the nearest reference point is larger, so the difference in Climate relative to that at the reference point is also large, and consequently, the EP accuracy is reduced. Therefore, the greater the number of EP climatic points, the higher the accuracy. In future work, we will study the differences in EPR when applying the ASHRAE Standard in EP calculations.
5. Conclusions
The BEER is considered an important system for restricting both energy usage and the emission of GHGs by buildings. However, despite its use over more than 10 years, the lack of ER disclosure has made it difficult to confirm whether buildings have been designed and operated effectively. Surprisingly, there have been no studies performed to compare EP and ER to confirm whether energy efficiency strategies of buildings have been maintained. Therefore, this study proposes improvement to the EP calculation as a method for improved regulation of building efficiencies through EPR.
The results of this study indicated that the factors of Corridor Type > Climate >> Heating Type had a combined influence of 30.7% in the calculation of EP used to predict energy usage. Based on a case analysis using the regression equation derived as part of this study, the resulting regression equation reduced the average difference in EPR (23.34) by 7.19. As such, calculating EP with consideration of Corridor Type, Climate, and Heating Type would lead to lower values of EPR and higher accuracy of the BEER.
Lower EPR values could mean that EP could be used for regulating the ER of buildings in the future. The results of this study, pertaining to the analysis of related factors and the regression equation, are expected to prove fundamental in providing a standard for GHG emissions of buildings.
Acknowledgments
This work was supported by the National Research Foundation of Korea (NRF) grant funded by the Korea government (No.NRF-2017R1D1A1B03027921) and the center for Women In Science, Engineering and Technology (WISET) Grant funded by the Ministry of Science, ICT & Future Planning of Korea(MSIP) under the Program for Returners into R&D.
Author Contributions
Won-Jun Park conceived, designed, and wrote the paper; Hye-Mi Kim edited the manuscript and provided revisions advice.
Conflicts of Interest
The authors declare no conflict of interest. The founding sponsors had no role in the design of the study, in the collection, analyses, or interpretation of data, in the writing of the manuscript, and in the decision to publish the results.
References
- United Nations Framework Convention on Climate Change. Available online: http://unfccc.int/paris_agreement/items/9485.php (accessed on 12 October 2017).
- Ministry of Land, Infrastructure, and Transport (MOLIT). POST-2020 Planning on Development of Greenhouse Gas Reduction in Building Sector; MOLIT: Sejong-si, Korea, 2016.
- Office for Government Policy Coordination, Prime Minister’s Secretariat; Greenhouse Gas Inventory & Research Center. National Greenhouse Gas Inventory Report of Korea; Office for Government Policy Coordination: Seoul, Korea, 2016.
- CAIT2.0 (WRI’s Climate Data Explorer). Available online: http://cait2.wri.org/wri/ (accessed on 12 October 2017).
- Greenhouse Gas Statistics from Annex I Countries (2016 CRF, 2006 IPCC GL applied), Total National Greenhouse Gas Emissions from the World Resources Institute, with data from UNFCCC, IEA, EPA, EIA and UN FAO (1990–2013). Available online: http://unfccc.int/ghg_data/new_reporting_requirements/items/9560.php (accessed on 4 April 2018).
- Ministry of Land, Infrastructure, and Transport (MOLIT), Law of Supporting Green Building, Ministry of Government Legislation, Korea. 2016; National Law Information Center. Available online: http://www.law.go.kr/lsSc.do?menuId=0&subMenu=1&query=%EB%85%B9%EC%83%89%EA%B1%B4%EC%B6%95%EB%B2%95#undefined (accessed on 24 September 2017).
- Statistics Canada. Energy Statistics Handbook 2017; Korea Energy Agency: Yongin-si, Korea, 2017.
- Ministry of Land, Infrastructure, and Transport (MOLIT), Regulations on Building Energy Efficiency Rating System and Zero Energy Building Certification. 2017; National Law Information Center. Available online: http://www.law.go.kr/lsSc.do?menuId=0&subMenu=1&query=%EC%97%90%EB%84%88%EC%A7%80%20%ED%9A%A8%EC%9C%A8%EB%93%B1%EA%B8%89#undefined (accessed on 12 October 2017).
- Energy Usage Rating System. Available online: http://www.greentogether.go.kr/ecm/cvl/index.do (accessed on 22 December 2017).
- Korea Green Building Certification System (G-SEED). Available online: http://gseed.greentogether.go.kr/sys/gms/selectGreenMain.do (accessed on 22 December 2017).
- Kim, H.M.; Park, W.J. A Comparison Analysis on the Changes in Energy Efficiency of the G-SEED Certified Apartment Buildings. AIK-RA J. 2017, 18, 171–182. [Google Scholar]
- Lin, J.; Cao, B.; Cui, S.; Wang, W.; Bai, X. Evaluating the effectiveness of urban energy conservation and GHG mitigation measures: The case of Xiamen city, China. Energy Policy 2010, 38, 5123–5132. [Google Scholar] [CrossRef]
- Bakar, N.N.A.; Hassan, M.Y.; Abdullah, H.; Rahman, H.A.; Abdullah, M.P.; Hussin, F.; Bandic, M. Energy efficiency index as an indicator for measuring building energy performance: A review. Renew. Sustain. Energy Rev. 2015, 44, 1–11. [Google Scholar] [CrossRef]
- D’Agostino, D.; Cuniberti, B.; Bertoldi, P. Energy consumption and efficiency technology measures in European non-residential buildings. Energy Build. 2017, 153, 72–86. [Google Scholar] [CrossRef]
- La Fleur, L.; Moshfegh, B.; Rohdina, P. Measured and predicted energy use and indoor Climate before and after a major renovation of an apartment building in Sweden. Energy Build. 2017, 146, 98–110. [Google Scholar] [CrossRef]
- Mattoni, B.; Guattari, C.; Evangelisti, L.; Bisegna, F.; Gori, P.; Asdrubali, F. Critical review and methodological approach to evaluate the differences among international green building rating tools. Renew. Sustain. Energy Rev. 2018, 82, 950–960. [Google Scholar] [CrossRef]
- Salvadori, G.; Fantozzi, F.; Rocca, M.; Leccese, F. The energy audit activity focused on the lighting systems in historical buildings. Energies 2016, 9, 998. [Google Scholar] [CrossRef]
- Pagliaro, F.; Cellucci, L.; Burattini, C.; Bisegna, F.; Gugliermetti, F.; de Lieto Vollaro, A.; Salata, F.; Golasi, I. A Methodological comparison between energy and environmental performance evaluation. Sustainability 2015, 7, 10324–10342. [Google Scholar] [CrossRef]
- Fantozzi, F.; Leccese, F.; Salvadori, G.; Tuoni, G. Energy demand analysis and energy labeling of new residential buildings in Tuscany (Italy). WIT Trans. Ecol. Environ. 2009, 122, 217–229. [Google Scholar] [CrossRef]
- Kontokosta, C.E.; Tull, C. A data-driven predictive model of city-scale energy use in buildings. Appl. Energy 2017, 197, 303–317. [Google Scholar] [CrossRef]
- Data on Number of Energy Efficiency Rating Certifications. Available online: http://www.molit.go.kr/USR/BORD0201/m_34879/LST.jsp?id=www_info&cate=&key=&search=&search_regdate_s=2015-11-16&search_regdate_e=2016-11-16&order=&desc=asc&srch_prc_stts=&item_num=0&search_dept_id=&search_dept_nm=&srch_usr_nm=N&srch_usr_titl=N&srch_usr_ctnt=N&srch_mng_nm=N&old_dept_nm=&search_gbn=&search_section=&source=&search1=&lcmspage=1 (accessed on 12 December 2017).
- Bang, M.S. A Study on Compatibility through Comparison Analysis between G-SEED and LEED: Focus on Housing Evaluation. Master’s Dissertation, Konkuk University, Seoul, Korea, 2014. [Google Scholar]
- Hur, J.W.; Lee, J.Y. An empirical study on the determinants of management fee of multi-family housing in Seoul. Korean Urban Manag. Assoc. 2011, 6, 173–185. [Google Scholar]
- Ha, K.M. Study on Approaches to Reduce Administrative Costs of Apartments by Means of Improved System. Master’s Thesis, Wonkwang University, Iksan, Korea, 2006. [Google Scholar]
- Building Research Establishment Environmental Assessment Method. BREEAM New Construction Technical Manual; BRE: Hong Kong, China, 2011. [Google Scholar]
- U.S. Green Building Council. LEED Reference Guide for Building Design and Construction; USGBC: Washington, DC, USA, 2013. [Google Scholar]
- U.S. Green Building Council. LEED v4 User Guide; USGBC: Washington, DC, USA, 2014. [Google Scholar]
- U.S. Green Building Council. Available online: http://www.usgbc.org/home (accessed on 25 March 2018).
- EnergyPlus. Energy Plus Engineering Reference. Available online: https://energyplus.net/sites/default/files/pdfs_v8.3.0/EngineeringReference.pdf (accessed on 4 April 2018).
- Energy Star. Available online: https://www.energystar.gov/about (accessed on 4 April 2018).
- Office of Air and Radiation, Climate Protection Partnerships Division. National Awareness of ENERGY STAR® for 2016: Analysis of 2016 CEE Household Survey. 2017. Available online: https://www.energystar.gov/awareness (accessed on 4 April 2018).
- Chris, B.; Carmen, C.F.; Jaren, C.P. Does the housing market value energy efficient homes? Evidence from the energy star program. Reg. Sci. Urban Econ. 2016, 57, 63–76. [Google Scholar] [CrossRef]
- CASBEE for New Construction. Technical Manual. Available online: http://www.ibec.or.jp/CASBEE/english/download/CASBEE-BD(NC)e_2014manual.pdf (accessed on 4 April 2018).
- Kim, Y.I.; Song, S.Y. Energy consumption status of apartment buildings and influence of various factors on energy consumption. J. Korean Sol. Energy Soc. 2014, 34, 93–102. [Google Scholar] [CrossRef]
- Lee, E.J. Evaluation of Building Energy Efficiency According to the Air-conditioner Installation in Collective Housing by Using ECO2 Software. Master’s Thesis, Seoul National University of Science and Technology, Seoul, Korea, 2016. [Google Scholar]
- Wang, J.; Kim, J.; Lee, K.; Park, I. G-seed: The revised Korean green building certification system. In Proceedings of the 30th International PLEA Conference, CEPT University, Ahmedabad, India, 6–18 December 2014. [Google Scholar]
Figure 1.
Korea’s greenhouse gas emission volumes by sector, and its industry weightings.

Figure 2.
Industry-specific greenhouse gas emissions.

Figure 3.
Ratio of the overall gross floor area in Korean buildings.

Figure 4.
Number of Building Energy Efficiency Rating (BEER)-certified buildings in Korea annually.


Figure 6.
Analysis process.

Figure 7.
Distributions of all and analyzed units. (a) Distribution of all units; (b) Distribution of 195 analyzed units.
Figure 7.
Distributions of all and analyzed units. (a) Distribution of all units; (b) Distribution of 195 analyzed units.


Table 1.
Greenhouse gas emissions by country [3].
Table 1.
Greenhouse gas emissions by country [3].
| Nation | 1990 | 2000 | 2012 | 2013 | 2014 | Growth over 1990 Level (%) | Growth over 2013 Level (%) | Source | |
|---|---|---|---|---|---|---|---|---|---|
| 1 | China | 3154 | 4480 | 11,250 | 11,735 | 12,222 | 287.5 | 4.2 | [4] |
| 2 | United States of America * | 6397 | 7259 | 6643 | 6800 | 6870 | 7.4 | 1.0 | [5] |
| 3 | India | 1189 | 1679 | 2831 | 2909 | 3009 | 153.1 | 3.4 | [4] |
| 4 | Russia | 3940 | 2433 | 2871 | 2815 | 2812 | −28.6 | −0.1 | [5] |
| 5 | Japan * | 1271 | 1387 | 1390 | 1408 | 1364 | 7.3 | −3.1 | [5] |
| 6 | Brazil | 556 | 722 | 992 | 1018 | 1088 | 95.6 | 6.9 | [4] |
| 7 | Germany * | 1246 | 1041 | 925 | 944 | 900 | −27.8 | −4.6 | [5] |
| 8 | Indonesia | 380 | 539 | 722 | 744 | 760 | 99.8 | 2.1 | [4] |
| 9 | Iran | 251 | 443 | 662 | 717 | 749 | 199.0 | 4.5 | [4] |
| 10 | Canada * | 613 | 744 | 718 | 731 | 732 | 19.5 | 0.1 | [5] |
| 11 | Mexico * | 427 | 584 | 741 | 733 | 718 | 68.2 | −2.1 | [4] |
| 12 | Korea * | 293 | 501 | 687 | 697 | 691 | 135.6 | −0.8 | - |
| 13 | Saudi Arabia | 188 | 278 | 538 | 547 | 556 | 196.5 | 1.7 | [4] |
| 14 | United Kingdom * | 800 | 717 | 583 | 570 | 527 | −34.1 | −7.5 | [5] |
| 15 | Australia * | 419 | 483 | 537 | 527 | 522 | 24.8 | −0.9 | [5] |
* Organization for Economic Cooperation and Development member state.
Table 2.
Comparison of building energy management systems overseas and in Korea.
| Classification | Post Management of Efficient Energy Systems Overseas | Post Management of Efficient Energy Systems in Korea | |||
|---|---|---|---|---|---|
| Europe The Energy Performance of Buildings Directive [25,26,27,28,29] | United States of America Energy Star [30,31,32] | Japan Comprehensive Assessment System for Built Environment Efficiency [33] | Green Building Certification System [6,10] | Building Energy Efficiency Certification System [6] | |
| Target | All building types | Residential and nonresidential buildings | Office, school, sales facility, restaurant, meeting facilities, factory, hospital, hotel, common house | Common housing, complex building (residential), business building, hotel, sale facilities, school | Apartments and commercial buildings (not a mandatory system) |
| Range for evaluation | Energy performance, building hardware for improving housing efficiency | Evaluation of the overall building performance | Evaluation of environmental building performance | Evaluation of the overall building performance | Energy reduction rate |
| Evaluation items | Building energy efficiency Ways to improve energy efficiency in housing |
| 1. Environmental quality performance
|
| Analysis of “primary energy requirements per annual unit area” such as air conditioning, hot water supply, lighting, and ventilation |
| Certification grade | Not classified | Four grades | Five grades | Four grades | Ten grades |
Table 3.
Building Energy Consumption Certification (BECC) standards are applied based on regional equivalents of areas (city/province) based on the area ranges.
Table 3.
Building Energy Consumption Certification (BECC) standards are applied based on regional equivalents of areas (city/province) based on the area ranges.
| Range | 1 | 2 | 3 | 4 | 5 | 6 |
|---|---|---|---|---|---|---|
| Area for exclusive use (m2) | <40 | 40–60 | 60–85 | 85–135 | 135–165 | 165< |
Table 4.
Method adopted for the extraction of study units.
| Units with Energy Efficiency Rating | Pre-Certification | 2151 | ||
|---|---|---|---|---|
| Actual Certification | 1058 | |||
| Evaluation criteria 1 | Evaluation criteria 2 | |||
| Level 1. | Certified prior to December 2013 | 902 | Certified post December 2013 | 156 |
| Level 2. | More than 500 households | 369 | More than 500 households | 79 |
| Level 3. | More than 1 year of usage | 369 | More than 1 year of usage | 21 |
| Level 4. | Final units selected | 195 | Final units selected | 13 |
Unit: apartment units.
Table 5.
General characteristics of analyzed units.
| Characteristic | Classification | Number of Units | Percentage (%) |
|---|---|---|---|
| Climate | Seoul | 34 | 17.4 |
| Incheon | 18 | 9.2 | |
| Daejeon | 12 | 6.2 | |
| Daegu | 6 | 3.1 | |
| Gwangju | 2 | 1.0 | |
| Ulsan | 2 | 1.0 | |
| Sejong | 9 | 4.6 | |
| Gyeonggi | 77 | 39.5 | |
| Gangwon | 3 | 1.5 | |
| Chungbuk | 3 | 1.5 | |
| Chungnam | 3 | 1.5 | |
| Gyeongbuk | 3 | 1.5 | |
| Gyeongnam | 11 | 5.6 | |
| Jeonbuk | 9 | 4.6 | |
| Jeonnam | 3 | 1.5 | |
| Corridor Type | Stair style | 154 | 79.0 |
| Corridor style | 26 | 13.3 | |
| Mixed style | 15 | 7.7 | |
| Heating Type | Individual heating | 66 | 33.8 |
| Regional heating | 129 | 66.2 |
Table 6.
Difference test for EP and ER.
| Classification | Number of Units | Average ± Standard Deviation | Average EPR Differences | t | p |
|---|---|---|---|---|---|
| EP | 195 | 35.87 ± 8.48 | 23.34 | 29.139 | 0.000 *** |
| ER | 195 | 12.53 ± 10.88 |
*** p < 0.001.
Table 7.
Nonparametric Kruskal–Wallis test on the subcategory of Climate.
| Characteristic | Classification | Number of Households | χ2 (p-Value) |
|---|---|---|---|
| Climate | Seoul | 34 | 35.940 (0.001 ***) |
| Incheon | 18 | ||
| Daejeon | 12 | ||
| Daegu | 6 | ||
| Gwangju | 2 | ||
| Ulsan | 2 | ||
| Sejong | 9 | ||
| Gyeonggi | 77 | ||
| Gangwon | 3 | ||
| Chungbuk | 3 | ||
| Chungnam | 3 | ||
| Gyeongbuk | 3 | ||
| Gyeongnam | 11 | ||
| Jeonbuk | 9 | ||
| Jeonnam | 3 |
*** p < 0.001.
Table 8.
Difference tests for EPR in relation to Corridor Type and Heating Type.
| Characteristic | Classification | Number of Households | Average ± Standard Deviation | p |
|---|---|---|---|---|
| Corridor Type | Stair style | 154 | 24.58 ± 11.19 | 0.005 ** |
| Corridor style | 26 | 20.13 ± 8.82 | ||
| Mixed style | 15 | 16.12 ± 11.57 | ||
| Heating Type | Individual heating | 67 | 24.64 ± 10.43 | 0.224 |
| Regional heating | 129 | 22.65 ± 11.5 |
** p < 0.01,
Table 9.
Dependent variable of EP in accordance with each factor.
| Unstandardized Coefficient | Standardized Coefficient | p | F | R2 | |||
|---|---|---|---|---|---|---|---|
| β | Standard Error | β | |||||
| Constant | 44.415 | 1.435 | 0.000 *** | 4.336 *** (0.000) | 0.307 | ||
| Climate | Seoul (base) | ||||||
| Incheon | −10.729 | 2.290 | −0.367 | 0.000 *** | |||
| Daejeon | −5.022 | 2.623 | −0.143 | 0.057 | |||
| Daegu | −6.637 | 3.274 | −0.136 | 0.044 * | |||
| Gwangju | −6.488 | 5.445 | −0.077 | 0.235 | |||
| Ulsan | −6.353 | 5.485 | −0.076 | 0.248 | |||
| Sejong | −3.776 | 2.903 | −0.094 | 0.195 | |||
| Gyeonggi | −10.030 | 1.664 | −0.580 | 0.000 *** | |||
| Gangwon | −6.989 | 4.644 | −0.102 | 0.134 | |||
| Chungbuk | −6.680 | 4.537 | −0.097 | 0.143 | |||
| Chungnam | −12.901 | 4.583 | −0.188 | 0.005 ** | |||
| Gyeongbuk | −12.305 | 4.500 | −0.179 | 0.007 ** | |||
| Gyeongnam | −3.859 | 2.631 | −0.105 | 0.144 | |||
| Jeonbuk | −9.959 | 2.839 | −0.247 | 0.001 ** | |||
| Jeonnam | −9.844 | 4.537 | −0.143 | 0.031 * | |||
| Corridor Type | Stair style (base) | ||||||
| Corridor style | −3.115 | 1.702 | −0.125 | 0.069 | |||
| Mixed style | −4.475 | 2.061 | −0.141 | 0.031 * | |||
| Heating Type | Individual heating (base) | ||||||
| Regional heating | −0.887 | 1.537 | −0.050 | 0.565 | |||
* p < 0.05, ** p < 0.01, *** p < 0.001.
Table 10.
EP values based on apartment characteristics.
| UNIT | Corridor Type | Climate | ||
|---|---|---|---|---|
| A | Corridor style | −3.216 | Gyeonggi | −10.378 |
| B | Corridor style | −3.216 | Gyeonggi | −10.378 |
| C | Mixed type | −4.573 | Gyeonggi | −10.378 |
| D | Corridor style | −3.216 | Gyeonggi | −10.378 |
| E | Mixed type | −4.573 | Gyeonggi | −10.378 |
| F | Corridor style | −3.216 | Gyeonggi | −10.378 |
| G | Corridor style | −3.216 | Gyeonggi | −10.378 |
| H | Corridor style | −3.216 | Gyeonggi | −10.378 |
| I | Stair style | 0 | Incheon | −11.159 |
| J | Mixed type | −4.573 | Incheon | −11.159 |
| K | Corridor style | −3.216 | Jeonbuk | 9.649 |
| L | Corridor style | −3.216 | Chungbuk | −6.261 |
| M | Corridor style | −3.216 | Chungbuk | −6.261 |
Table 11.
Estimated EP values and testing of EPR.
| Unit | EP Estimate | ER | EPR | Average EPR Difference | t | p |
|---|---|---|---|---|---|---|
| A | 30.44 | 30.435 | −2.56 | 7.19 | 2.936 | 0.012 ** |
| B | 30.44 | 31.02 | −0.58 | |||
| C | 29.08 | 14.58 | 14.50 | |||
| D | 30.44 | 30.78 | 0.34 | |||
| E | 29.08 | 13.90 | 15.18 | |||
| F | 30.44 | 19.83 | 10.61 | |||
| G | 30.44 | 25.97 | 4.47 | |||
| H | 30.44 | 16.85 | 13.59 | |||
| I | 32.88 | 22.2 | 10.67 | |||
| J | 28.30 | 38.95 | −10.65 | |||
| K | 31.16 | 27.05 | 4.11 | |||
| L | 34.55 | 18.70 | 15.85 | |||
| M | 34.55 | 15.93 | 18.62 |
** p < 0.01.
© 2018 by the authors. Licensee MDPI, Basel, Switzerland. This article is an open access article distributed under the terms and conditions of the Creative Commons Attribution (CC BY) license (http://creativecommons.org/licenses/by/4.0/).
Share and Cite
MDPI and ACS Style
Park, W.-J.; Kim, H.-M. Study on the Improvement of Expected Energy Savings and Actual Energy Savings in Apartments. Sustainability 2018, 10, 1089. https://doi.org/10.3390/su10041089
AMA Style
Park W-J, Kim H-M. Study on the Improvement of Expected Energy Savings and Actual Energy Savings in Apartments. Sustainability. 2018; 10(4):1089. https://doi.org/10.3390/su10041089
Chicago/Turabian StylePark, Won-Jun, and Hye-Mi Kim. 2018. "Study on the Improvement of Expected Energy Savings and Actual Energy Savings in Apartments" Sustainability 10, no. 4: 1089. https://doi.org/10.3390/su10041089
Note that from the first issue of 2016, this journal uses article numbers instead of page numbers. See further details here.