Motor Subtypes of Parkinson’s Disease Can Be Identified by Frequency Component of Postural Stability
by
 , , and
Saba Rezvanian
1 ,
,
Thurmon Lockhart
1,* ,
,
Christopher Frames
1,2,
Rahul Soangra
3 and
Abraham Lieberman
2 1
School of Biological and Health Systems Engineering, Arizona State University, Tempe, AZ 85281, USA
2
Barrow Neurological Institute, Phoenix, AZ 85013, USA
3
Department of Physical Therapy, Crean College of Health and Behavioral Sciences, Chapman University, Orange, CA 92866, USA
*
Author to whom correspondence should be addressed.
Sensors 2018, 18(4), 1102; https://doi.org/10.3390/s18041102
Submission received: 26 February 2018
/
Revised: 31 March 2018
/
Accepted: 4 April 2018
/
Published: 5 April 2018
(This article belongs to the Special Issue Sensors for Gait, Posture, and Health Monitoring)
Abstract
:Parkinson’s disease (PD) can be divided into two subtypes based on clinical features—namely tremor dominant (TD) and postural instability and gait difficulty (PIGD). This categorization is important at the early stage of PD, since identifying the subtypes can help to predict the clinical progression of the disease. Accordingly, correctly diagnosing subtypes is critical in initiating appropriate early interventions and tracking the progression of the disease. However, as the disease progresses, it becomes increasingly difficult to further distinguish those attributes that are relevant to the subtypes. In this study, we investigated whether a method using the standing center of pressure (COP) time series data can separate two subtypes of PD by looking at the frequency component of COP (i.e., COP position and speed). Thirty-six participants diagnosed with PD were evaluated, with their bare feet on the force platform, and were instructed to stand upright with their arms by their sides for 20 s (with their eyes open and closed), which is consistent with the traditional COP measures. Fast Fourier transform (FFT) and wavelet transform (WT) were performed to distinguish between the motor subtypes using the COP measures. The TD group exhibited larger amplitudes at the frequency range of 3–7 Hz when compared to the PIGD group. Both the FFT and WT methods were able to differentiate the subtypes. COP time series information can be used to differentiate between the two motor subtypes of PD, using the frequency component of postural stability.
1. Introduction
In 2010, approximately 630,000 people in the U.S. were diagnosed with Parkinson’s disease (PD)—a number that is estimated to double by 2040 [1]. PD is a progressive neurodegenerative disorder that includes motor and non-motor features [2]. PD can be further divided into two subtypes based on clinical features—namely tremor dominant (TD) and postural instability and gait difficulty (PIGD) [2,3,4,5]. This categorization is important at the early stage of PD, since identifying the PD subtypes can help to predict the clinical progression of the disease. Several studies have confirmed that the PIGD subtype has a faster disease progression and greater motor function impairment [6], and is less responsive to levodopa and deep brain stimulation when compared to the TD subtype [3,5,7,8]. It has also been reported that there is a correlation between the freezing of gait (FOG) score and the PIGD score [7]. Additionally, the PIGD subtype can place PD patients at a higher risk of falling when compared to TD patients [9]. It has been shown that PIGD patients have worse postural control when compared to TD patients [9,10]. Accordingly, correctly diagnosing subtypes can help caregivers to initiate early amenable interventions and track the progression of the disease. It should be noted that the diagnosis would not lead to a different medical treatment. However, another treatment needs to be taken alongside the medical treatment for PIGD patients in order to reduce the loss of balance and falling, since dopaminergic medications may result in limited improvement in postural instability and gait [11,12]. Thus, the diagnosis leads to the specific path that should be taken for the patient to manage the symptoms.
The differentiation of TD from PIGD is currently based on sub-scores of the Unified Parkinson’s Disease Rating Scale (UPDRS) [3,11]. The UPDRS is scored by clinicians, and thus is subjective and prone to error [12]. Subtype-specific biomarkers may improve the accuracy of the diagnoses that are relevant to the PD subtypes and progression.
The center of pressure (COP) measure is widely employed in assessing postural control, and has been utilized for analyzing the disease-related features in PD patients [13,14,15,16]. The results of different studies have indicated that COP was more variable for PD patients, relative to the control participants [14,15], and that COP-derived velocities were abnormally large for PD patients with FOG when compared to the patients without FOG [13]. Thus, COP is considered as a good measure for representing PD disease-related postural characteristics.
PD tremor is present while resting, and is typically dampened with kinetic movement. Therefore, in order to distinguish between the two subtypes, proposing a static test appears to be more appropriate than a dynamic task [17]. Several studies have reported a frequency range of 3–7 Hz for PD tremor [17,18,19]. It has also been demonstrated that the whole-body COP signal has a frequency lower than 2 Hz [20,21,22]. Subtype-specific postural instability in PD may be better identified by the frequencies that make up the COP signal. We hypothesized that the whole-body COP frequency may be a better and more objective means of identifying the PD subtypes. The most common method to investigate the tremor in PD is fast Fourier transformation (FFT) [5,6]. FFT transfers a signal from the time domain to the frequency domain. In this method, the time information is lost after the transformation. Therefore, a method such as wavelet transformation (WT)—which includes both the time and frequency information of the signal [7]—might help to diagnose the subtypes better than FFT. Based on the importance of correct PD subtype diagnosis and the lack of an objective method among the current diagnosis techniques, this study aims to develop an objective method to diagnose PD motor subtypes by employing COP data and using the FFT and WT methods.
2. Materials and Methods
2.1. Participants
Thirty-six participants that were diagnosed with PD by specialists at the Muhammad Ali Parkinson Center at the Barrow Neurological Institute (Phoenix, AZ, USA) were recruited for this study. The participants’ demographic information is presented in Table 1. The Movement Disorder Society Unified Parkinson’s Disease Rating Scale (MDS-UPDRS) was employed to identify the TD and PIGD groups [23]. The designated items for TD (kinetic and postural tremor in both the right and left hand; tremor—while at rest—of either the face and lips or the chain, arms, and legs) and PIGD (freezing, walking, posture, gait, and postural stability) were used to calculate the mean TD and PIGD scores. The ratio of the mean TD score to the mean PIGD score was used to identify the TD group. The patients with a ratio greater than or equal to 1.5 were classified as TD, while those with a ratio less than or equal to 1.0 were classified as PIGD. The patients with ratios ranging from 1.0 to 1.5 were classified as mixed-type, and were considered as an exclusionary criterion for this study [5,11,24].
The study was approved by the Institutional Review Board at the Barrow Neurological Institute and Arizona State University, Tempe, AZ, USA. The participants provided informed consent prior to their inclusion in the study. All of the assessments were performed while subjects were in the “on” medication status—approximately 1 to 1.5 h after taking the PD medication.
2.2. Experimental Procedure
The participants were placed with their bare feet on the force platform and were instructed to stand upright with their feet shoulder width apart and their arms by their sides for 20 s, and look straight ahead during the experiment. They were instructed not to talk or bend their knees throughout the experimental trials. Harnesses were fitted onto the participants to avoid falls. This task was performed under two conditions—namely eyes open and eyes closed. For the eyes closed condition, the subjects were asked to close their eyes during the experiment. Each participant performed the experiment under both conditions. Each condition had three trials.
2.3. Data Analysis
COP data were derived using force plate data sampled at 100 Hz. Both anterior–posterior (AP) and medial–lateral (ML) COP data were low-pass-filtered using a fourth-order, zero lag Butterworth filter with a cut-off frequency of 10 Hz. Five traditional COP measures were calculated to assess whether or not the two subtypes of PD can be distinguished by using the time domain information. The measures included the following: COP range (the range of COP displacement), resultant COP path length (the total COP trajectory length), resultant mean velocity (the resultant path length divided by the total duration), and a 95% confidence ellipse area (the smallest ellipse that will cover 95% of the points of the COP diagram). Based on previous studies, these traditional parameters are good indicators of postural instability [14,25,26] and were considered as variables that might help us to distinguish PIGD from TD. All of the analyses were performed in MATLAB version 2015a.
2.4. TD vs. PIGD Detection Method
In order to distinguish between the TD and PIGD subtypes, the following two methods were utilized: fast Fourier transform (FFT) and wavelet transform (WT). In the FFT method, the PD subtypes were identified by the frequency spectra of COP signals. Two frequency bands were introduced [27,28,29]: the COP band and the tremor band. The COP and tremor bands were defined as the frequency components from 0–3 Hz to 3–7 Hz, respectively. The detection method was defined as the ratio of the area under the power spectra of the tremor band to the summation of the areas under the power spectra of the COP band and the tremor band.
COP data were transformed into the wavelet domain using daubechies mother wavelet (db6). It was chosen because it has been widely employed in different human posture and movement studies [27,30]. Various mother wavelets were also applied to ensure that the optimal selection was made appropriately. The results supported the notion that daubechies mother wavelet was the best choice. In the WT method, the COP and tremor bands were defined as the scales that corresponded to the frequency ranges of 0–3 Hz and 3–7 Hz, respectively. The detection method was defined in a similar manner to the way it was defined in the FFT method: the ratio of the averaged WT coefficients of the tremor band to the summation of the averaged WT coefficients of the COP band and the tremor band. This ratio was unitless because it was a ratio of values with the same unit. In both methods, the defined ratio was multiplied by 100 in order to obtain a value between 0 and 100. Values that were closer to 100 indicated a higher possibility of the TD subtype, while the possibility of the PIGD subtype increased as the values approached 0. The first time derivative of COP time series was defined as COP velocity (V-COP). The ratio that was defined above was applied to COP (RCOP) and COP velocity (RVCOP) in both the AP and ML directions.
2.5. Statistical Analysis
Analysis of variance (ANOVA) with repeated measures on the traditional COP measures and the proposed detection ratio (using both the FFT and WT methods) were performed. Different factors—such as condition (two levels: eyes open (EO) and eyes closed (EC)) and group (or subtype) of PD (two levels: TD and PIGD)—were considered as within-subject and between-subject factors, respectively. Comparisons of interest exhibiting statistically significant differences (p < 0.05) were further analyzed using post hoc tests with Bonferroni corrections. In all analyses, sphericity assumptions were tested (Greenhouse–Geisser analysis). The diagnostic performance of the proposed method—or the accuracy of a test to discriminate between the subtypes—was further evaluated using receiver operating characteristic (ROC) curve analysis [31] for the directions and factors of both methods. In a ROC curve, the true positive rate (sensitivity) is plotted as a function of the false positive rate (100—specificity) at different cut-off points. Therefore, each point on the ROC curve corresponds to a sensitivity/specificity pair for a particular decision threshold. Therefore, the upper-left corner denotes a test with perfect discrimination (no overlap in the two distributions) in a ROC curve analysis. Accordingly, the closer the ROC curve is to the upper-left corner, the higher the overall accuracy of the test [31]. In this study, PD subtypes were diagnosed by utilizing UPDRS and were considered as a correct diagnosis. All of the statistical analyses were performed based on this assumption. In all tests, p < 0.05 was considered as a significant level. Statistical analyses were performed using IBM SPSS Statistics 22.
3. Results
The results of the traditional COP measures—under both the eyes open and eyes closed conditions—are provided in Table 2. All of the variables had larger values in the eyes closed condition compared to the eyes open condition. Because these parameters did not have a normal distribution, a Box-Cox transformation was applied and parametric methods were performed. There was no significant difference between the two groups for all the variables. However, there was a significant difference between the conditions for all of the parameters (range AP: F(1,34) = 4.252, p = 0.047; range ML: F(1,34) = 60.34, p = 0.001; path length: F(1,34) = 29.797, p = 0.001; mean velocity: F(1,34) = 29.795, p = 0.001; area: F(1,34) = 11.847, p = 0.002).
A power spectral analysis of the COP and COP velocity of a TD patient and a PIGD patient are plotted in Figure 1, revealing that both patients had frequency components ranging from 0 to 2 Hz in their COP and COP velocity signals. However, only the TD patient had an increase in power spectrum in the frequency band of 3–7 Hz. This increase was larger in the ML direction.
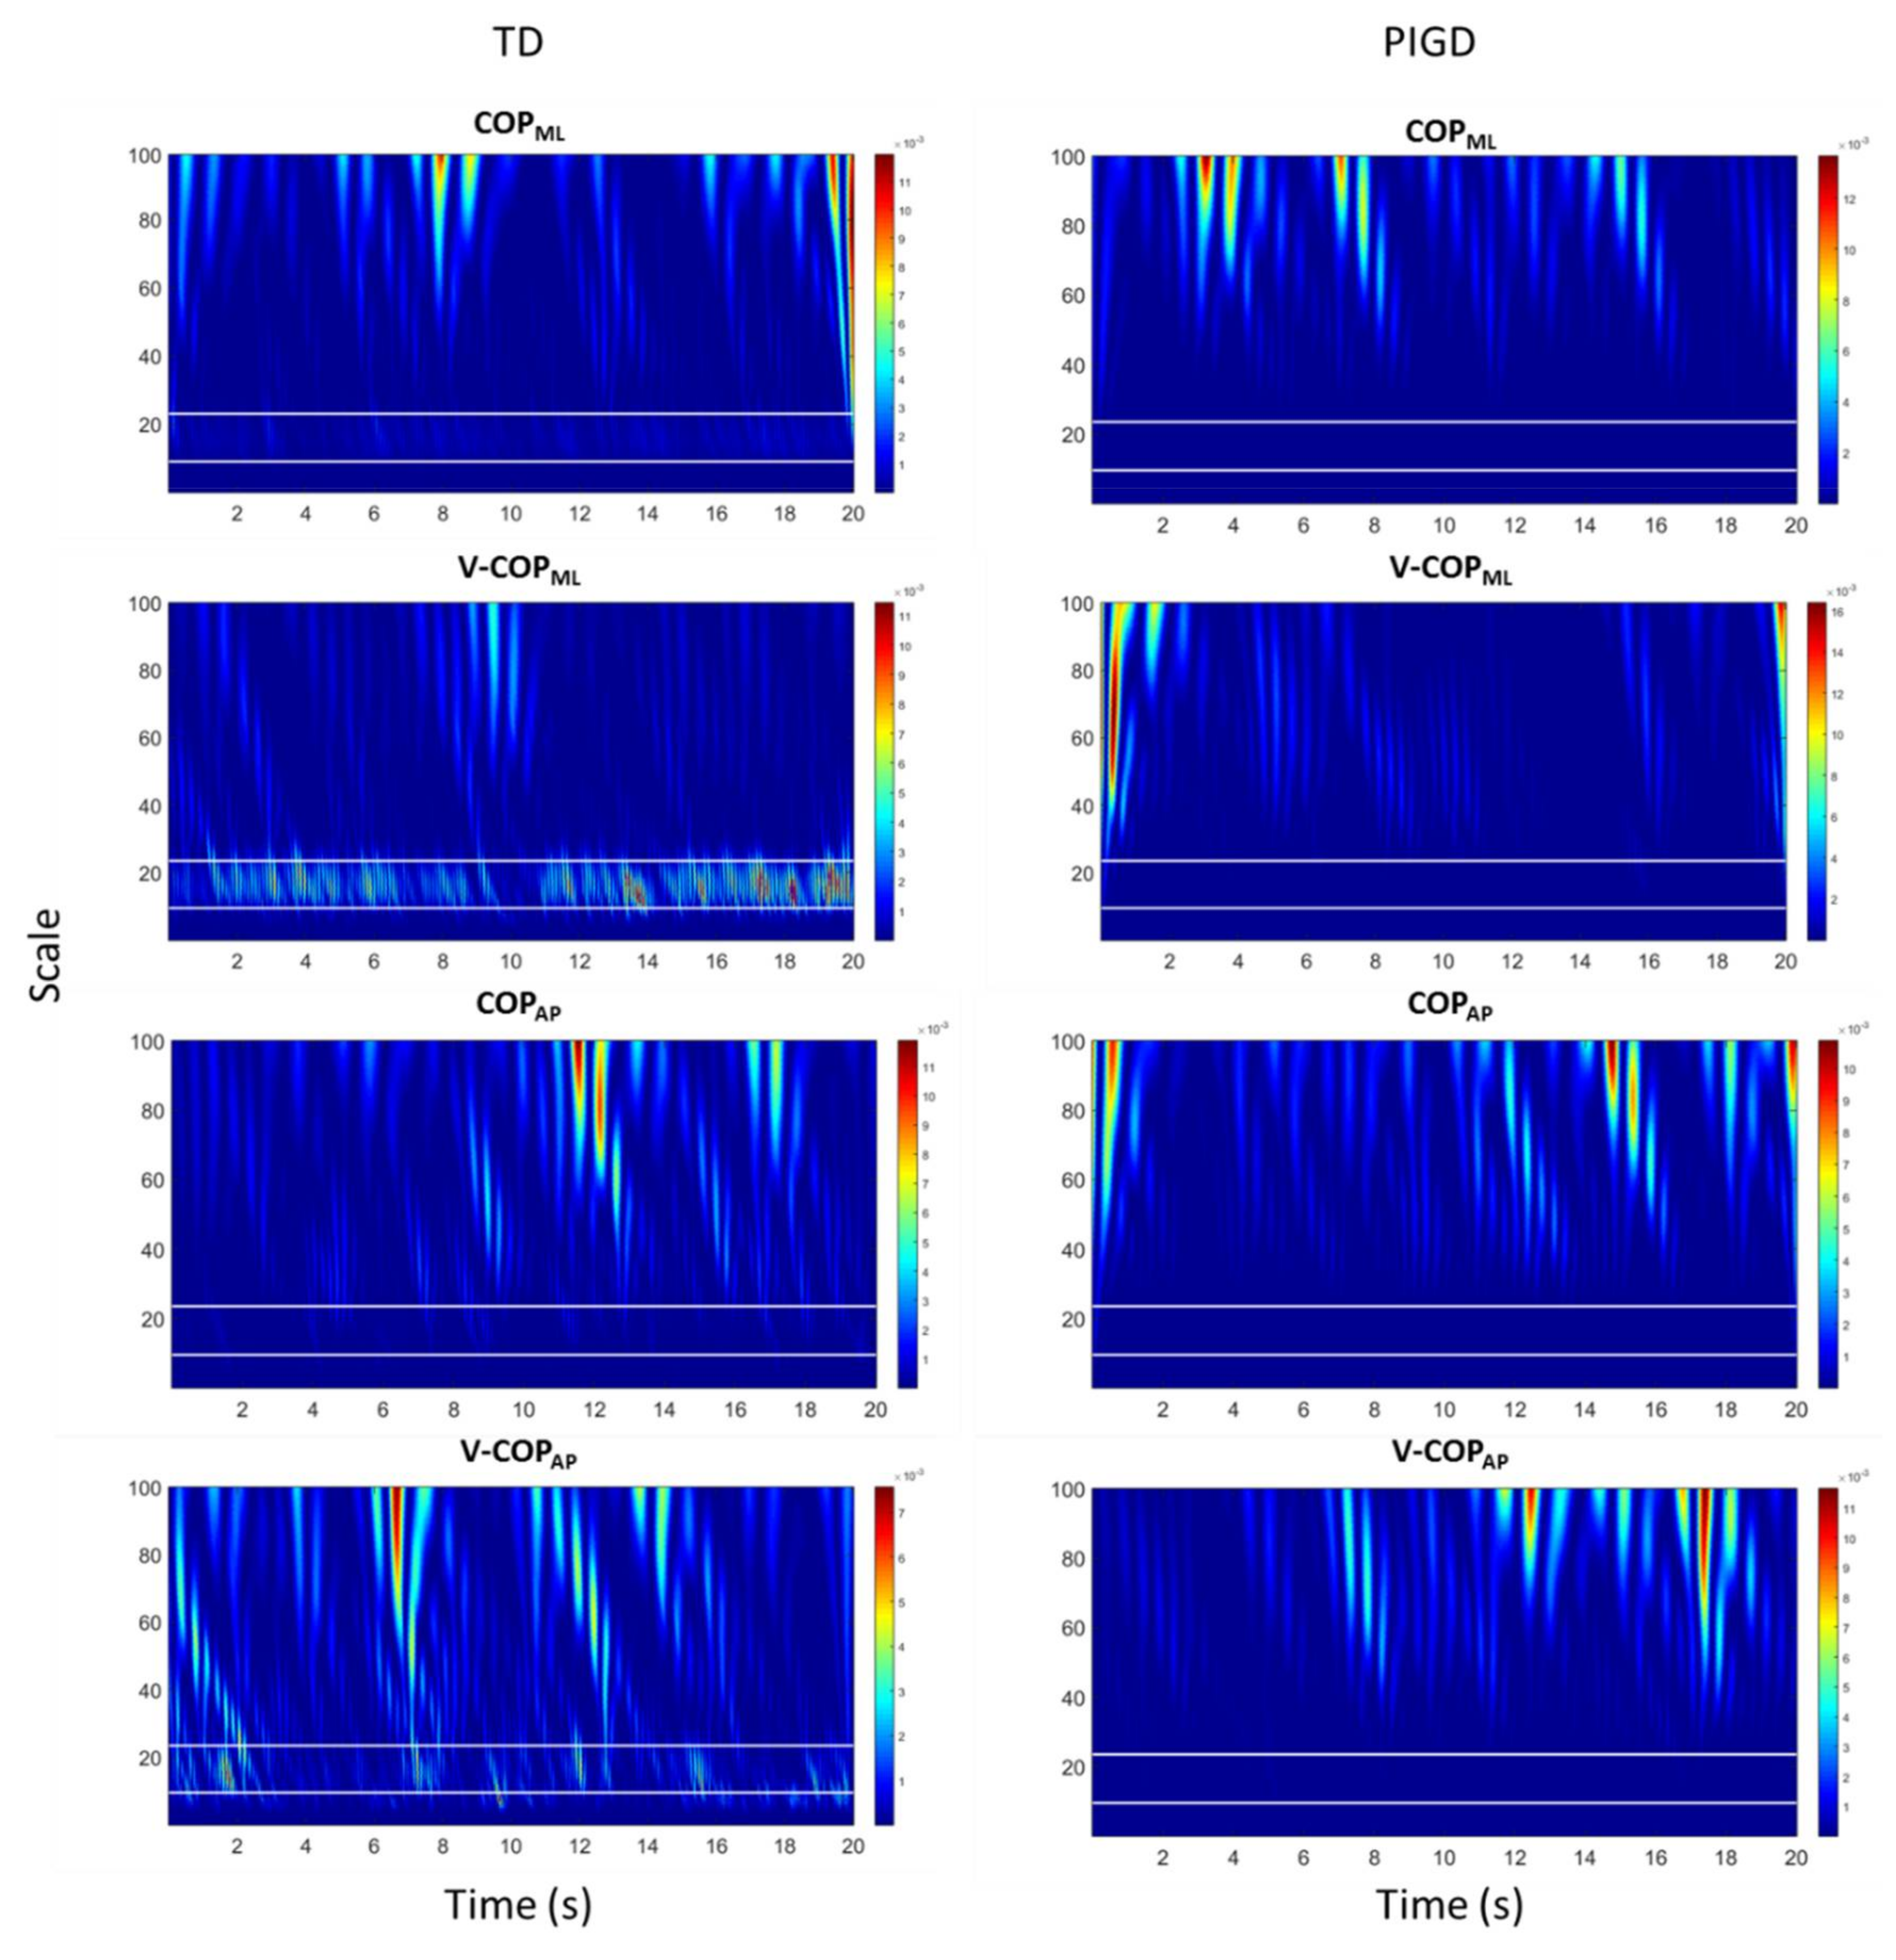
The WT of COP and COP velocity of a TD patient and a PIGD patient in both the ML and AP directions are plotted in Figure 2. The horizontal white lines in each figure indicate the PD tremor scale range corresponding to the frequency range of 3–7 Hz. The WT coefficients in Figure 2 display relatively larger values in the PD tremor scale range (i.e., lighter blue values appeared in between two horizontal white lines) for the TD patient when compared to the PIGD patient. Similar to the power spectral analysis (Figure 1), these increases were larger in the ML direction.
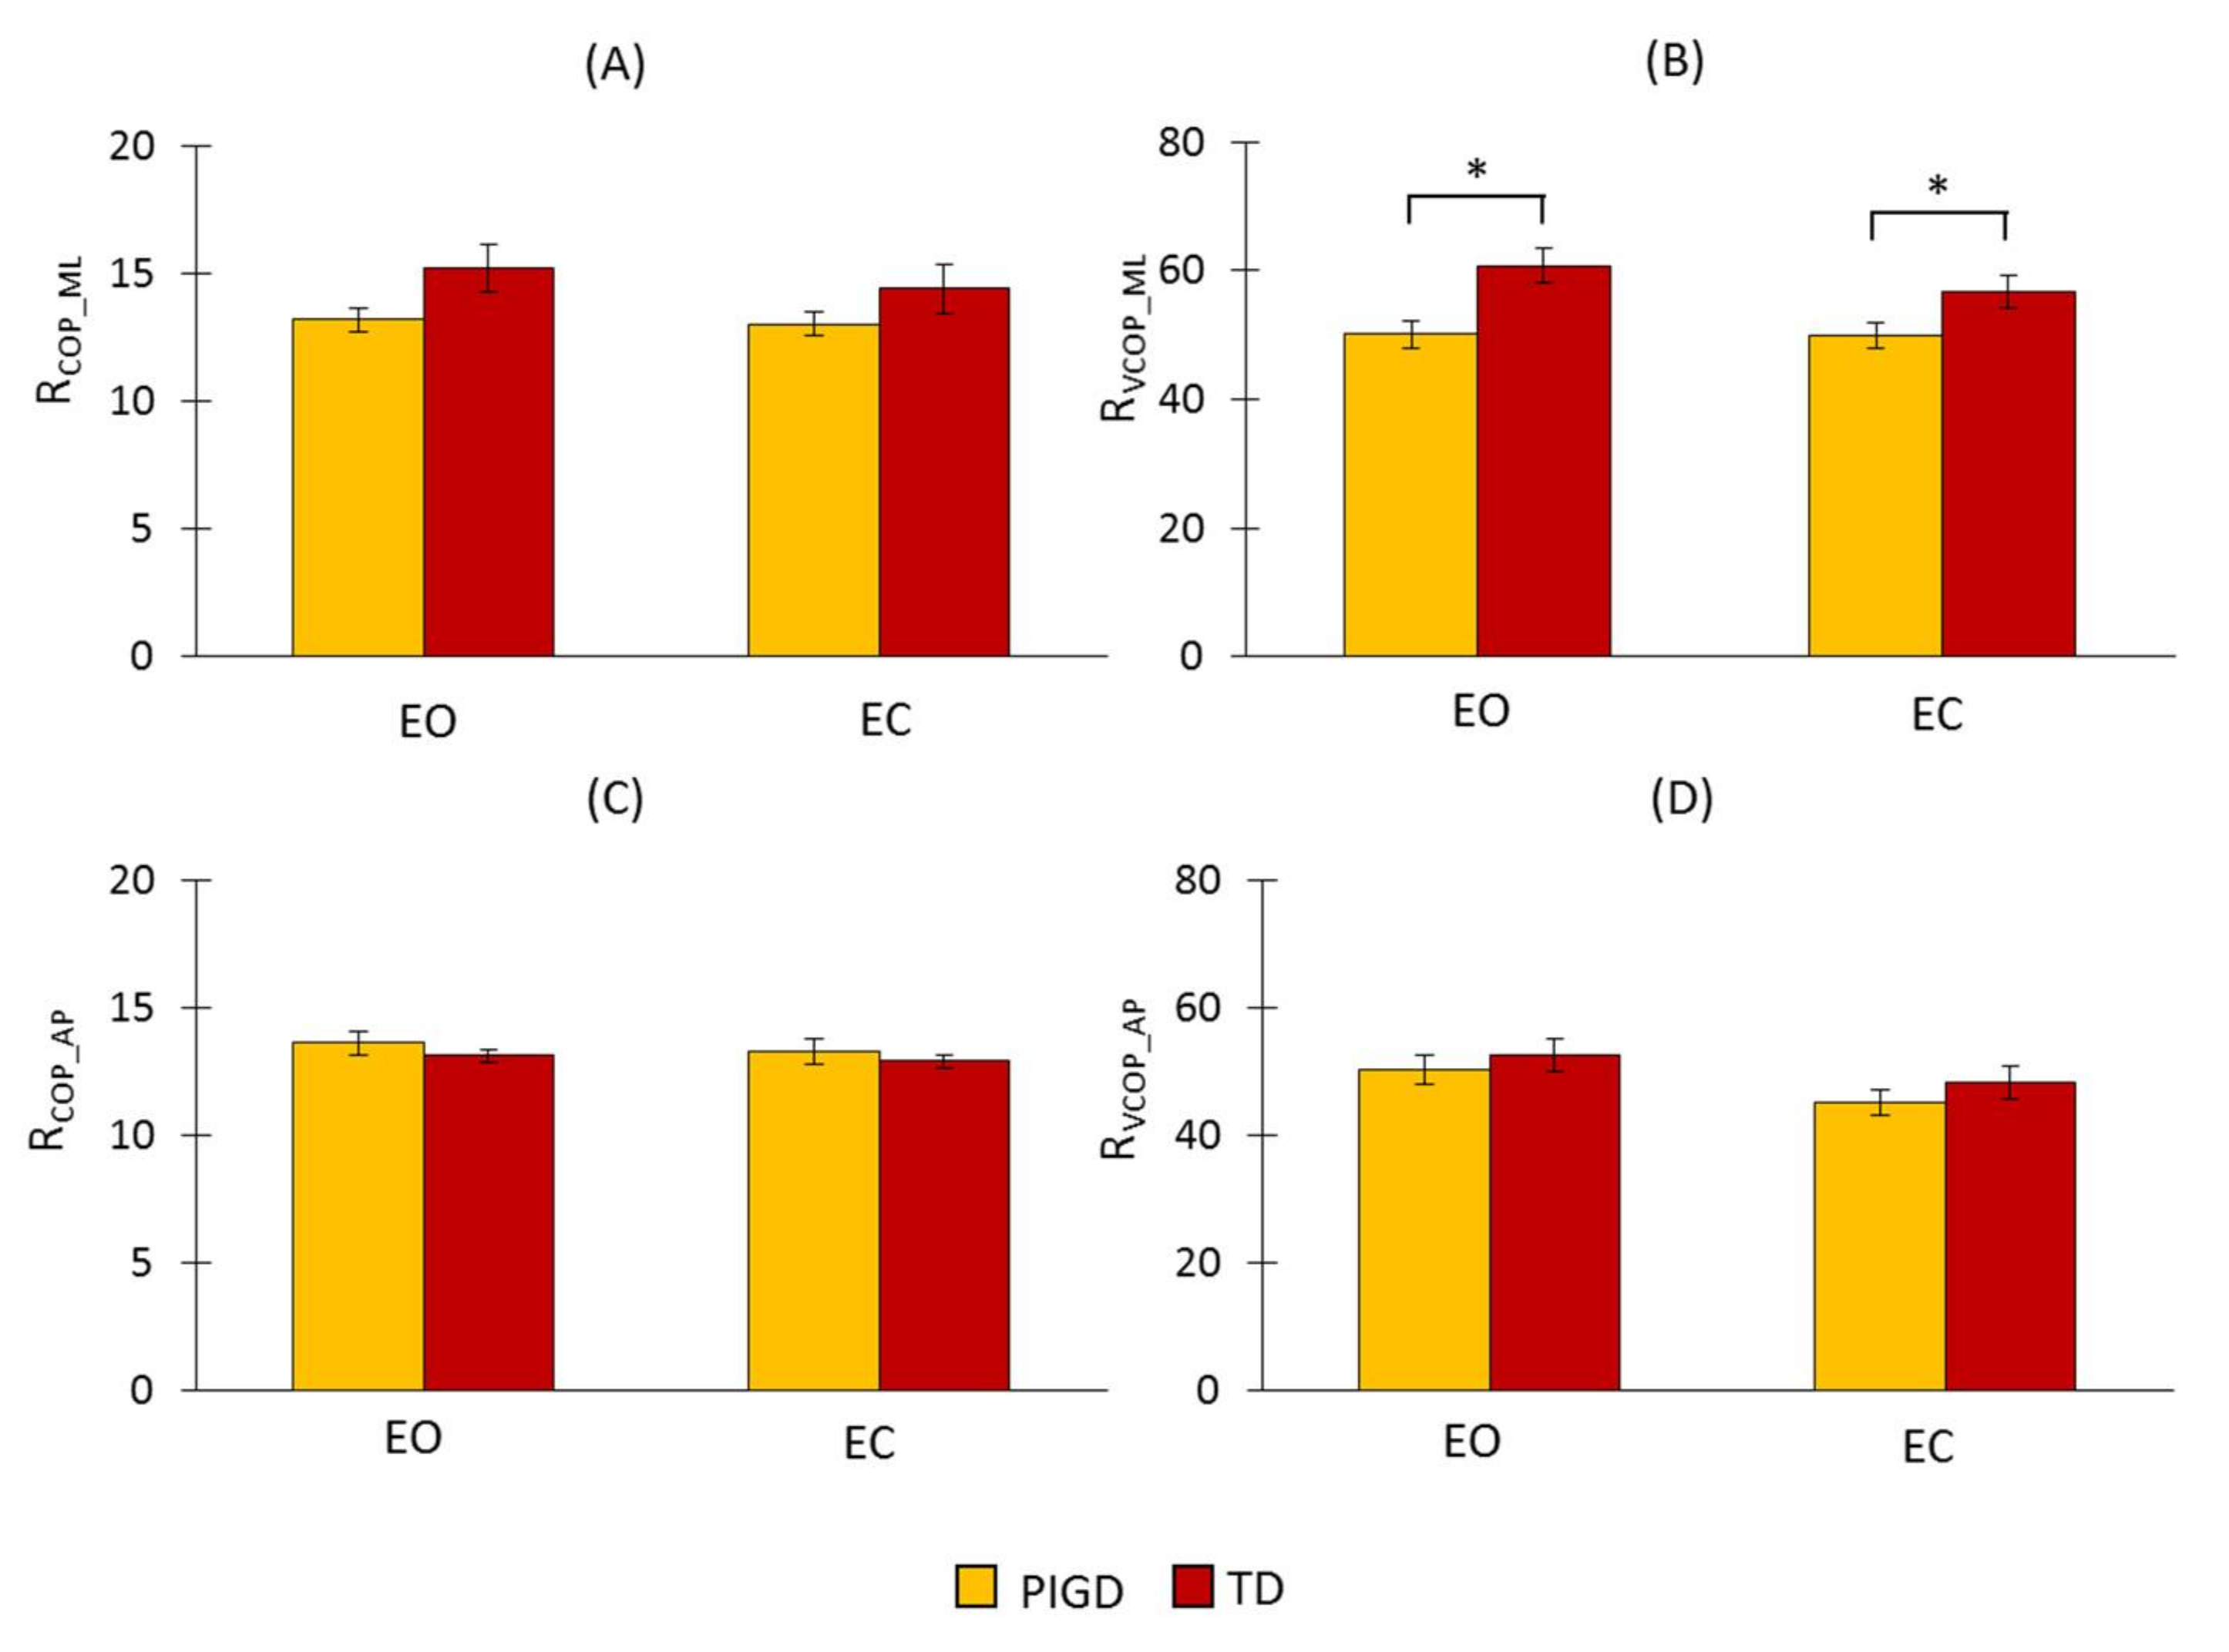
The results of the proposed detection ratio for COP and its velocity in both directions using FFT are presented in Figure 3. Neither the ratio of COP (RCOP_ML) nor its velocity (RVCOP_ML) in the ML direction were significantly different across the different conditions (RCOP_ML: F(1,34) = 2.006, p = 0.112; RVCOP_ML: F(1,34) = 2.67, p = 0.112). However, a statistically significant difference in RVCOP_ML across the groups (F(1,34) = 7.978, p = 0.008) was observed, although no significant difference was found in RCOP_ML (F(1,34) = 3.449, p = 0.072). In both RCOP_ML and RVCOP_ML, there was no significant interaction between the condition and the group (RCOP_ML: F(1,34) = 1.181, p = 0.285; RVCOP_ML: F(1,34) = 2.037, p = 0.163). RVCOP_ML was larger for the TD group than for the PIGD group (Figure 3A,B). This indicated that there were larger amplitudes in the frequency range of 3–7 Hz in this group. In the AP direction, there was no significant difference across the groups (RCOP_AP: F(1,34) = 0.498, p = 0.485; RVCOP_AP: F(1,34) = 0.628, p = 0.433) and the conditions (RCOP_AP: F(1,34) = 1.306, p = 0.201; RVCOP_AP: F(1,34) = 3.45, p = 0.08) in both RCOP_AP and RVCOP_AP.
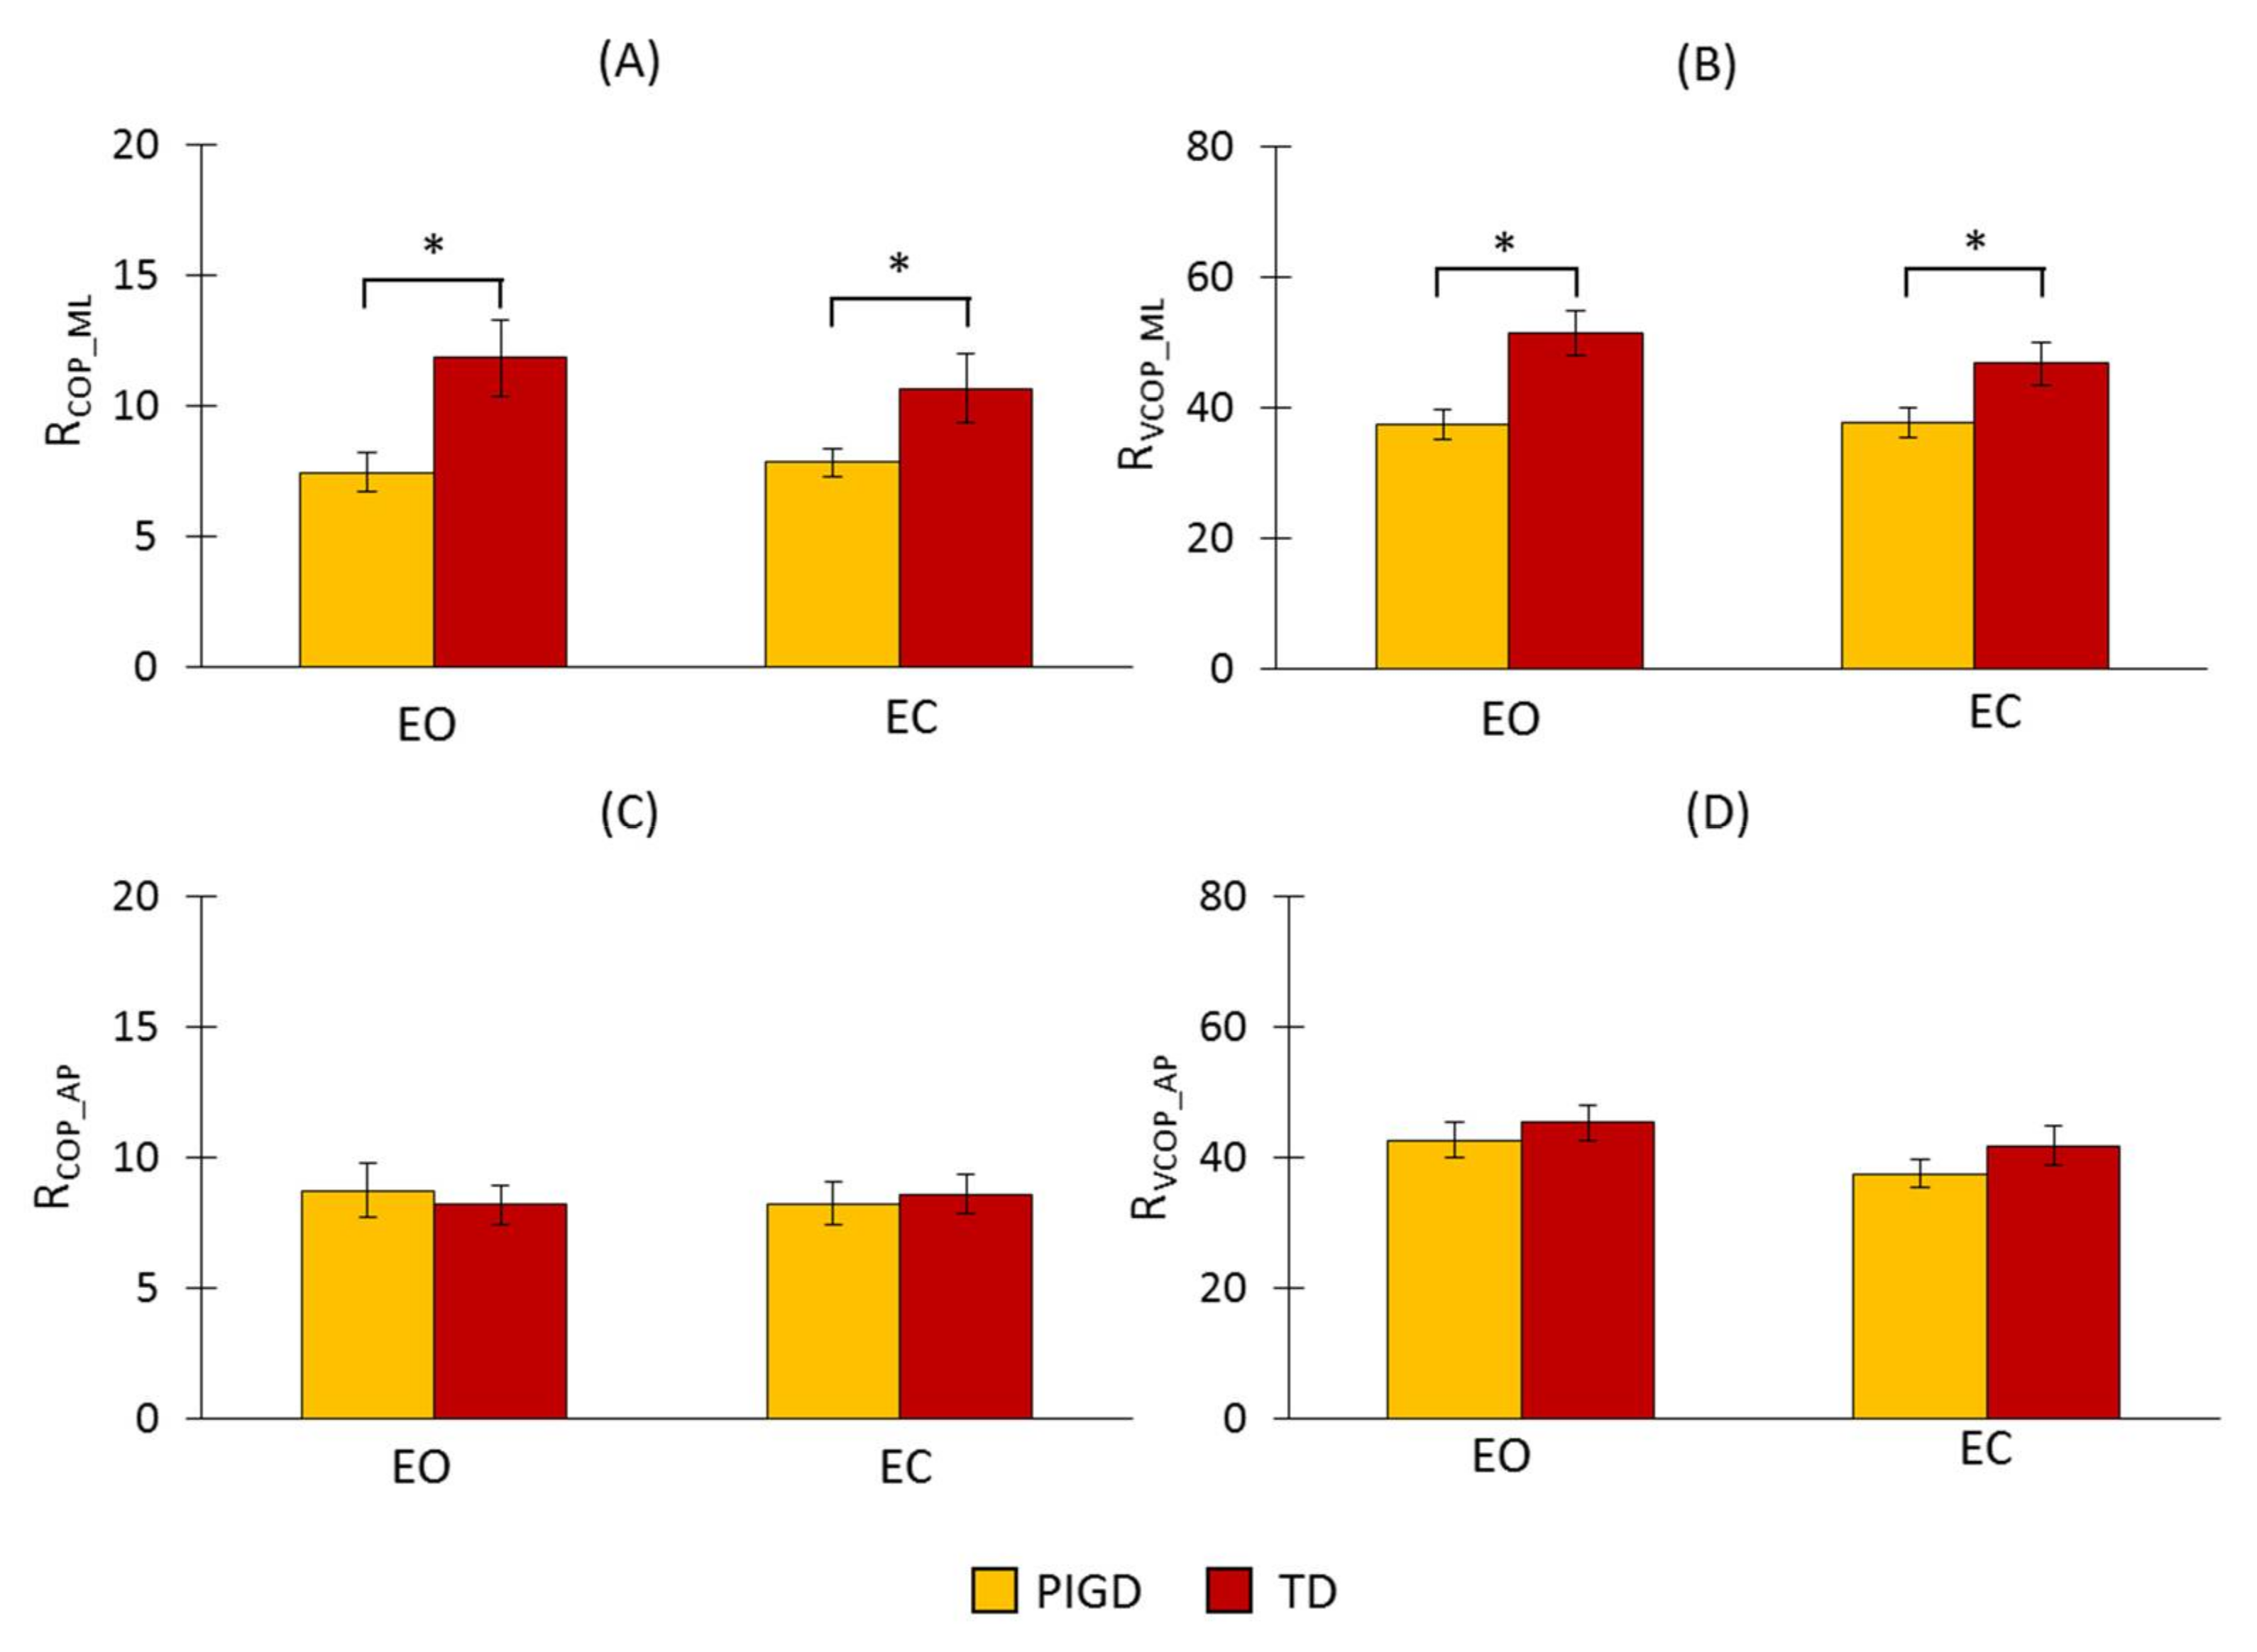
The explained WT method was applied to COP and its velocity in both directions. The results are presented in Figure 4. We found a significant difference between the groups for RCOP_ML and RVCOP_ML (RCOP_ML: F(1,34) = 7.589, p = 0.009; RVCOP_ML: F(1,34) = 10.066, p = 0.003), but no significant difference between the conditions (RCOP_ML: F(1,34) = 0.373, p = 0.814; RVCOP_ML: F(1,34) = 2.5, p = 0.123). There was no significant interaction between the conditions and the groups (RCOP_ML: F(1,34) = 3.044, p = 0.09; RVCOP_ML: F(1,34) = 2.828, p = 0.102). Both RCOP_ML and RVCOP_ML had larger values for the TD group than for the PIGD group (Figure 3A,B). These increases occurred because of the larger amplitude values in the scales corresponding to the frequency range of 3–7 Hz. In the AP direction, there were no significant differences across the groups (RCOP_AP: F(1,34) = 0.004, p = 0.952; RVCOP_AP: F(1,34) = 0.854, p = 0.362) or conditions (RCOP_AP: F(1,34) = 0.011, p = 0.916; RVCOP_AP: F(1,34) = 3.047, p = 0.091) in both RCOP_AP and RVCOP_AP.
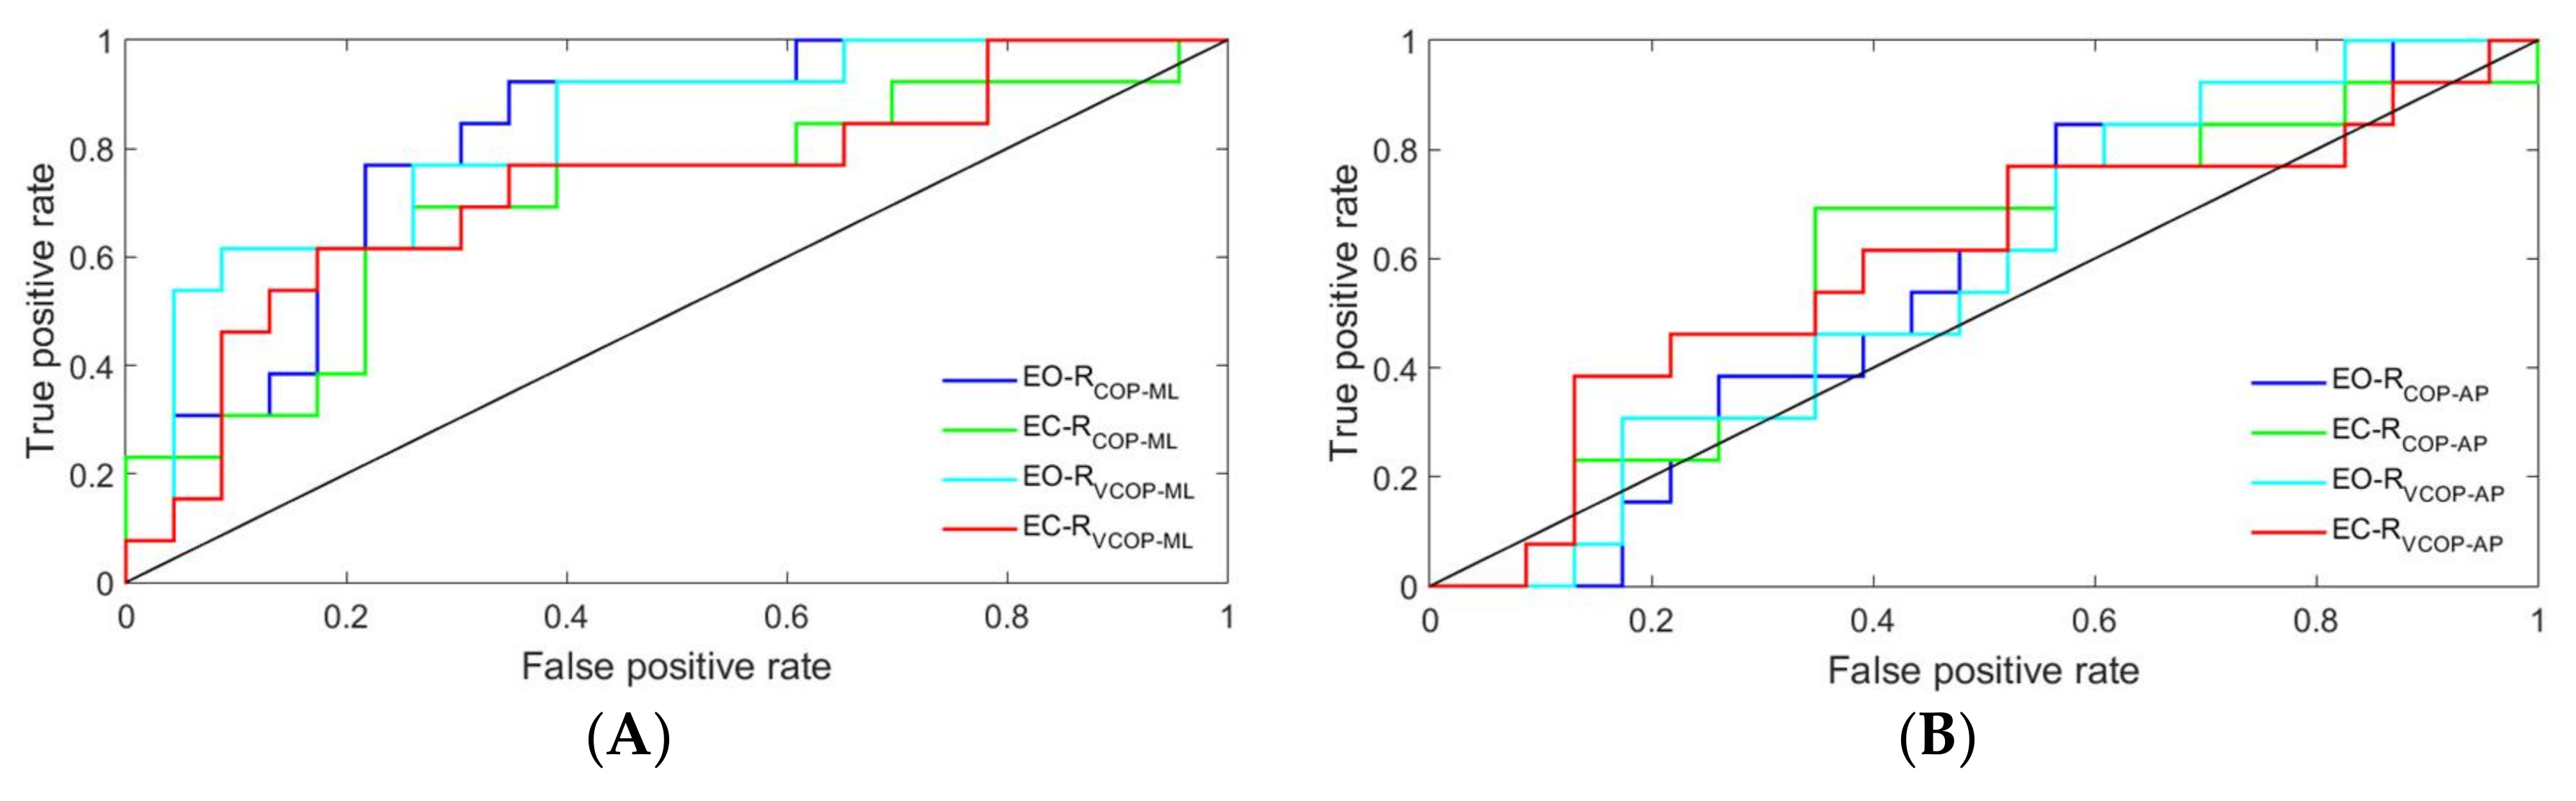
The ROC curves of the proposed detection ratio for COP and its velocity in both directions and under both conditions are plotted in Figure 5 and Figure 6 for the FFT and WT methods, respectively. In both methods, the ROC curves were closer to the upper-left corner in the ML direction than they were in the AP direction, which indicated a higher overall accuracy of the test in the ML direction [31].
The ROC curves were further analyzed by calculating the areas under each curve. The results are presented in Table 3. Only COP velocity data in the ML direction could significantly distinguish between the two subtypes using the FFT method. The results of the area under the ROC curves also revealed that the WT method could significantly distinguish between the two subtypes by using either COP or COP velocity data in the ML direction, regardless of the conditions.
4. Discussion
This study addressed subtype-specific biomarkers in order to classify the inherent heterogeneity of PD. This categorization can help to predict the clinical progression of the disease. Thus, the correct diagnosis of the subtypes can assist caregivers in initiating early amenable interventions and managing symptoms. The COP time series of PD patients were analyzed to distinguish between the two subtypes of PD. To the best of our knowledge, this study is the first to attempt to objectively diagnose the TD and PIGD subtypes of PD. Postural stability is maintained through neuromuscular feedback loops and open loop control processes that constantly adapt to internal and external perturbations [32,33]. Utilizing specific statistical and numerical tools, these control mechanisms can be quantified to identify neuromuscular changes that occur with pathology. Thus, traditional linear postural measures and Fourier transformation were applied to the COP time series and the increment of the COP time series in both the AP and ML directions. Furthermore, in order to quantify the changes in COP dynamics that occur at multiple timescales, a wavelet transform was employed to infer the underlying nature and control mechanisms involved in balance maintenance and the disease state.
In the traditional measures of postural sway, the parameters that denoted the magnitude of the postural movements were unable to discriminate between the TD and PIGD subtypes (Table 2). However, when visual information was occluded, a coincident decrease in postural stability was reflected in both subtypes for the linear postural measures (i.e., COP range, mean velocity, path length, and a 95% confidence ellipse area). These results were consistent with previous investigations regarding postural stability in PD patients [34].
Both the power spectral density and the WT of the COP time series and its velocity (Figure 1 and Figure 2) revealed an increase in the 3–7 Hz frequency range of the TD group, a frequency spectra that is reportedly symptomatic of parkinsonian tremor [17,18,19]. In fact, the ML COP data exhibited a greater frequency content than the AP COP data, which was consistent with previous investigations, which reported that PD patients exhibited increased ML sway amplitude, decreased AP sway amplitude, and possibly postural inflexibility in the AP direction [15,35,36,37]. In this context, the preponderance of the ML frequency in the ML direction, coupled with the impaired movement in the AP direction, suggested an underlying postural inflexibility in PD patients, where the tremor reflected in the ML time domain might be a consequence of the AP direction’s inability to contain movements in a higher frequency range [35,38,39]. Our proposed ratio was not able to show a statistically significant difference between the TD and PIGD patients in the AP direction using either of the methods—even accounting for both COP and COP velocity. The reason was that the tremor frequency had a larger amplitude in the ML direction than it did in the AP direction (as shown in Figure 1 and Figure 2). However, both the FFT and WT methods were able to distinguish the TD patients from the PIGD patients using the ML-COP velocity signal, while only the WT method was able to specify the subtype with the COP position time series. This could be explained by the fact that the FFT method used only the frequency information from the signals, while the WT method employed both the frequency and time components. The information from the signals that was utilized by WT enabled us to specify the subtypes of PD using both COP and COP velocity. Additionally, FFT displayed significant results when it employed COP velocity—as opposed to COP in itself—because the velocity of the signal was a first time derivative of the signal, which captured more variation of the signal. Hence, FFT could assess more information about the signals when it employed COP velocity. The results of the proposed method were consistent across both conditions (EO and EC) in both methods (FFT and WT). This consistency indicated the strength of the proposed diagnostic method using the proposed ratio. Although the proposed method can distinguish the TD from the PIGD subtypes, further studies are required to define the threshold value ranges that can classify the patients.
Acknowledgments
This research was supported by the NSF-Information and Intelligent Systems (IIS) and Smart and Connected Health (1065442, and 1547466, and secondary 1065262).
Author Contributions
Saba Rezvanian and Thurmon Lockhart conceived and designed the experiments; Saba Rezvanian and Christopher Frames performed the experiment; Saba Rezvanian analyzed the data and wrote the manuscript with support from Thurmon Lockhart, Abraham Lieberman and Rahul Soangra. All authors discussed the results and contributed to the final manuscript.
Conflicts of Interest
The authors declare no conflicts of interest.
Ethical Statements
All subjects gave their informed consent for inclusion before they participated in the study. The study was conducted in accordance with the Declaration of Helsinki, and the protocol was approved by the St. Joseph′s Hospital and Medical Center (PHX-16-0227-71-04).
References
- Kowal, S.L.; Dall, T.M.; Chakrabarti, R.; Storm, M.V.; Jain, A. The current and projected economic burden of Parkinson’s disease in the United States. Mov. Disord. 2013, 28, 311–318. [Google Scholar] [CrossRef] [PubMed]
- Fahn, S.; Jankovic, J.; Hallett, M. Principles and Practice of Movement Disorders; Elsevier Health Sciences: New York, NY, USA, 2011. [Google Scholar]
- Chen, H.M.; Wang, Z.J.; Fang, J.P.; Gao, L.Y.; Ma, L.Y.; Wu, T.; Hou, Y.N.; Zhang, J.R.; Feng, T. Different Patterns of Spontaneous Brain Activity between Tremor-Dominant and Postural Instability/Gait Difficulty Subtypes of Parkinson’s Disease: A Resting-State fMRI Study. CNS Neurosci. Ther. 2015, 21, 855–866. [Google Scholar] [CrossRef] [PubMed]
- Thenganatt, M.A.; Jankovic, J. Parkinson disease subtypes. JAMA Neurol. 2014, 71, 499–504. [Google Scholar] [CrossRef] [PubMed]
- Jankovic, J.; McDermott, M.; Carter, J.; Gauthier, S.; Goetz, C.; Golbe, L.; Huber, S.; Koller, W.; Olanow, C.; Shoulson, I. Variable expression of Parkinson’s disease: A base-line analysis of the DATATOP cohort. The Parkinson Study Group. Neurology 1990, 40, 1529–1534. [Google Scholar] [CrossRef] [PubMed]
- Jankovic, J.; Kapadia, A.S. Functional decline in Parkinson disease. Arch. Neurol. 2001, 58, 1611–1615. [Google Scholar] [CrossRef] [PubMed]
- Rajput, A.H.; Pahwa, R.; Pahwa, P.; Rajput, A. Prognostic significance of the onset mode in parkinsonism. Neurology 1993, 43, 829–830. [Google Scholar] [CrossRef] [PubMed]
- Mehanna, R.; Lai, E.C. Deep brain stimulation in Parkinson’s disease. Transl. Neurodegener. 2013, 2, 22. [Google Scholar] [CrossRef] [PubMed]
- Rudzińska, M.; Marona, M.; Bukowczan, S.; Banaszkiewicz, K.; Mirek, E.; Szczudlik, A. Falls in different types of Parkinson’s disease. Neurol. Neurochir. Pol. 2007, 41, 395–403. [Google Scholar]
- Herman, T.; Rosenberg-Katz, K.; Jacob, Y.; Auriel, E.; Gurevich, T.; Giladi, N.; Hausdorff, J.M. White Matter Hyperintensities in Parkinson’s Disease: Do They Explain the Disparity between the Postural Instability Gait Difficulty and Tremor Dominant Subtypes? PLoS ONE 2013, 8, e55193. [Google Scholar] [CrossRef] [PubMed] [Green Version]
- Stebbins, G.T.; Goetz, C.G.; Burn, D.J.; Jankovic, J.; Khoo, T.K.; Tilley, B.C. How to identify tremor dominant and postural instability/gait difficulty groups with the movement disorder society unified Parkinson’s disease rating scale: Comparison with the unified Parkinson’s disease rating scale. Mov. Disord. 2013, 28, 668–670. [Google Scholar] [CrossRef] [PubMed]
- Mds, T.; Goetz, C.G.; Poewe, W.; Rascol, O.; Christina, S. The Unified Parkinson’s Disease Rating Scale (UPDRS): Status and Recommendations. Mov. Disord. 2003, 18, 738–750. [Google Scholar]
- Schlenstedt, C.; Muthuraman, M.; Witt, K.; Weisser, B.; Fasano, A.; Deuschl, G. Postural control and freezing of gait in Parkinson’s disease. Park. Relat. Disord. 2016, 24, 107–112. [Google Scholar] [CrossRef] [PubMed]
- Schmit, J.M.; Riley, M.A.; Dalvi, A.; Sahay, A.; Shear, P.K.; Shockley, K.D.; Pun, R.Y.K. Deterministic center of pressure patterns characterize postural instability in Parkinson’s disease. Exp. Brain Res. 2006, 168, 357–367. [Google Scholar] [CrossRef] [PubMed]
- Rocchi, L.; Chiari, L.; Cappello, A.; Horak, F.B. Identification of distinct characteristics of postural sway in Parkinson’s disease: A feature selection procedure based on principal component analysis. Neurosci. Lett. 2006, 394, 140–145. [Google Scholar] [CrossRef] [PubMed]
- Diab, K.S.; Hale, L.A.; Waters, D.L.; Skinner, M.A. Factors contributing to postural instability in patients with idiopathic Parkinson’s disease. Phys. Ther. Rev. 2014, 19, 302–327. [Google Scholar] [CrossRef]
- Hallett, M. Overview of human tremor physiology. Mov. Disord. 1998, 13 (Suppl. S3), 43–48. [Google Scholar] [CrossRef] [PubMed]
- Lemstra, A.W.; Verhagen Metman, L.; Lee, J.I.; Dougherty, P.M.; Lenz, F.A. Tremor-frequency (3–6 Hz) activity in the sensorimotor arm representation of the internal segment of the globus pallidus in patients with Parkinson’s disease. Neurosci. Lett. 1999, 267, 129–132. [Google Scholar] [CrossRef]
- Timmermann, L.; Gross, J.; Dirks, M.; Volkmann, J.; Freund, H.-J.; Schnitzler, A. The cerebral oscillatory network of parkinsonian resting tremor. Brain 2003, 126, 199–212. [Google Scholar] [CrossRef] [PubMed]
- Freitas, S.M.S.F.; Wieczorek, S.A.; Marchetti, P.H.; Duarte, M. Age-related changes in human postural control of prolonged standing. Gait Posture 2005, 22, 322–330. [Google Scholar] [CrossRef] [PubMed]
- Vieira, T.M.M.; Oliveira, L.F.; Nadal, J. Estimation procedures affect the center of pressure frequency analysis. Braz. J. Med. Biol. Res. 2009, 42, 665–673. [Google Scholar] [CrossRef] [PubMed]
- Kanekar, N.; Lee, Y.-J.; Aruin, A.S. Frequency analysis approach to study balance control in individuals with multiple sclerosis. J. Neurosci. Methods 2014, 222, 91–96. [Google Scholar] [CrossRef] [PubMed]
- Goetz, C.G.; Tilley, B.C.; Shaftman, S.R.; Stebbins, G.T.; Fahn, S.; Martinez-Martin, P.; Poewe, W.; Sampaio, C.; Stern, M.B.; Dodel, R.; et al. Movement Disorder Society-Sponsored Revision of the Unified Parkinson’s Disease Rating Scale (MDS-UPDRS): Scale presentation and clinimetric testing results. Mov. Disord. 2008, 23, 2129–2170. [Google Scholar] [CrossRef] [PubMed]
- Van der Heeden, J.F.; Marinus, J.; Martinez-Martin, P.; Rodriguez-Blazquez, C.; Geraedts, V.J.; van Hilten, J.J. Postural instability and gait are associated with severity and prognosis of Parkinson disease. Neurology 2016, 86, 2243–2250. [Google Scholar] [CrossRef] [PubMed]
- Cavalheiro, G.L.; Almeida, M.F.S.; Pereira, A.A.; Andrade, A.O. Study of age-related changes in postural control during quiet standing through linear discriminant analysis. Biomed. Eng. Online 2009, 8, 35. [Google Scholar] [CrossRef] [PubMed]
- Lafond, D.; Corriveau, H.; Hébert, R.; Prince, F. Intrasession reliability of center of pressure measures of postural steadiness in healthy elderly people. Arch. Phys. Med. Rehabil. 2004, 85, 896–901. [Google Scholar] [CrossRef] [PubMed]
- Rezvanian, S.; Lockhart, T. Towards Real-Time Detection of Freezing of Gait Using Wavelet Transform on Wireless Accelerometer Data. Sensors 2016, 16, 475. [Google Scholar] [CrossRef] [PubMed]
- Mojtahedi, K.; Fu, Q.; Santello, M. Extraction of Time and Frequency Features from Grip Force Rates during Dexterous Manipulation. IEEE Trans. Biomed. Eng. 2015, 62, 1363–1375. [Google Scholar] [CrossRef] [PubMed]
- Rezvanian, S.; Lockhart, T.; Frames, C.; Soangra, R. Toward an objective method to classify tremor dominant and postural instability and gait difficulty subtypes of parkinson’s disease: A pilot study. Biomed. Sci. Instrum. 2017, 53, 138–142. [Google Scholar]
- Lockhart, T.E.; Soangra, R.; Zhang, J.; Wu, X. Wavelet based automated postural event detection and activity classification with single imu-biomed 2013. Biomed. Sci. Instrum. 2013, 49, 224–233. [Google Scholar] [PubMed]
- Zweig, M.; Campbell, G. Receiver-operating characteristic (ROC) plots: A fundamental evaluation tool in clinical medicine. Clin. Chem. 1993, 39, 561–577. [Google Scholar] [PubMed]
- Pai, Y.-C.; Wening, J.D.; Runtz, E.F.; Iqbal, K.; Pavol, M.J. Role of feedforward control of movement stability in reducing slip-related balance loss and falls among older adults. J. Neurophysiol. 2003, 90, 755–762. [Google Scholar] [CrossRef] [PubMed]
- Nallegowda, M.; Singh, U.; Handa, G.; Khanna, M.; Wadhwa, S.; Yadav, S.L.; Kumar, G.; Behari, M. Role of Sensory Input and Muscle Strength in Maintenance of Balance, Gait, and Posture in Parkinson’s disease: A pilot study. Am. J. Phys. Med. Rehabil. 2004, 83, 898–908. [Google Scholar] [CrossRef] [PubMed]
- Błaszczyk, J.W.; Orawiec, R.; Duda-Kłodowska, D.; Opala, G. Assessment of postural instability in patients with Parkinson’s disease. Exp. Brain Res. 2007, 183, 107–114. [Google Scholar] [CrossRef] [PubMed]
- Mitchell, S.L.; Collin, J.J.; De Luca, C.J.; Burrows, A.; Lipsitz, L.A. Open-loop and closed-loop postural control mechanisms in Parkinson’s disease: Increased mediolateral activity during quiet standing. Neurosci. Lett. 1995, 197, 133–136. [Google Scholar] [CrossRef]
- Van Wegen, E.E.H.; van Emmerik, R.E.A.; Wagenaar, R.C.; Ellis, T. Stability Boundaries and Lateral Postural Control in Parkinson’s Disease. Motor Control 2001, 5, 254–269. [Google Scholar] [CrossRef] [PubMed]
- Viitasalo, M.K.; Kampman, V.; Sotaniemi, K.A.; Leppävuori, S.; Myllylä, V.V.; Korpelainen, J.T. Analysis of sway in Parkinson’s disease using a new inclinometry-based method. Mov. Disord. 2002, 17, 663–669. [Google Scholar] [CrossRef] [PubMed]
- Horak, F.B.; Nutt, J.G.; Nashner, L.M. Postural inflexibility in parkinsonian subjects. J. Neurol. Sci. 1992, 111, 46–58. [Google Scholar] [CrossRef]
- Schieppati, M.; Hugon, M.; Grasso, M.; Nardone, A.; Galante, M. The limits of equilibrium in young and elderly normal subjects and in parkinsonians. Electroencephalogr. Clin. Neurophysiol. 1994, 93, 286–298. [Google Scholar] [CrossRef]
Figure 1.
Power spectrum of COP and COP velocity of a tremor dominant (TD) patient and a postural instability and gait difficulty (PIGD) patient for both the medial–lateral (ML) and anterior–posterior (AP) directions. The graphs on the left and right sides of the page present the power spectrum signal of a TD patient and a PIGD patient, respectively. COPML: COP in the ML direction, COPAP: COP in the AP direction, V-COPML: COP velocity in the ML direction, and V-COPAP: COP velocity in the AP direction.

Figure 2.
Wavelet transform (WT) of COP and COP velocity of a TD patient and a PIGD patient for both the ML and AP directions. The horizontal white lines in each plot indicate the PD tremor scale range corresponding to the frequency range of 3–7 Hz. The frequencies of 3 Hz and 7 Hz correspond to the scales of 24 and 10, respectively. COPML: COP in the ML direction, COPAP: COP in the AP direction, V-COPML: COP velocity in the ML direction, and V-COPAP: COP velocity in the AP direction.

Figure 3.
Fast Fourier transform (FFT) results of the proposed detection ratio for COP and its velocity in both the ML and AP directions. (A) RCOP_ML: the detection ratio using COP data in the ML direction, (B) RVCOP_ML: the detection ratio using COP velocity data in the ML direction, (C) RCOP_AP: the detection ratio using COP data in the AP direction, and (D) RVCOP_AP: the detection ratio using COP velocity data in the AP direction. The asterisks (*) placed over the vertical bars denote a significant difference (p < 0.05). EC: eyes closed condition; EO: eyes open condition.

Figure 4.
WT results of the proposed detection ratio for COP and its velocity in both the ML and AP directions. (A) RCOP_ML: the detection ratio using COP data in the ML direction, (B) RVCOP_ML: the detection ratio using COP velocity data in the ML direction, (C) RCOP_AP: the detection ratio using COP data in the AP direction, and (D) RVCOP_AP: the detection ratio using COP velocity data in the AP direction. The asterisks (*) placed over the vertical bars denote a significant difference (p < 0.05).

Figure 5.
Receiver operating characteristic (ROC) curves of the proposed detection ratio using the FFT method for COP and its velocity: (A) ML direction and (B) AP direction. EO-RCOP_ML: the detection ratio using COP data in the ML direction under the eyes open condition, EC-RCOP_ML: the detection ratio using COP data in the ML direction under the eyes closed condition, EO-RVCOP_ML: the detection ratio using COP velocity data in the ML direction under the eyes open condition, EC-RVCOP_ML: the detection ratio using COP velocity data in the ML direction under the eyes closed condition, EO-RCOP_AP: the detection ratio using COP data in the AP direction under the eyes open condition, EC-RCOP_AP: the detection ratio using COP data in the AP direction under the eyes closed condition, EO-RVCOP_AP: the detection ratio using COP velocity data in the AP direction under the eyes open condition, and EC-RVCOP_AP: the detection ratio using COP velocity data in the AP direction under the eyes closed condition.

Figure 6.
ROC curves of the proposed detection ratio using the WT method for COP and its velocity: (A) ML direction and (B) AP direction. EO-RCOP_ML: the detection ratio using COP data in the ML direction under the eyes open condition, EC-RCOP_ML: the detection ratio using COP data in the ML direction under the eyes closed condition, EO-RVCOP_ML: the detection ratio using COP velocity data in the ML direction under the eyes open condition, EC-RVCOP_ML: the detection ratio using COP velocity data in the ML direction under the eyes closed condition, EO-RCOP_AP: the detection ratio using COP data in the AP direction under the eyes open condition, EC-RCOP_AP: the detection ratio using COP data in the AP direction under the eyes closed condition, EO-RVCOP_AP: the detection ratio using COP velocity data in the AP direction under the eyes open condition, and EC-RVCOP_AP: the detection ratio using COP velocity data in the AP direction under the eyes closed condition.


Table 1.
Demographics of the tremor dominant (TD) and postural instability and gait difficulty (PIGD) groups (mean ± standard deviation—SD). MDS-UPDRS: Movement Disorder Society Unified Parkinson’s Disease Rating Scale.
Table 1.
Demographics of the tremor dominant (TD) and postural instability and gait difficulty (PIGD) groups (mean ± standard deviation—SD). MDS-UPDRS: Movement Disorder Society Unified Parkinson’s Disease Rating Scale.
| TD (n = 13) | PIGD (n = 23) | |
|---|---|---|
| Gender (F:M) | 0:13 | 9:14 |
| Age (years) | 59.92 ± 9.63 (34–71) | 70.43 ± 6.18 (59–81) |
| Disease duration (months) | 20.23 ± 19.14 (4–60) | 37.78 ± 54.69 (1–216) |
| MDS-UPDRS III (ON) | 14.85 ± 9.85 | 15.08 ± 8.48 |
Table 2.
Selected postural stability parameters. Range anterior–posterior (AP): center of pressure (COP) range in the AP direction, range medial–lateral (ML): COP range in the ML direction, path length: resultant COP path length, mean velocity: resultant COP mean velocity, and area: 95% ellipse area. The symbols * or ** denote which of the two variables were significantly different at each parameter (p < 0.05).
| Range AP (cm) | Range ML (cm) | Mean Velocity (cm/s) | Path Length (cm) | Area (cm2) | ||
|---|---|---|---|---|---|---|
| Eyes open | TD | 0.81 ± 0.15 * | 1.49 ± 0.10 * | 1.46 ± 0.27 * | 29.28 ± 5.49 * | 0.92 ± 0.22 * |
| PIGD | 1.06 ± 0.13 ** | 1.81 ± 0.16 ** | 1.48 ± 0.23 ** | 29.62 ± 4.57 ** | 1.53 ± 0.32 ** | |
| Eyes closed | TD | 1.15 ± 0.24 * | 2.81 ± 0.39 * | 2.56 ± 0.66 * | 51.23 ± 13.16 * | 2.95 ± 1.05 * |
| PIGD | 1.14 ± 0.14 ** | 2.75 ± 0.36 ** | 2.01 ± 0.20 ** | 40.23 ± 4.01 ** | 2.51 ± 0.45 ** |
Table 3.
The area under the receiver operating characteristic (ROC) curves of the proposed detection ratio, using both the FFT and WT methods, for COP and its velocity in the ML and AP directions under the two conditions (eyes open (EO) and eyes closed (EC)). The p-values of each parameter are presented in parentheses. The asterisks (*) indicate that the area under the ROC curve was significantly different from 0.5 (p < 0.05).
| FFT | WT | ||||
|---|---|---|---|---|---|
| COP | V_COP | COP | V_COP | ||
| ML-Direction | EO | 0.689 (p = 0.05) | 0.779 * (p = 0.001) | 0.809 * (p = 0.001) | 0.823 * (p = 0.001) |
| EC | 0.602 (p = 0.343) | 0.712 * (p = 0.023) | 0.706 * (p = 0.033) | 0.726 * (p = 0.016) | |
| AP-Direction | EO | 0.562 (p = 0.542) | 0.555 (p = 0.5873) | 0.562 (p = 0.529) | 0.569 (p = 0.482) |
| EC | 0.555 (p = 0.578) | 0.592 (p = 0.358) | 0.579 (0.442) | 0.595 (p = 0.363) | |
© 2018 by the authors. Licensee MDPI, Basel, Switzerland. This article is an open access article distributed under the terms and conditions of the Creative Commons Attribution (CC BY) license (http://creativecommons.org/licenses/by/4.0/).
Share and Cite
MDPI and ACS Style
Rezvanian, S.; Lockhart, T.; Frames, C.; Soangra, R.; Lieberman, A. Motor Subtypes of Parkinson’s Disease Can Be Identified by Frequency Component of Postural Stability. Sensors 2018, 18, 1102. https://doi.org/10.3390/s18041102
AMA Style
Rezvanian S, Lockhart T, Frames C, Soangra R, Lieberman A. Motor Subtypes of Parkinson’s Disease Can Be Identified by Frequency Component of Postural Stability. Sensors. 2018; 18(4):1102. https://doi.org/10.3390/s18041102
Chicago/Turabian StyleRezvanian, Saba, Thurmon Lockhart, Christopher Frames, Rahul Soangra, and Abraham Lieberman. 2018. "Motor Subtypes of Parkinson’s Disease Can Be Identified by Frequency Component of Postural Stability" Sensors 18, no. 4: 1102. https://doi.org/10.3390/s18041102
Note that from the first issue of 2016, this journal uses article numbers instead of page numbers. See further details here.