Groundwater Vulnerability to Pollution Map for Karst Aquifer Protection (Ziria Karst System, Southern Greece)

School of Natural Science, Department of Geology, University of Patras, Rion, 26500 Patras, Greece
*
Author to whom correspondence should be addressed.
Geosciences 2018, 8(4), 125; https://doi.org/10.3390/geosciences8040125
Submission received: 8 March 2018
/
Revised: 29 March 2018
/
Accepted: 3 April 2018
/
Published: 5 April 2018
(This article belongs to the Special Issue Selected Papers from 1st International Congress on Earth Sciences in SE Asia)
Abstract
:In recent years vulnerability maps have been used as a tool to highlight the areas with the greatest potential for groundwater pollution based on the hydrogeological conditions and their respective human impacts. Several regions of Greece depend completely or partially on drinking water from karst aquifers; thus, the production of vulnerability maps for such karstic areas is considered essential. In the present study, an assessment of aquifer intrinsic vulnerability has been conducted applying the COP method in the Ziria karst system. The latter is located at the Northeast part of Peloponnese in South Greece and is used as a public resource for drinking water. This method, which has been developed for carbonate (karst) aquifers, uses the properties of the overlying layers above the water table (O factor), the concentration of flow (C factor) and the precipitation regime (P factor) over the aquifer. The COP method considers karstic landforms as factors that decrease the natural protection provided by the overlying layers of a karst aquifer. With the use of GIS tools, vulnerability maps were produced highlighting the different degrees of intrinsic vulnerability in the karst system of Ziria.
1. Introduction
Groundwater from karst aquifers is one of the most important resources of drinking water supply for populations worldwide. In Europe, carbonate terrains occupy 35% of the land surface, and 30% in Greece, specifically, while several regions, especially in the West and South part of the country, depend completely on drinking water from karst aquifers. On the other hand, carbonate aquifers are particularly vulnerable to pollution due to their structure and hydrogeological behavior [1,2]. The water can move rapidly though karst conduits, as well as swallow holes. Additionally, the soil is very thin or absent [3]. For this reason, the protection of karst groundwater systems is of high priority in Europe. In the framework of Cost Action 620 “Vulnerability and Risk Mapping for the Protection of Carbonate (karst) Aquifers” supported by the European Commission, a European Approach for groundwater vulnerability mapping was proposed [2]. Based on the EPIK method, which was the first method applied for vulnerability mapping in karst systems [1], several methods have been developed, such as PI [4], KARSTIC [5], COP [6,7], COP + K [8], the Slovene approach [9] and PaPRIKA [10].
Although more sophisticated versions of these methods have been used and developed in several European countries during the last decade, the research on groundwater vulnerability mapping in Greek karstic systems has been very limited [11,12,13,14]. On the other hand, several methods for vulnerability mapping, such as DRASTIC, AVI, etc., have been applied in porous media in Greece [11,15,16,17,18].
The description of the degree of groundwater vulnerability to pollutants, as a function of hydrogeological conditions, emphasizes the fact that the protection of groundwater from the natural environment does not remain stable but varies according to the respective study area. As a result, some areas are more vulnerable than others, and the purpose of vulnerability mapping is to identify individual areas with different vulnerability potential [19]. The reliability and the validity of the vulnerability maps depend on the availability, quality and interpretation of the data.
In the Ziria karstic groundwater system located at North Peloponnese, the COP method was applied to assess its intrinsic vulnerability. This method is based on three factors assessing the vulnerability according to the European Approach: Concentration of flow (C), Overlying layers (O) and Precipitation (P) [3,20]. The conceptual basis of the method is to evaluate the natural protection of groundwater [3,21].
A front of springs drains the Ziria karst system at the south part of the study area, and the respective water is used to supply the city of Corinth at North Peloponnese with drinking water. At the moment, a big debate is in progress concerning the further use of the spring water to supply the nearby city of Kiato with drinking water. Furthermore, it is necessary to carry out the protection zoning of the karst springs, in accordance with the Guidance document No. 16 of the Water Framework Directive (WFD) on groundwater [22]. Vulnerability mapping with travel-time methods is already used in many European countries as the approach for delimiting the safeguard zones [22,23,24].
In this paper, the vulnerability mapping of the karst system using the COP method has been performed as the first step for delimiting the safeguard zones of the karst springs. In work that is ongoing, the protection zoning at the test site using other methods is still in progress.
2. Study Area
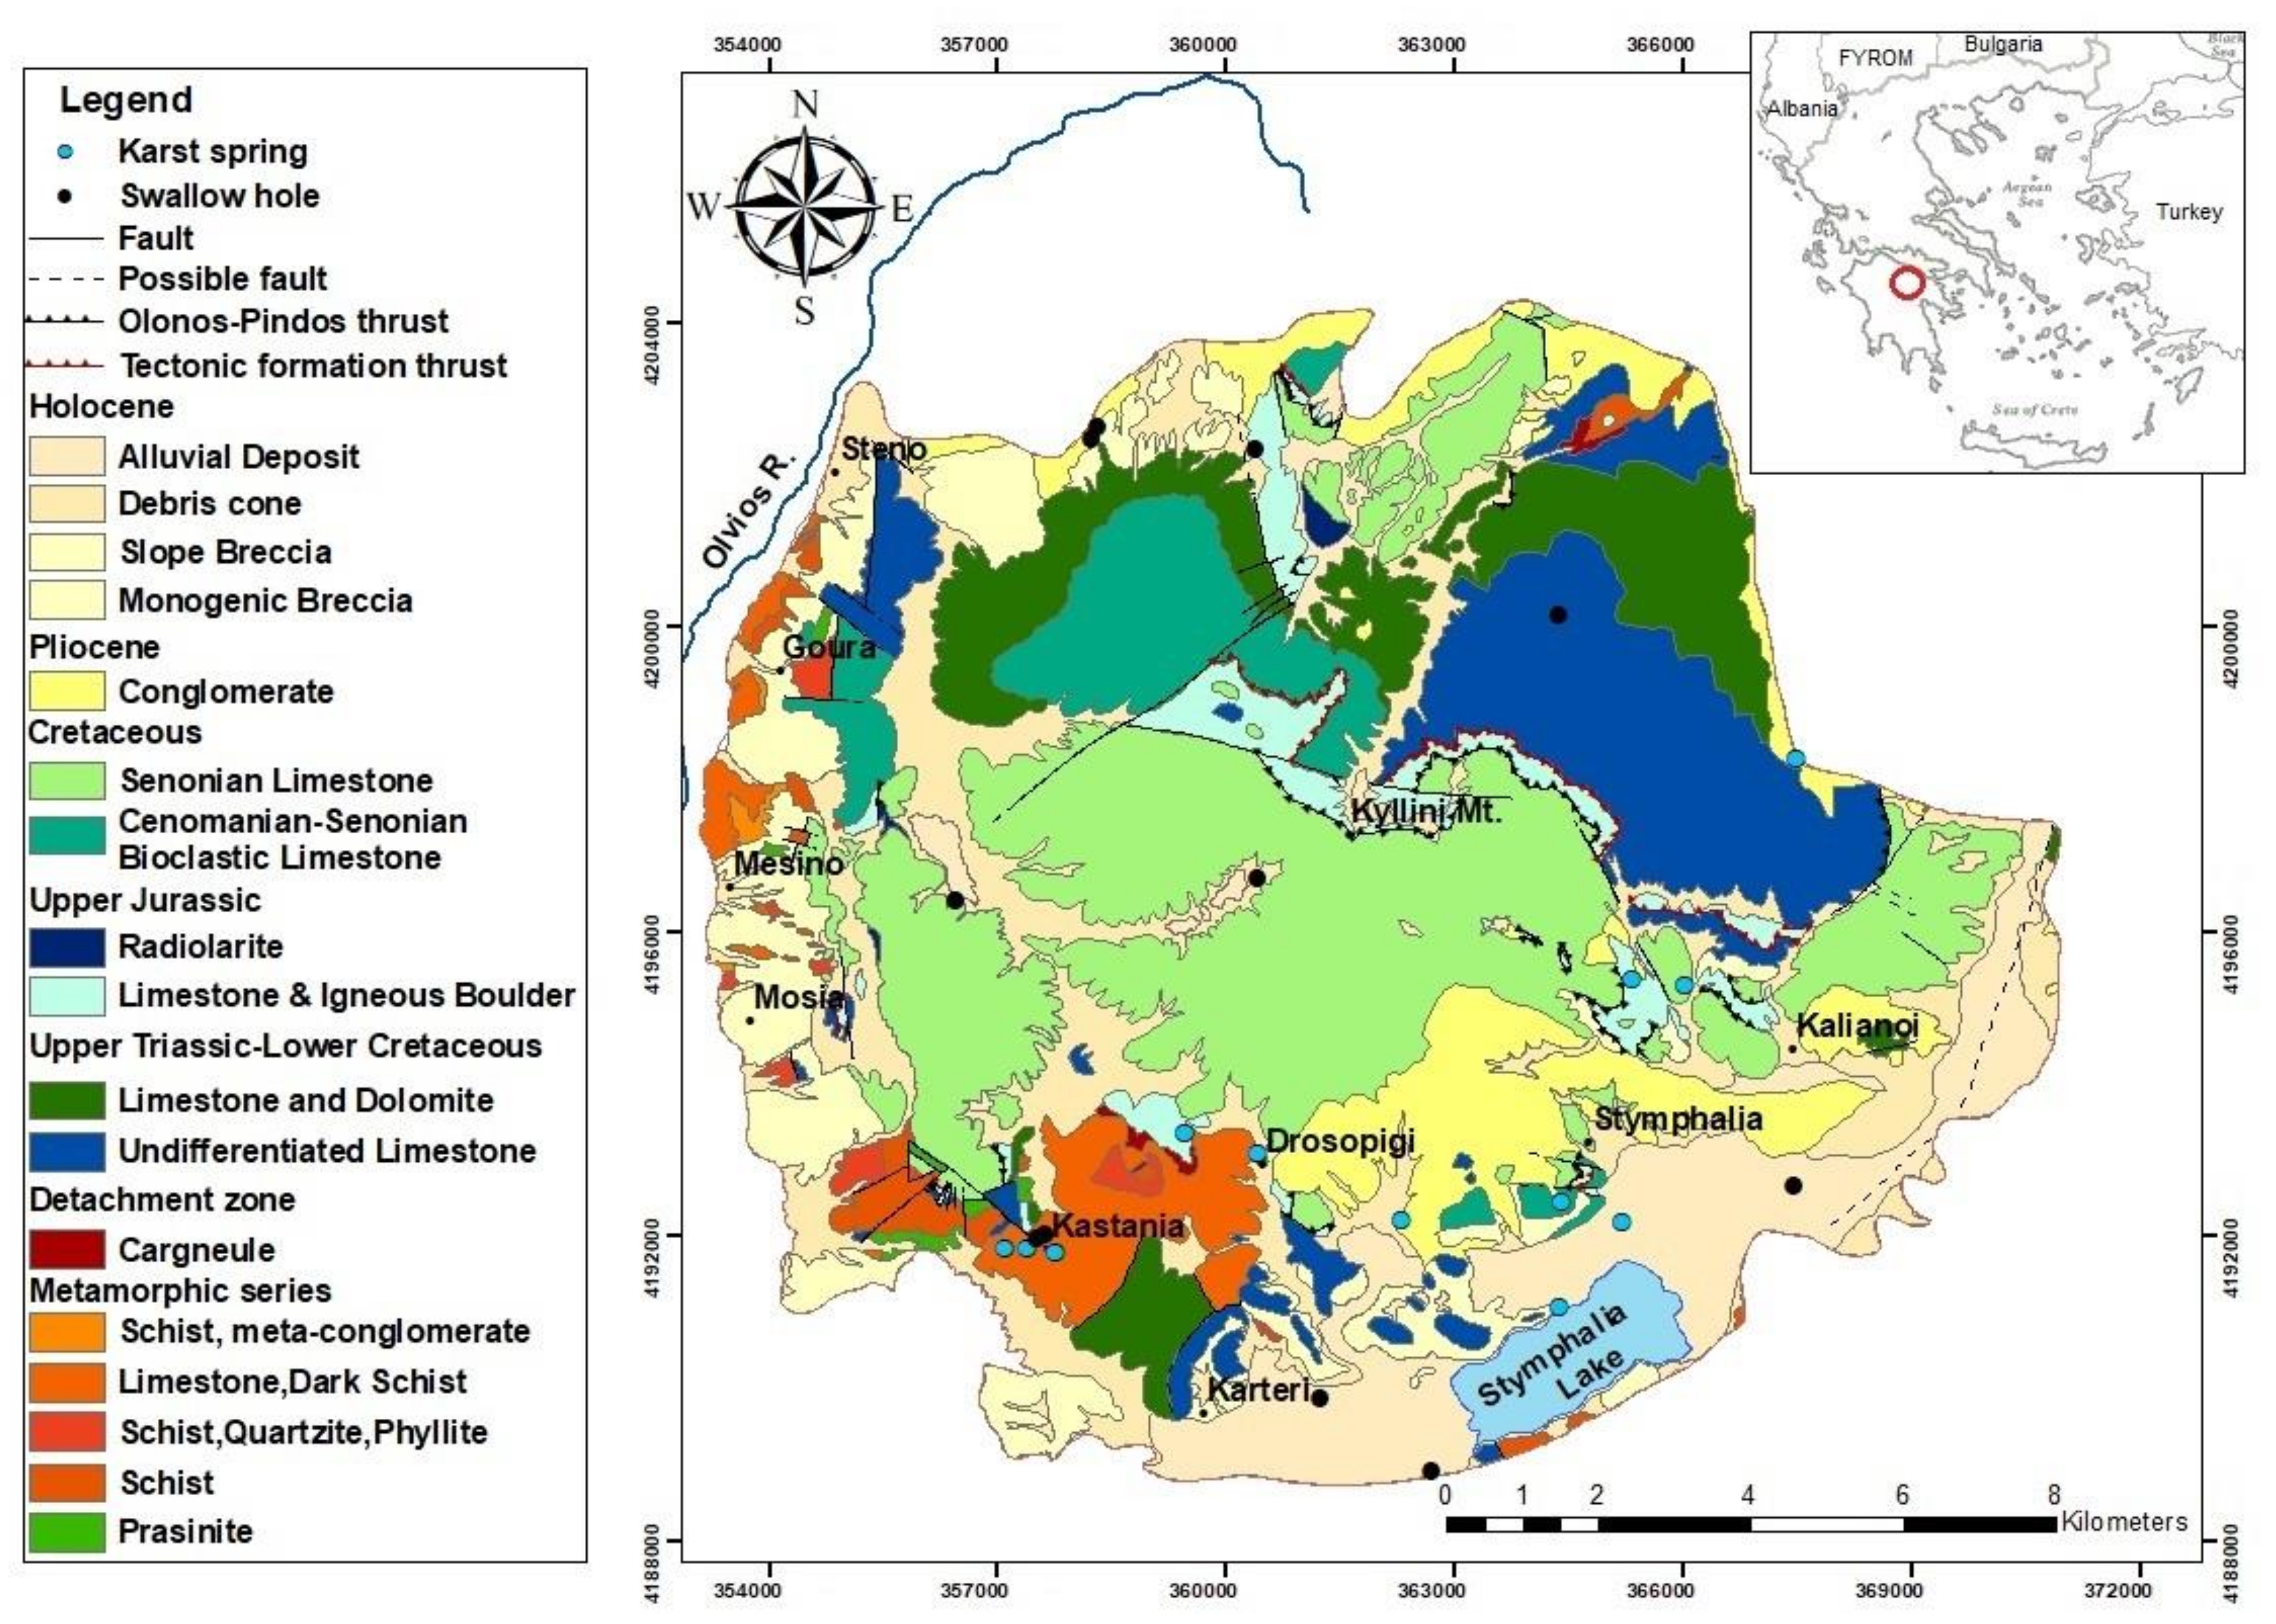
The study area, Ziria karst system, is located in the Northern Peloponnese, South Greece, and occupies 198 km2 of land. It is a mountainous area with steep relief and an average altitude of 1217 m, where the highest point at Kyllini Mountain (or Ziria Mt) is 2360 m and the lowest at the polje of Stymphalia in the South part of the area is 600 m (Figure 1). Stymphalia Lake, which is situated within the karst polje, is the largest mountain lake in the Peloponnese, fed by the front of the karst springs [25,26]. The mean annual precipitation of the study area is 850 mm [13]. A detailed geological, geomorphological and hydrogeological description of the study site has been given by [13]. The Ziria karst system belongs to the Olonos-Pindos and Gavrovo-Tripoli Geotectonic Zones of Greece. It is mainly formed of Triassic limestones and dolomites (Gavrovo-Tripoli Zone), which are overthrusted by Cretaceous limestones (Olonos-Pindos Zone) (Figure 1). The metamorphic bedrock, which consists of phyllites, quatzites and schists, outcrops at the west and southwest part of the area, while the rest is covered by Neogene deposits and Pleistocene conglomerates.
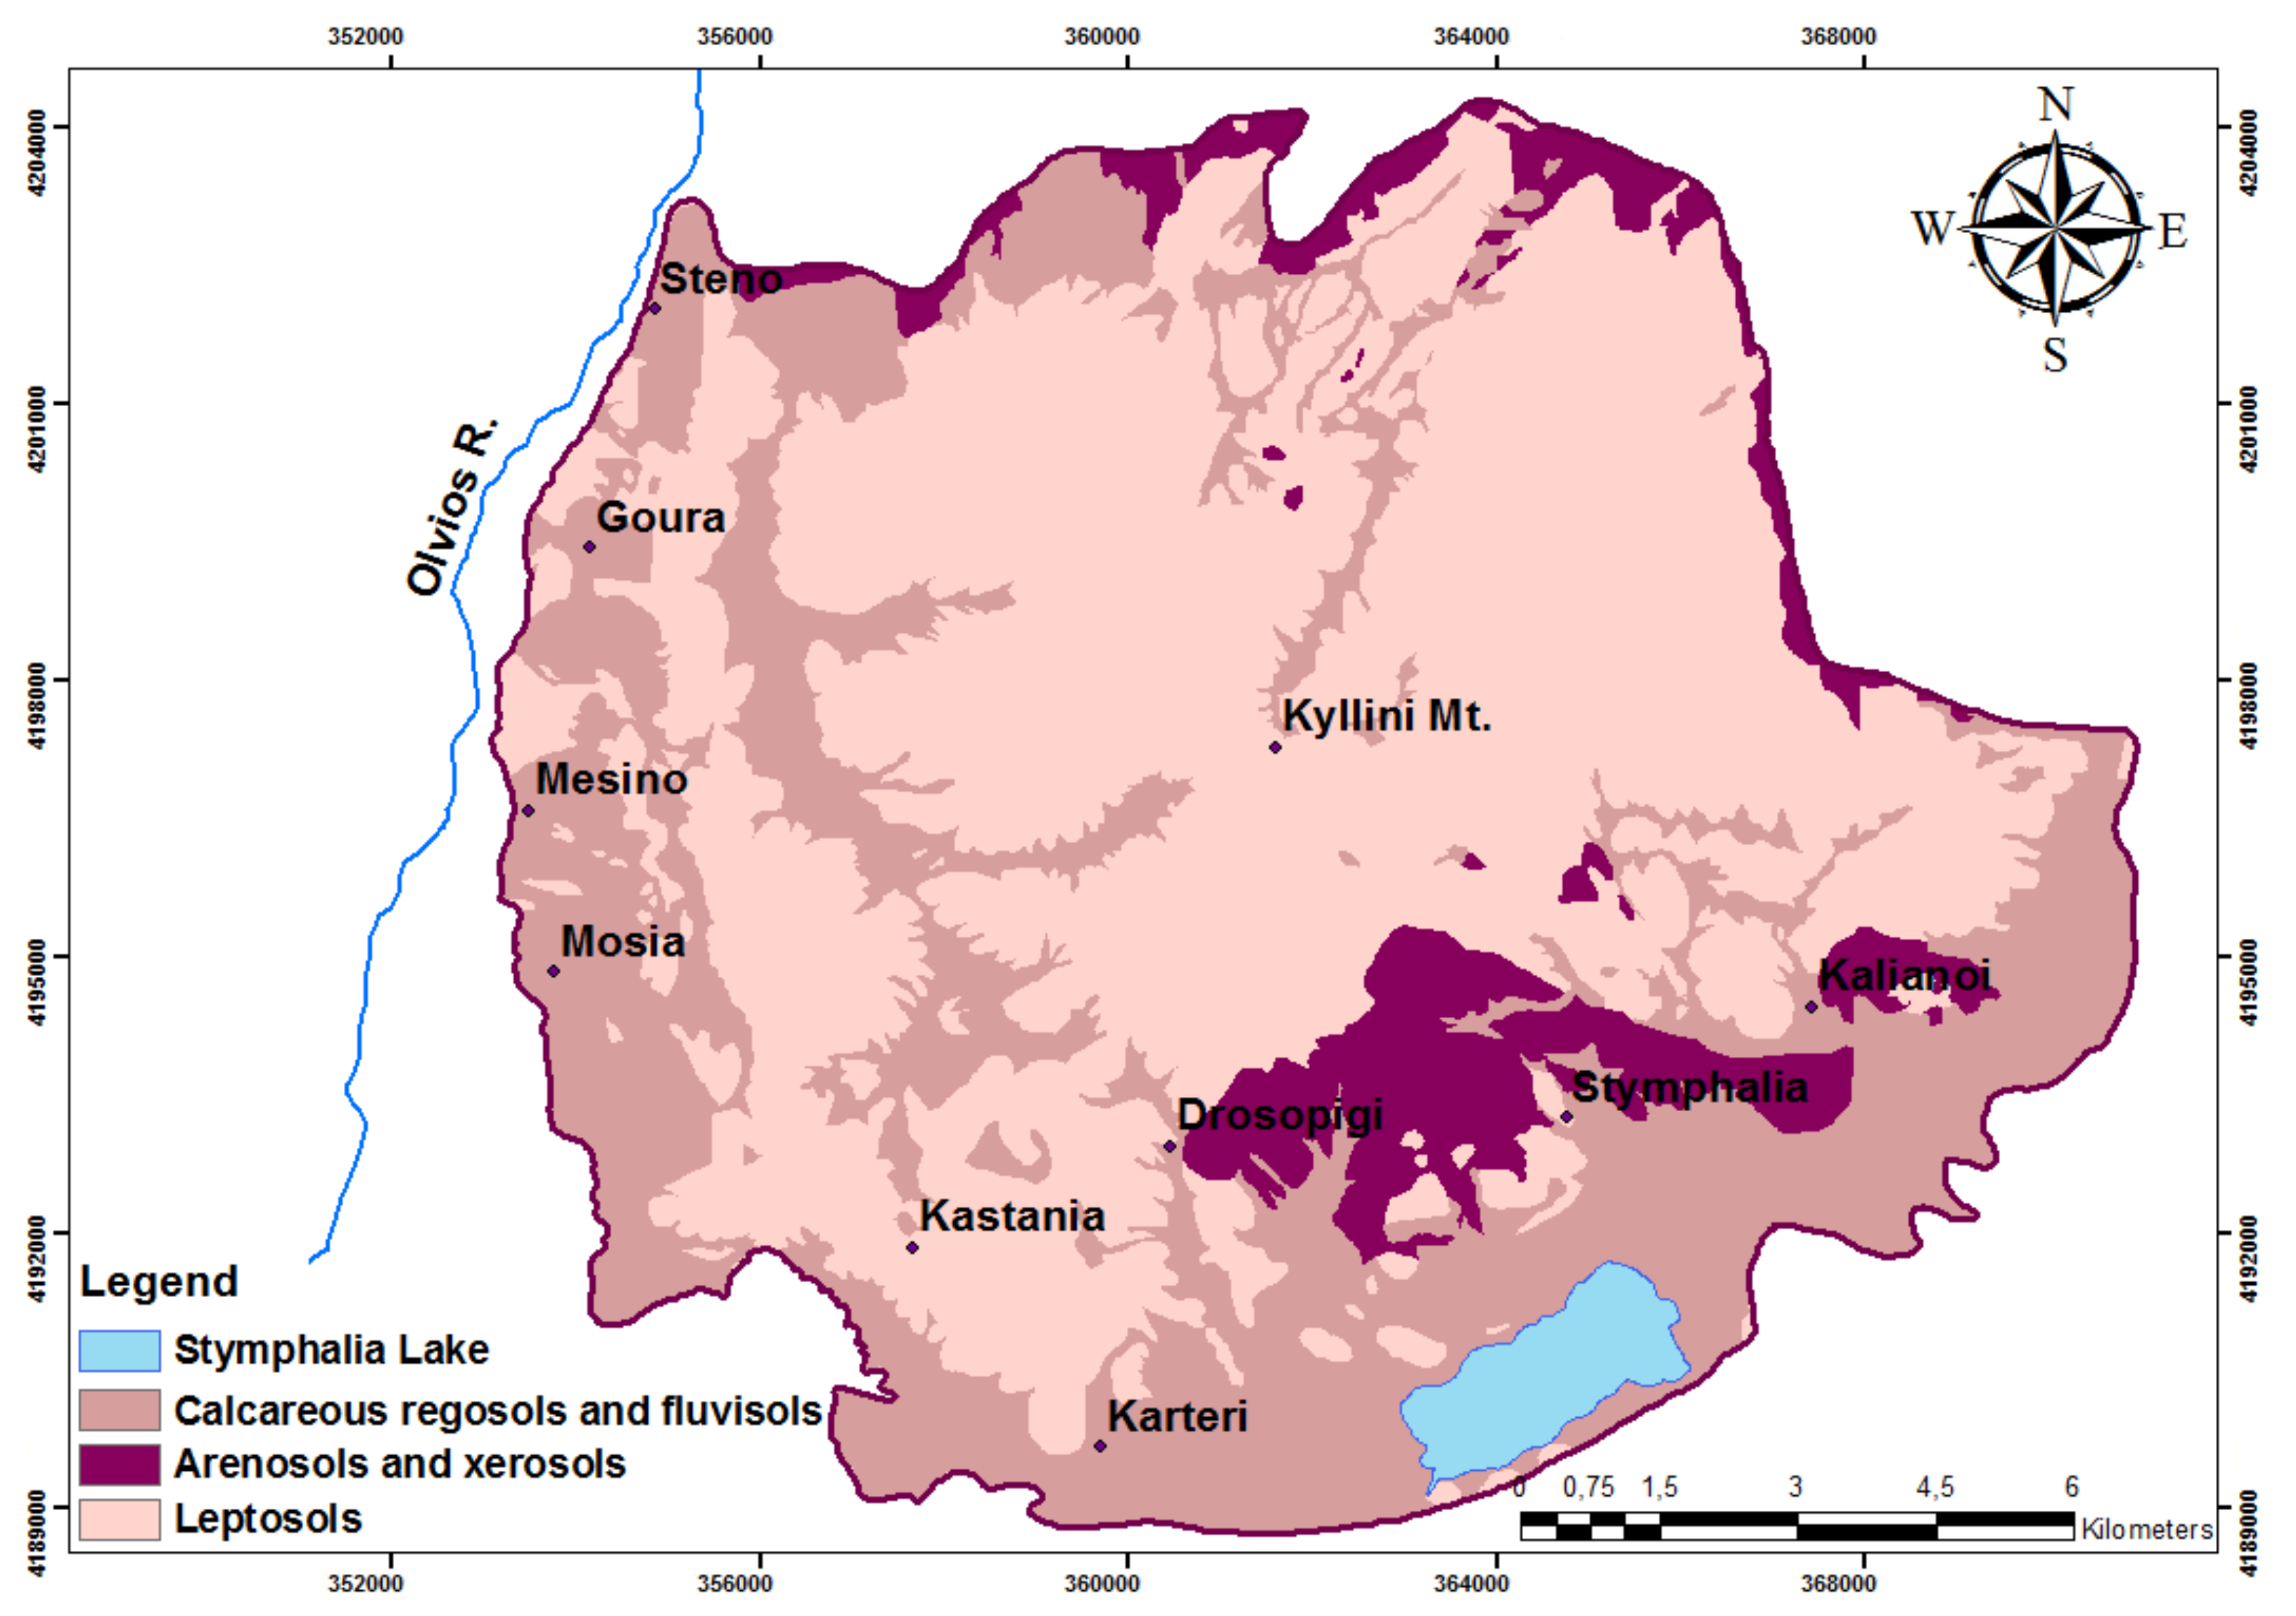
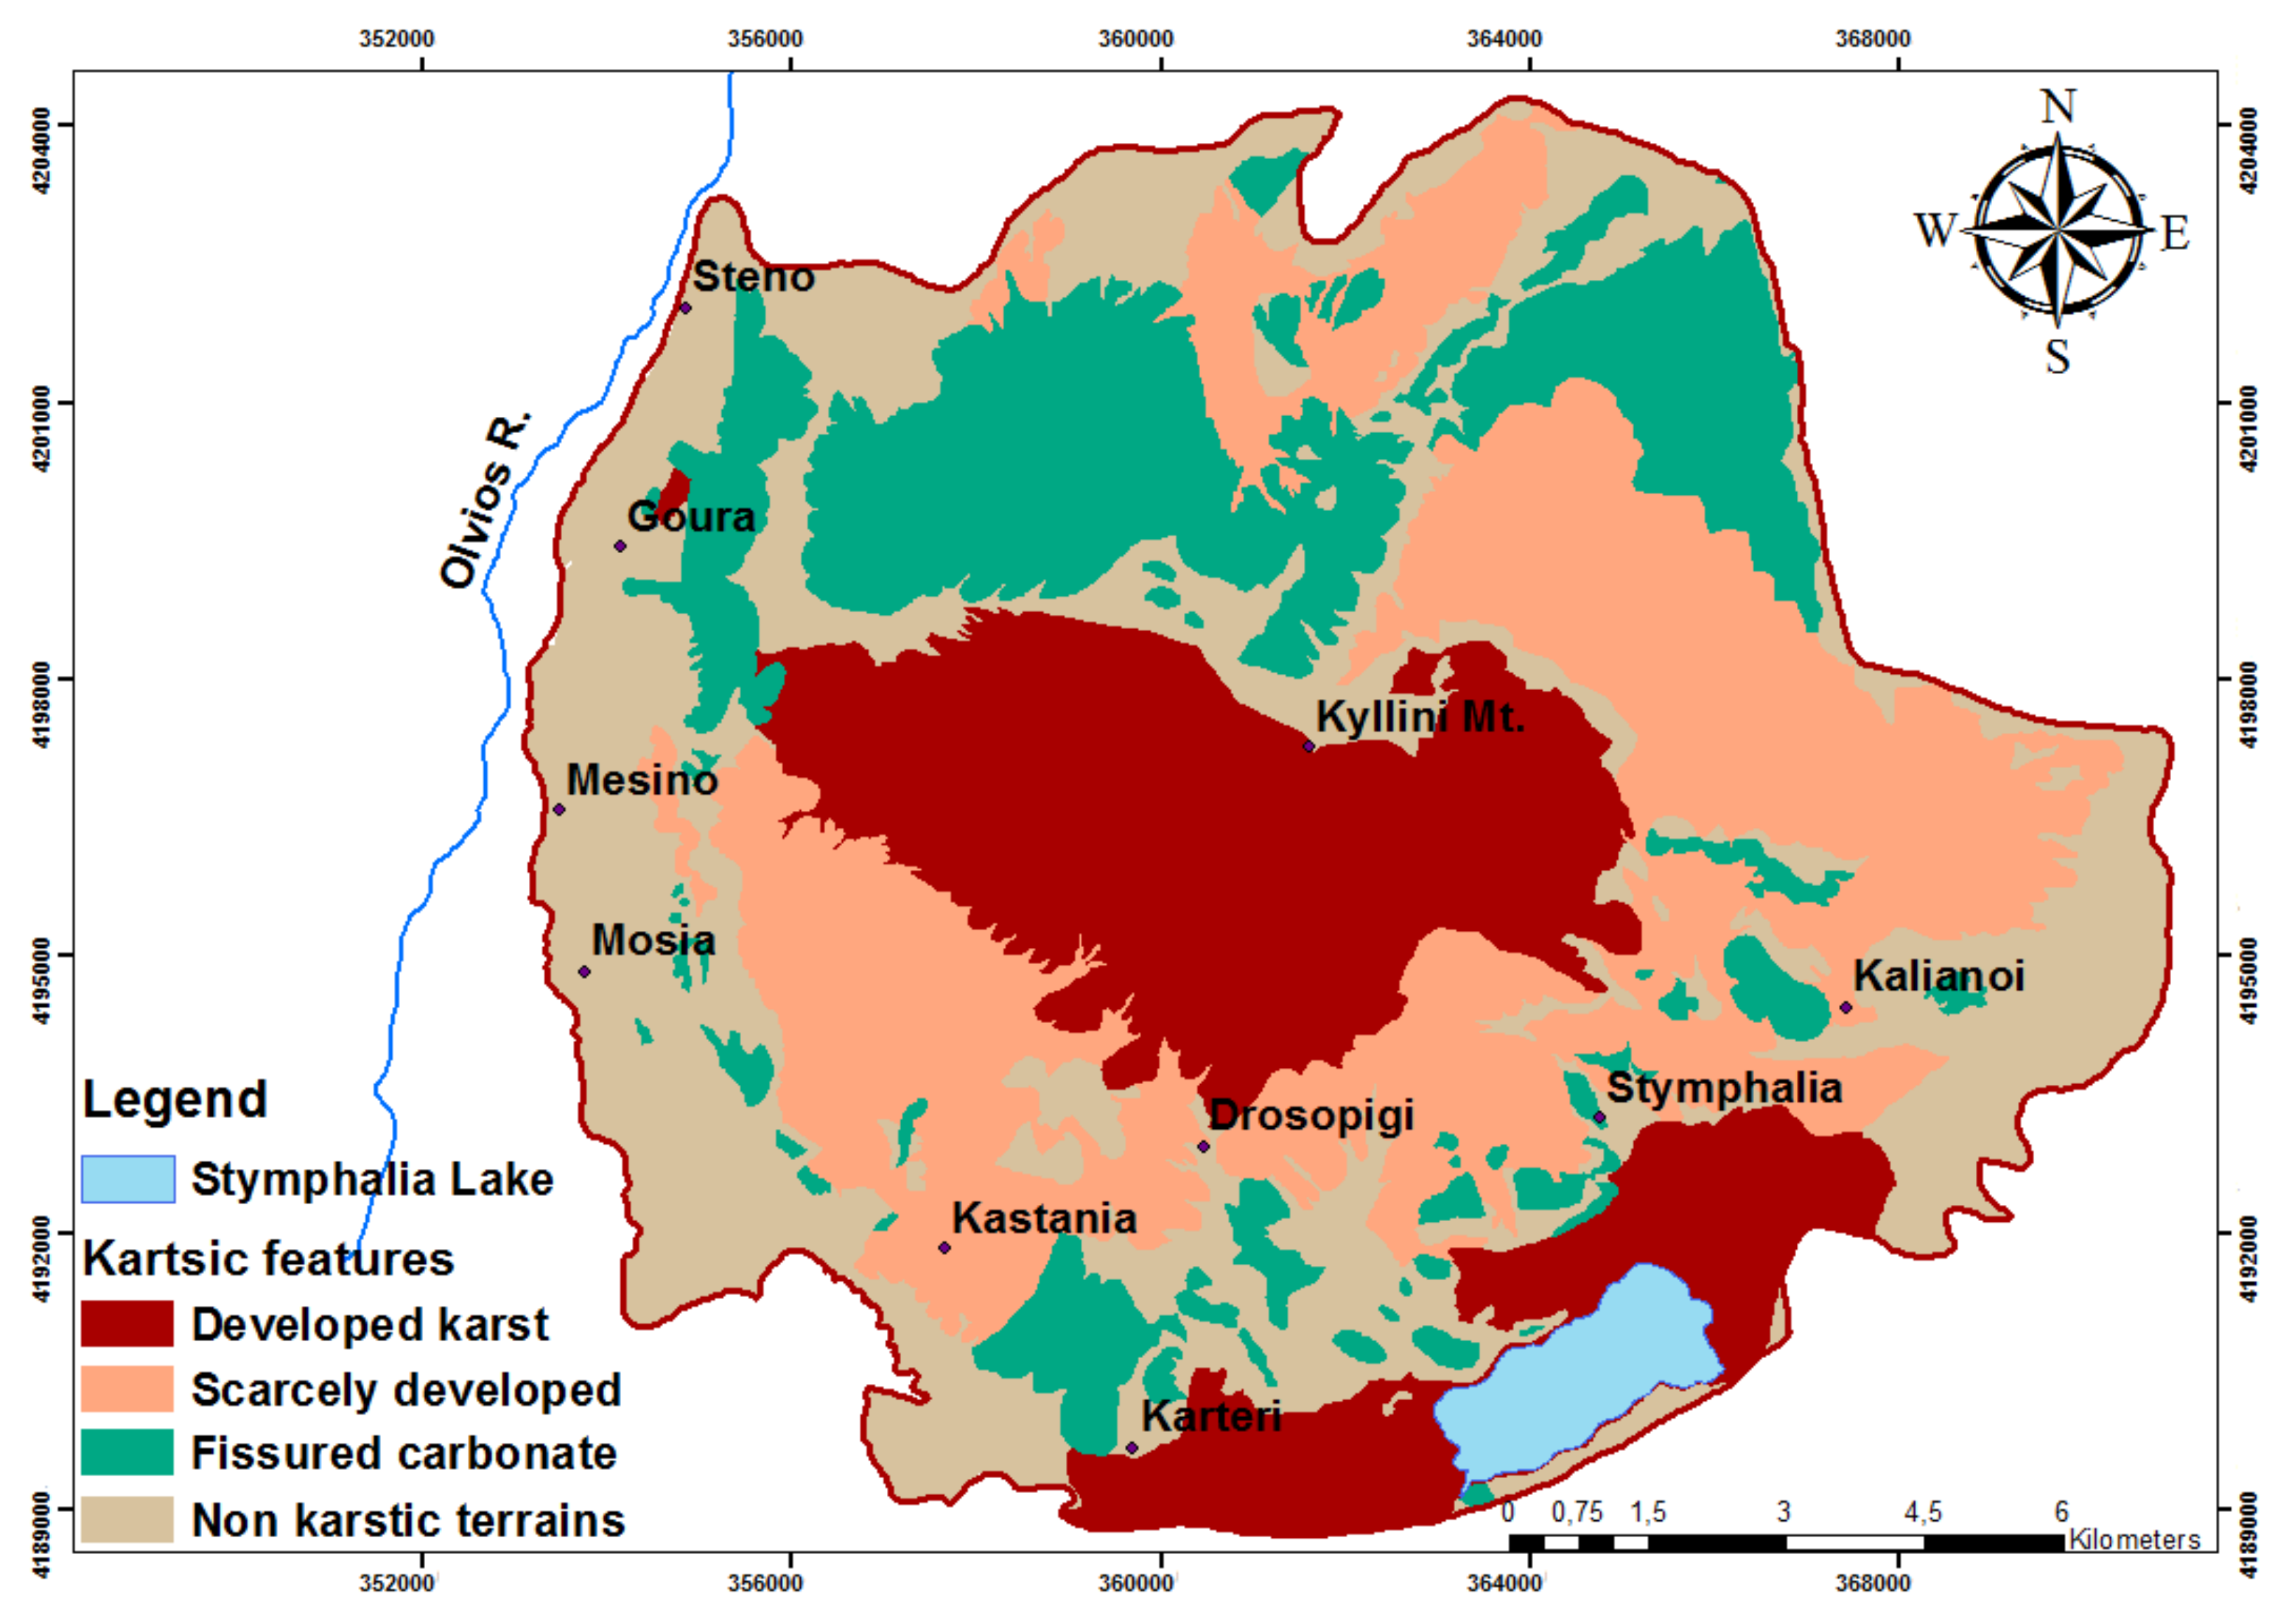
According to the soil map that has been produced, the main type of soil that dominates the area and covers the carbonate outcrops, is leptosol (Figure 2). Karst features are developed mainly on Triassic and Cretaceous limestones, with karrenfields, dolines and swallow holes (Figure 1).
From the hydrogeological point of view, the aquifers are mostly constituted of Triassic and Cretaceous limestones. The bedrock of Kyllini Mountain inclines east and, as a result, it creates an impermeable barrier that extends from Steno to Drosopigi (Figure 1) that delimits the carbonate mass, excluding any underground leaks. Previous geophysical research has shown that the schists that are visible in Kastania extend underground and practically seal Kyllinis aquifers from the South, guiding the underwater flow towards the lower zone, where it relieves at the front of Stymphalia springs [27]. Tracer tests on a swallow hole near the study area have proven, however, that a significant amount of groundwater ends up southeast of the Stymphalia basin, due to the contact of large karst conduits with other carbonate rocks [25,27]. The absence of large karst springs in the northern part of the mountain leads to the conclusion that the groundwater has no outlet in that part of the study area. According to the hydrogeological conditions prevailing in the area, the large karst aquifer of Ziria discharges southeast.
Groundwater recharge occurs by the infiltration of precipitation via swallow holes in concentrated form as well as by the infiltration of the rainfall over the limestone outcrops in diffuse form.
3. General Characteristics of the COP Method
COP is an acronym derived from the initials of the three used factors: flow Concentration, Overlying layers and Precipitation [7]. The O factor takes into account the protection provided to the aquifer by the layers above the saturated zone. In order to quantify the O factor two sub-factors are used, soil (Os factor) and lithological layers above the aquifer (OL factor) [7,28]. The C factor represents the reduction of protection provided to the aquifer by the overlying layers, when the water is concentrated to swallow holes, avoiding passing through the unsaturated zone, or when the autogenic recharge occurs in the aquifer but not in a concentrated form via swallow holes [7,28]. In the latter case, three variables are taken into consideration, surface features (sf), slope (s) and vegetation (v), in order to evaluate the C factor. The P factor represents the influence of the precipitation on the rate of infiltration, and consequently its ability to transport contaminants toward the groundwater [7]. Two sub-factors are used for the valuation of the P factor: quantity of precipitation (PQ) and temporal distribution of precipitation (PI) [7,8]. Figure 2 shows the diagram of the COP methods, which contains the differentiation of the C, O and P factors, the values and the numeric evaluation described in the text below.
4. Application of the COP Method and Results
The application of the COP method to the karst system of Ziria is summarized in Table 1, which shows the chosen values of the different parameters, according to the standard values provided by the method (Figure 2).
4.1. O Factor
In order to examine the ability of the overlying layers to protect the aquifer, the soil map of the study area was produced as the first step (Figure 3), based on field work and the International Soil Classification Map [28,29]. Leptosols occupy 55% of the area, covering the carbonate and dolomite outcrops. Calcareous regosols and fluvisols, as well as arenosols and xerosols, cover the rest of the study area.
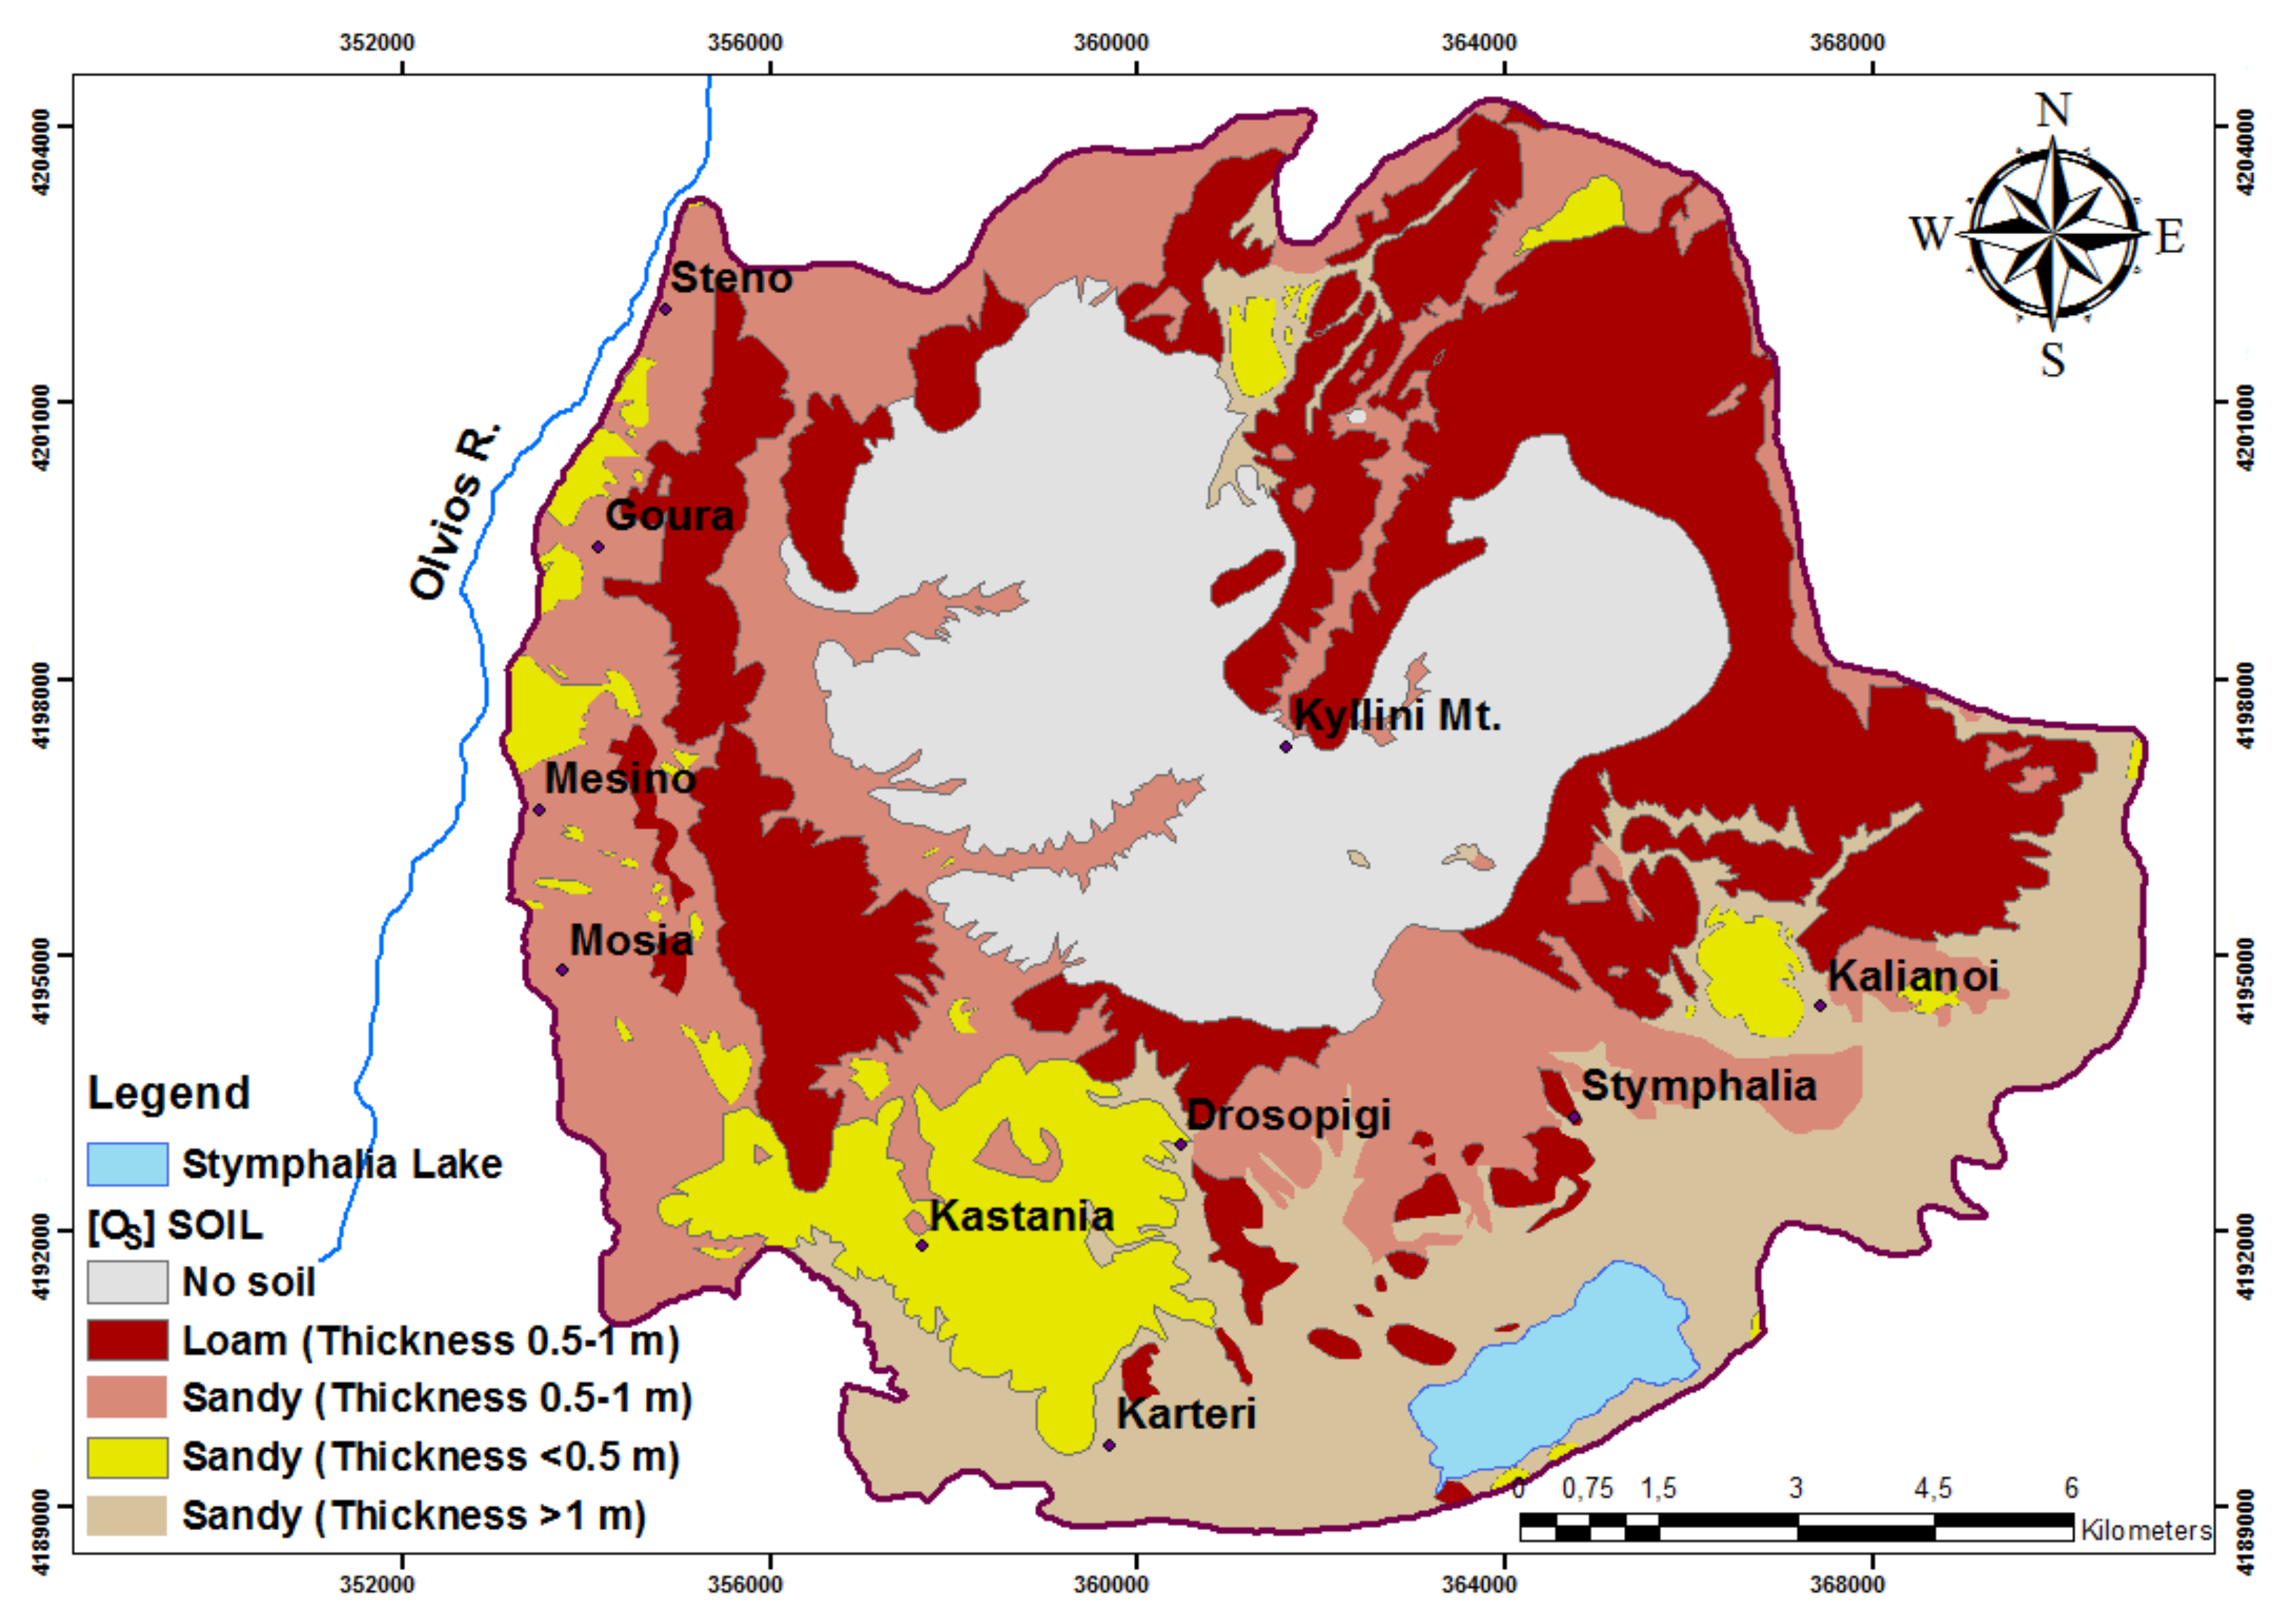
Based on grain size analyses of soil samples collected from the study area, thickness values from previous drilling data [27] and the soil map of the study area, the map of sub-factor [Os] was created (Figure 4).
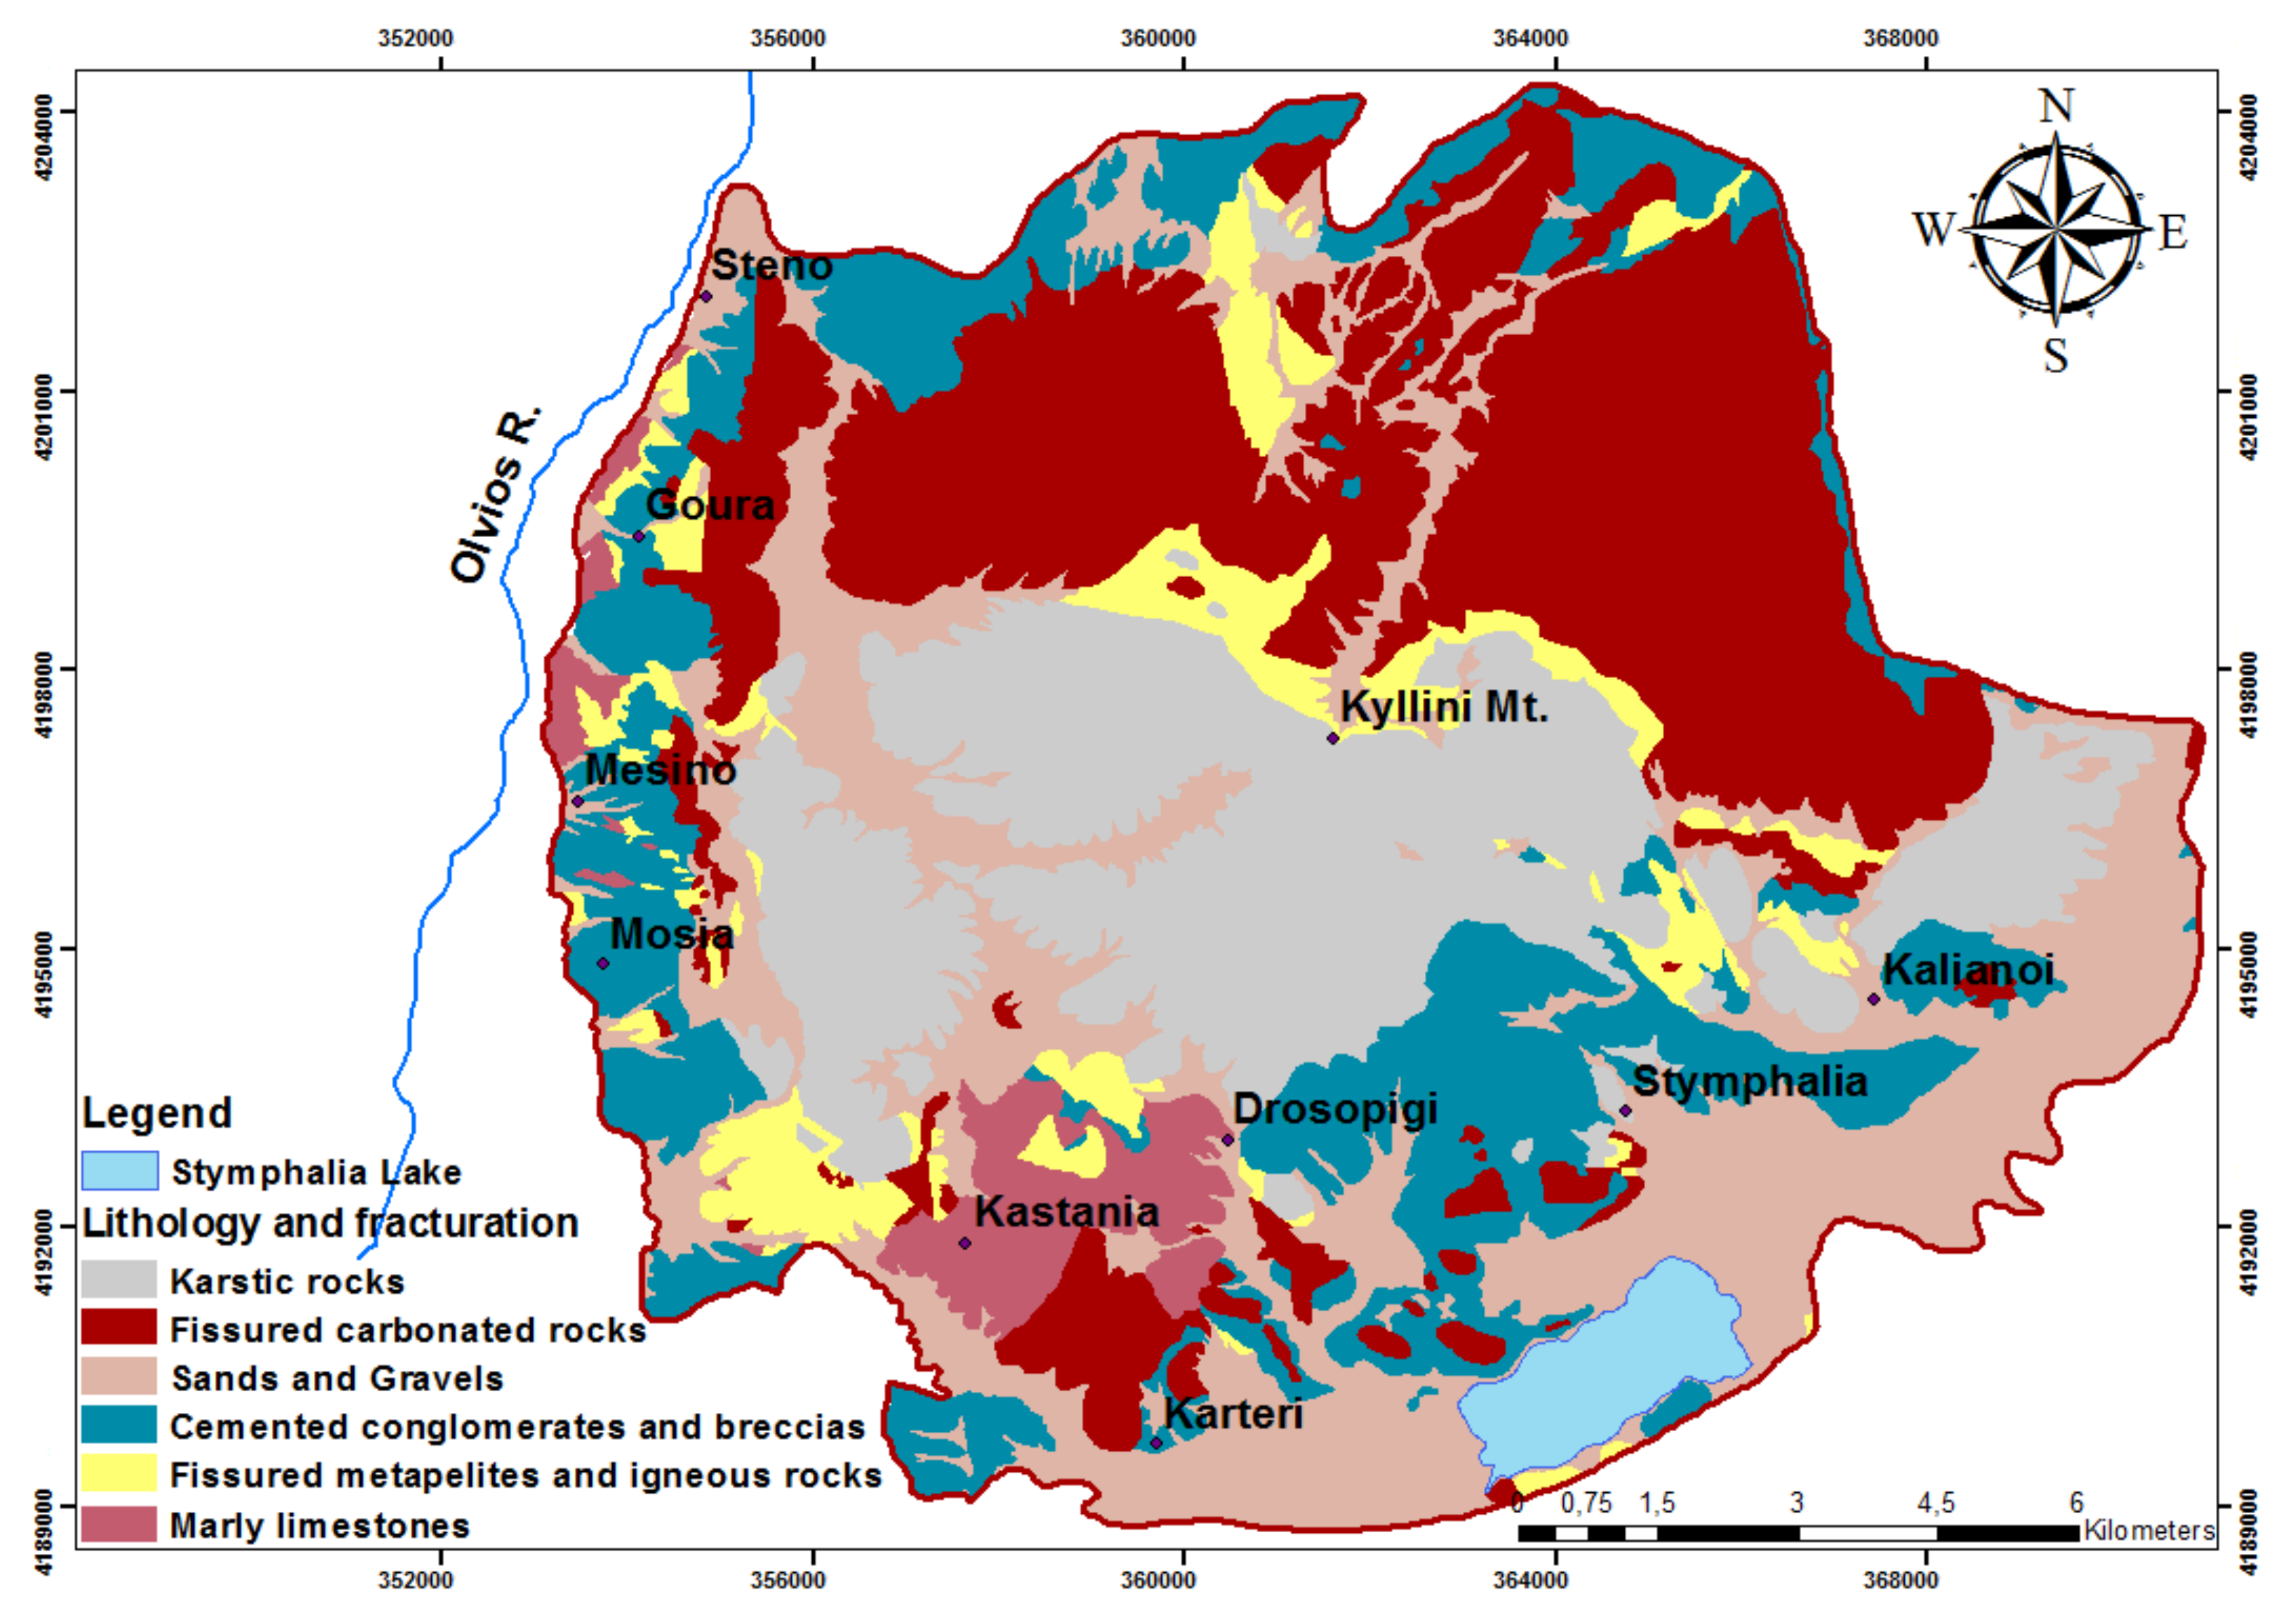
As shown in Figure 4, a large part of Kyllini Mountain is composed of bare rock. After combining the lithological data from the geological map of the study area (Figure 1), which has been produced by the digitization of the geological sheets 1:50,000 Kandhila [30] and Nemea [31] in the ArcGIS 10.1 environment with the standard values provided by the COP method, the lithology map [OL] was generated (Figure 4 and Figure 5).
The O score is obtained by adding the two subfactors soil (Os) and Lithology (OL), supplying a corresponding protection value (Figure 6). The lowest values of the O score correspond to Kyllini Mountain, where carbonates outcrop and soil is absent.
Higher score values correspond to areas where the soils are present and the lithological formations are of low permeability, such as cemented conglomerates and breccias, as well as fissured carbonate outcrops. The lower the protection value (O score) the higher the vulnerability of the karst aquifer.
4.2. C Factor
For the detection of the land surface karst features of a landscape, aerial photos, digital terrain models, and satellite images can be used [11,32]. In this study, for the digitization of the karstic features, several scanned black and white 1:30,000 aerial photographs were selected and purchased from the Hellenic Military Geographical Service. Erdas Imagine 10 software was used for the geometrical correction of the photos using ground control points (GCPs). The next step was the creation of the digital elevation model (DEM), using stereopairs that enabled a three-dimensional representation of the orthophotos and a substantial understanding of the relief of the study area allowing the digitization of karstic features, such as dolines.
The map of the surface features parameter shown in Figure 7 presents high karstification at the central part of the study area, the Kyllini Mountain, and at the south part, where the polje of Stymfalia is located.
Slope and vegetation maps of the study area are also produced and evaluated (Figure 8). When the slope is steep and the vegetation is absent, the surface runoff is more intense and the protection provided by the overlying layers (O factor) is not reduced [2].
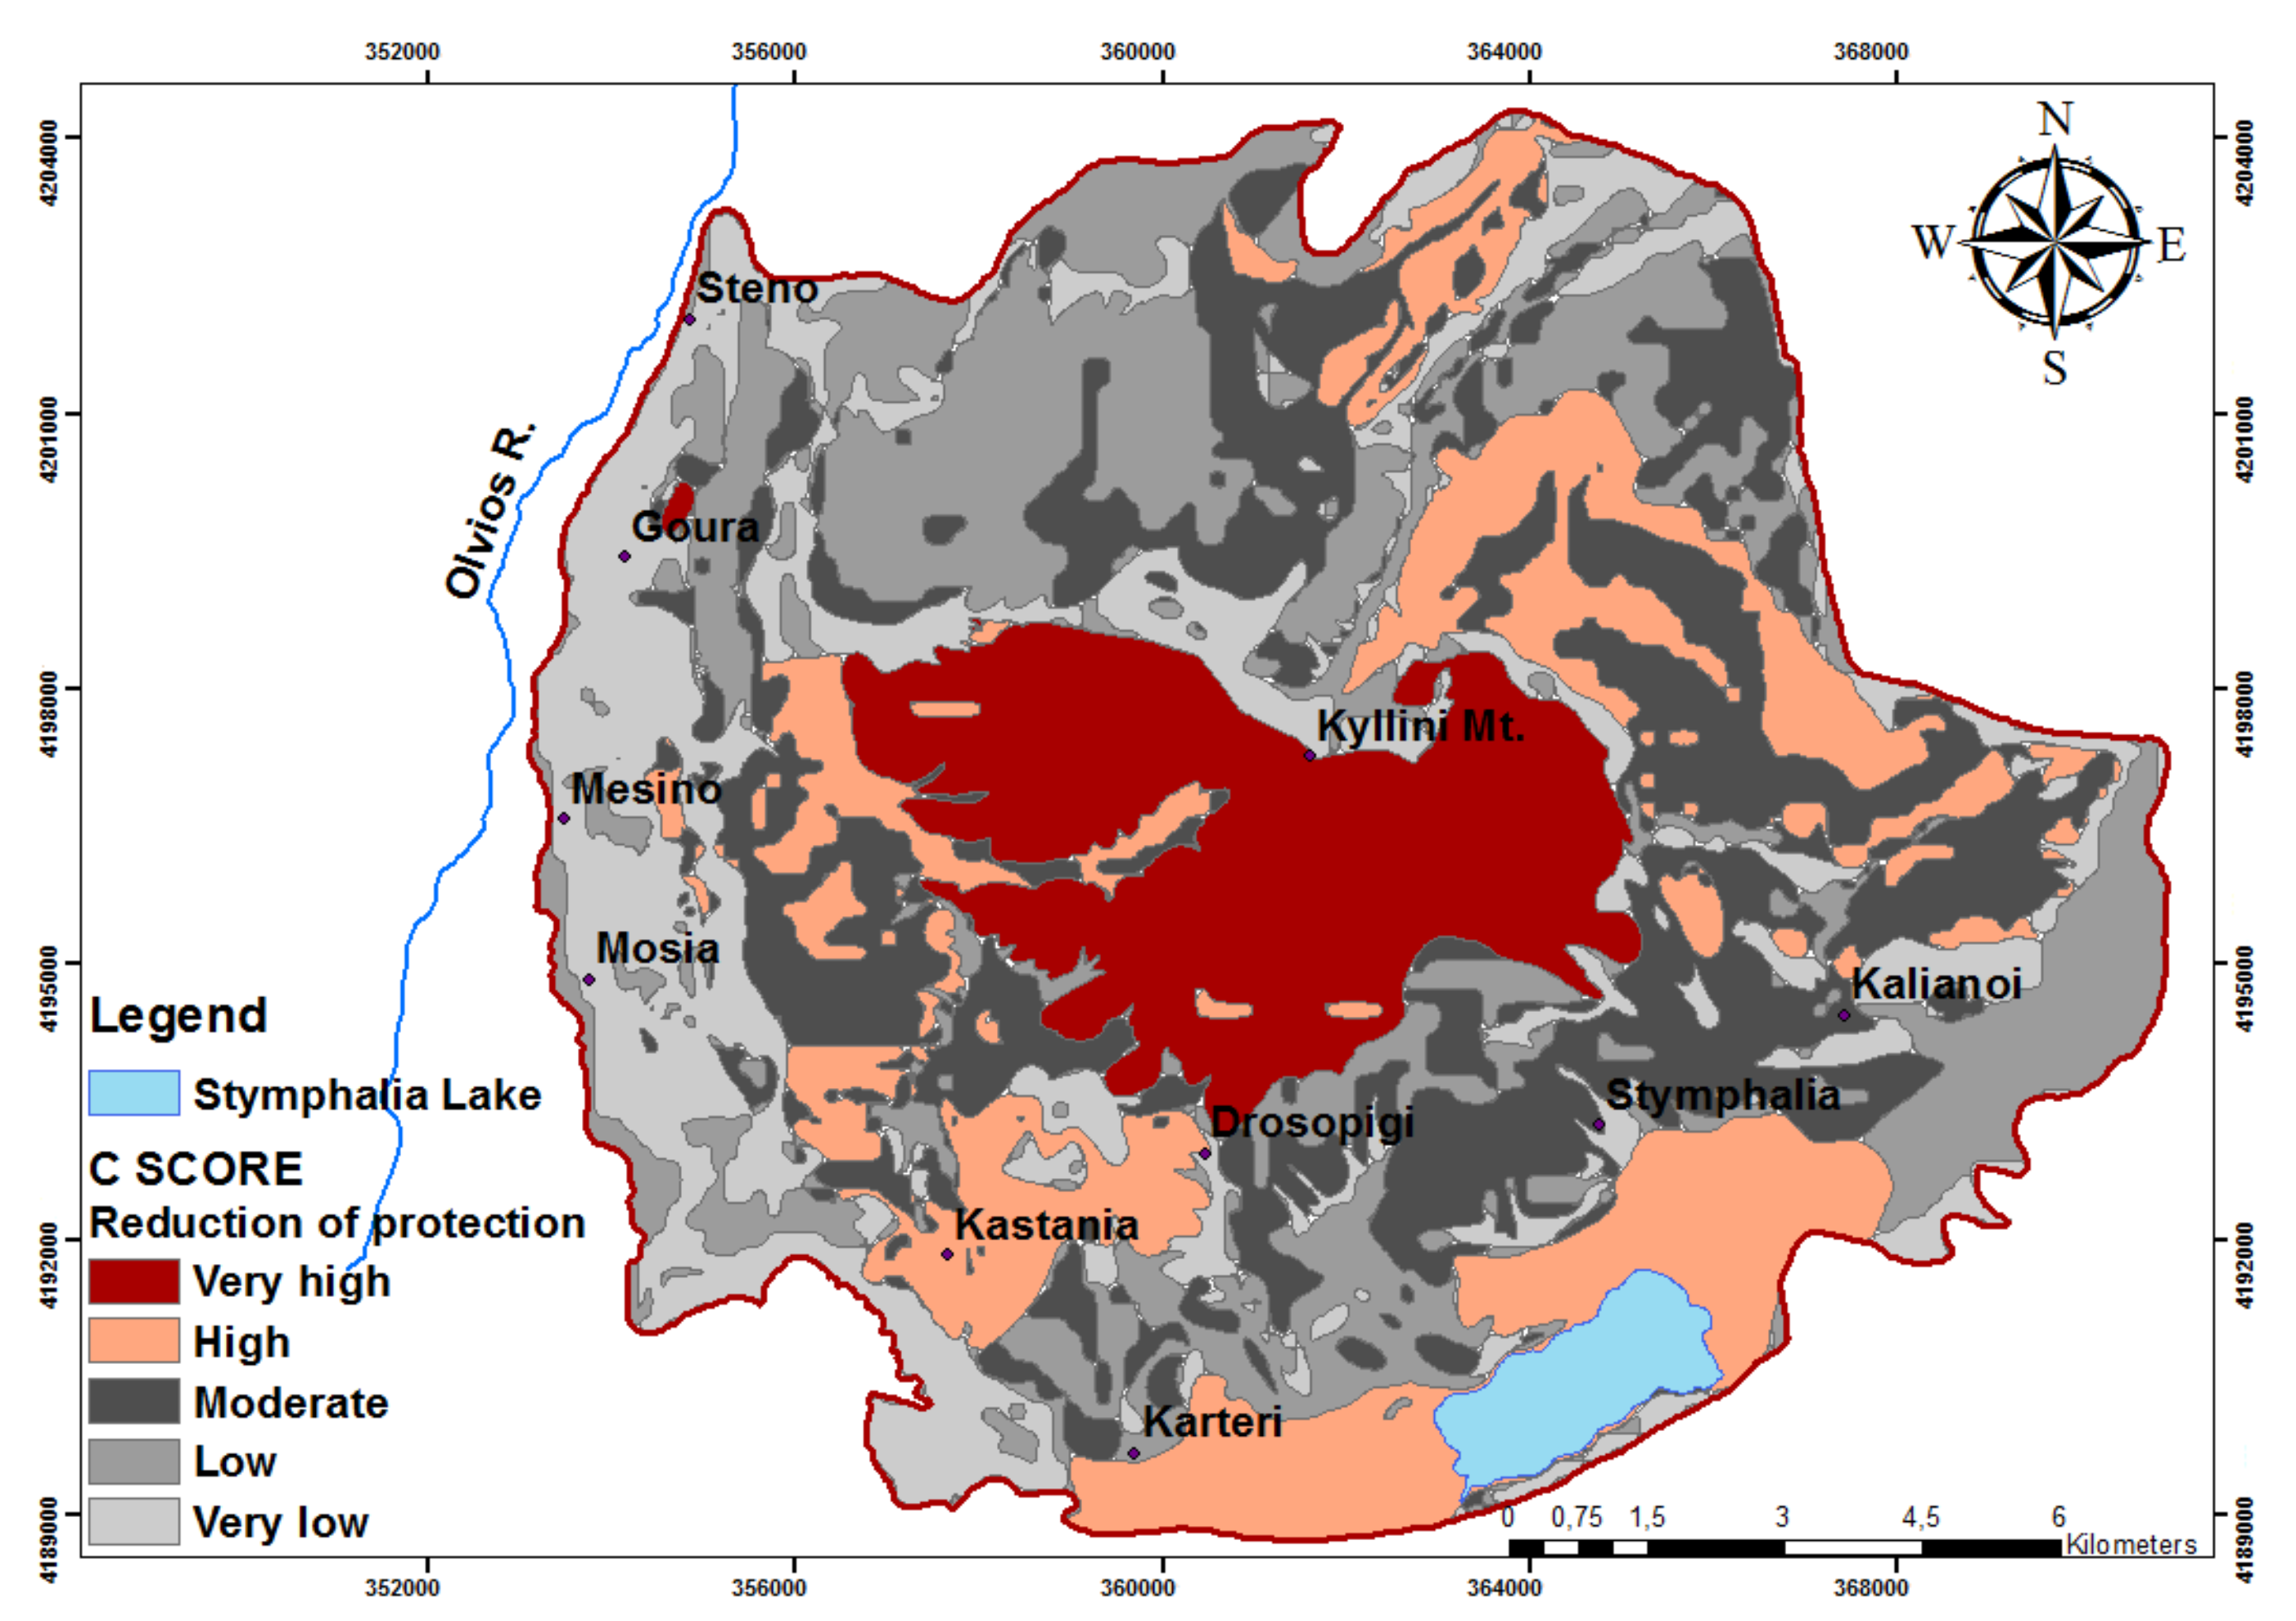
To obtain the C score map (Figure 9) the slope-vegetation (sv) parameter is weighted by the surface features (sf) [2].
The reduction of protection provided by the overlying layers (C score) appears to be very high in the uncovered carbonate outcrops of Mt Kyllini, where dolines are present, high in the polje of Stymfalia due to the absence of slope and the presence of a swallow hole. In the rest of the area the C score ranges mainly from moderate to very low.
4.3. P Factor
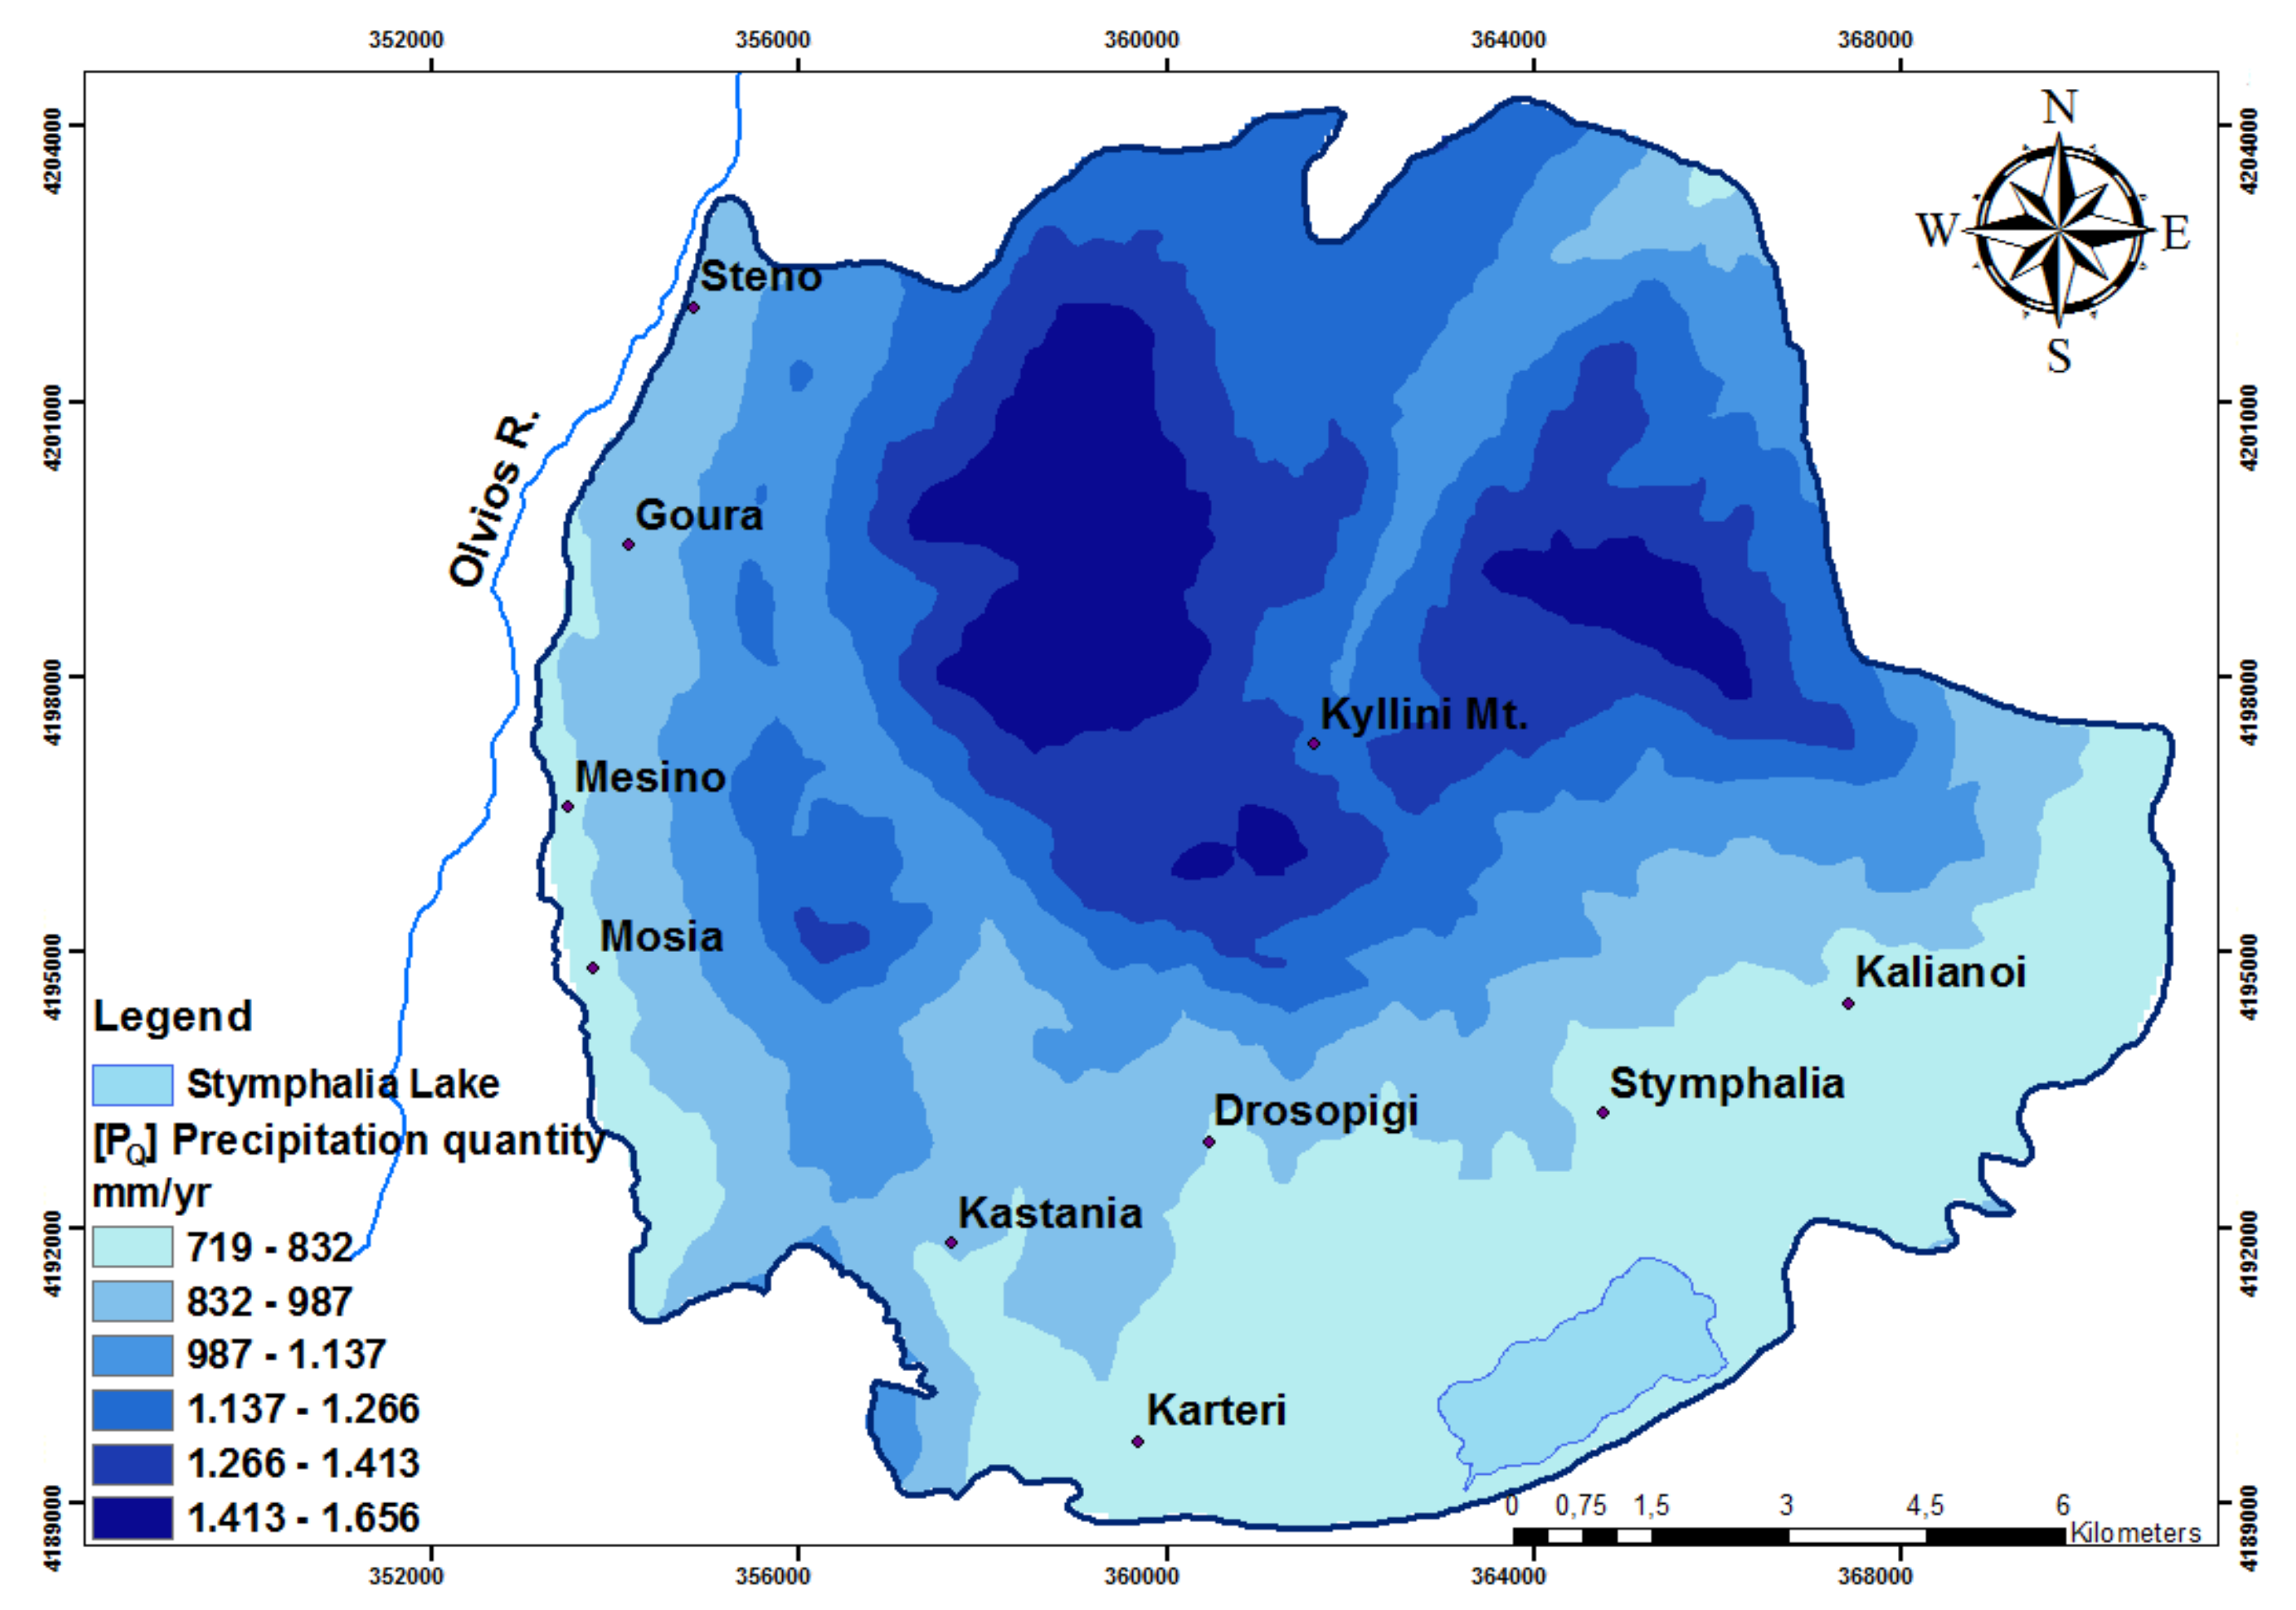
The P factor is evaluated by two sub-factors, Quantity of precipitation (PQ) and temporal distribution of precipitation (PI). The PQ factor describes the effect of rainfall quantity and annual recharge on groundwater vulnerability [2]. In order to create the [PQ] map the precipitation data of wet years from 11 rainfall stations from 1975–2015 were used. For this time period, the mean annual precipitation ranges from 719 to 1656 mm (Figure 10).
In Mediterranean carbonate aquifers, the annual average recharge rate ranges from 35% to 55% of the annual rainfall [33]. In these aquifers, an increase of precipitation up to 800–1200 mm increases the reduction of the protection and consequently the vulnerability of the aquifer, because the transit time for the contaminants towards the groundwater is the most important process [2].
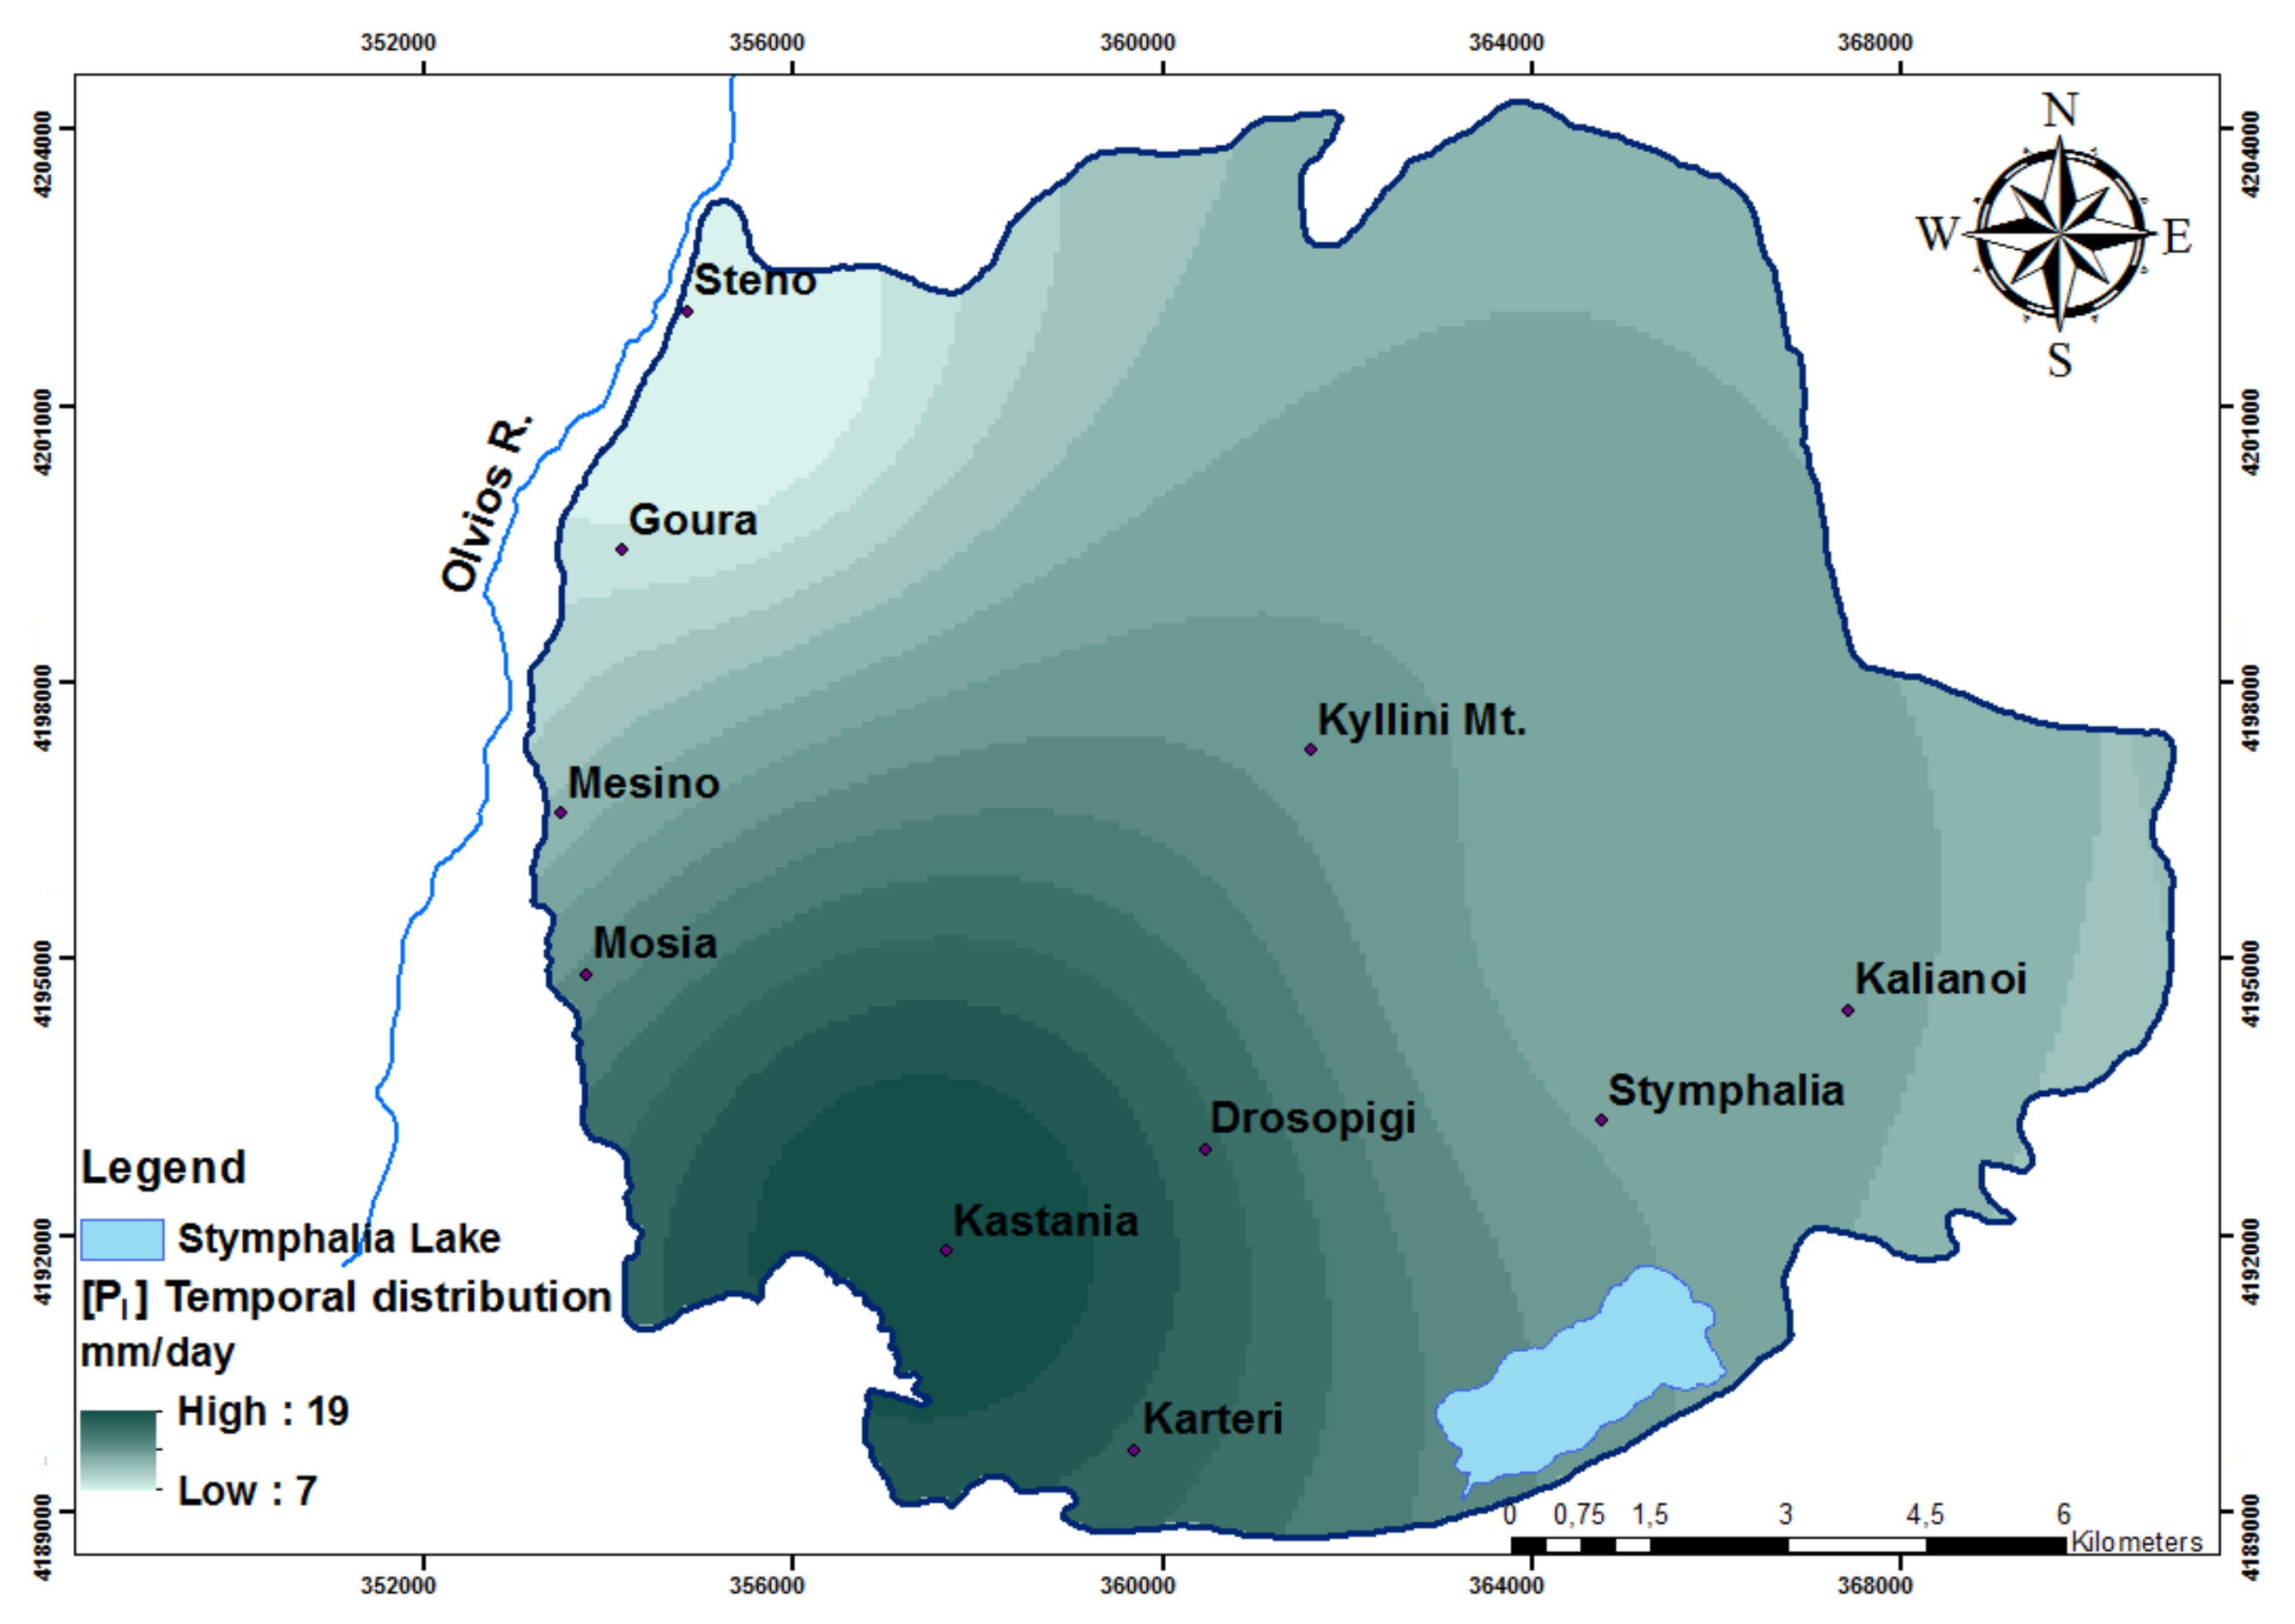
The PI factor describes the temporal distribution of precipitation for a time period. Since this is indicative of the intensity of precipitation, it makes possible the comparison between different regions of Europe, where rainfall and intensity vary considerably [2]. For the estimation of the PI factor, the mean annual precipitation and the number of rainy days of wet years for the last ten years were calculated. Using the following formula, the temporal distribution map was obtained (Figure 11).
Temporal distribution = P(mm/year)/No rainy days
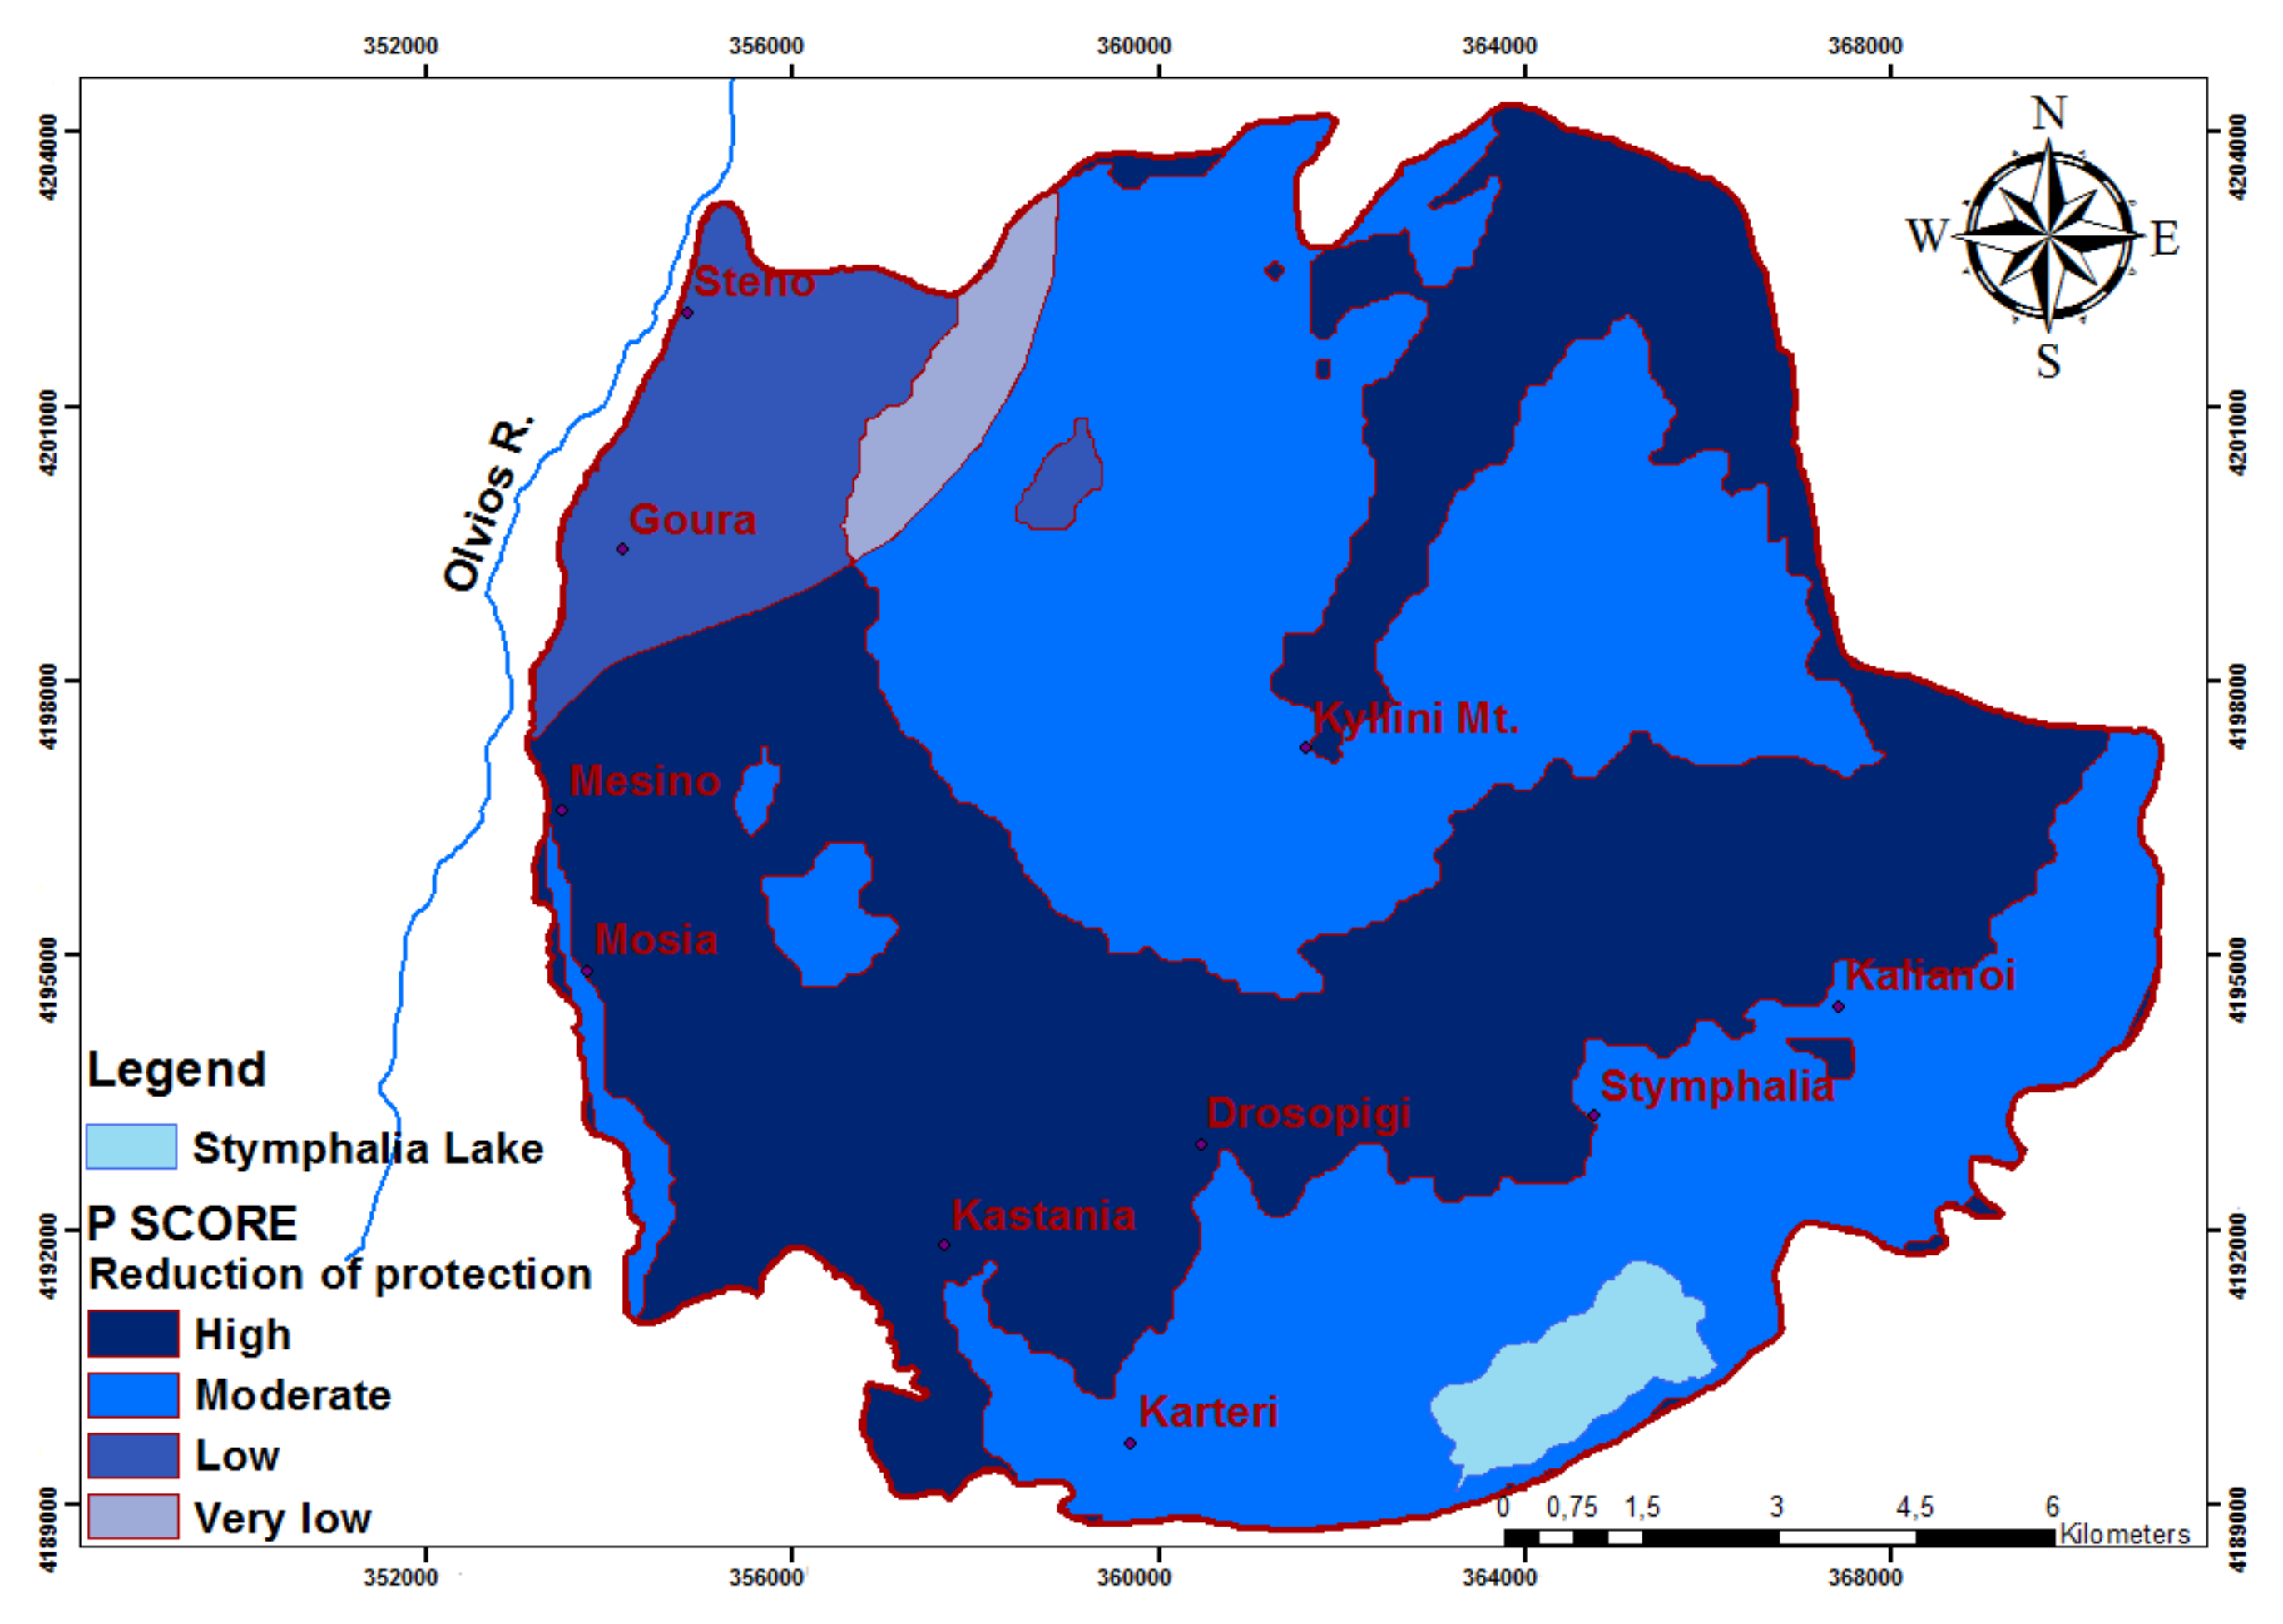
The final map of factor P was made by combining the two sub-factors (Figure 12). Higher values of P factor indicate an increased reduction of protection.
4.4. COP Vulnerability Index
The three factors of the COP method have been multiplied according to the following formula in order to estimate the intrinsic vulnerability of the aquifer.
COP Index = C · O · P
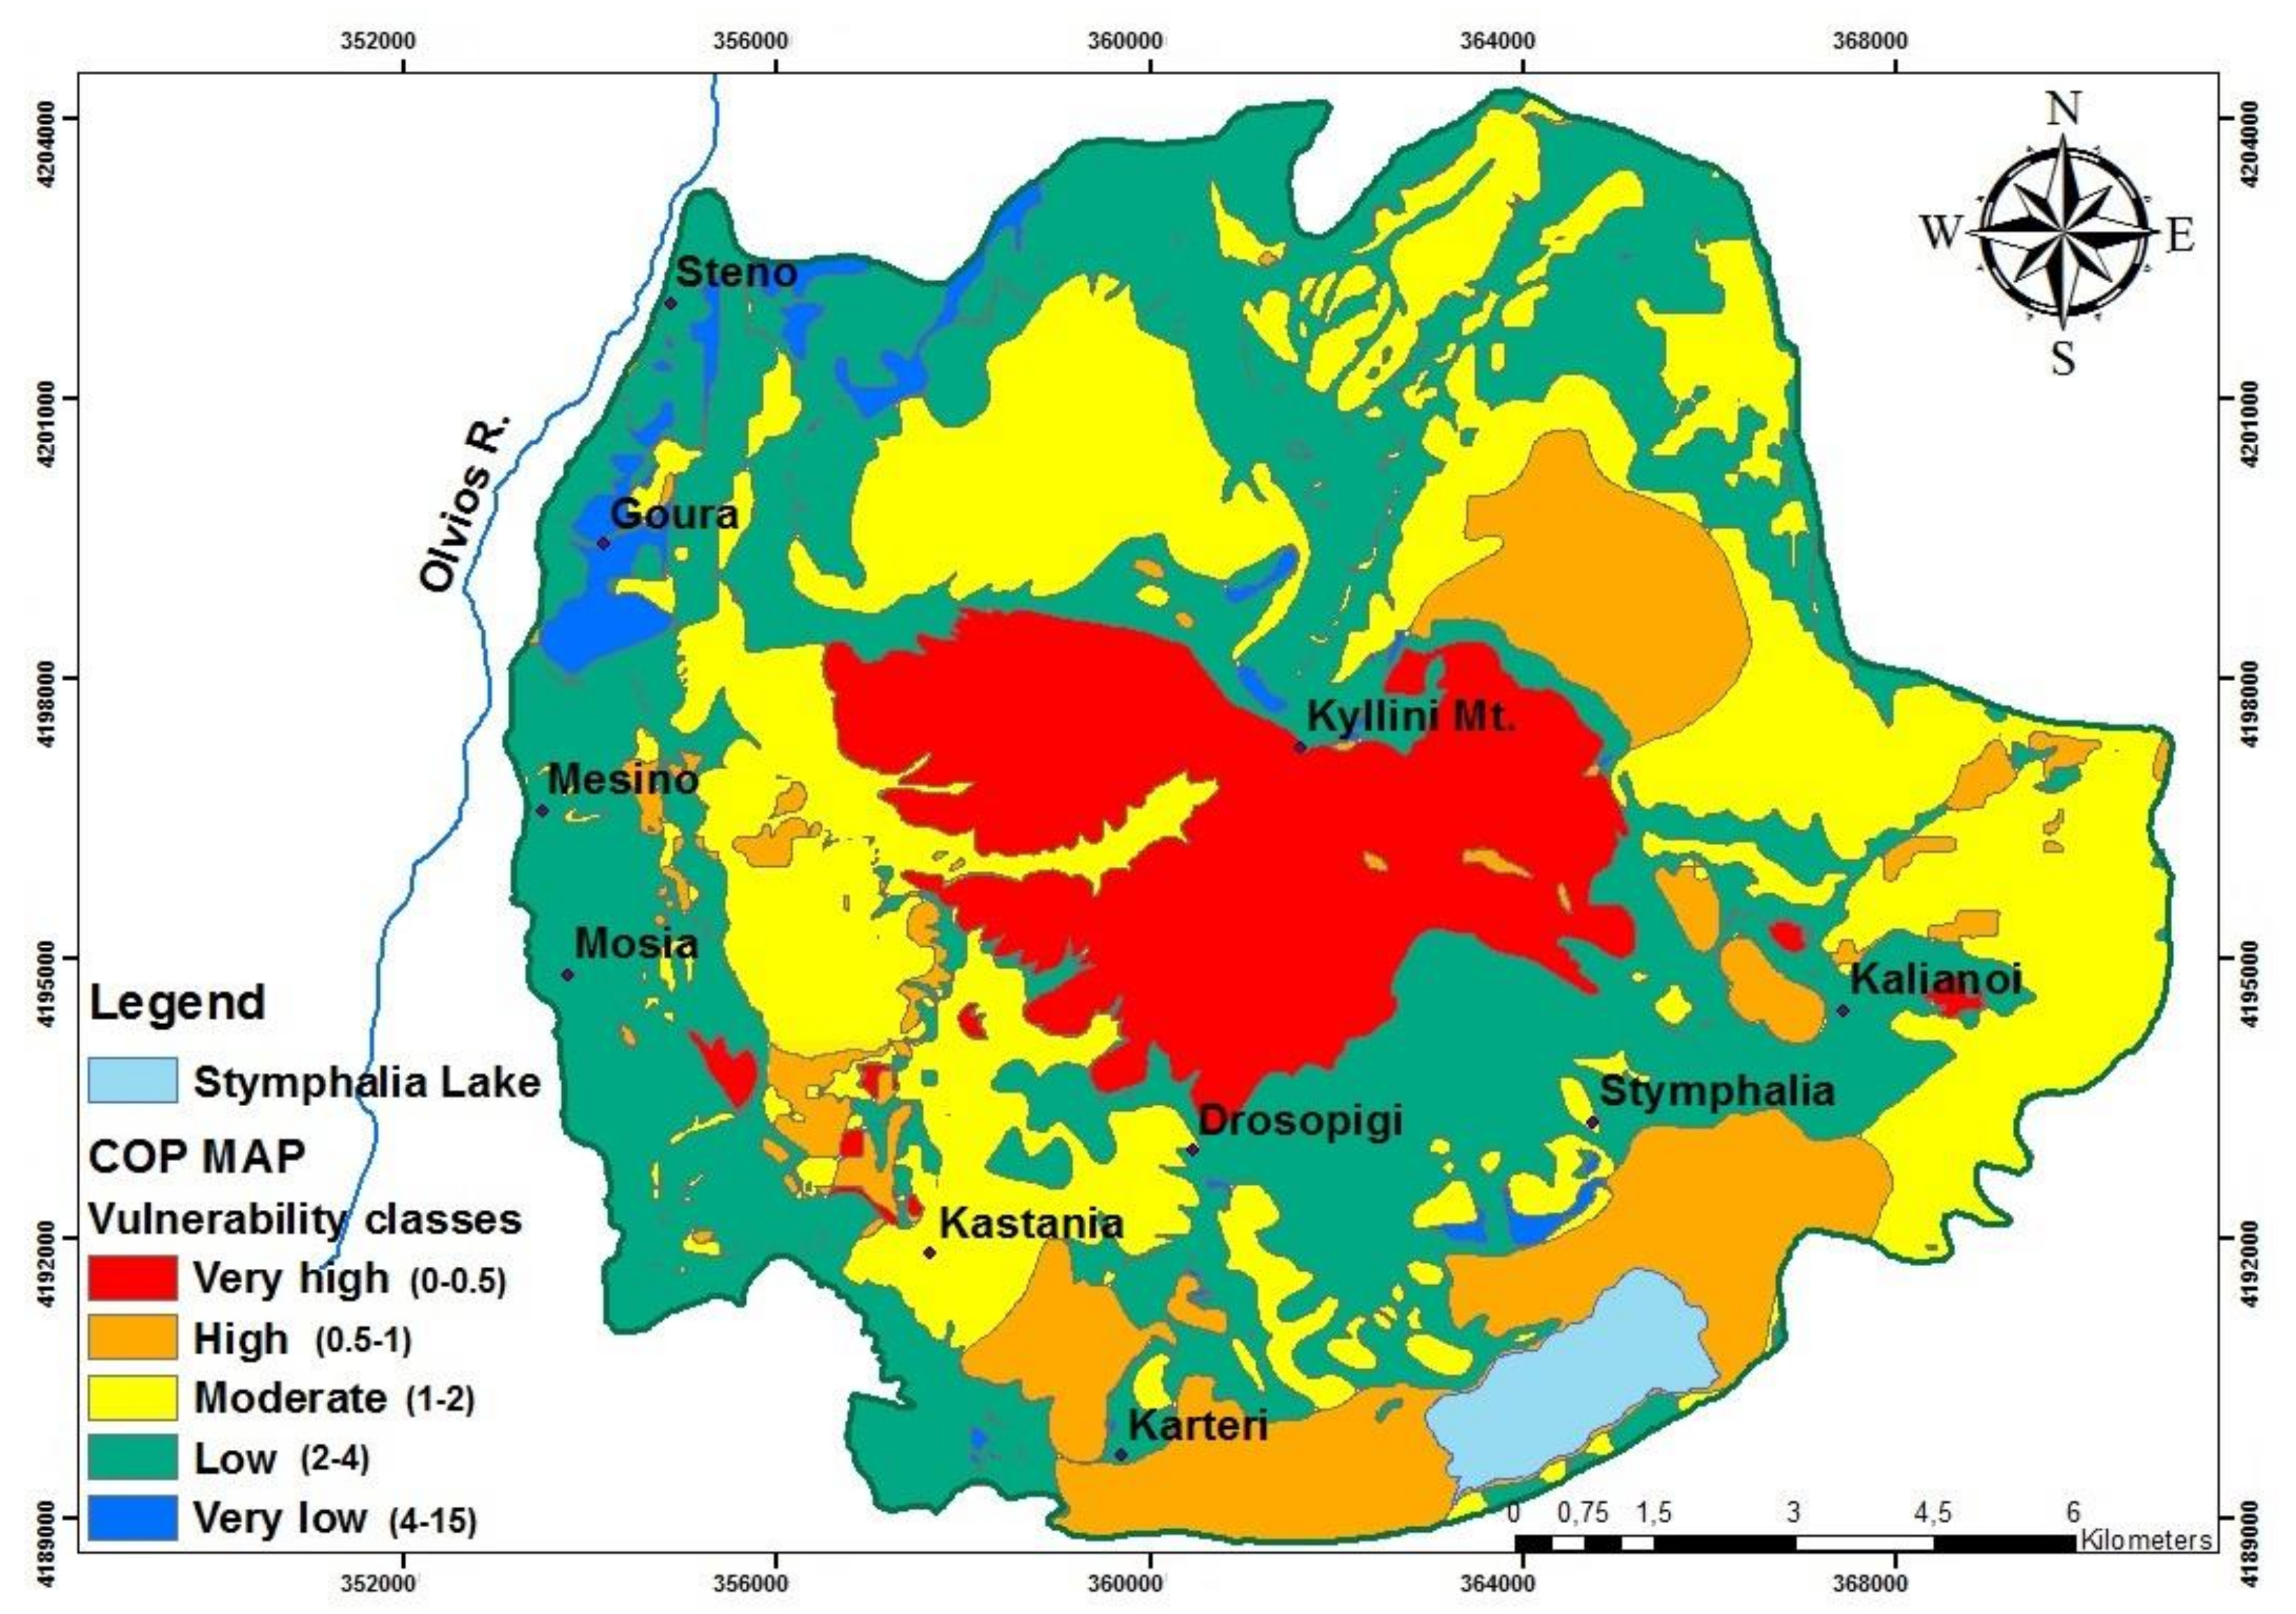
Each factor is thought to affect the protective capacity and hence the vulnerability of the karst aquifer. The COP index values are grouped according to the method in five classes (very low, low, moderate, high and very high), as shown in Figure 2 [7]. The COP map of the Ziria karst system presents a very high vulnerability index in the carbonate outcrops of Kyllini Mountain, due to the high degree of karstification, which favors the rapid infiltration from the surface to groundwater (Figure 13). This fact is also reinforced by the rapid response of the karst springs draining the system in respect to the precipitation [13].
The carbonate outcrops of Kyllini Mt., having a very high vulnerability index, present low protection by the overlying layers (O factor), due to the absence of soil (Figure 5). The polje of Stymfalia at the south part of the area is classified as a high vulnerability region due to the presence of a swallow hole. The low-vulnerability areas correspond to conglomerates and breccias, where the absence of karst features and the gentle slope promote runoff towards the edge of the aquifer.
5. Validation of the Intrinsic Vulnerability Maps
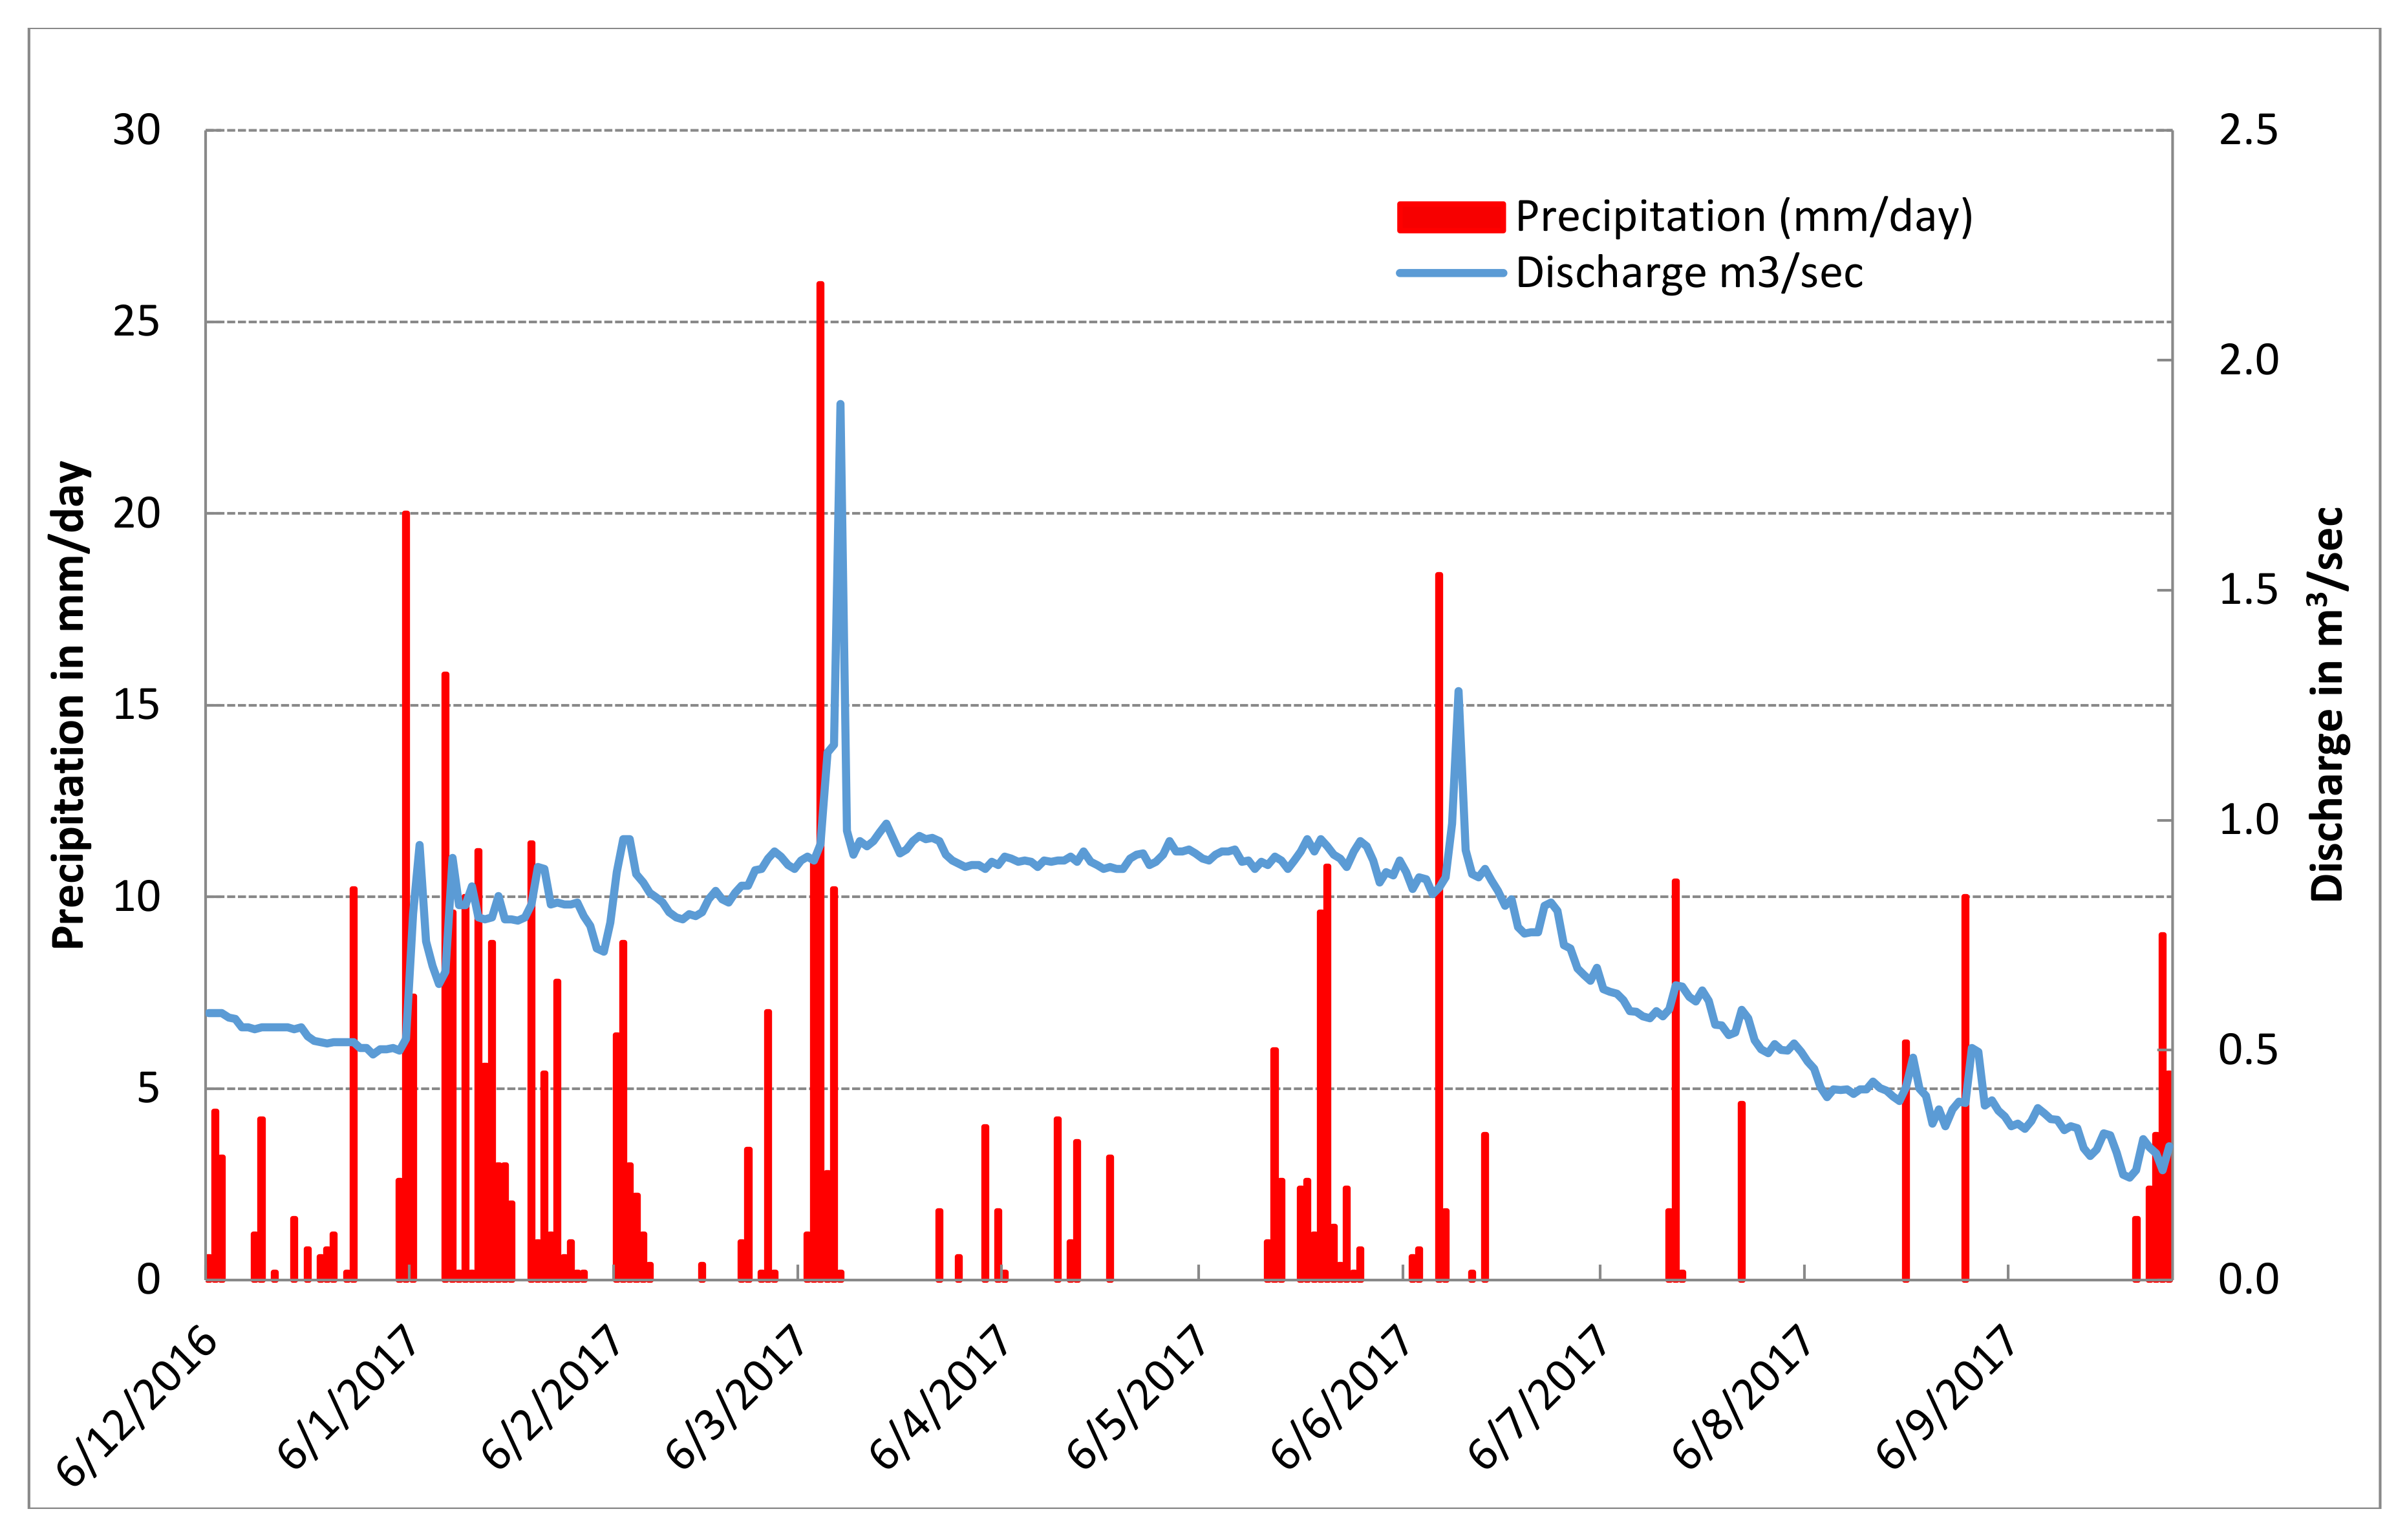
Vulnerability maps must be validated to make them useful for land planning and groundwater protection. Several tools such as hydrographs, chemographs and tracers can be used for the validation [7]. In the frame of this study, the validations of the vulnerability maps were performed using the hydrograph of the spring Stymfalia (Figure 14), while the validation of the vulnerability maps of the study site by other methods, such as the hydrochemical response at springs and the hydrodynamic modeling is in progress.
Figure 14 depicts that the rainfall signal remains within the hydrodynamic response of the aquifer during the spring. This indicates a rapid infiltration of the rainwater and demonstrates the high vulnerability to pollution of the Ziria karst aquifer.
6. Conclusions
The COP method has been successfully used for the evaluation of the intrinsic vulnerability of groundwater in karst aquifers in Mediterranean countries. This method has also been applied in the Ziria karst system in the Northeast Peloponnese, South Greece. The distribution of the degrees of vulnerability in the study area that were obtained using the COP method is realistic and conformable with the current hydrogeological knowledge and understanding of this aquifer. Validation of the vulnerability maps produced using COP method is enhanced by the hydrograph of the spring Stymfalia with respect to rainfall. Generally, the resulting vulnerability maps that have been obtained using this method can be used as the basis for the delineation of protection zones.
Acknowledgments
The authors thank the two anonymous reviewers for their valuable comments.
Author Contributions
This research is a part of Eleni-Anna Nanou’s Master Thesis. Eleni Zagana is the supervisor professor of Eleni-Anna Nanou. The field works have been done from Eleni-Anna Nanou and Eleni Zagana. The application of COP has been done from Eleni-Anna Nanou and the corrections have been done from Eleni Zagana. The major part of the paper has been written from Eleni Zagana.
Conflicts of Interest
The authors declare no conflict of interest.
References
- Doerfliger, N.; Zwahlen, F. EPIK: A new method for outlining of protection areas in karstic environment. In International Symposium and Field Seminar on “Karst Waters and Environmental Impacts”; Gunay, G., Jonshon, A.I., Eds.; IAEA: Antalya, Turkey; Balkema, Rotterdam, 1997; pp. 117–123. [Google Scholar]
- Zwahlen, F. COST Action 620 Vulnerability and Risk Mapping for the Protection of Carbonate (Karst) Aquifers Final Report; European Commission, Directorat-General XII Science, Research and Development: Luxemburg, 2003. [Google Scholar]
- Daly, D.; Dassargues, A.; Drew, D.; Dunne, S.; Goldscheider, N.; Neale, S.; Popescu, I.C.; Zwahlen, F. Main concepts of the “European approach” to karst-groundwater-vulnerability assessment and mapping. Hydrogeol. J. 2002, 10, 340–345. [Google Scholar] [CrossRef]
- Goldscheider, N.; Klute, M.; Sturm, S.; Hotzl, H. The PI method—A GIS based approach to mapping groundwater vulnerability with special consideration of karst aquifers. Zeitschrift für angewandte Geologie 2000, 463, 157–166. [Google Scholar]
- Davis, A.D.; Long, A.J.; Wireman, M. KARSTIC: A sensitive method for carbonate aquifers in karst terrain. Environ. Geol. 2002, 42, 65–72. [Google Scholar] [CrossRef]
- Vías, J.M.; Andreo, B.; Perles, M.J.; Carrasco, F.; Vadillo, I.; Jiménez, P. Preliminary proposal of a method for vulnerability mapping in carbonate aquifers. In Proceedings of the 2nd Nerja Cave Geological Symposium and Environment, Nerja, Spain, 15–17 October 2002. [Google Scholar]
- Vías, J.M.; Andreo, B.; Perles, M.J.; Carrasco, F.; Vadillo, I.; Jiménez, P. Proposed method for groundwater vulnerability mapping in carbonate (karstic) aquifers: The COP method. Hydrogeol. J. 2006, 14, 912–925. [Google Scholar] [CrossRef]
- Andreo, B.; Ravbar, N.; Vías, J.M. Source vulnerability mapping in carbonate (karst) aquifers by extension of the COP method: Application to pilot sites. Hydrogeol. J. 2009, 17, 749–758. [Google Scholar] [CrossRef]
- Ravbar, N.; Goldscheider, N. Comparative application of four methods of groundwater vulnerability mapping in a Slovene karst catchment. Hydrogeol. J. 2009, 17, 725–733. [Google Scholar] [CrossRef]
- Kavouri, K.; Plagnes, V.; Tremoulet, J.; Dörfliger, N.; Rejiba, F.; Marchet, P. PaPRIKa: A method for estimating karst resource and source vulnerability-application to the Ouysse karst system (southwest France). Hydrogeol. J. 2011, 19, 339–353. [Google Scholar] [CrossRef]
- Kazakis, N.; Oikonomidis, D.; Voudouris, K.S. Groundwater vulnerability and pollution risk assessment with disparate models in karstic, porous, and fissured rock aquifers using remote sensing techniques and GIS in Anthemountas basin, Greece. Environ. Earth Sci. 2015, 74, 6199–6209. [Google Scholar] [CrossRef]
- Koutsi, R. The Role of Epikarst in Assessing and Mapping the Vulnerability of Karst Formations Using the European Method. Ph.D. Thesis, Kapodistrian University, Athens Greece, 2007. [Google Scholar]
- Nanou, E. Investigating the Intrinsic Vulnerability of the Ziria Karst System. Master’s Thesis, University of Patras, Rion, Greece, 2017. [Google Scholar]
- Kakavas, M. Investigation of the Intrinsic Vulnerability of the Karst System of the Triassic Carbonate Breccia in SW Aitoloakarnania. Master’s Thesis, University of Patras, Rion, Greece, 2015. [Google Scholar]
- Antonakos, A.K.; Lambrakis, N.J. Development and testing of three hybrid methods for the assessment of aquifer vulnerability to nitrates, based on the drastic model, an example from NE Korinthia, Greece. J. Hydrol. 2007, 333, 288–304. [Google Scholar] [CrossRef]
- Kazakis, N.; Voudouris, K. Comparison of three applied methods of groundwater vulnerability mapping: A case study from the Florina basin, Northern Greece. In Proceedings of the 9th International Hydrogeological Congress, Kalavrita, Greece, 5–7 October 2011; Volume 2, pp. 359–367. [Google Scholar]
- Panagopoulos, G.; Antonakos, A.; Lambrakis, M. Optimization of the DRASTIC method for groundwater vulnerability assessment via the use of simple statistical methods and GIS. Hydrogeol. J. 2005, 14, 894–911. [Google Scholar] [CrossRef]
- Voudouris, K.; Kazakis, N.; Polemio, N.; Kareklas, K. Assessment of intrinsic vulnerability using the DRASTIC model and GIS in the Kiti aquifer, Cyprus. Eur. Water 2010, 30, 13–24. [Google Scholar]
- Vrba, J.; Zaporozec, A. (Eds.) Guidebook on mapping groundwater vulnerability. In Proceedings of the International Contributions to Hydrogeology; Heise: Hanover, Germany, 1994. [Google Scholar]
- Andreo, B.; Goldscheider, N.; Vadillo, I.; Vías, J.M.; Neukum, C.; Sinreich, M.; Jimenez, P.; Brechenmacher, J.; Carrasco, F.; Hotzl, H.; et al. Karst groundwater protection: First application of a Pan-European Approach to vulnerability, hazard and risk mapping in the Sierra de Líbar (Southern Spain). Sci. Total Environ. 2005, 357, 54–73. [Google Scholar] [CrossRef] [PubMed]
- Goldscheider, N.; Popescu, C. The European approach. In Vulnerability and Risk Mapping for the Protection of Carbonate (Karst) Aquifers; Zwahlen, F., Ed.; European Commission: Brussels, Belgium, 2004; pp. 17–21. [Google Scholar]
- European Commission. Common Implementation Strategy for the Water Frame—Work Directive (200/60/EC); Guidance Document No. 16 on Groundwater in Drinking Water Protected Areas; European Commission: Brussels, Belgium, 2007. [Google Scholar]
- Marín, A.I.; Andreo, B.; Mudarra, M. Vulnerability mapping and protection zoning of karst springs. Validation by multitracer tests. Sci. Total Environ. 2015, 532, 435–446. [Google Scholar] [CrossRef] [PubMed]
- Turpaud, P.; Zini, L.; Ravbar, N.; Cucci, F.; Petrix, M.; Urbanc, J. Development of a protocol for Karst Water source protection zoning: Application to the Classical Karst region (NE Italy and SW Slovenia). Water Resour. Manag. 2018, 1–16. [Google Scholar] [CrossRef]
- Morfis, A.; Zojer, H. (Eds.) Hydrotectonic systems-Stymphalia polje. In Karst Hydrology of the Central and Eastern Peloponnesus Greece; Springer: Berlin, Germany, 1986. [Google Scholar]
- Heymann, C.; Nelle, O.; Dörfler, W.; Zagana, H.; Nowaczyk, N.; Xue, J.; Unkel, I. Late Glacial to mid-Holocene palaeoclimate development of southern Greece inferred from the sediment sequence of Lake Stymphalia (NE-Peloponnese). Quat. Int. 2013, 302, 42–60. [Google Scholar] [CrossRef]
- Zervogiannis, G. Hydrogeological Study of the Stymphalia Springs 1991; Ministry of Agriculture: New Delhi, India, 1991.
- Hadzic, E.; Lazovic, N.; Mulaomerovic-Seta, A. The importance of groundwater vulnerability maps in the protection of groundwater sources. Key study, Sarajevsko Polje. Procedia Environ. Sci. 2015, 25, 104–111. [Google Scholar] [CrossRef]
- FAO; UNESCO. Soil Map of the World 1:5.000.000; Soil Map of the World Project; The International Union of Soil Science (IUSS): Madison, WI, USA, 1978. [Google Scholar]
- Wever, P.D.; Dercourt, J.; Fleury, J.J. Geological Sheet of Kandhila 1:50.000; Institute of Geology and Mineral Exploration: Athens, Greece, 1975.
- Tataris, A.; Maragoudakis, N.; Kounis, G. Geological Sheet of Nemea 1:50.000; Institute of Geology and Mineral Exploration: Athens, Greece, 1964.
- Kakavas, M.P.; Nikolakopoulos, K.G.; Zagana, E. Karst features detection and mapping using airphotos, DSMs and GIS techniques. Proc. SPIE 2015, 9644, 1–10. [Google Scholar] [CrossRef]
- Lopez-Geta, J.A.; Andreo, B.; Vıas, J.; Duran, J.J.; Carrasco, F.; Jimenez, P. Aproximacion Metodologica Paraevaluar la Recarga en Acuıferos Carbonaticos; International Congress of IAH: Zacatecas, Mexico, 2004. [Google Scholar]
Figure 1.
Geological setting of the study area.

Figure 2.
Diagram of the COP Method, showing the differentiation of the C, O and P factors ([7], modified).
Figure 2.
Diagram of the COP Method, showing the differentiation of the C, O and P factors ([7], modified).

Figure 3.
Soil map of the study area.

Figure 4.
Map of OS factor of the study area.

Figure 5.
Lithology map [O L] of the study area.

Figure 6.
Map of O score in the study area.

Figure 7.
Map of surface features of the study area.

Figure 8.
(a) Slope map, (b) Vegetation map.

Figure 9.
Map depicting the C score.

Figure 10.
The mean annual precipitation map [PQ].

Figure 11.
Map of Precipitation temporal distribution.

Figure 12.
Map of P factor.

Figure 13.
Vulnerability map in the study area.

Figure 14.
Hydrograph of Stymfalia spring with respect to rainfall.


Table 1.
Values for COP factors and variables in the study area.
| Factor | Subfactor | Variable | Values | |
|---|---|---|---|---|
| O | Soil [OS] | Texture and thickness | No Soil | 0 |
| Loam 0.5–1 m | 2 | |||
| Sandy >1 m | 2 | |||
| Sandy 0.5–1 m | 1 | |||
| Sandy <1 m | 0 | |||
| Lithology [OL] | Lithology and fracture characteristics | |||
| Metamorphic series | 400 | |||
| Conglomerate and breccia | 40 | |||
| Alluvials & rockfalls | 10 | |||
| Triassic limestones & dolomites | 3 | |||
| Cretaceous limestones | 1 | |||
| C | Surface features | Karst uncovered & developed | 0.25 | |
| Developed karst covered by a permeable bed | 0.5 | |||
| Karst scarcely developed and uncovered | 0.5 | |||
| Karst scarcely developed and covered by a permeable bed | 0.75 | |||
| Fissured and uncovered carbonate rocks | 0.75 | |||
| Non karstic terrains | 1 | |||
| Slope and vegetation | 0–8% | 0.75 | ||
| 8–31% with high vegetation | 0.8 | |||
| 8–31% with low vegetation | 0.85 | |||
| 31–76% with high vegetation | 0.9 | |||
| 31–76% with low vegetation | 0.95 | |||
| >76% | 1 | |||
| Confining conditions | Unconfined | 1 | ||
| P | Quantity [PQ] | Average precipitation | <1600 mm/year | 0.4 |
| 1200–1600 mm/year | 0.3 | |||
| 800–1200 mm/year | 0.2 | |||
| 719–800 mm/year | 0.3 | |||
| Intensity [PI] | Precipitation and number of rainy days | <10 | 0.6 | |
| 10–20 | 0.4 |
© 2018 by the authors. Licensee MDPI, Basel, Switzerland. This article is an open access article distributed under the terms and conditions of the Creative Commons Attribution (CC BY) license (http://creativecommons.org/licenses/by/4.0/).
Share and Cite
MDPI and ACS Style
Nanou, E.-A.; Zagana, E. Groundwater Vulnerability to Pollution Map for Karst Aquifer Protection (Ziria Karst System, Southern Greece). Geosciences 2018, 8, 125. https://doi.org/10.3390/geosciences8040125
AMA Style
Nanou E-A, Zagana E. Groundwater Vulnerability to Pollution Map for Karst Aquifer Protection (Ziria Karst System, Southern Greece). Geosciences. 2018; 8(4):125. https://doi.org/10.3390/geosciences8040125
Chicago/Turabian StyleNanou, Eleni-Anna, and Eleni Zagana. 2018. "Groundwater Vulnerability to Pollution Map for Karst Aquifer Protection (Ziria Karst System, Southern Greece)" Geosciences 8, no. 4: 125. https://doi.org/10.3390/geosciences8040125
Note that from the first issue of 2016, this journal uses article numbers instead of page numbers. See further details here.