Estimation of Carbon Dioxide Emissions Generated by Building and Traffic in Taichung City


Department of Architecture, National Cheng Kung University, 1 University Road, Tainan 701, Taiwan
*
Author to whom correspondence should be addressed.
Sustainability 2018, 10(1), 112; https://doi.org/10.3390/su10010112
Submission received: 23 October 2017
/
Revised: 25 December 2017
/
Accepted: 27 December 2017
/
Published: 5 January 2018
(This article belongs to the Special Issue Sustainable Built Environment and Urban Growth Management)
Abstract
:The emissions of carbon dioxide generated by urban traffic is generally reflected by urban size. In order to discuss the traffic volume generated in developed buildings and road crossings in a single urban block, with the metropolitan area in Taichung, Taiwan as an example, this study calculates the mutual relationship between the carbon dioxide generated by the traffic volume and building development scale, in order to research energy consumption and relevance. In this research, the entire-day traffic volume of an important road crossing is subject to statistical analysis to obtain the prediction formula of total passenger car units in the main road crossing within 24 h. Then, the total CO2 emissions generated by the traffic volume in the entire year is calculated according to the investigation data of peak traffic hours within 16 blocks and the influential factors of the development scale of 95 buildings are counted. Finally, this research found that there is a passenger car unit of 4.72 generated in each square meter of land in the urban block every day, 0.99 in each square meter of floor area in the building and the average annual total CO2 emissions of each passenger car unit is 41.4 kgCO2/yr. In addition, the basic information of an integrated road system and traffic volume is used to present a readable urban traffic hot map, which can calculate a distribution map of passenger car units within one day in Taichung. This research unit can be used to forecast the development scale of various buildings in future urban blocks, in order to provide an effective approach to estimate the carbon dioxide generated by the traffic volume.
1. Introduction
According to the statistical data of the International Energy Agency (IEA), the global CO2 emissions increased by 88.7% from 1971 to 2004 and according to the energy consumption structure of the transportation department in Taiwan, the energy consumption of road transportation accounts for maximally 90% of the total energy consumption of the transportation department [1]. Prior to the Revolution, the content of CO2 in the atmosphere was about 280 ppm and this concentration increased to 403.3 ppm in 2016 [2].
At present, the energy consumption of the transportation department and CO2 emissions increase continuously and there are many factors influencing urban energy consumption [3]. The location of the housing and its size are the dominant factors determining energy use and greenhouse gas emissions [4]; however, in the future, research should be conducted regarding the relation between the large proportion of energy consumption in urban transportation and the development of buildings. In addition to the fact that urban areas have great influence due to land use control, zoning and building design scale, it is required to carry out overall research and analysis of the CO2 emissions generated by traffic demand, in order to effectively and completely know the overall urban energy consumption.
1.1. Method of Research on the Energy Consumption of Urban Building Groups
Of the various energy consumptions in urban areas, electricity accounts for the most and urban energy consumption can be calculated from the urban electric energy consumption model or energy use intensity, in order to obtain the urban energy consumption amount.
There are many researches in Taiwan, which are used to count and investigate the power consumption regarding the usage category, scale, or total power consumption of various buildings, in order to discuss the future power use mode or energy consumption situation of various buildings and provide forecasts and simulations in the future. In terms of power use analysis of various buildings, the building shell energy consumption ENVLOAD simple algorithm [5] is taken as the 12 variable factors to simplify climate and building design and effectively evaluate the annual air conditioning load and usage as the energy saving design method of evaluating the building shell.
In another research, the total carbon dioxide generated by a building is calculated through the life cycle assessment (LCA) [6], where the fossil fuels and electricity consumed are calculated to obtain the total amount of building material, the total amount of electricity used by the buildings, in order to calculate the complex variable regression model of CO2 emissions of RC buildings. In the current building specifications of Taiwan [5], the emissions of CO2 in RC buildings are 331 kg/m2, as obtained through the assessment of CO2 reduction indicators in the green building evaluation system.
In addition, urban energy is analyzed with the total energy consumption relation of various buildings in the urban block and the mutual change relation with the scale and use form patterns of various buildings. For various buildings, the “dynamic Energy Use Intensity (EUI) indicator method” [7] is employed to calculate the energy consumption density standard EUI (kwh/(m2·yr)) of various classified spaces and power consumption can be calculated after the summary. By calculating carbon emissions from buildings according to electricity emission factor released by the Bureau of Energy and energy usage intensity [8]; in this manner, the carbon dioxide emitted during the use of various buildings can be calculated.
Regarding the research literature of the total power consumption of all buildings in a block of a residential area [9], the site area is used as a single variable, where the floor area ratio, block shape and location, business factor, road and park area proportion, etc., are included as the variables, in order to forecast and master all power usage behaviors in the residential area. After conversion of the power consumption in the residential area, the annual power consumption is equivalent to the emissions of about 650 mt CO2.
As stated above, there have been relevant researches for the simulation and forecast mode of the relation between a single building and the total power consumption and CO2 emissions of a block and such achievements should be further used in the future.
1.2. Research Method of the Carbon Dioxide of Traffic Systems
In the exiting transportation planning forecast mode, regarding the analysis and forecast mode of travel demands, the overall procedure planning of traditional transportation planning is usually adopted, which is classified into trip generation, trip distribution, model split and traffic assignment processes [10] and after calculation by sequence, the trip generation in an area is forecasted or calculated for traffic planning.
Additionally, regarding the assignment of static traffic volume, it is assumed that the traffic flow and traveling time within a road section do not change with the time [11], thus, the user equilibrium and system equilibrium [12] of traffic assignments, as proposed by Wardrop [13], are applied for further simulation in order to calculate the traffic assignment mode under a mixed traffic flow. Then, the design reference of the highway capacity is considered to calculate and distribute the expected design vehicle speeds to complete the overall traffic planning of urban transportation planning.
The proposal and execution of a traffic project can promote urban land use and will influence land price in the future [14]. Regarding the influence of urban form on travel demand [15], the potential variables and measured variables of three aspects, “urban form”, “travel demand” and “control factors” are used for inclusive empirical analysis on the influential relationship. The research results show that, in the urban form characteristics, while higher development density will increase the trip generation rate, it can reduce the opportunity of selecting private vehicles; meaning the higher equilibrium of mixed land use will reduce the trip generation rate but will increase the selection of private vehicles.
Analysis of the relation of local temperature to the land use, which residential areas, traffic areas and greenhouse agricultural areas all contributed to an increase in local temperatures [16].
In addition, in the research of the relation between measured CO2 concentration and land use [17], the land use type is classified into buildings and built-up areas with impervious pavement and the urban environments are free city spaces [18]. Then the road service level and highway capacity of the original design are used to calculate the traffic volume of various roads and “vehicle mileage emission factor method” is used to calculate the CO2 emissions. Therefore, the transportation system must estimate the passenger car units (PCU) per hour from different road service levels, or calculate the total CO2 emissions according to the statistical data of the usage rate of different vehicle types, or with the calculated parameters, such as different vehicles, mileage, fuels and emission coefficient.
Urban spatial and statistical data for metropolitan Tainan in southwestern Taiwan are used to explore inside and outside of the CO2 system of the city and estimate the amount of CO2 emissions from road traffic. Therefore, CO2 emissions are concentrated in over-urbanized areas, where the population density is higher than 5000 people/km2 [19].
Road engineering designs, such as different road slopes, road widths, speed limitations and pavement types will also influence vehicle speed, traffic flow and fuel consumption rate [20]. Regarding urban roads with two-way 4 lanes without central dividing strip, the result of analysis on the influence of road width on vehicle speed shows that, during the off-peak period, with every reduction of 0.3 m for the lane width, the average vehicle speed will be reduced by 0.97 km/h [21].
According to the research of Ardekani and Sumitsawan (2010) on roads in Texas, upon comparison of fuel consumption rate changes of vehicles traveling on flexible payment materials, the result shows that rigid pavement can reduce the required fuel amount by 3–17%. Regarding CO2 and fuel consumption tests aimed at special vehicles, the statistics show that slope has a present correlation trend with carbon dioxide, where the larger the slope, the greater the carbon dioxide [22].
As stated above, in the calculation of internationally emitted greenhouse gases, the “IPCC Guidelines for National Greenhouse Gas Inventories” rules are usually used and the estimation of CO2 emissions by the transportation department can be classified into large-range estimation by considering the fuel type, fuel consumption and carbon emissions of various fuels, where priority calculate is the total amount of fuel, then calculate the types of the fuel consumption rate, namely the Top-down approach; while small-range estimation calculations are based on the Bottom-up principle, according to the activity strength with a fuel consumption rate and this applies to the assessment of the small-range traffic management strategy [23].
Whether applying the Top-down principle or Bottom-up principle, the total CO2 emissions generated by traffic is calculated by multiplying the type of vehicles (such as passenger car, truck and bus) by the fuel type (diesel, gasoline, etc.) and then by the emission factor for the usage of unit fuel or the emission coefficient of unit mileage [17].
1.3. Existing Carbon Dioxide Issue
In this research, based on existing transportation planning and execution procedures and methods of urban planning, the following research topics are proposed upon review.
- Issue 1:
- Transportation analysis was mainly based on large-scale networks, lacking the information from the urban blocks
Regarding the calculation method of existing transportation planning, the regional total traffic volume can be estimated only by large investigations of the urban road networks and numerical data of road facilities. Moreover, the investigation and statistical method of the existing urban transportation traffic volume is to conduct model splits and traffic assignments on the vehicle flows in various regions, in order to form large-scale transportation results in urban areas.
However, follow-up urban planning or regular overall inspections adopt zoning and cooperate with traffic road system planning to form various basic divided urban block units. Therefore, measured investigation on road vehicle flow is salutatory and there is a lack of research on the mutual influence between the usage characteristics of urban block units, building scales, road system, etc.
- Issue 2:
- There is no effective permitted data for the buildings to integrate the overall forecast of urban energy consumption
During an application for a building permit, if it is required to assess the environmental impact or consider urban design, the traffic volume in that region must be evaluated and measured. However, in the current document application, under the condition of no integrated application, it is impossible to immediately and properly use the relevant legally considered data above, which reduces the added value after consideration, or requires further application by the government or folk practitioners.
Therefore, in the application of environmental impact assessment or urban design review, in addition to the stated measured traffic volume data for the region, it is possible to integrate and analyze traffic data and building permits, in order to evaluate the application in the overall urban development.
- Issue 3:
- The design of transportation planning lacks mapping of urban traffic environment characteristics
In transportation system planning, set the model split according to the data collection and measured investigation, forecast trip generation and trip distribution in the future and then evaluate the optimal feasible plan. In the follow-up design of a road system, the road geometry, road slope, running speed, etc., are used for planning and alignment.
The transportation system above is planned according to the completion of the road geometrical design and only the numerical design and calculation are taken as the main achievements, which lack a map evaluation mode of integrating the urban form and transportation trunk into complete readability [24] and urban traffic hot spots.
1.4. Research Purpose and Improvement Countermeasures
In this research, the small-scale application mode is used to analyze the urban energy consumption of urban areas, thus, with a single urban block as the basic unit to estimate traffic volume, the research purpose and countermeasures are proposed as follows:
To completely analyze the overall energy consumption of entire urban areas and taking the urban block as the basic analysis unit, in combination with the vehicle flow generated at the junction of the road system, as the basic application unit, develop and analyze the overall energy consumption correlation of the urban areas and establish the forecast model.
To effectively integrate the legal application deliberation of the documentation of a building permit and be beneficial to the follow-up modification of urban planning, this research applies and analyzes the report of the urban design review in order to research the influential factors of block development and building design, conduct in-depth analysis of the mutual relation with the traffic carbon dioxide and evaluate the total CO2 emissions generated by urban development in the future.
This study used the basic urban block units formed by an urban road system, where relevant road systems and road engineering are simplified into road design factors and upon this research, the simple forecast model of urban roads and urban planning configurations are analyzed and the basic information of the traffic volume is presented to obtain a readable traffic volume map of urban areas. In addition, the research results will be conveniently and rapidly used in the follow-up revisions of urban planning, or the periodical overall review of urban planning.
2. Research Method
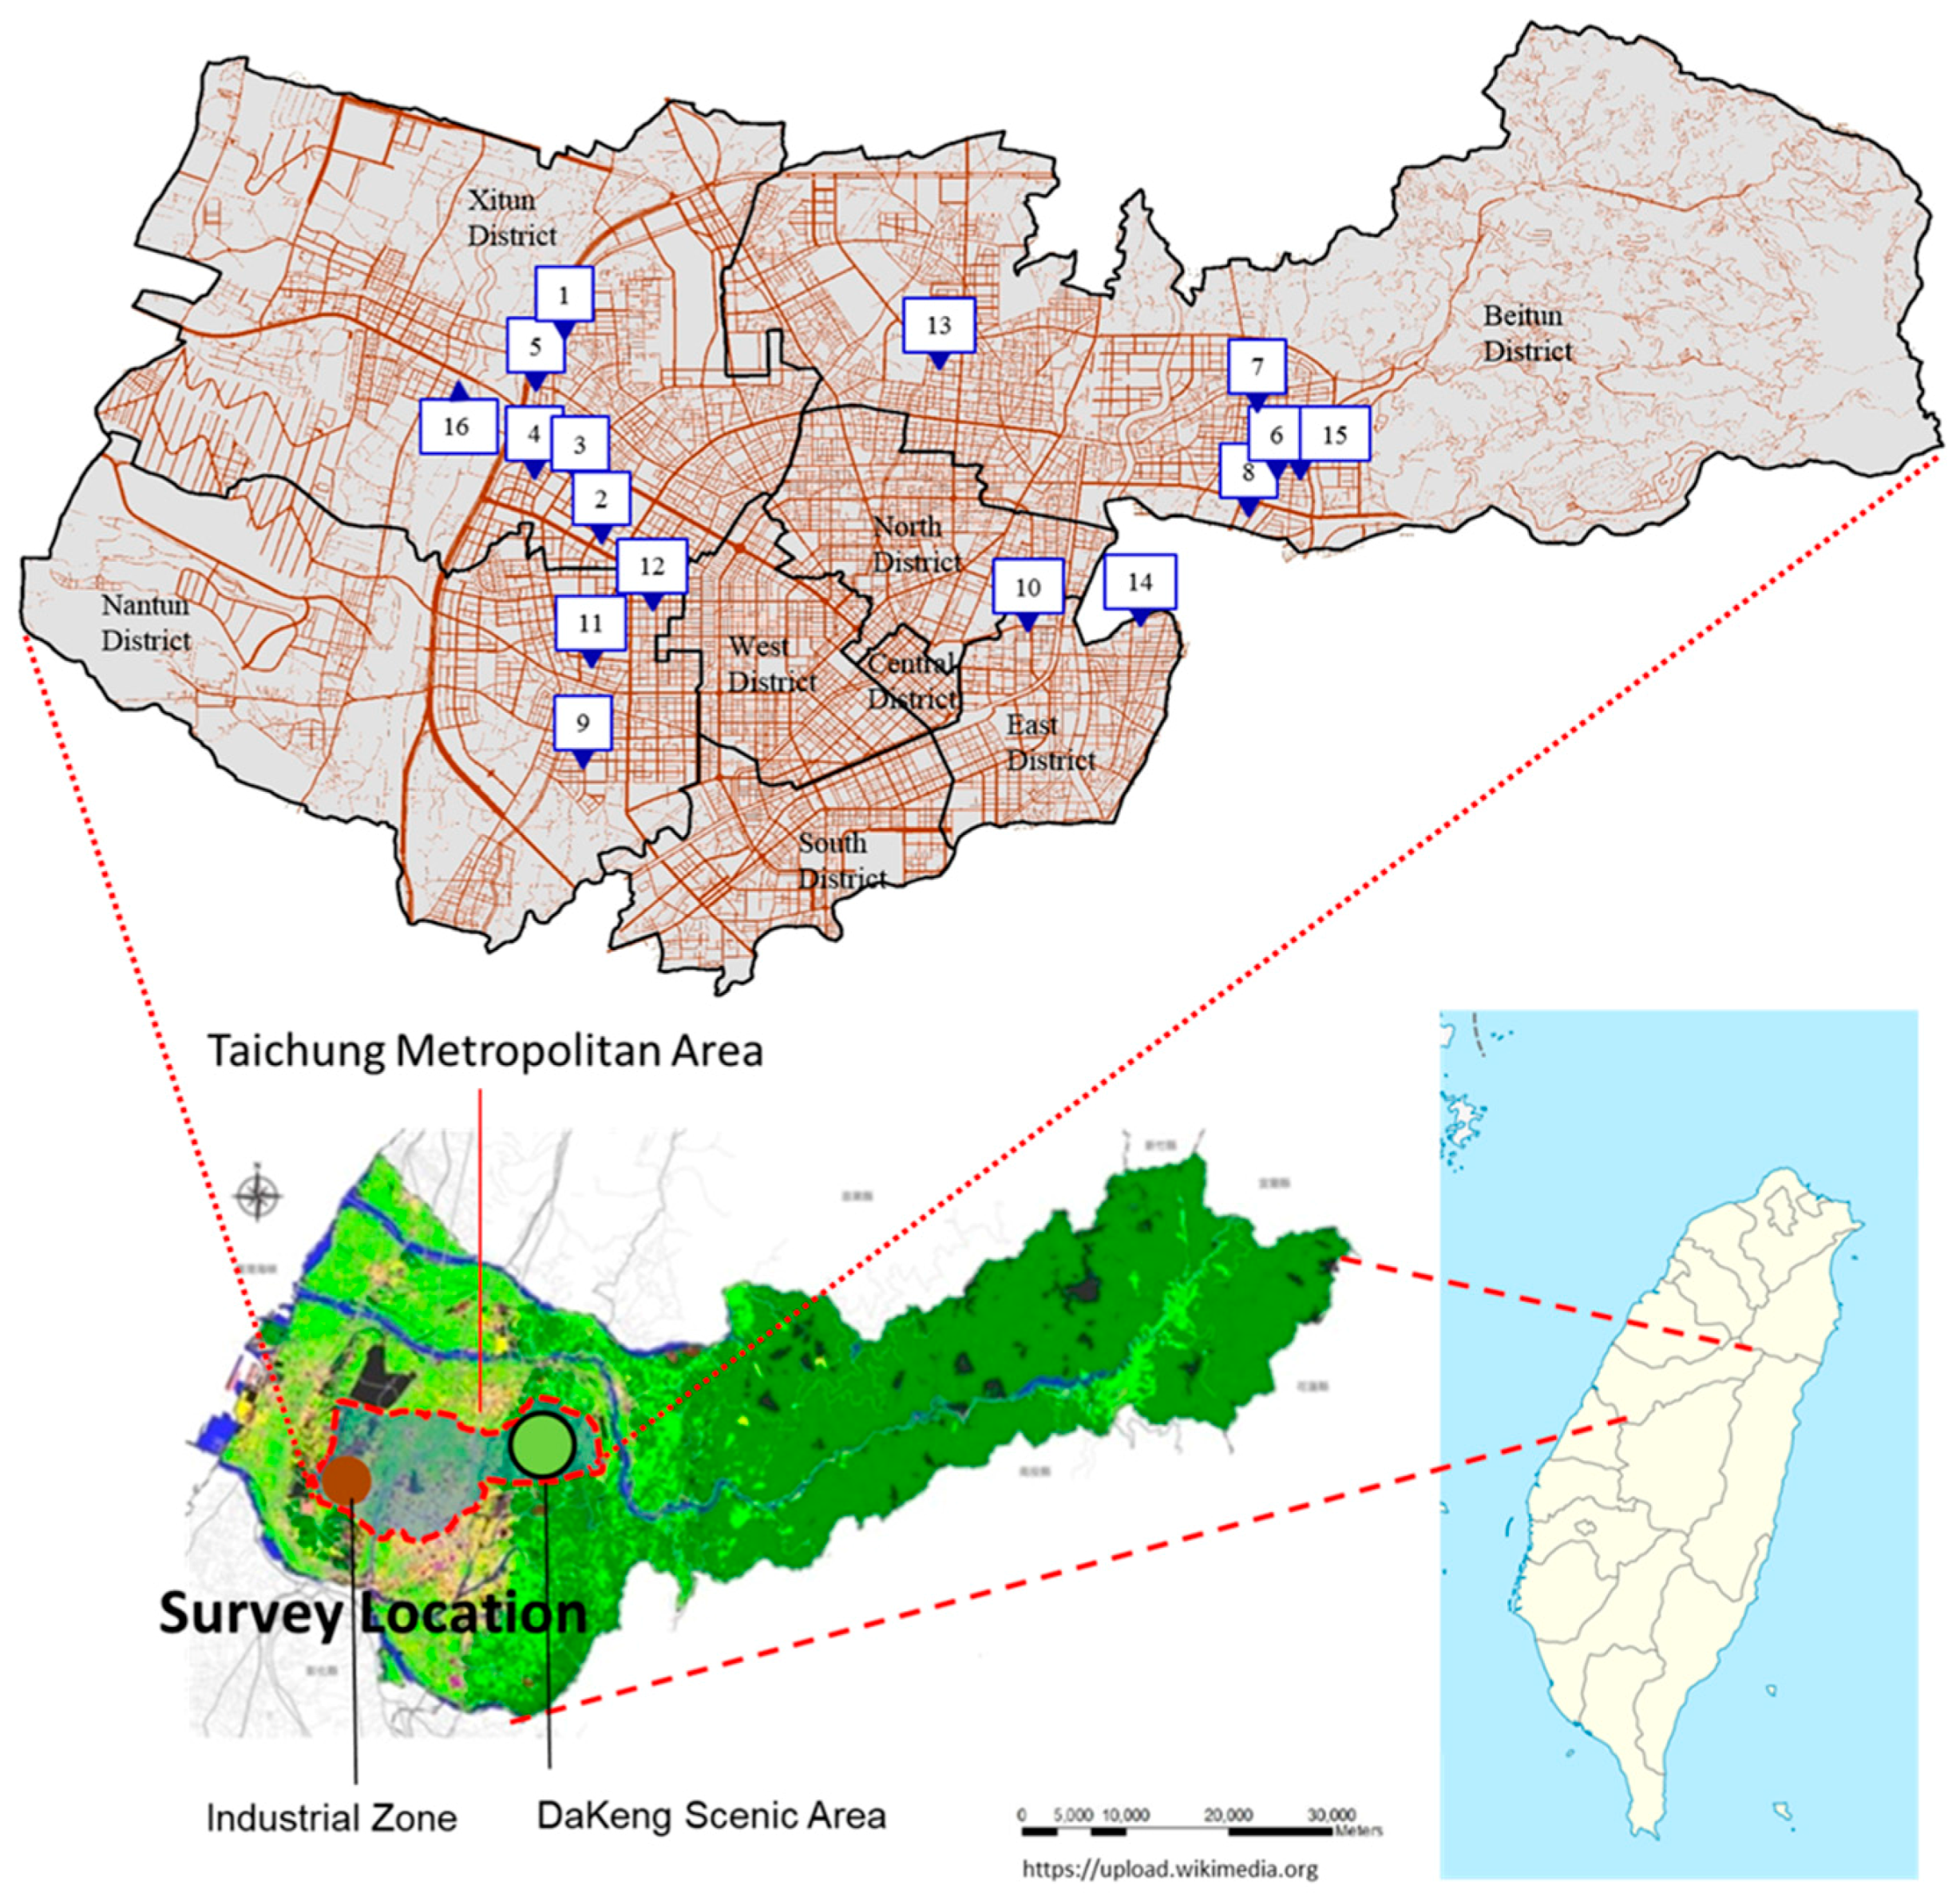
The research area is located in Taichung, which is in the middle of Taiwan, with a land area of 2214.9 km2 and a total of 29 administrative regions. The research scope is mainly the 8 administrative regions in the Taichung metropolitan area, with a land area of 163.4 km2, population of 1,121,128 (March 2015) and population density of 6612 persons per square kilometer.
The Taichung metropolitan area is a metropolitan form of commercial service and commercial mixing, the west is an industrial zone and the east is the Dakeng Scenic area (Figure 1).
Due to the forecast mode of traffic volume, the investigation range of the traditional transportation planning method must often contain the regional characteristics formed by dozens of urban blocks and then, the measured traffic volume is used, thus, it belongs to large-range investigation and research. Regarding the mutual relation between land use control and building scale in urban areas, it is difficult to conduct in-depth research and analysis.
This research is aimed at the number of vehicles at four junctions in the urban blocks of Taichung’s metropolitan area, as well as the applied development cases of various buildings in the urban blocks, in order to further calculate the total CO2 emissions generated by the traffic volume and investigate and analyze the building development scale factors.
2.1. Estimation Model of Total Traffic Volume in the Urban Blocks
Regarding the main urban road crossings in this research, the number of vehicles within 24 h is measured and investigated. During an application for a building permit, the environmental impact evaluation case should be dominated by law. Due to the assessment contents of environmental impact, for the measuring of traffic volume generated by motorcycles, passenger cars and buses, it is required to calculate the passenger car unit (PCU) at the road crossings, as specified in the Taiwan Highway Capacity Manual [25], in order to obtain the traffic volume of the entire day as the basis of environmental impact assessment and design considerations.
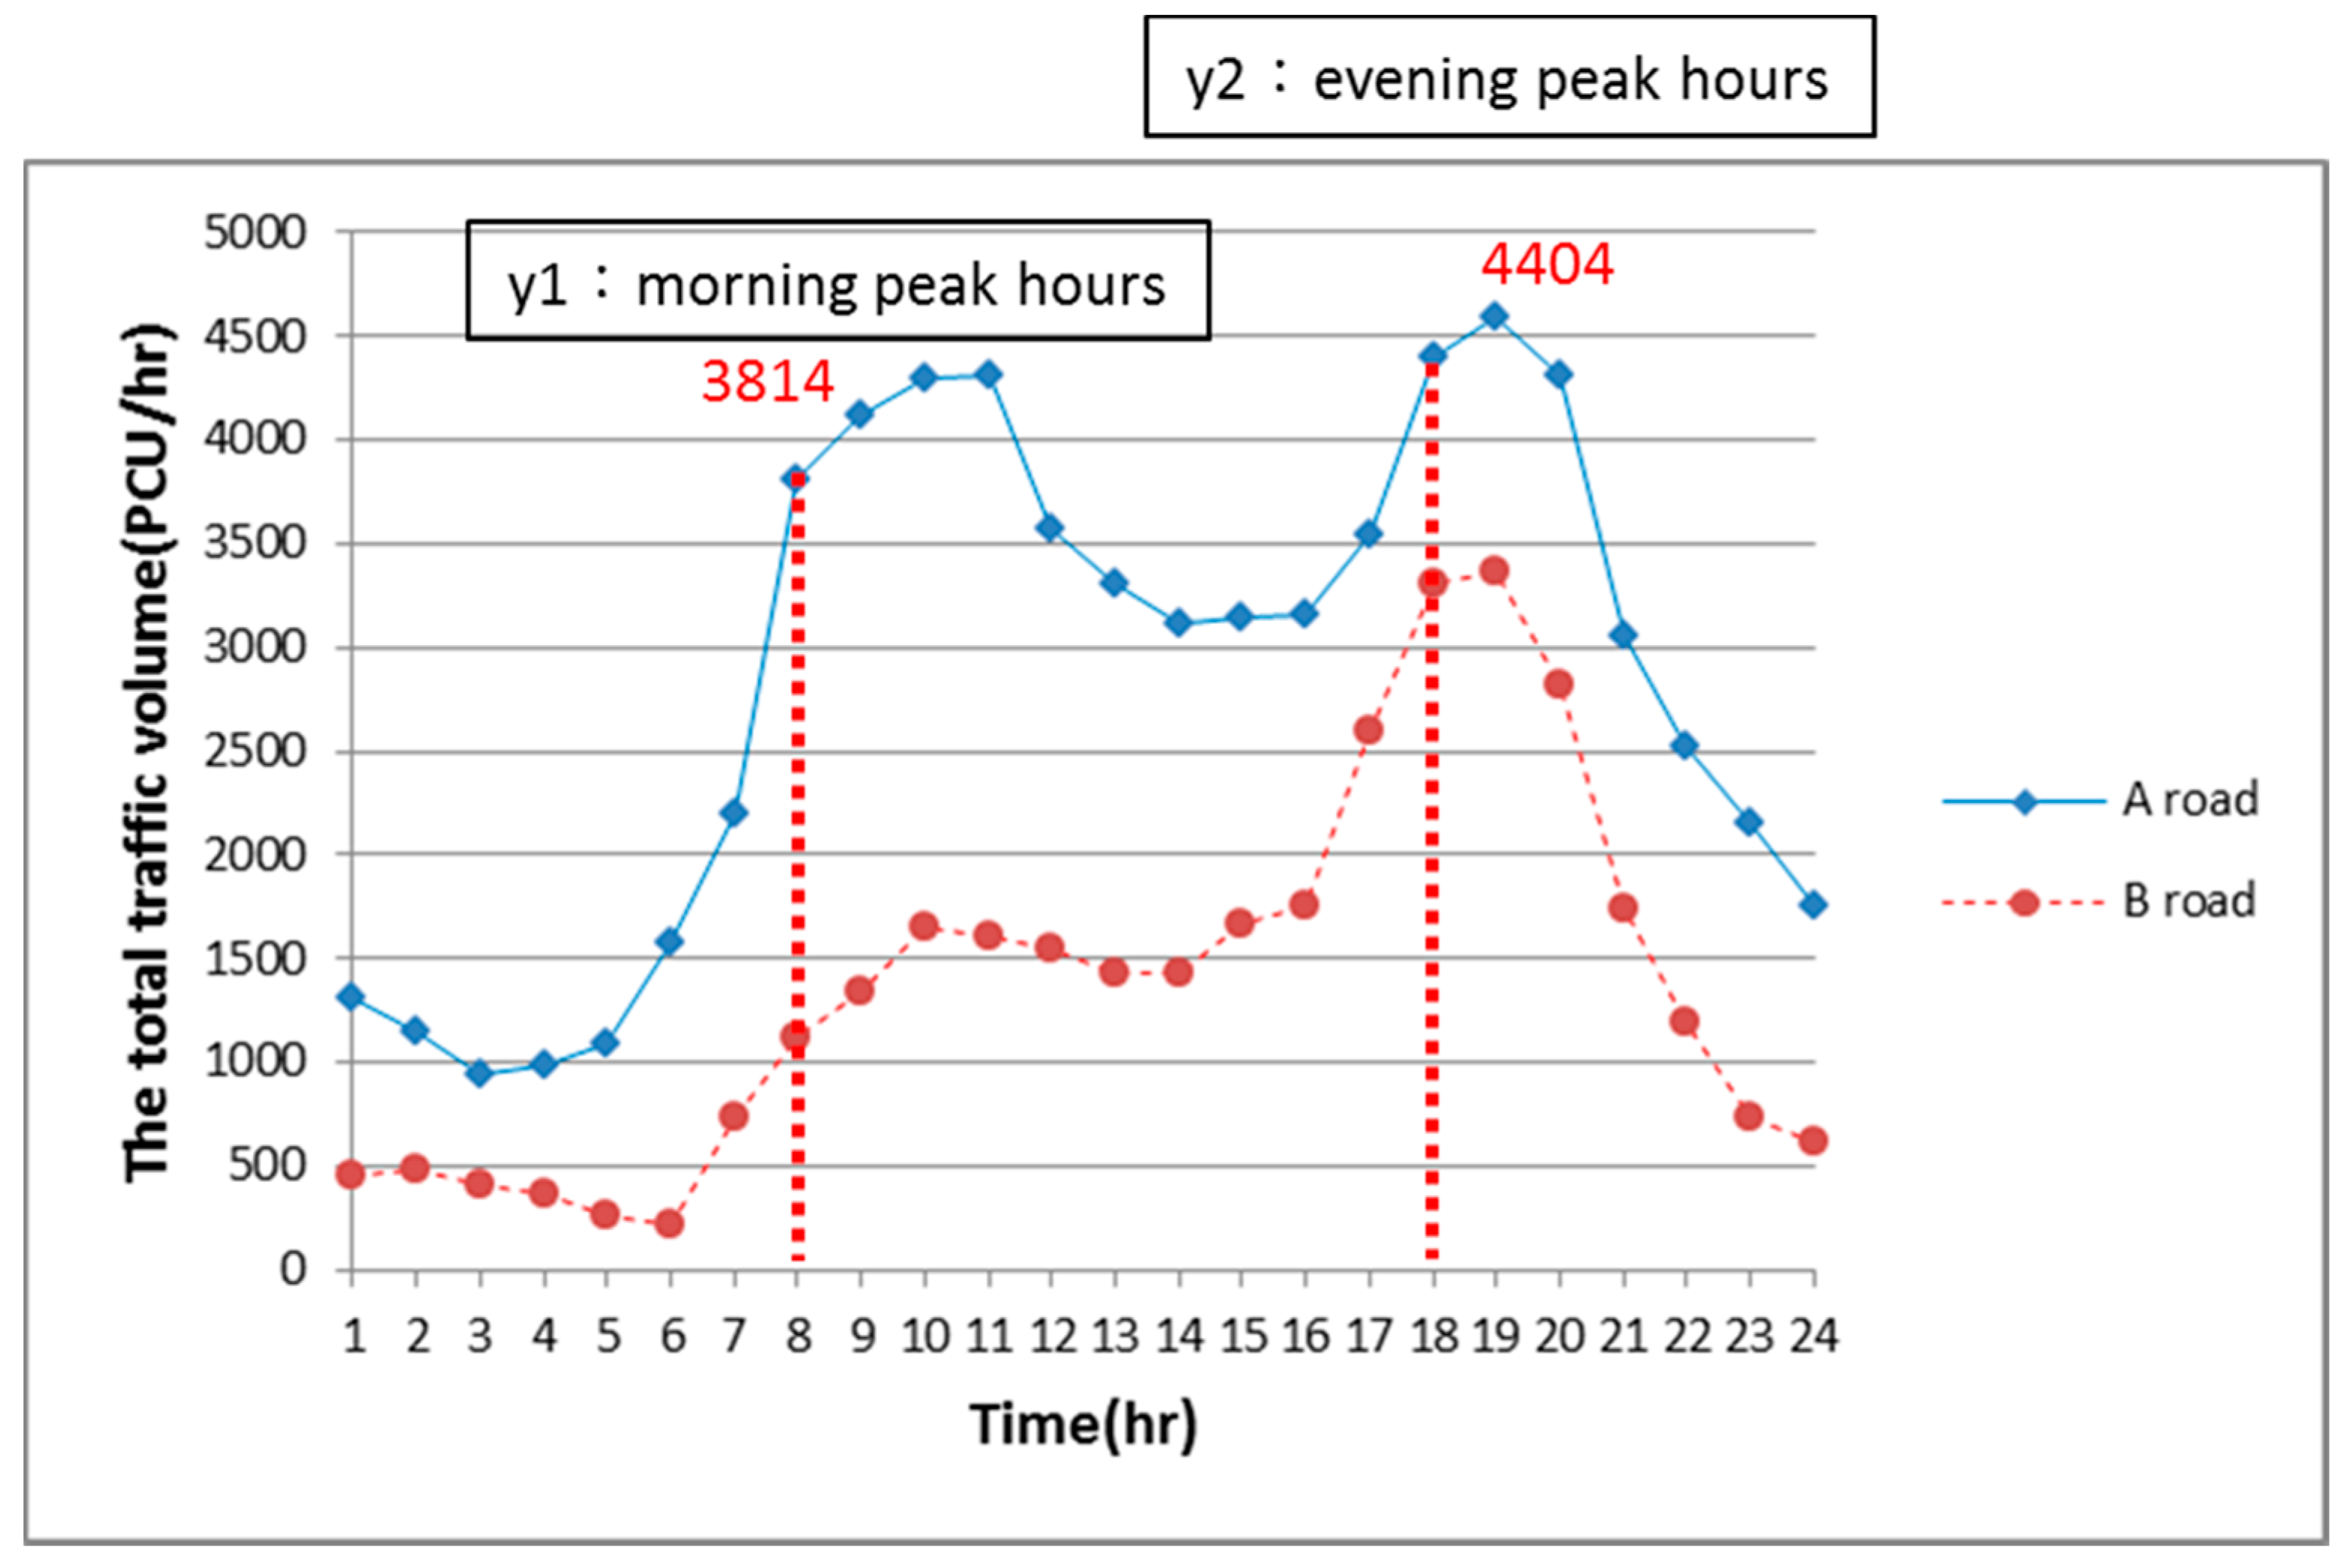
First, this research analyzed the total number of vehicles of five main road crossings and then analyzed the forecasted regression formula of dependent variables during the morning peak and evening peak hours with the measured vehicle flow data of 07:30–08:30 in the morning and 17:30–18:30 in the evening.
In this research, the traffic investigation data of morning peak and evening peak hours in the urban design review cases are substituted into the forecasted regression formula of total number of vehicles in the five main road crossings, in order to respectively calculate the passenger car units in each junction of the block within one day.
Regarding the four road crossings in an urban block, the measured data of traffic volume are taken as the case and on the basis of practical cases, there is an extreme lack of hard-won cases, which are difficult to obtain. Therefore, in this research, hundreds of cases of urban design reviews over the years (2011–2013) are screened to determine the application of the site area of the blocks and those with road crossing investigation data are the preferred cases. Then, those with traffic volume in three crossings are taken as the minor cases.
Next, passenger car unit (PCU) at the road intersection in the city block was estimated and the Geographic Information System for metropolitan Taichung was used to calculate the length of each side road in the block as the travel distance of automobiles. The amount of fuel used by an automobile to travel an entire road was estimated on the basis of the travel distance per liter of fuel of the automobile in the city (9200 m), which was calculated using the research data published by the Industrial Technology Research Institute [26]. The carbon emission coefficient of gasoline was accordingly estimated to be 2.26 kgCO2/L [27]. The carbon emission coefficient of gasoline was multiplied by the total PCU and the travel distance of the automobile was subsequently estimated. In this way, the total CO2 emissions from traffic were estimated using Equation (1).
where, PCEi is the CO2 emissions generated by each passenger car unit (kgCO2/PCU); Ni is the passenger car units (PCU) for each of the road, FE is the fuel consumption rate (0.000109 L/m), EC is the CO2 emissions coefficient (2.26 kgCO2/L), Di is the length of the vehicle driving in the block (m). There are 64 data of the total traffic volume in each section, as well as the total CO2 emissions generated by the vehicles.
2.2. Statistical Model of Building Development Factors
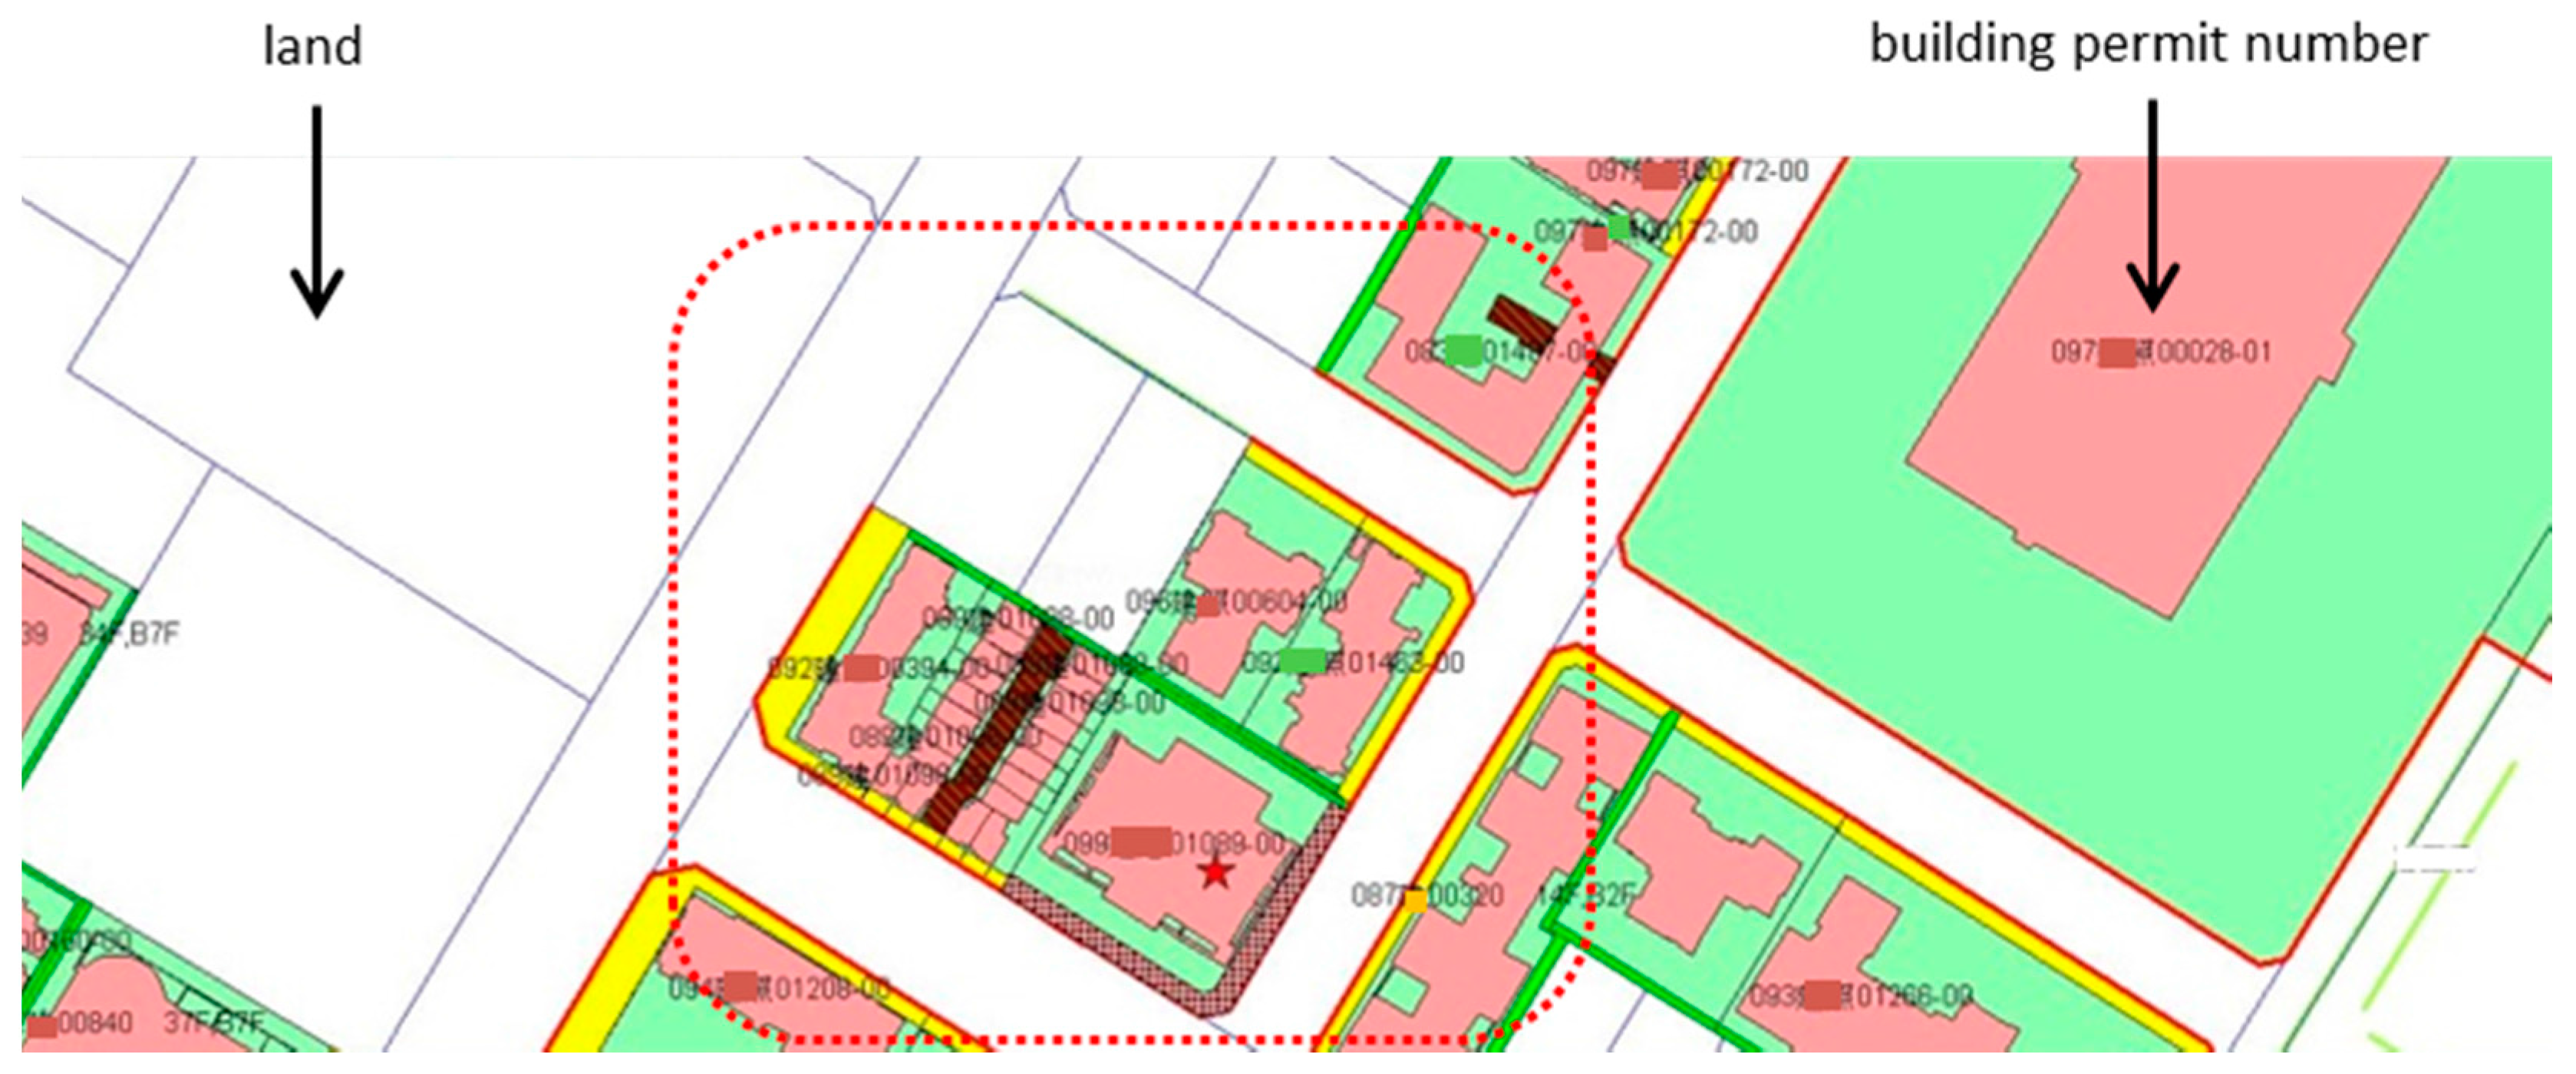
The building design case should be subject to the urban land use zoning and provisions of the Building Act to be convenient for the building design. Therefore, in this research, legal buildings are used as the main research targets. Upon reference to the “building cadastral mapping” system of the competent government building authority (Figure 2), after inquiry of construction permits in all buildings, the building permit data are referred and the design value is logged in.
Due to insufficient official government budget and in order to accelerate obtaining the public facility reserved land of urban areas, provisions on encouraging floor area for those who have obtained public facilities have been established, that is to say, after private practitioners obtain public facilities and give them to the government free of charge, the equivalent building floor area is obtained through private transformation and moved to the future development site area, in order to increase the actual floor area ratio of buildings in the future.
In addition, in order to award the private practitioners, the government increases the parking space to solve the urgent parking demand in urban areas; those private practitioners who have increased the parking space obtain the award of increased floor area. In addition, due to the insufficiency of green parkland space in urban areas, for example, a site area is reserved with a square up to a certain scale by law, which is connected for pedestrians and is opened to the public for passing or recreation; private practitioners also can obtain the award of increasing the floor area of the open space.
Therefore, in order to reduce building development costs and consider increasing the value of building development products, private practitioners usually need to increase the building development scale and will often apply for the legal provisions applicable to the above three measures for awarding floor area. Thus, in addition to incorporating the general building plan of influential factors in this research, floor award area factors are also considered, in order that the research forecast result is pragmatic and broader in application.
As stated above, in this research, regarding the major analysis method of traffic volume and block-related factors, in addition to the site area, building coverage ratio, floor area ratio, etc. (Table 1), as stated in the building permit, the thirty-four factors of various buildings, green coverage areas, green coverage rate, etc. of the entire block are summarized. Therefore, the land use zoning in this research case is dominated by the residential area, for a total of 16 blocks, the building purpose is dominated by residential use; however, in some buildings, the first floor is used as shops, for a total of 95 buildings.
This research constructed a map of the total carbon budget of traffic, buildings and parks in metropolitan Taichung, central Taiwan [19]. Carbon emissions from buildings in the city were estimated according to electricity usage [28,29], e-Question results, a common building type in Taiwan (i.e., residential and commercial mixed-use building) and the energy consumption of low-story and high-story apartments, office buildings, hospitals, educational institutions and other building types. Therefore, the total CO2 emissions from buildings in Taichung were measured according to 15 different building uses, EUI, land types as specified during urban planning and presented in grids of 100 × 100 m and the total floor area, with the estimation results shown in Table 2.
The forms of energy used in a building vary according to how the energy is used. For example, some residential buildings use fuel gas for cooking and heating bath water, whereas others use electricity in kitchens, industrial buildings have diverse use of energy, while other types of buildings use mainly electricity. Therefore, CO2 emissions from buildings in grids were estimated as follows:
where (kWh/yr·grid) is the usage of electricity; (kWh/yr·grid) is the usage of fuel gas (which is estimated to consume 0.23 times more domestic energy than does electricity, according to the CO2 emissions data for residential buildings provided in [6]) and CCO2 is the amount of CO2 emissions per kWh of electricity generated in Taiwan in 2014. On the basis of the amount of CO2 emissions per kWh of electricity generated in the year, the EEF was estimated to be 0.521 kgCO2/kWh.
The CO2 absorption of different land types (i.e., parks, soils and water bodies, as determined during urban planning) in metropolitan Taichung was analyzed and the carbon sink in each grid was estimated using the following equation:
where (−kgCO2/yr·grid) is the total amount of CO2 absorbed in each grid, (−kgCO2/m2) is the CO2 absorption coefficient of each land type and Ai (m2) is the area of each land type.
Upon counting the design values of various buildings in the urban block, as well as the total number of traffic volume in each road section, as well as the respective calculations of the total CO2 emissions generated by fuels, multiple regression analysis is applied on the relations of various relevant factors of overall urban energy consumption, in order to obtain the research results of the influence of changes in various dependent variables on the corresponding variables.
3. Results
3.1. Result of the Relation between Urban Blocks and Traffic CO2 Emissions
In this research, regarding the forecast analysis model of the total traffic volume in each road crossing in the urban block, after counting the total number of vehicles within 24 h in the road crossing, linear regression analysis is conducted according to the morning peak and evening peak data (Figure 3).
In this research, the forecast of total traffic volume in the road crossings is obtained as shown in Equation (5) as follows:
y = 2261.52 + 2.36y1 + 10.18y2 R2 = 0.99
This formula is the passenger car unit (PCU/day) generated at the road crossings in an entire day, where is the morning peak hours (PCU/h) and is the evening peak hours (PCU/h).
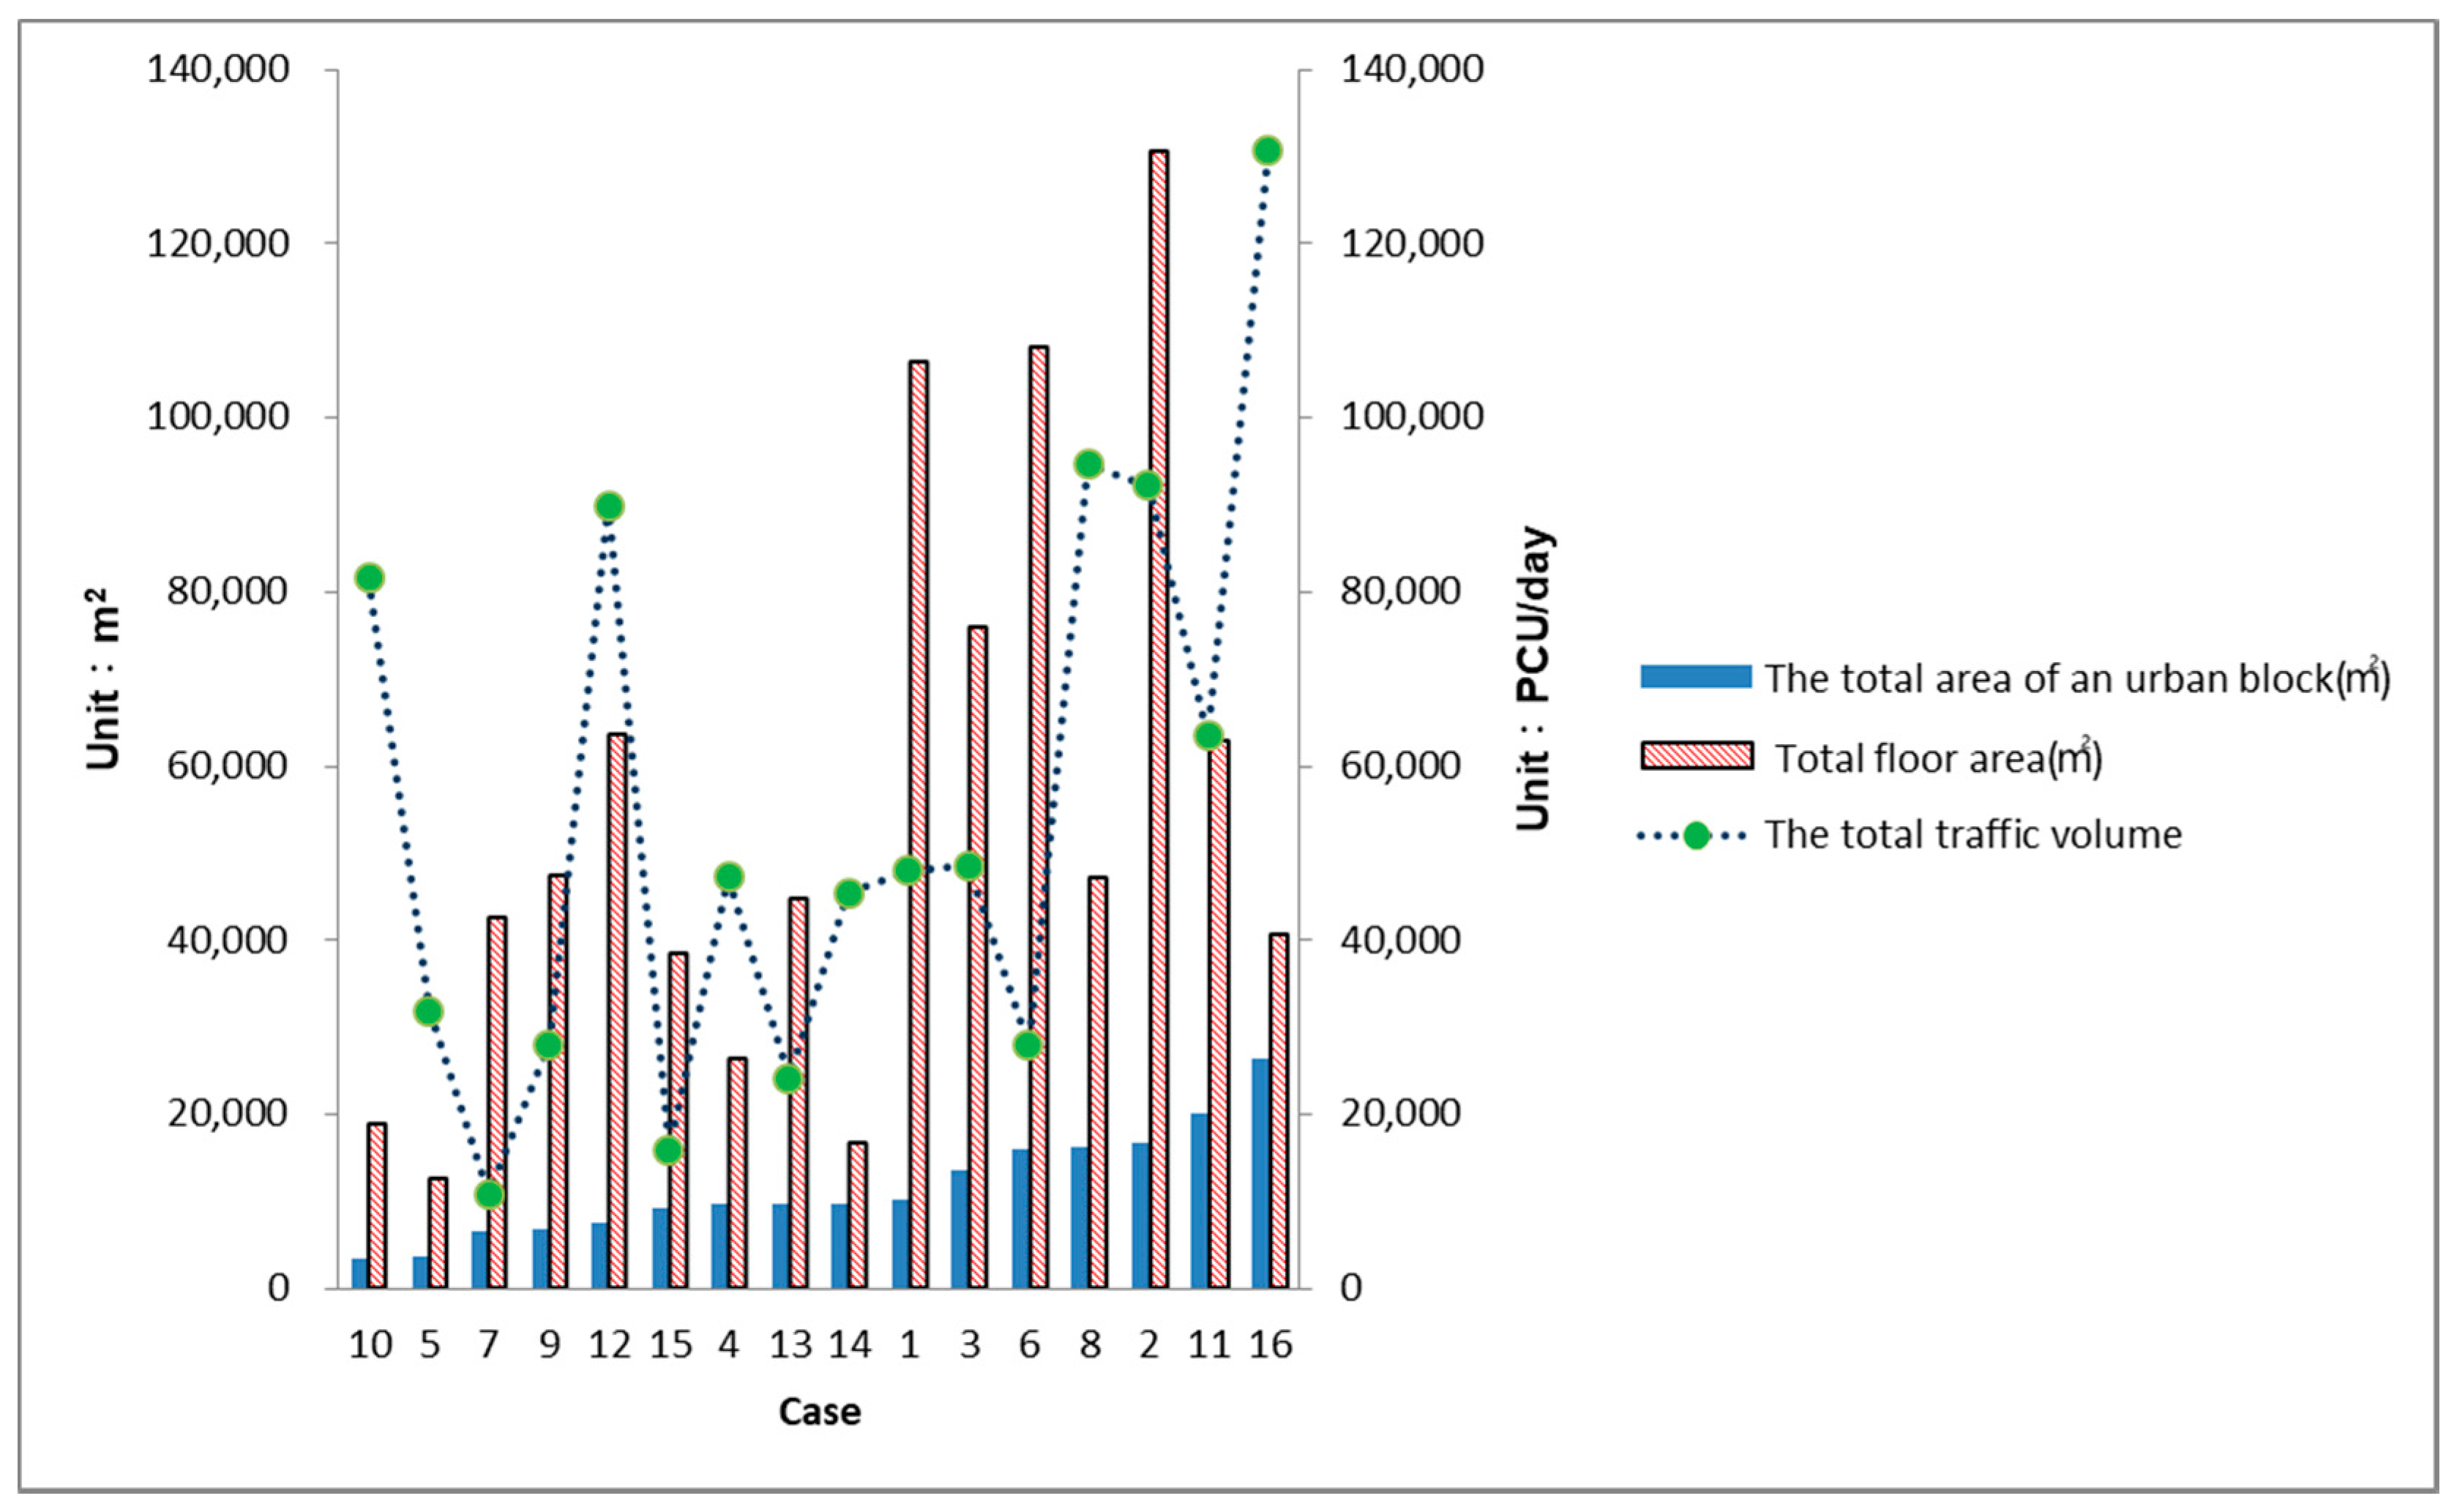
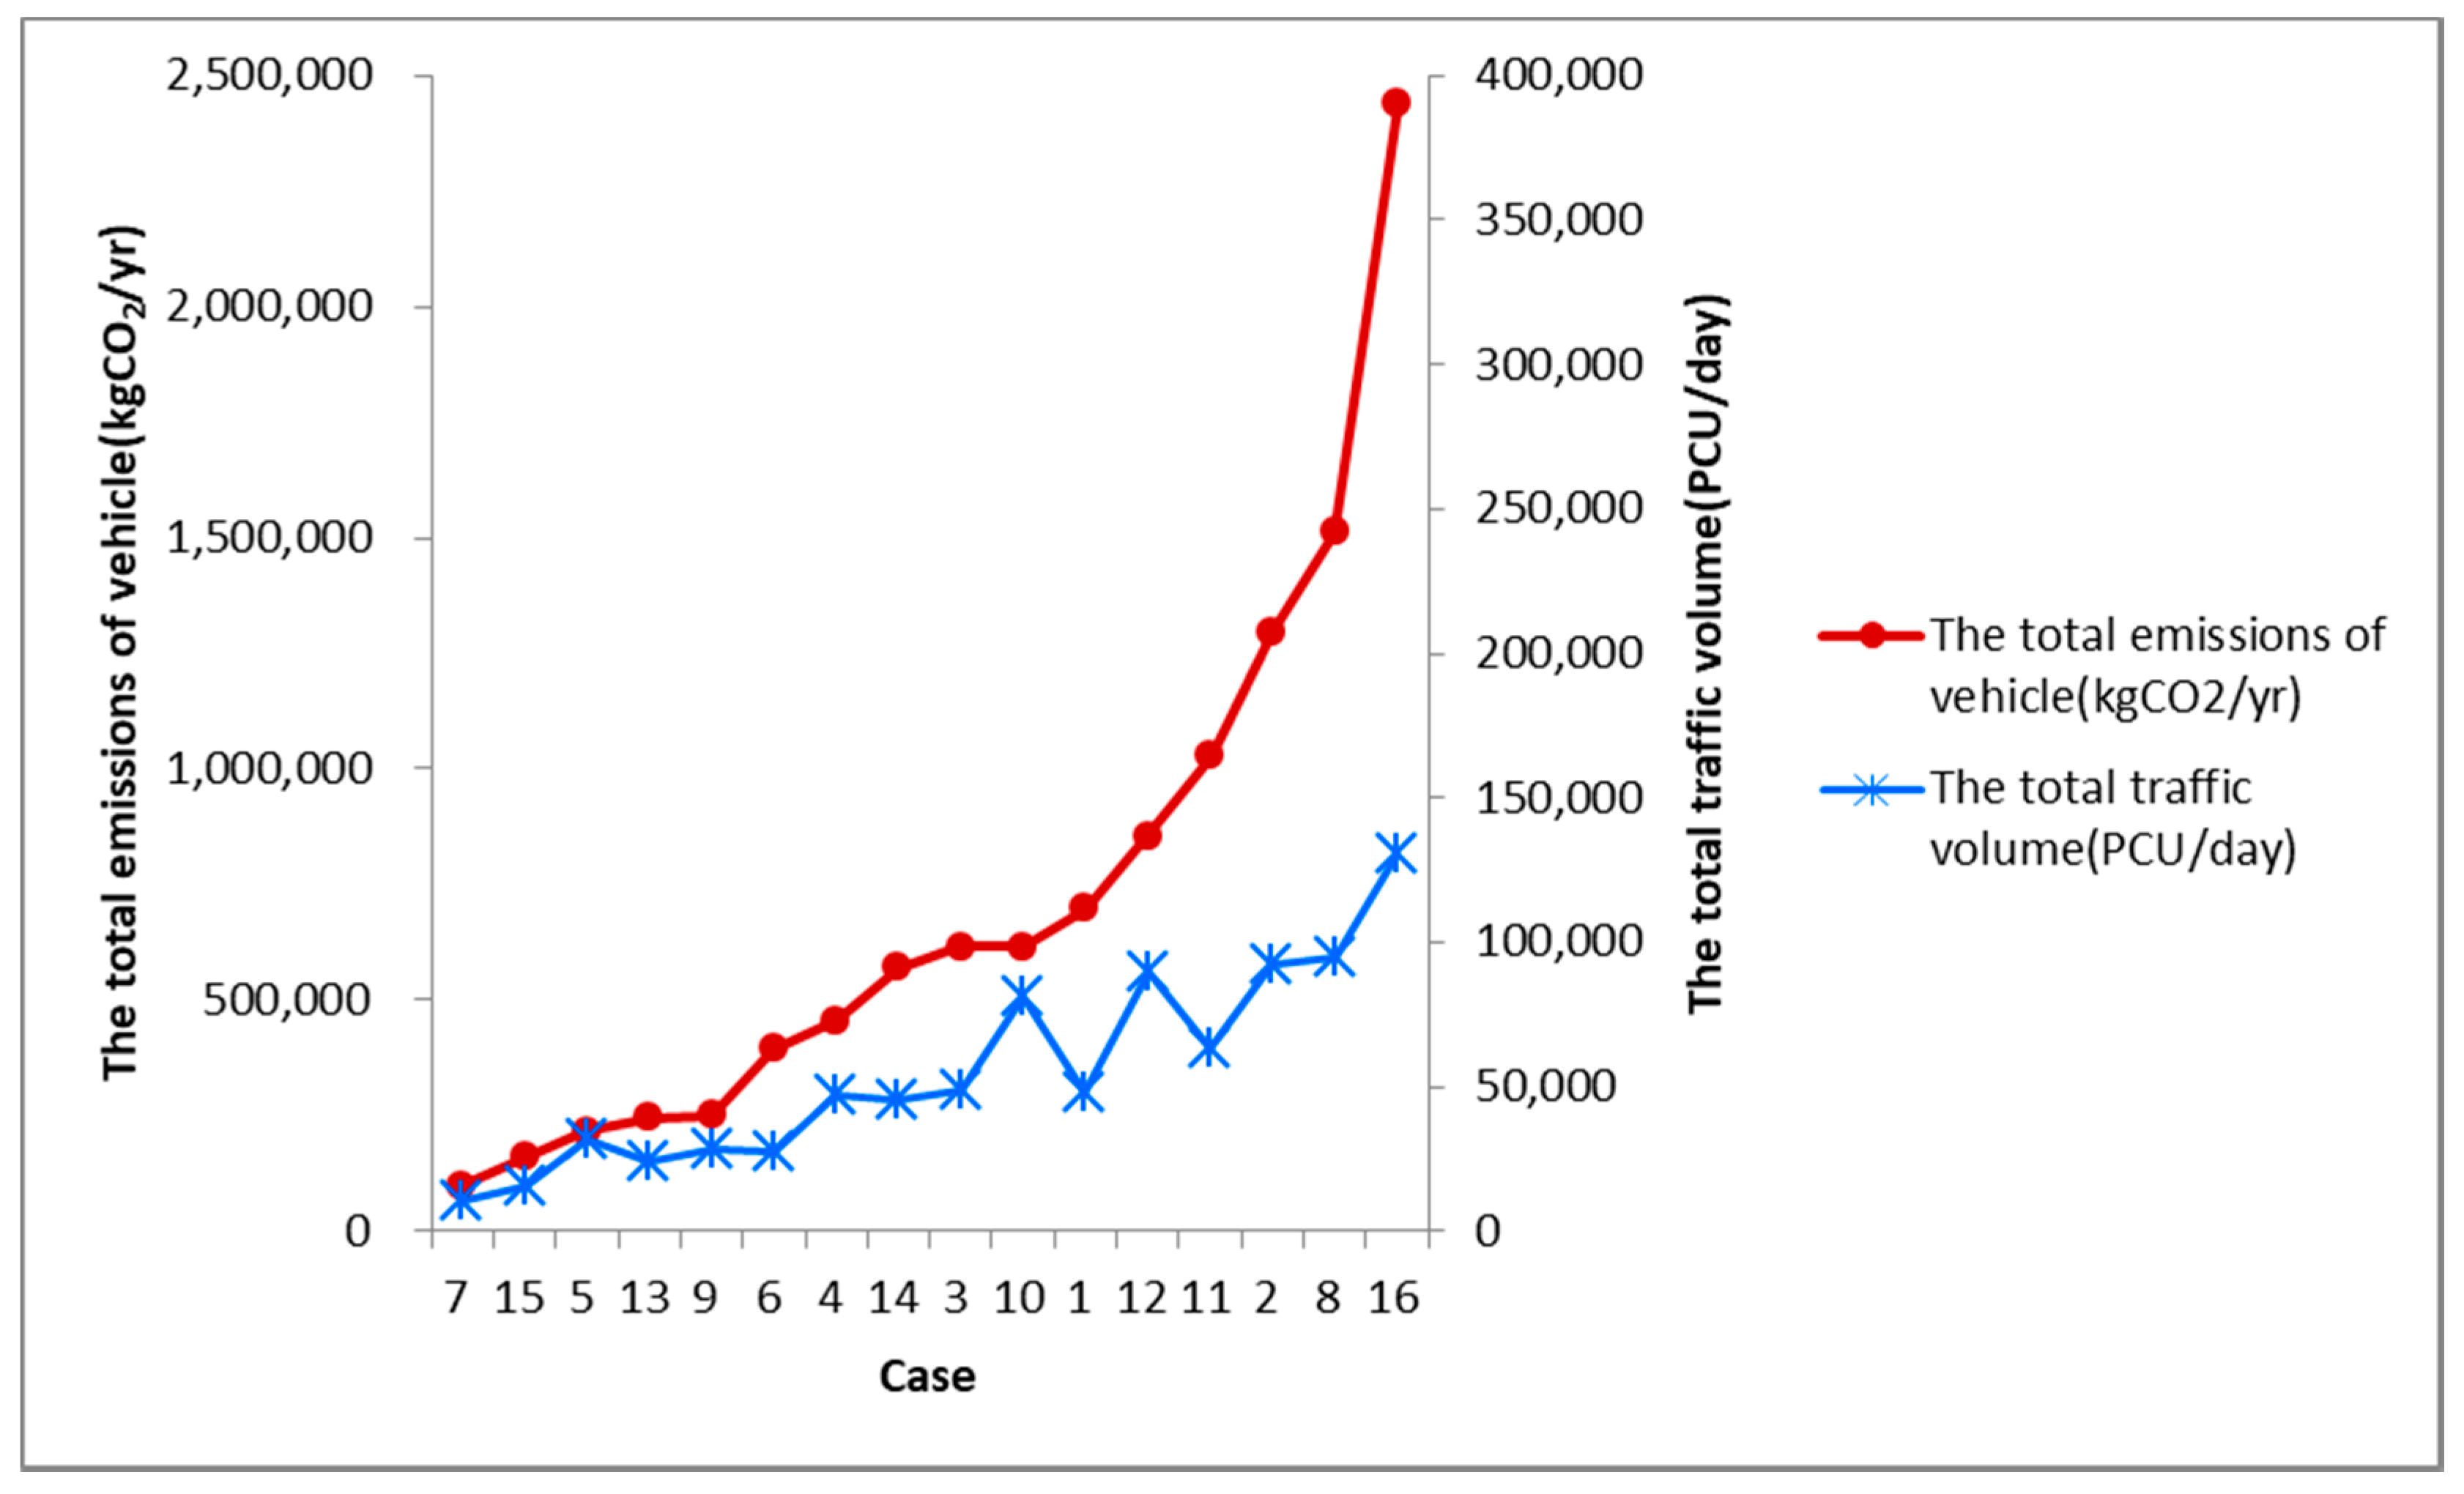
In this research, the total area of an urban block, the total floor area of buildings, the total traffic volume generated at the four road crossings of the block and the total CO2 emissions generated by the total number of vehicles (Table 3), are analyzed and counted (Figure 4) and the research results on the distribution of the total CO2 emissions generated by total number of vehicles in each block is as follows (Figure 5):
Regarding the influential relation between the development scale of various buildings and the car traffic volume, through the analysis result in this research, each square meter area in the urban block generates a passenger car unit (PUC/day) of 4.72 every day. Each square meter of floor area of the building generates a passenger car unit (PCU/day) of 0.99 every day. Each passenger car unit (PCU) generates total CO2 emissions of 41.4 kgCO2/yr throughout the year.
3.2. Results of Relation between an Urban Building Complex and Overall Traffic Energy Consumption
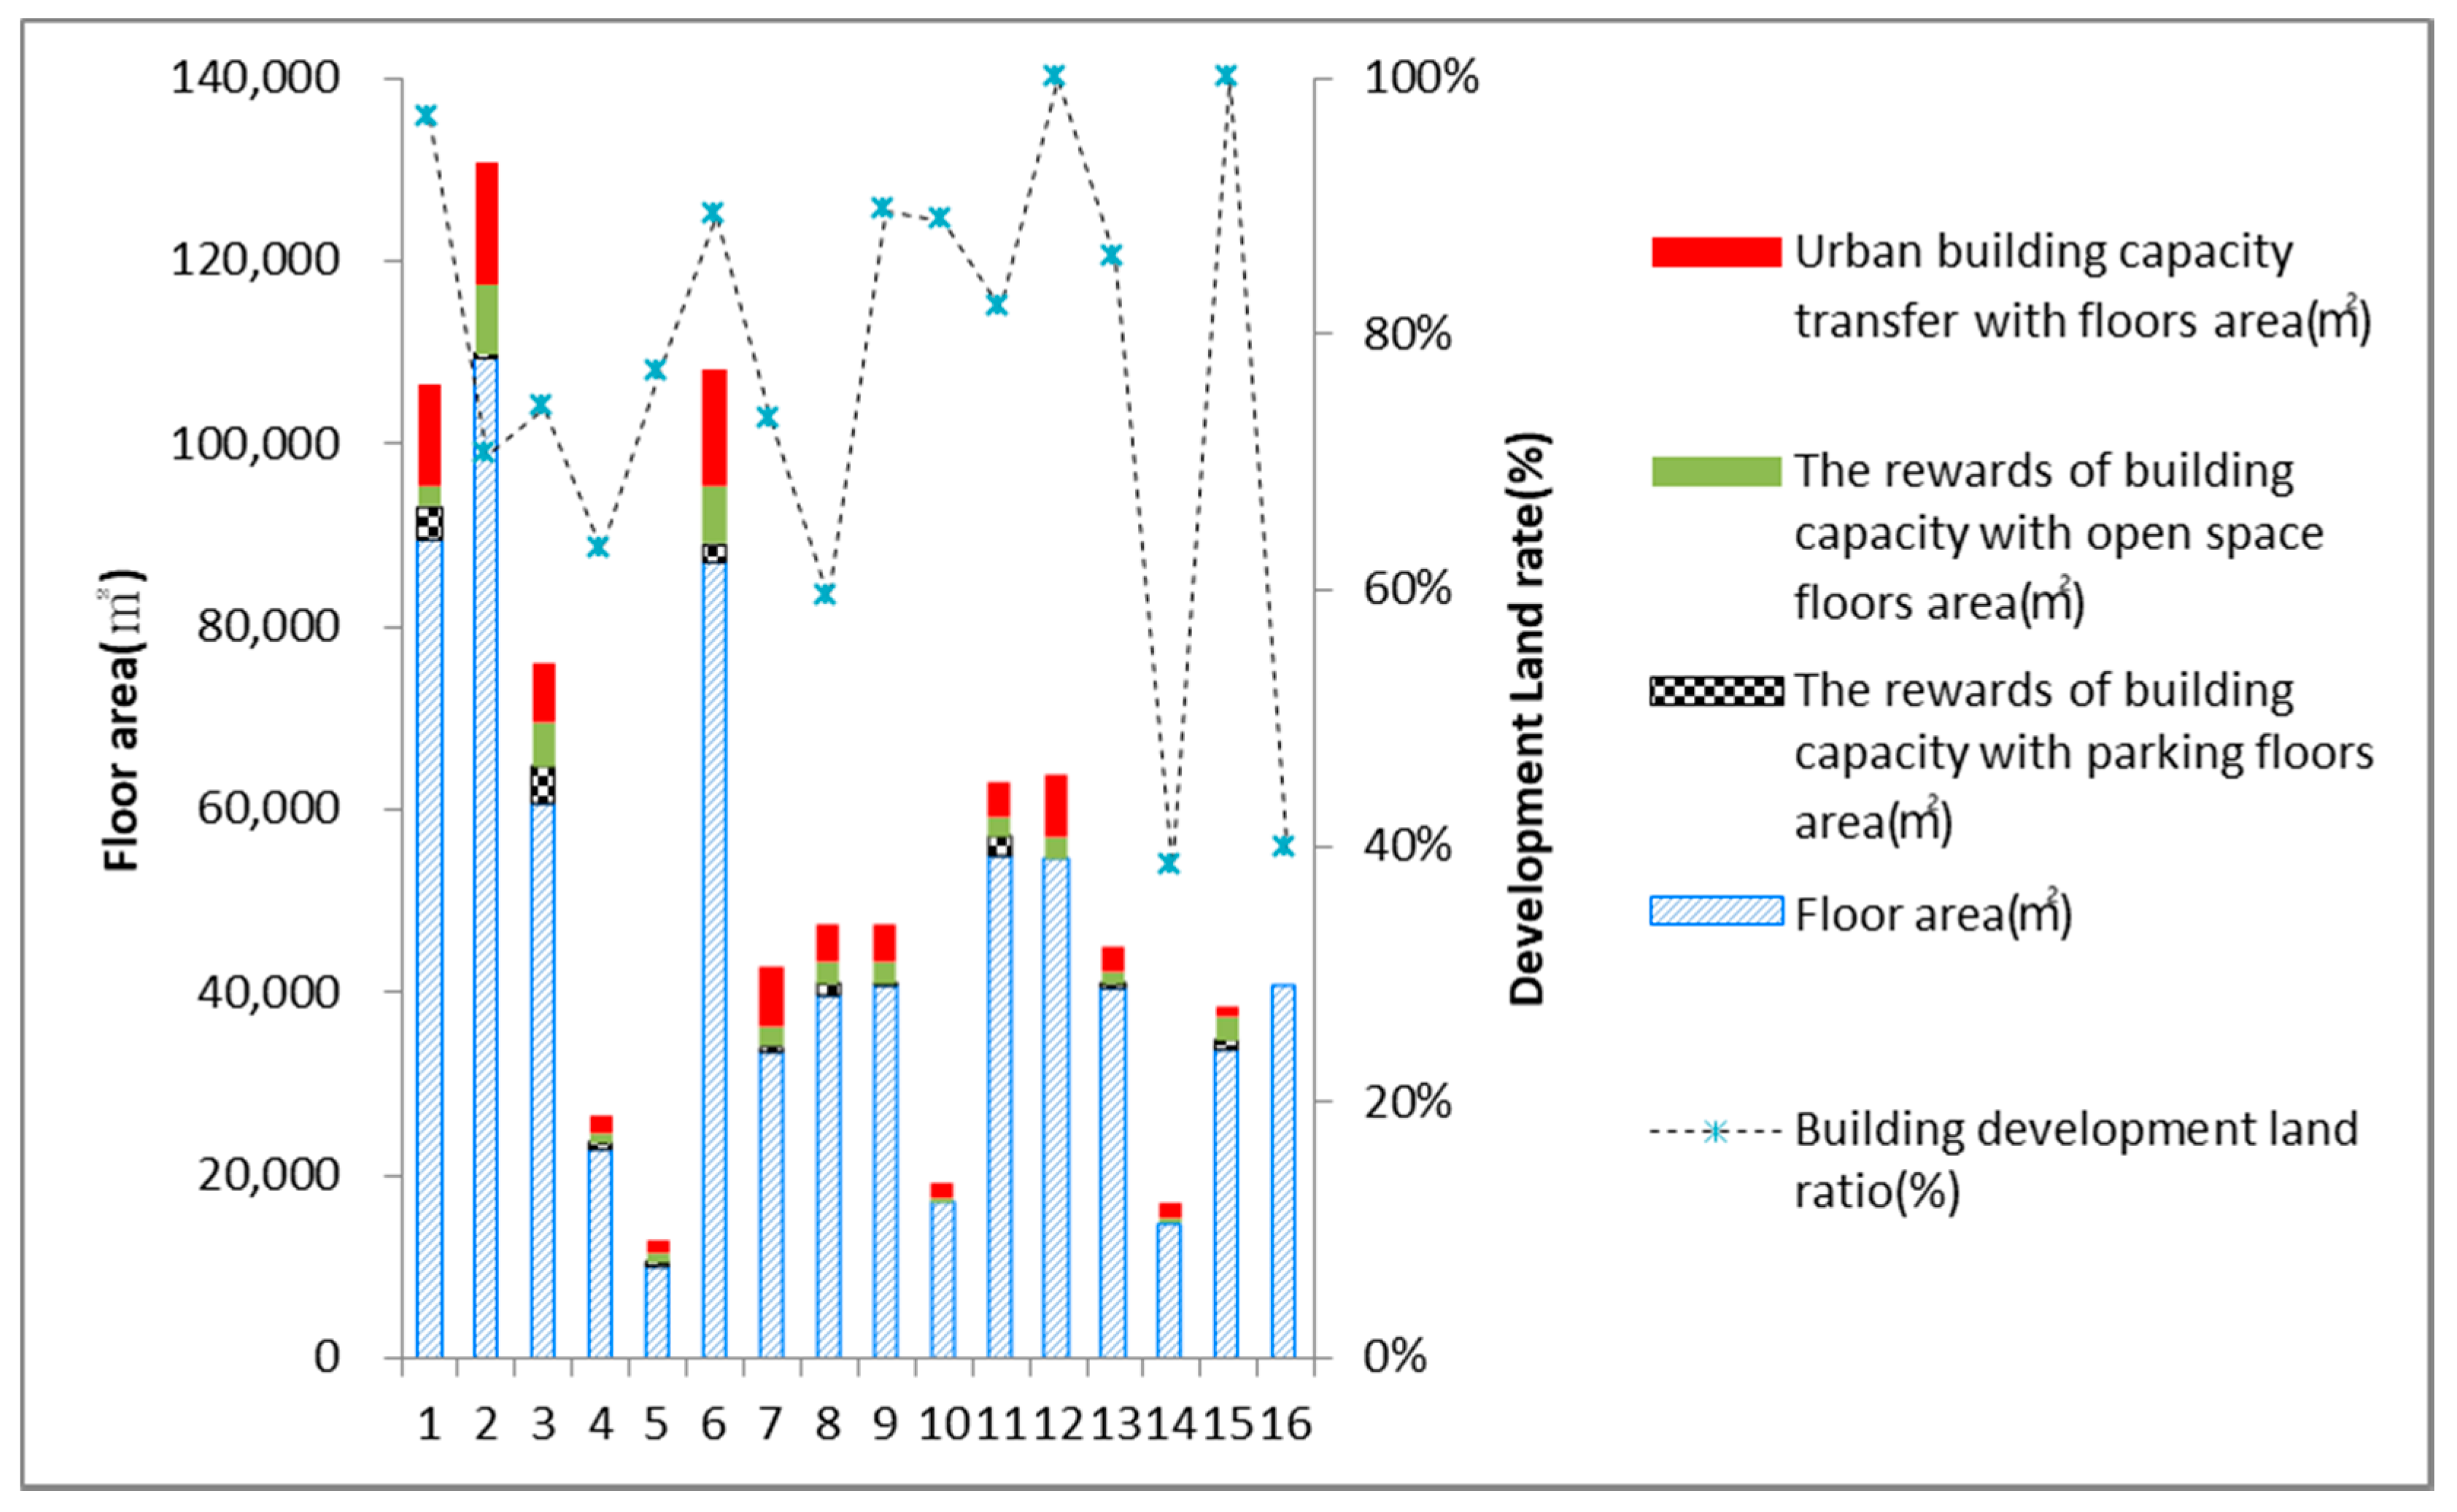
This study conducts in-depth analysis of the relation between traffic volume and building design scale. Regarding building design in this research, due to the applicable factors of award decrees of various floor areas, the ultimate design of the building scale is influenced, thus, this research incorporates the total area of the reward of building capacity with parking, total area of the reward of building capacity with open space and the urban building capacity transfer with floor area (Figure 6) and the result is shown as follows (Table 4).
In this research, an urban block is taken as the basic unit, the total traffic volume generated at the four road crossings of the block is analyzed in order to forecast the mutual relation and efficiently and conveniently estimate the overall urban energy consumption. The research result is as follows:
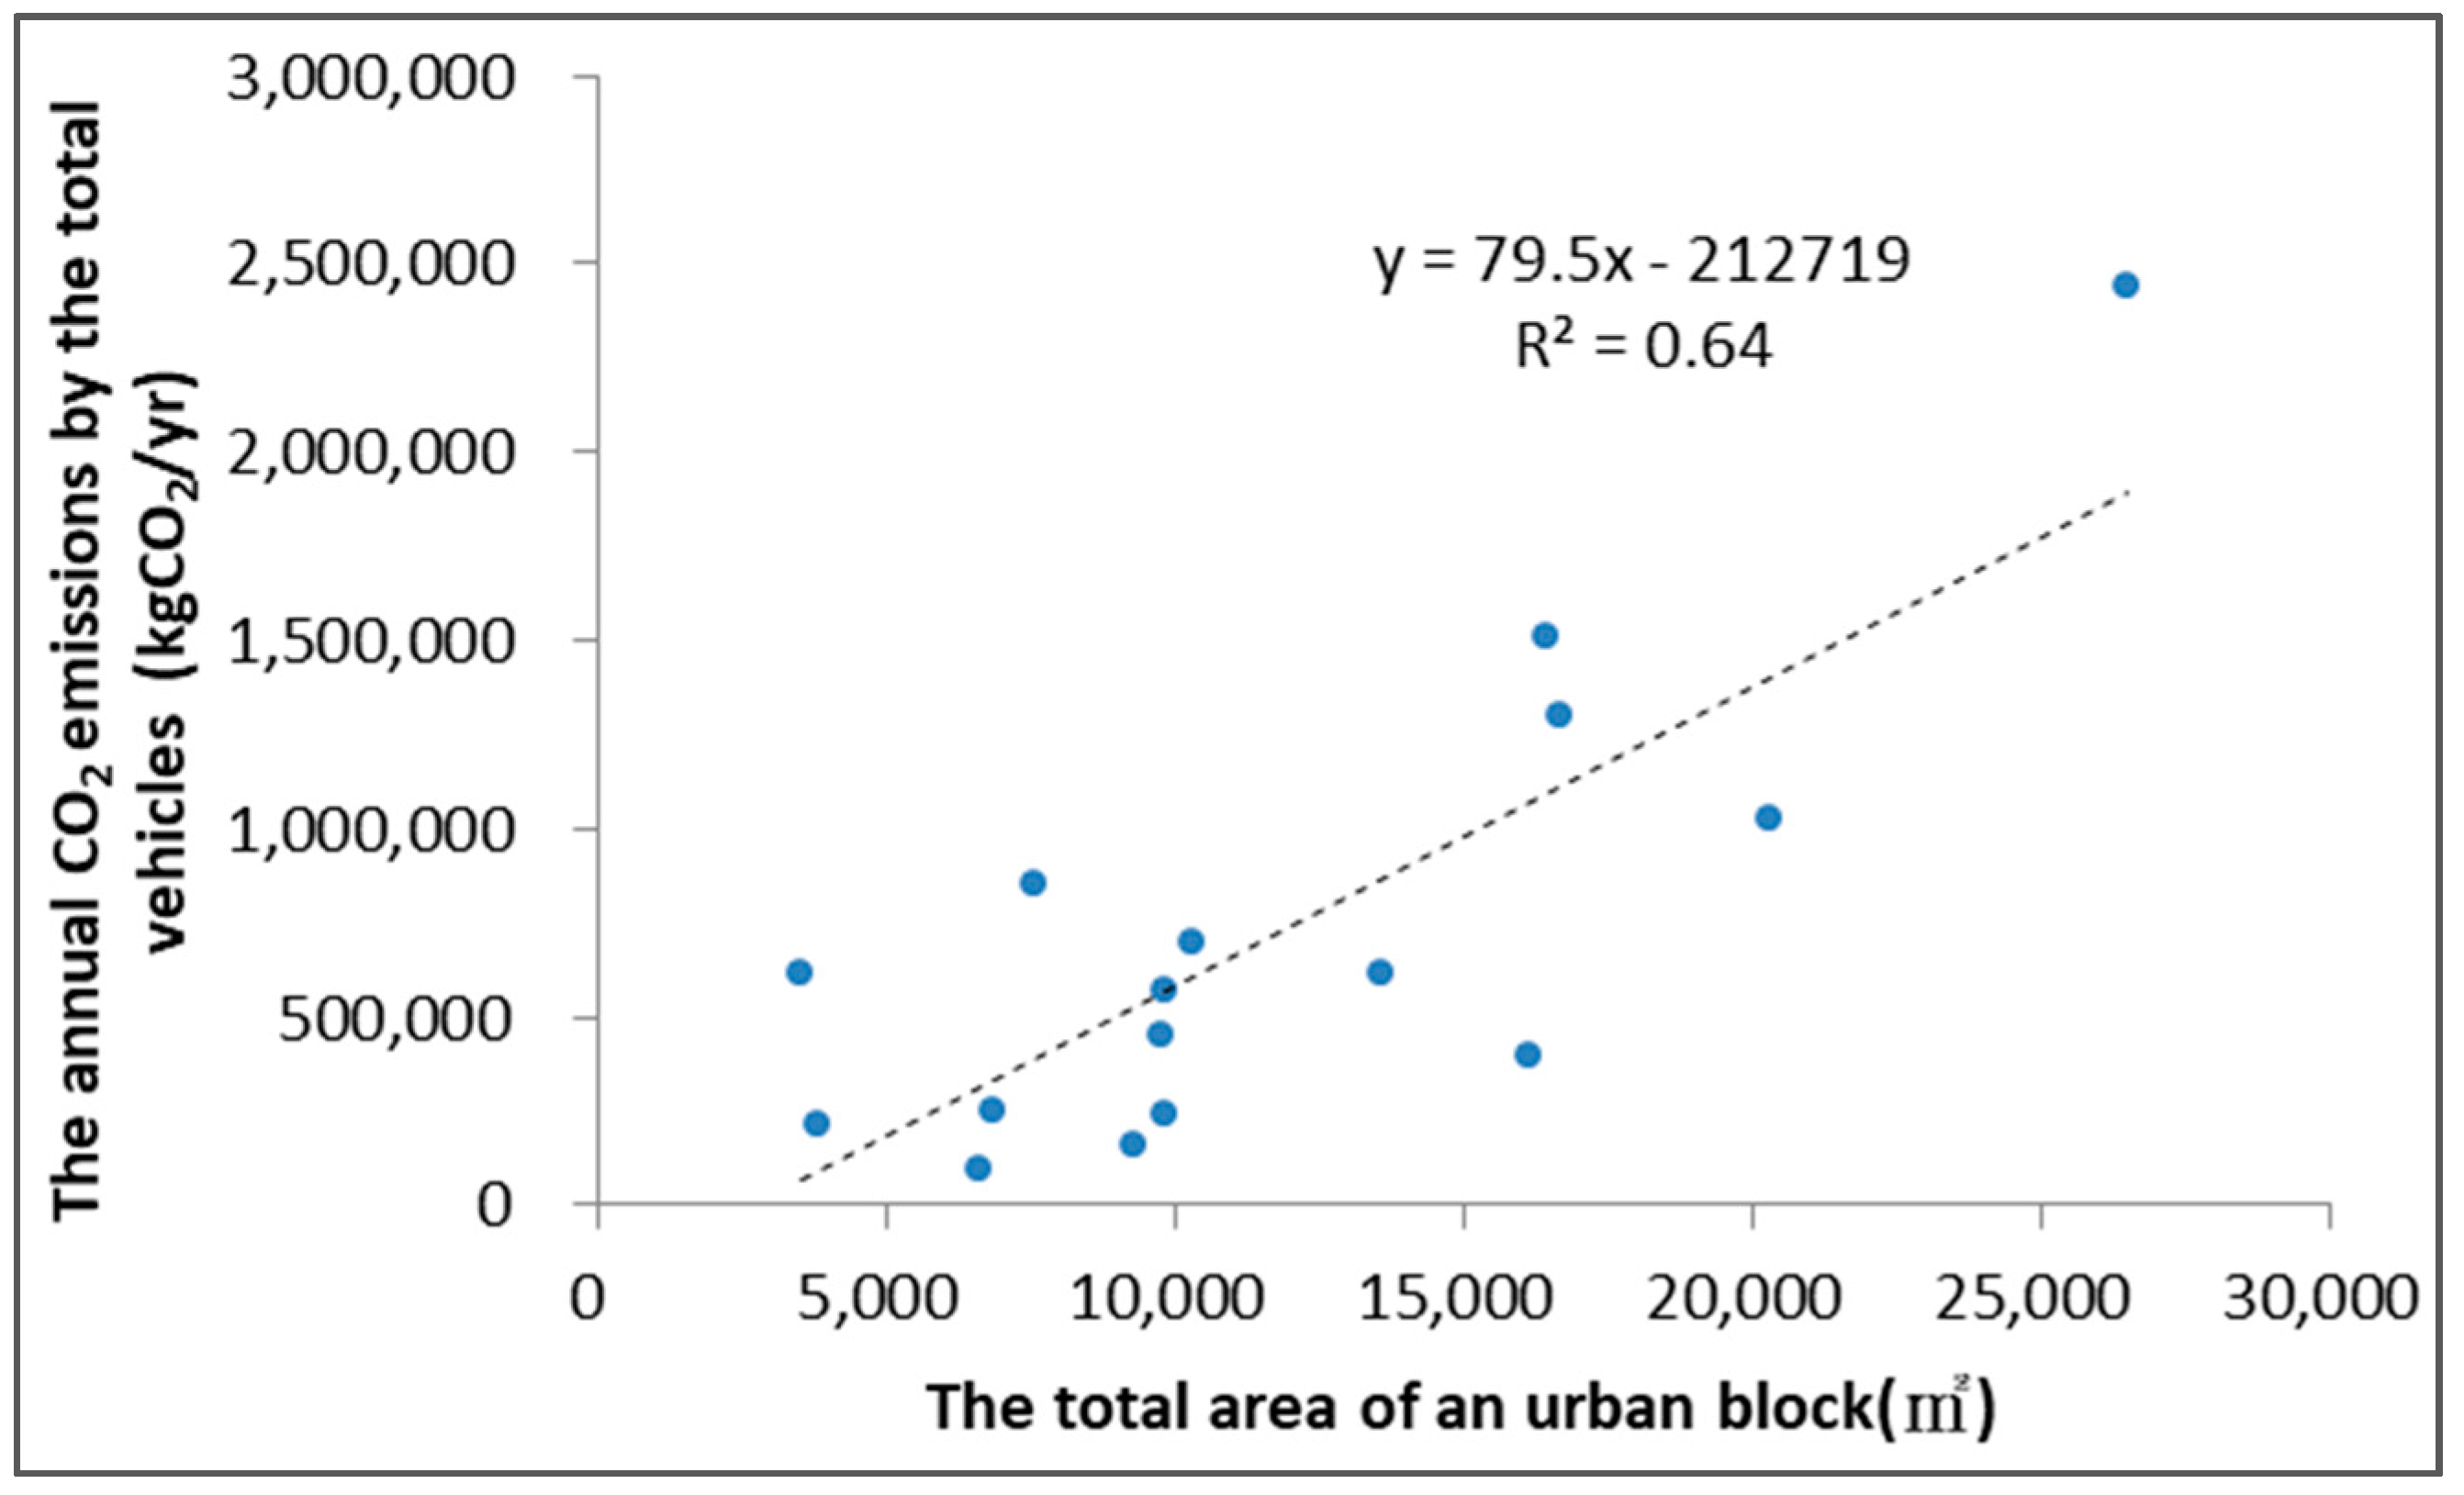
The relation between the total annual CO2 emissions of urban blocks generated by vehicles and the total area of an urban blocks (Figure 7) is as follows:
y = 79.5 × TA − 212,719 R2 = 0.64
This formula is the total annual CO2 emissions of vehicles in the blocks (kgCO2/yr) and TA is the total area of an urban blocks (m2).
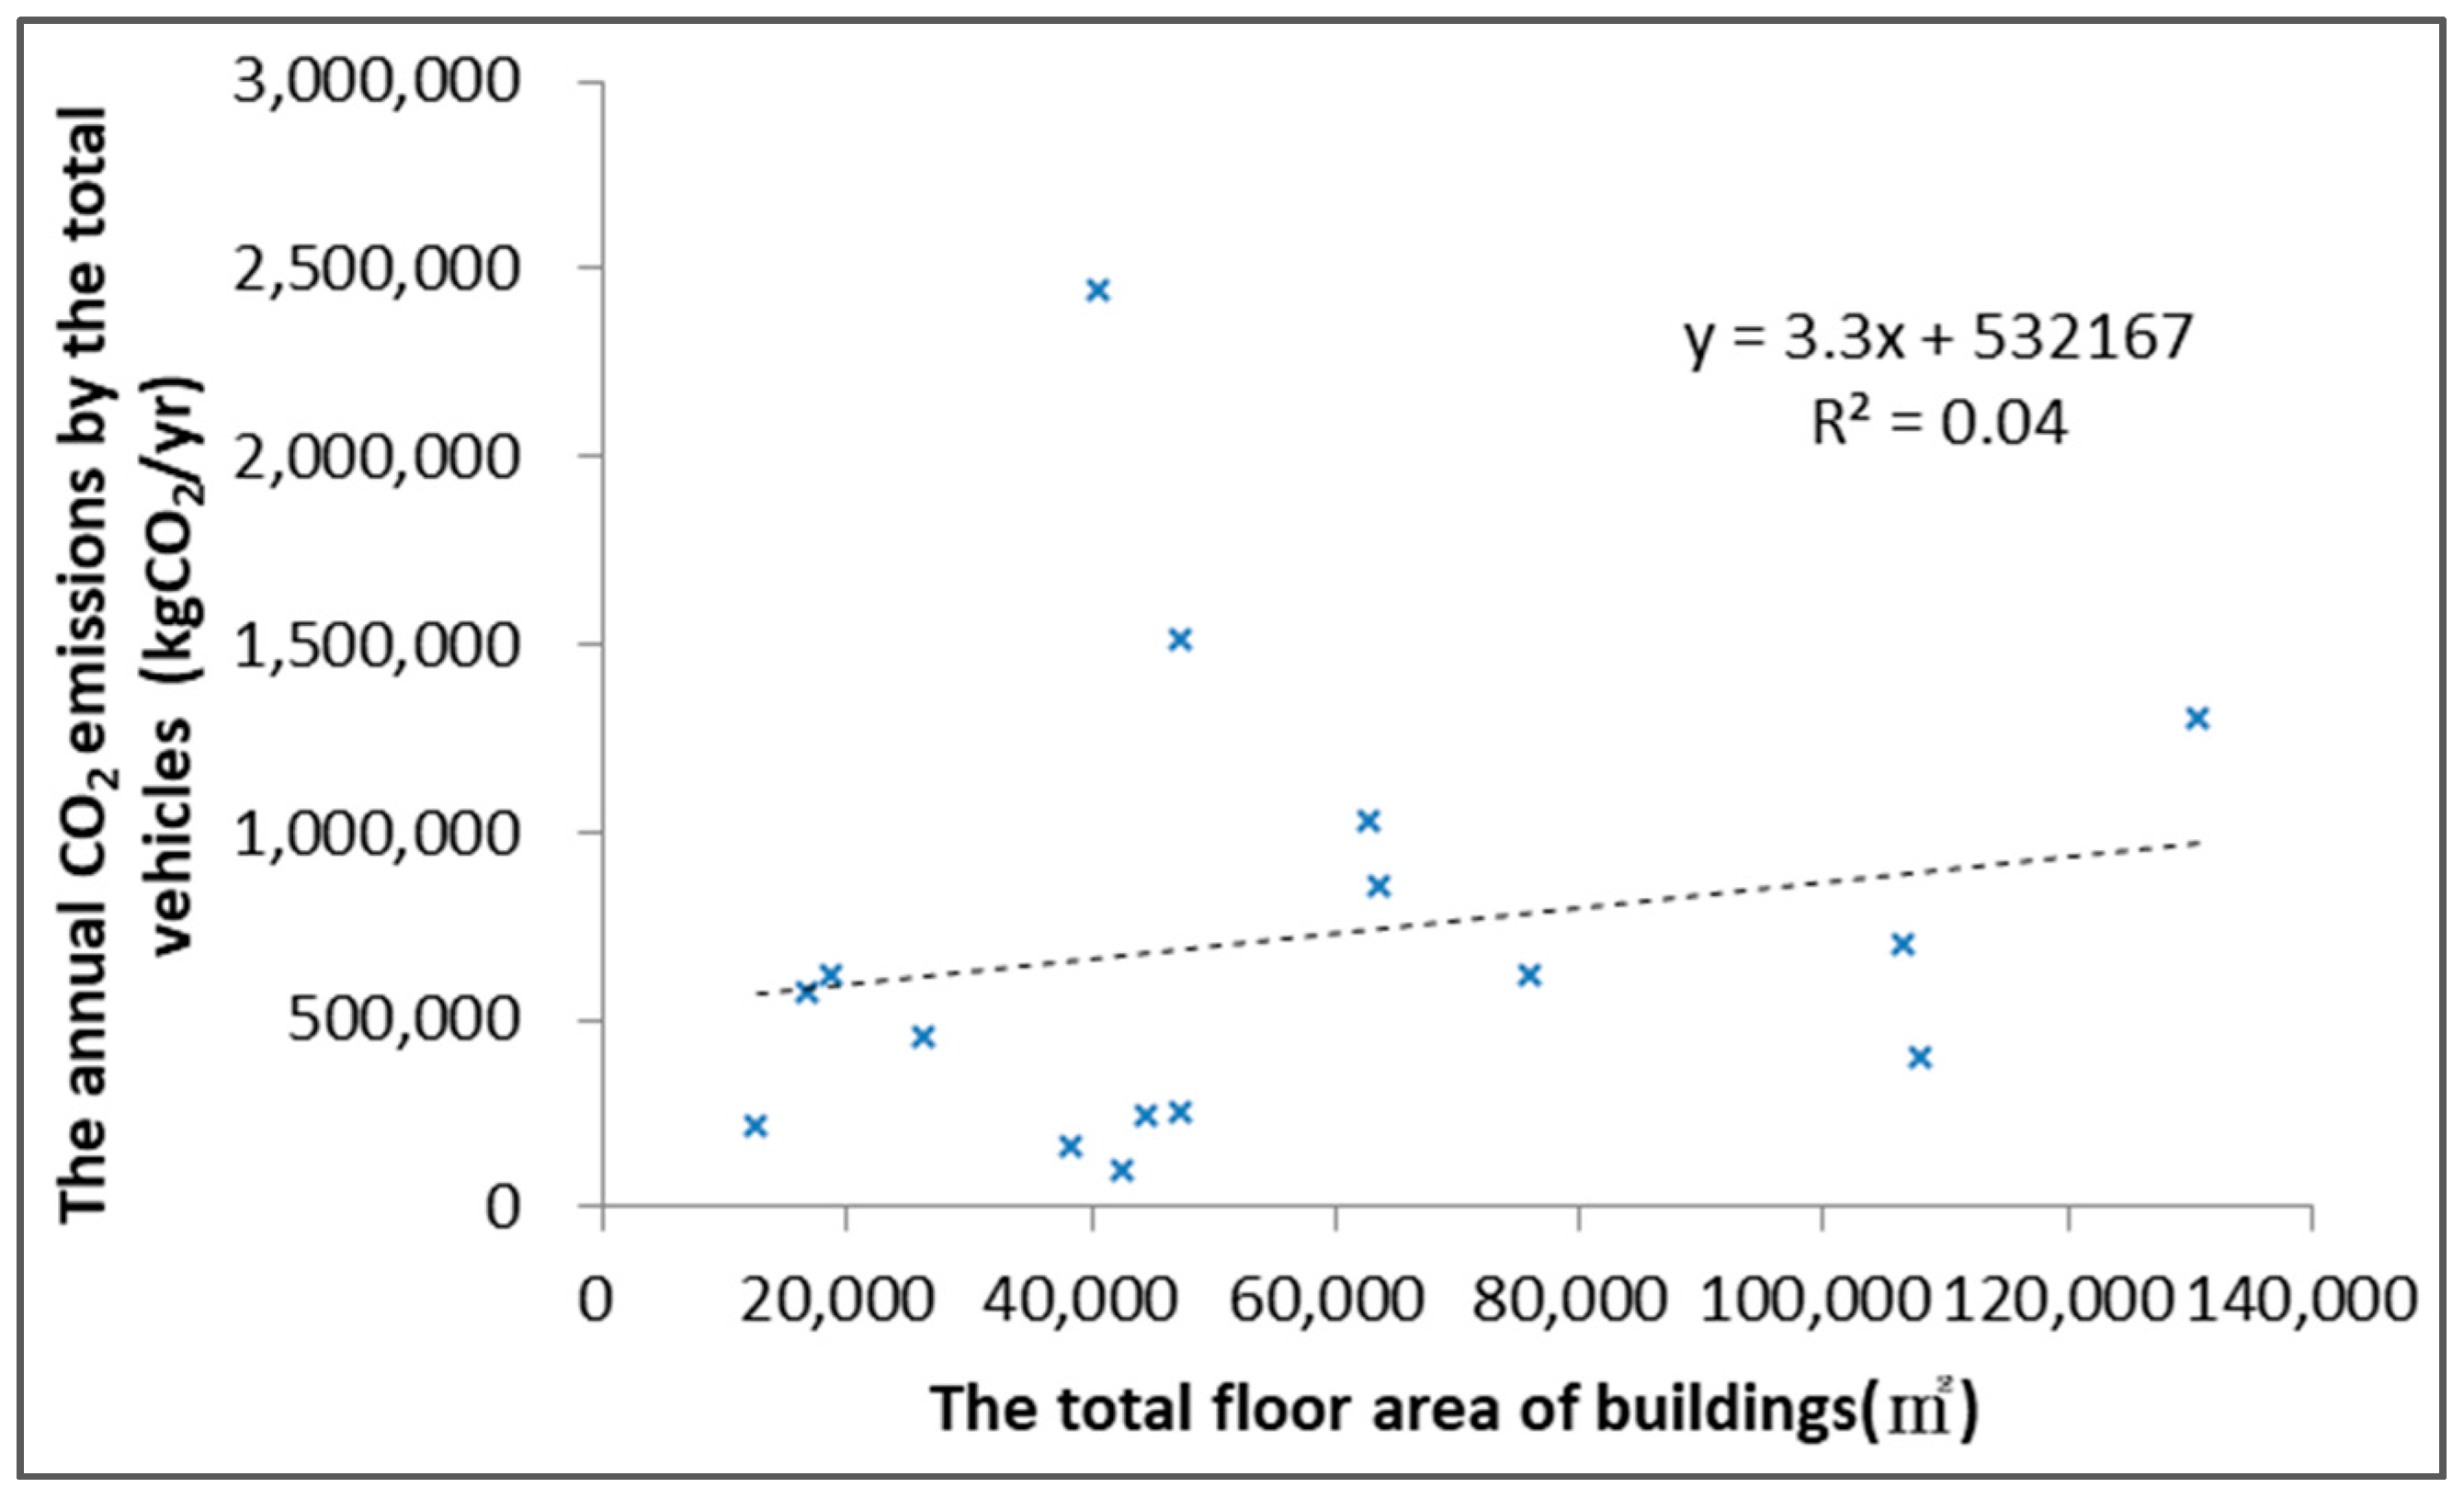
The relation between the total annual CO2 emissions of urban blocks generated by vehicles and the total floor area of buildings (Figure 8) is as follows:
y = 3.3 × FATA + 532,167 R2 = 0.04
This formula is the total annual CO2 emissions of vehicles in the urban blocks (kgCO2/yr) and FATA is the total floor area of buildings (m2).
After analysis of the 16 blocks, this research aimed at the seven important factors influencing building planning and the total CO2 emissions of vehicles and the multiple regression forecast formula of the total annual CO2 emissions of vehicles in the blocks is concluded as follows:
where, TVC is the annual CO2 emissions generated by the total vehicles (kgCO2/yr), TA is the total area of an urban blocks (m2), SA is the site area (m2), BA is the building area (m2), FATA is the total floor area of buildings (m2), FAP is the total area of the reward of building capacity with parking (m2), FAO is the total area of the reward of building capacity with open space (m2) and FAT is urban building capacity transfer with floor area (m2). In this research, the relation between seven important design factors of the building design and the daily passenger car unit is further analyzed and the forecast multiple regression formula of the total passenger car units of the blocks within one day is concluded as follows:
where, TV (total vehicles) is the passenger car unit per day (PCU/day) and other symbols are the same as Equation (8).
TVC = 14,359.71 + (109.94 × TA) − (60.92 × SA) − (88.17 × BA) + (15.36 × FATA) − (65.30 × FAP) − (118.30 × FAO) − (39.60 × FAT) R2 = 0.84
TV = 30,065 + (4.72 × TA) − (4.99 × SA) − (2.19 × BA) + (1.09 ×FATA) − (6.47 × FAP) − (6.38 × FAO) − (3.39 × FAT) R2 = 0.57
Regarding the total floor area, new households and actual construction and development rate of blocks of building designs in an urban block, the forecast regression formula is concluded as follows:
where, TV is the passenger car unit per day (PCU/day) and BE is the building development land ratio, which is the ratio of applied land for a building permit divided by the total block area, FATA is the total floor area of buildings (m2) and HH is the number of households.
TV = 94,042 − (59,234.2 × BE) + (0.86 × FATA) − (181.65 × HH) R2 = 0.66
Regarding the relation with the total traffic volume, as generated by the urban traffic system within one day, the forecast regression formula in this research is concluded as follows:
where, TVi is the passenger car unit per day (PCU/day) generated on road i, Rdi is the length of the road (m) at block i and Rai is the area of road (m2) at block i.
TVi = 8873.61 − (116.28 × Rdi) + (7.51 × Rai) R2 = 0.83
3.3. Result of the Distribution Map of One-Day Vehicle Volume in Urban Areas
According to the “Code for design of urban roads and auxiliary engineering” (1999) and the general practical application, the method to plan a lane usually depends on lane width. If the road is 15 m wide, planning is dominated by car lanes and motorcycle vehicle mixed lanes; if the road width is more than 20 m, the division of two lanes is taken as the principle.
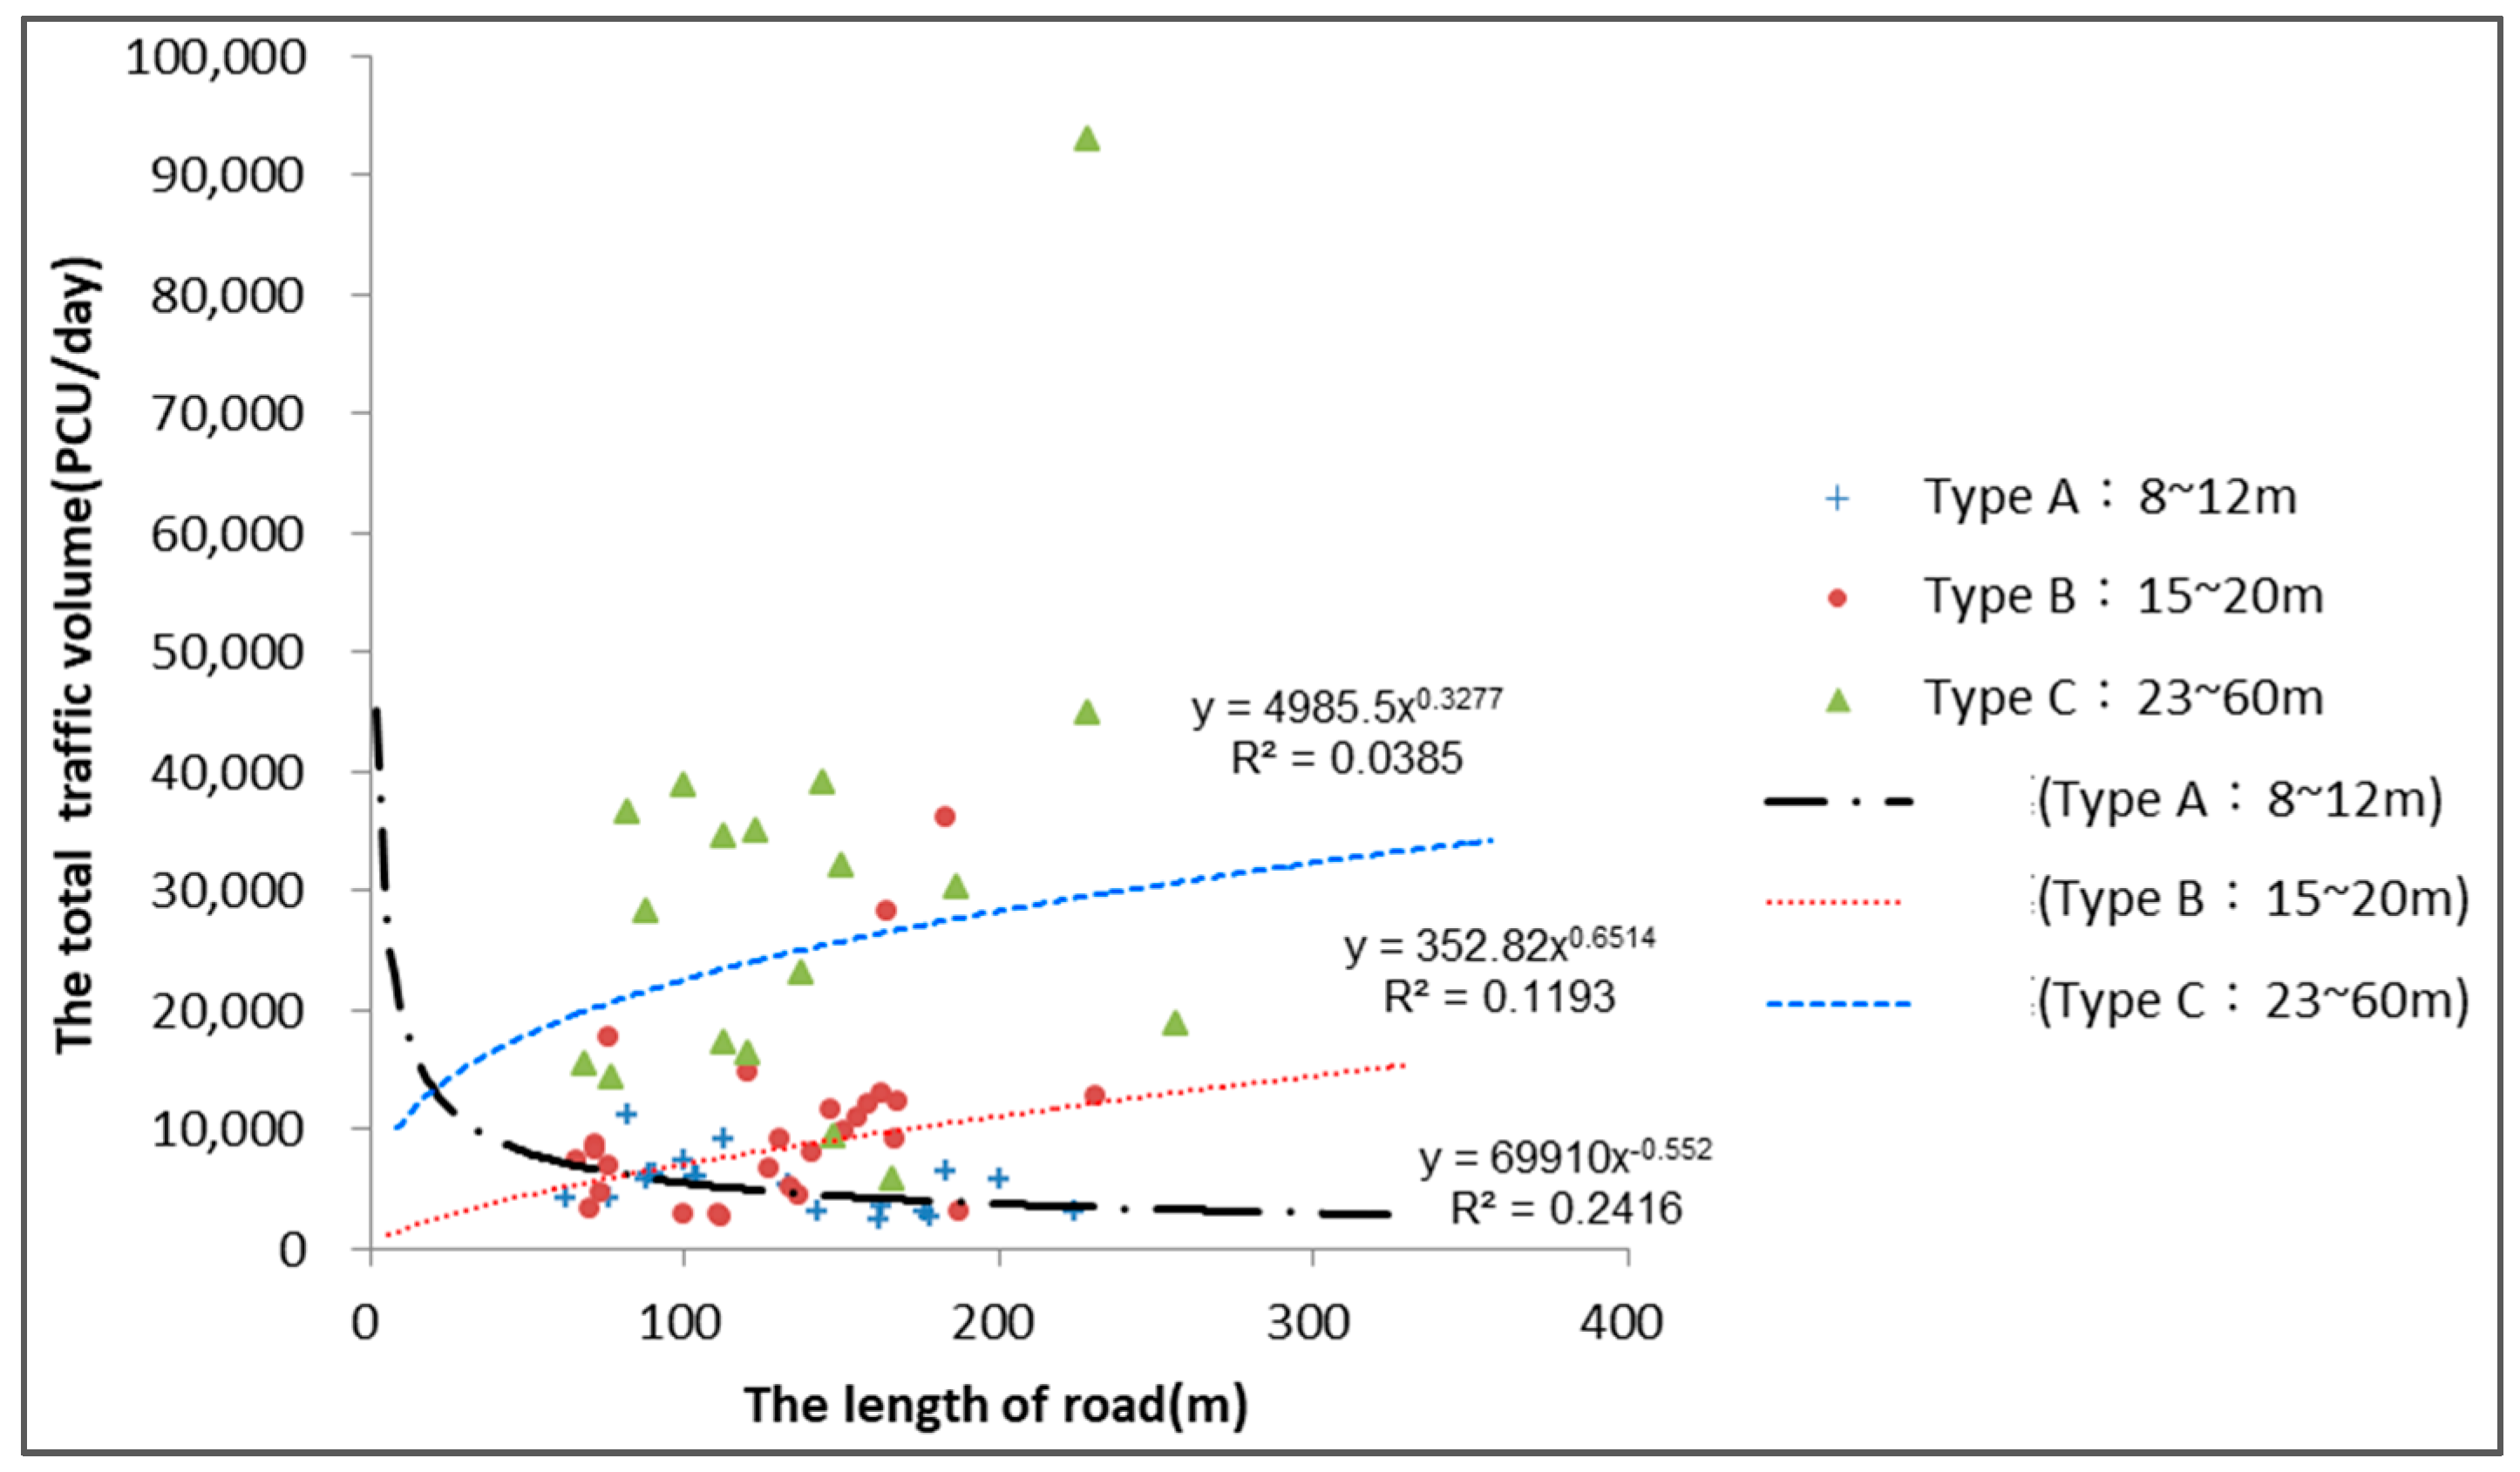
In this research, in order to analyze the road width, as well as the mutual relation between the length of each road in the block and the amount of traveling vehicles generated in the road throughout the day, three road widths are classified (Type A: 8~12 m; Type B: 15~20 m; Type C: 23~60 m). This research found that the relation between the passenger car unit and road length in the three road widths is, the wider the road is, the longer the road and larger the traffic volume will be (Figure 9), thus, there is non-positive correlation for urban roads with a width less than 12 m.
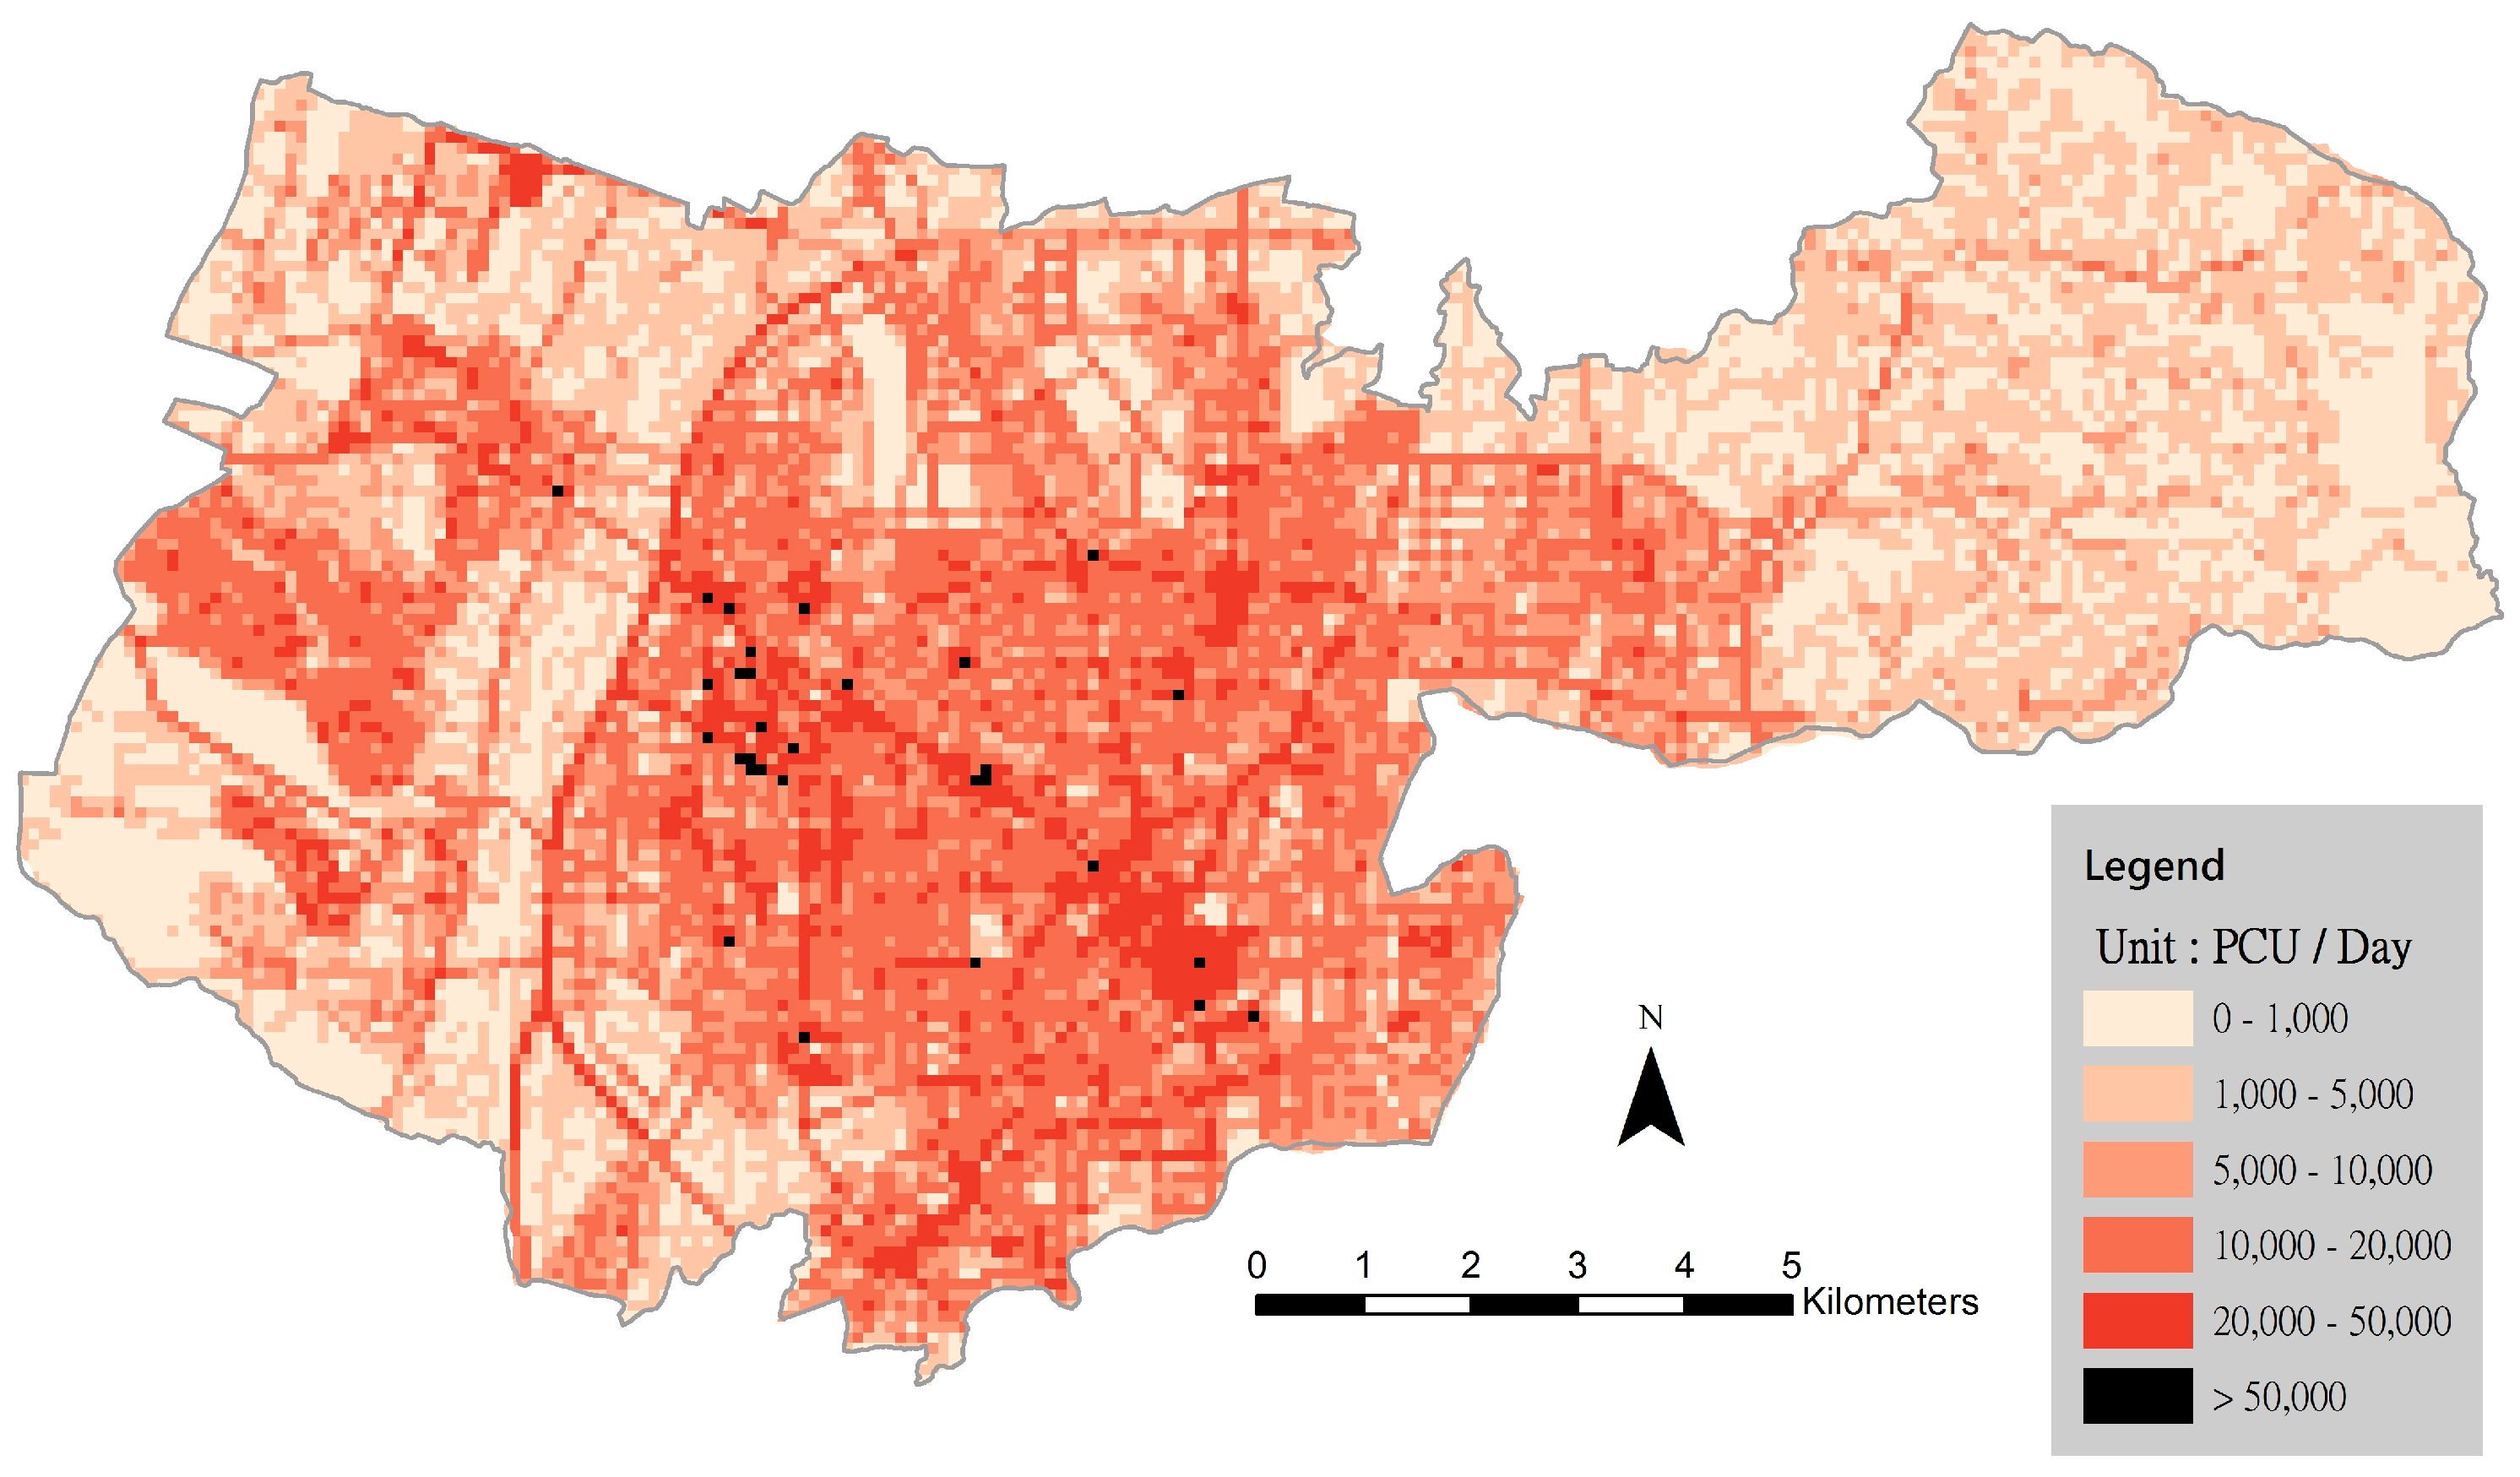
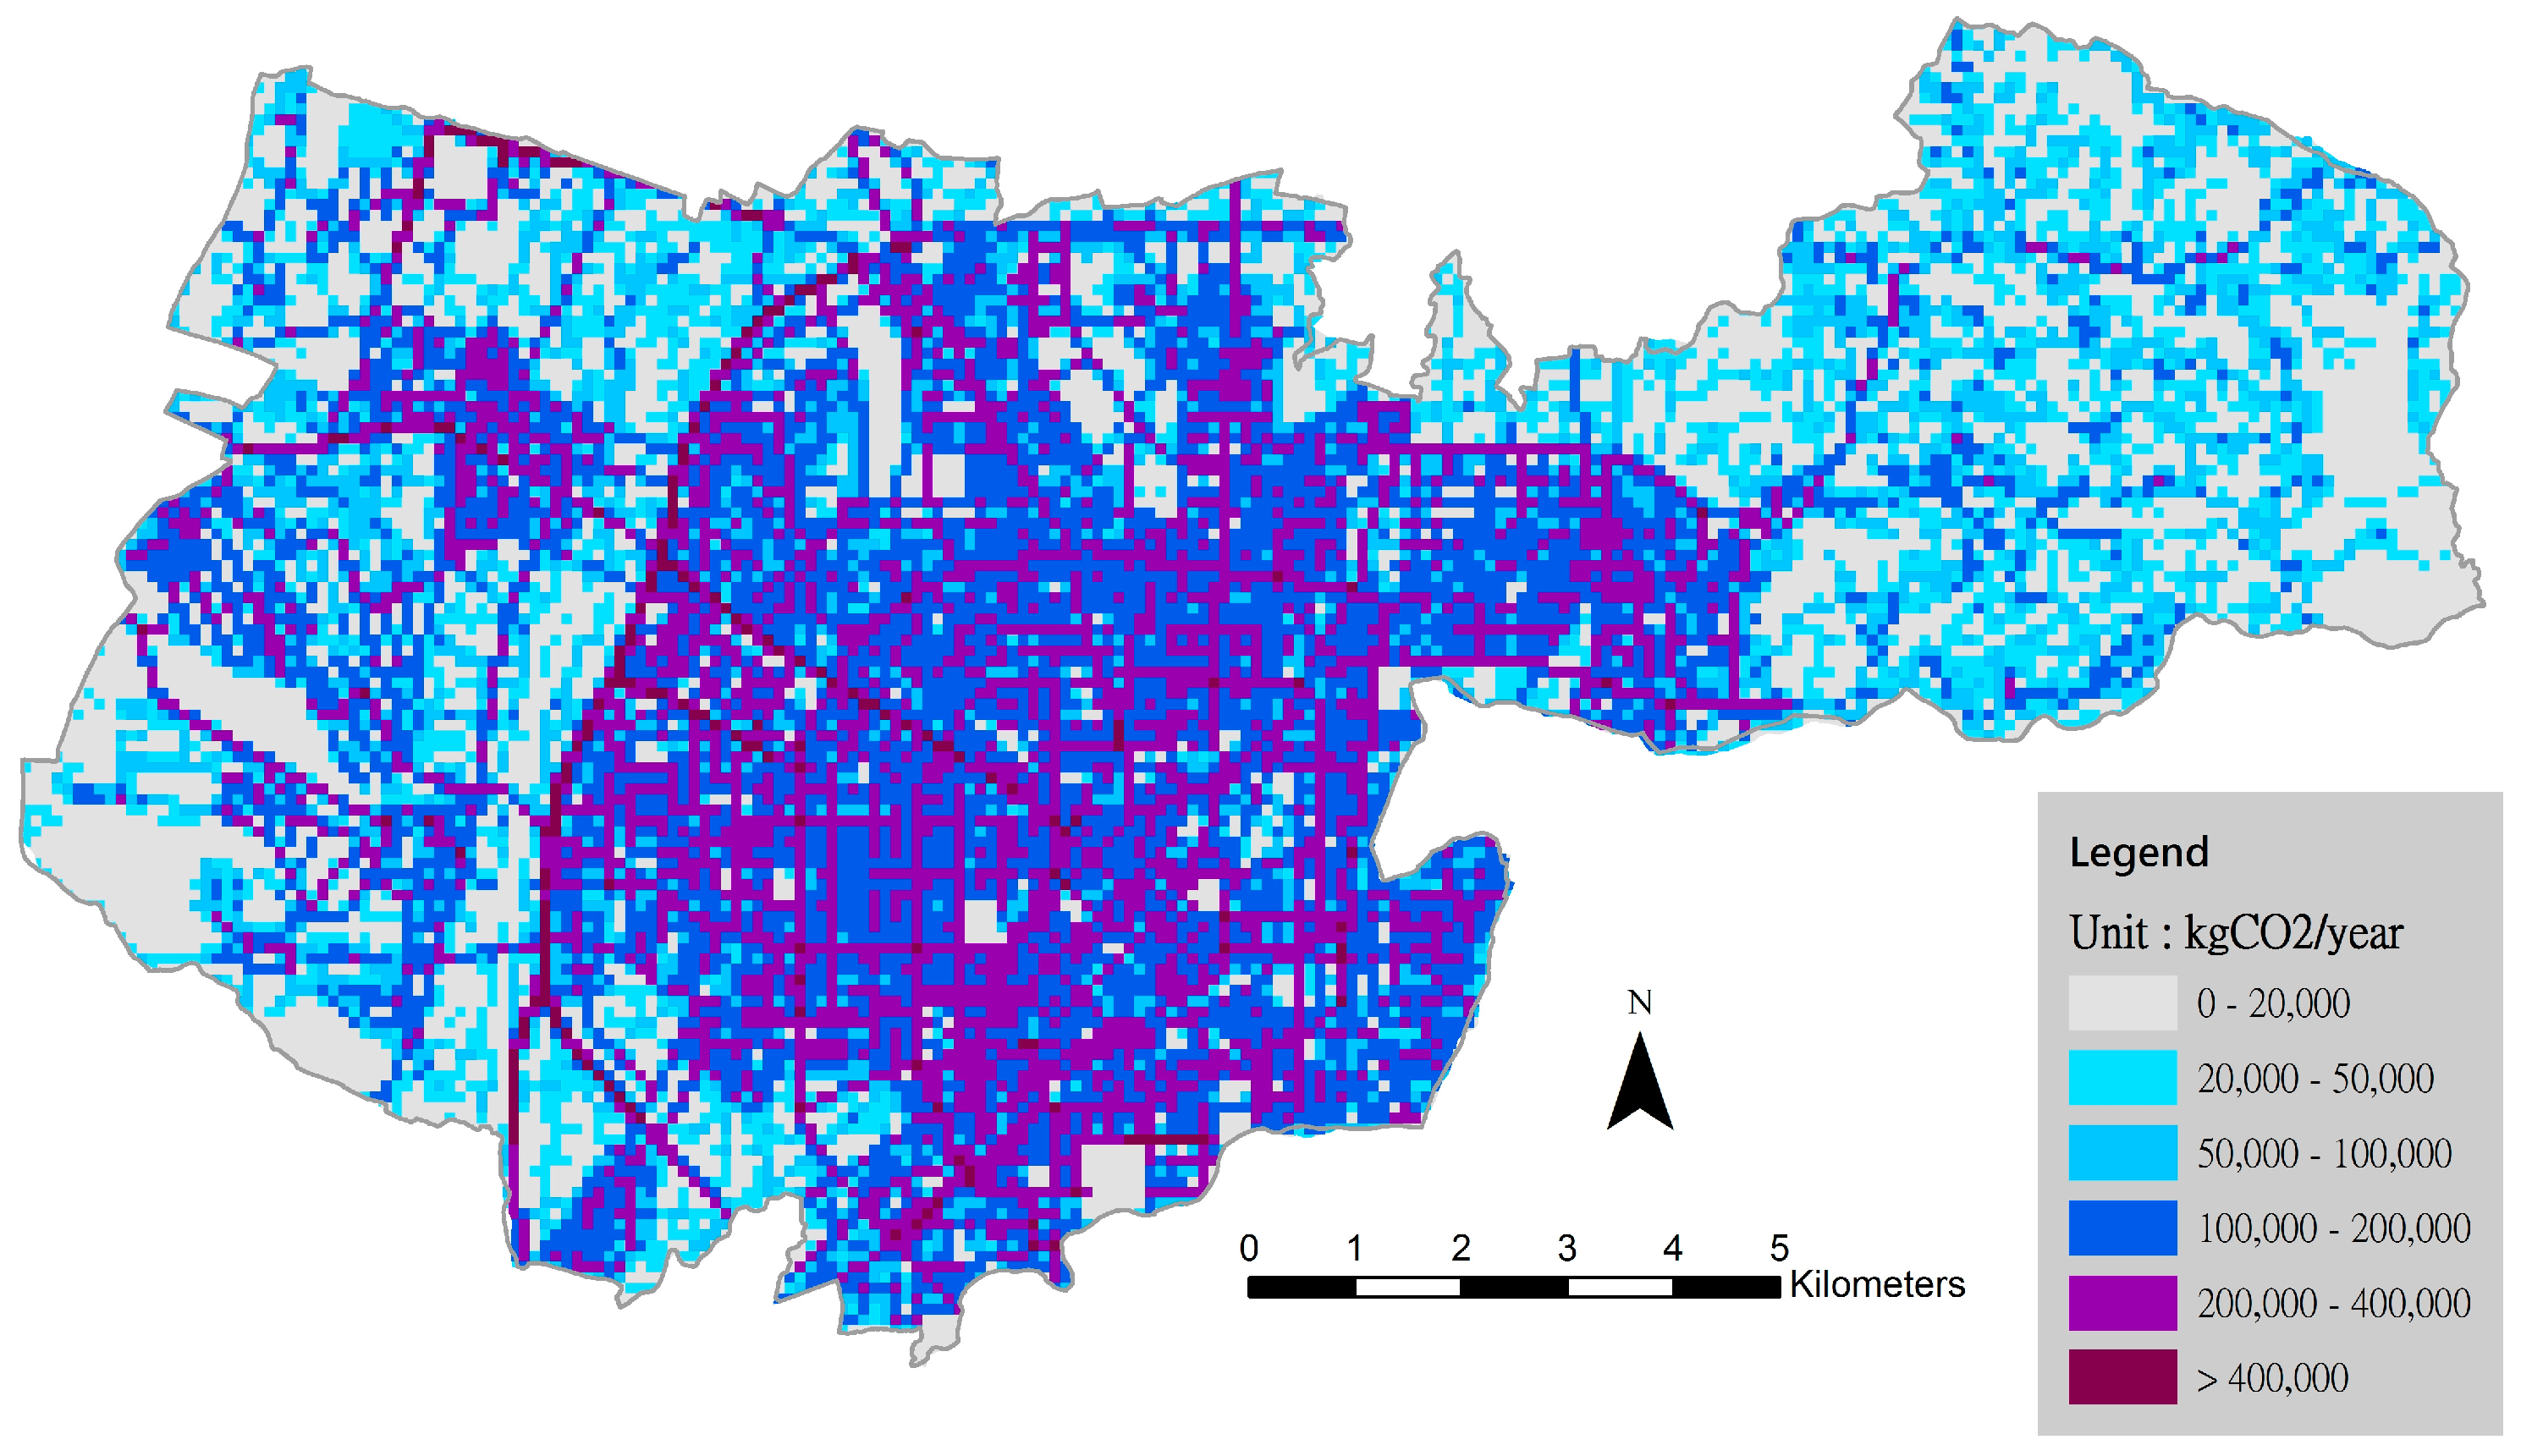
This research takes the Geographic Information System data of Taichung in a scale of 100 × 100 m mesh, the urban planning road by law is taken as the main explanation target and the research result of Equation (11) is used to calculate the road length and road area; after calculation and layer analysis, the distribution map of passenger car units in Taichung within one day is presented (Figure 10) and amount of CO2 emissions from traffic (Figure 11) and the urban traffic environmental characteristic map can effectively provide the basic information to judge traffic volume.
This figure presents a large distribution of traffic volume in the Taichung metropolitan area, which is dominated by linear distribution in the main external road, while a great characteristic is formed with the traffic flow on the ring road. In addition, for roads with higher traffic volume, a single hot spot is generated at the main road crossing.
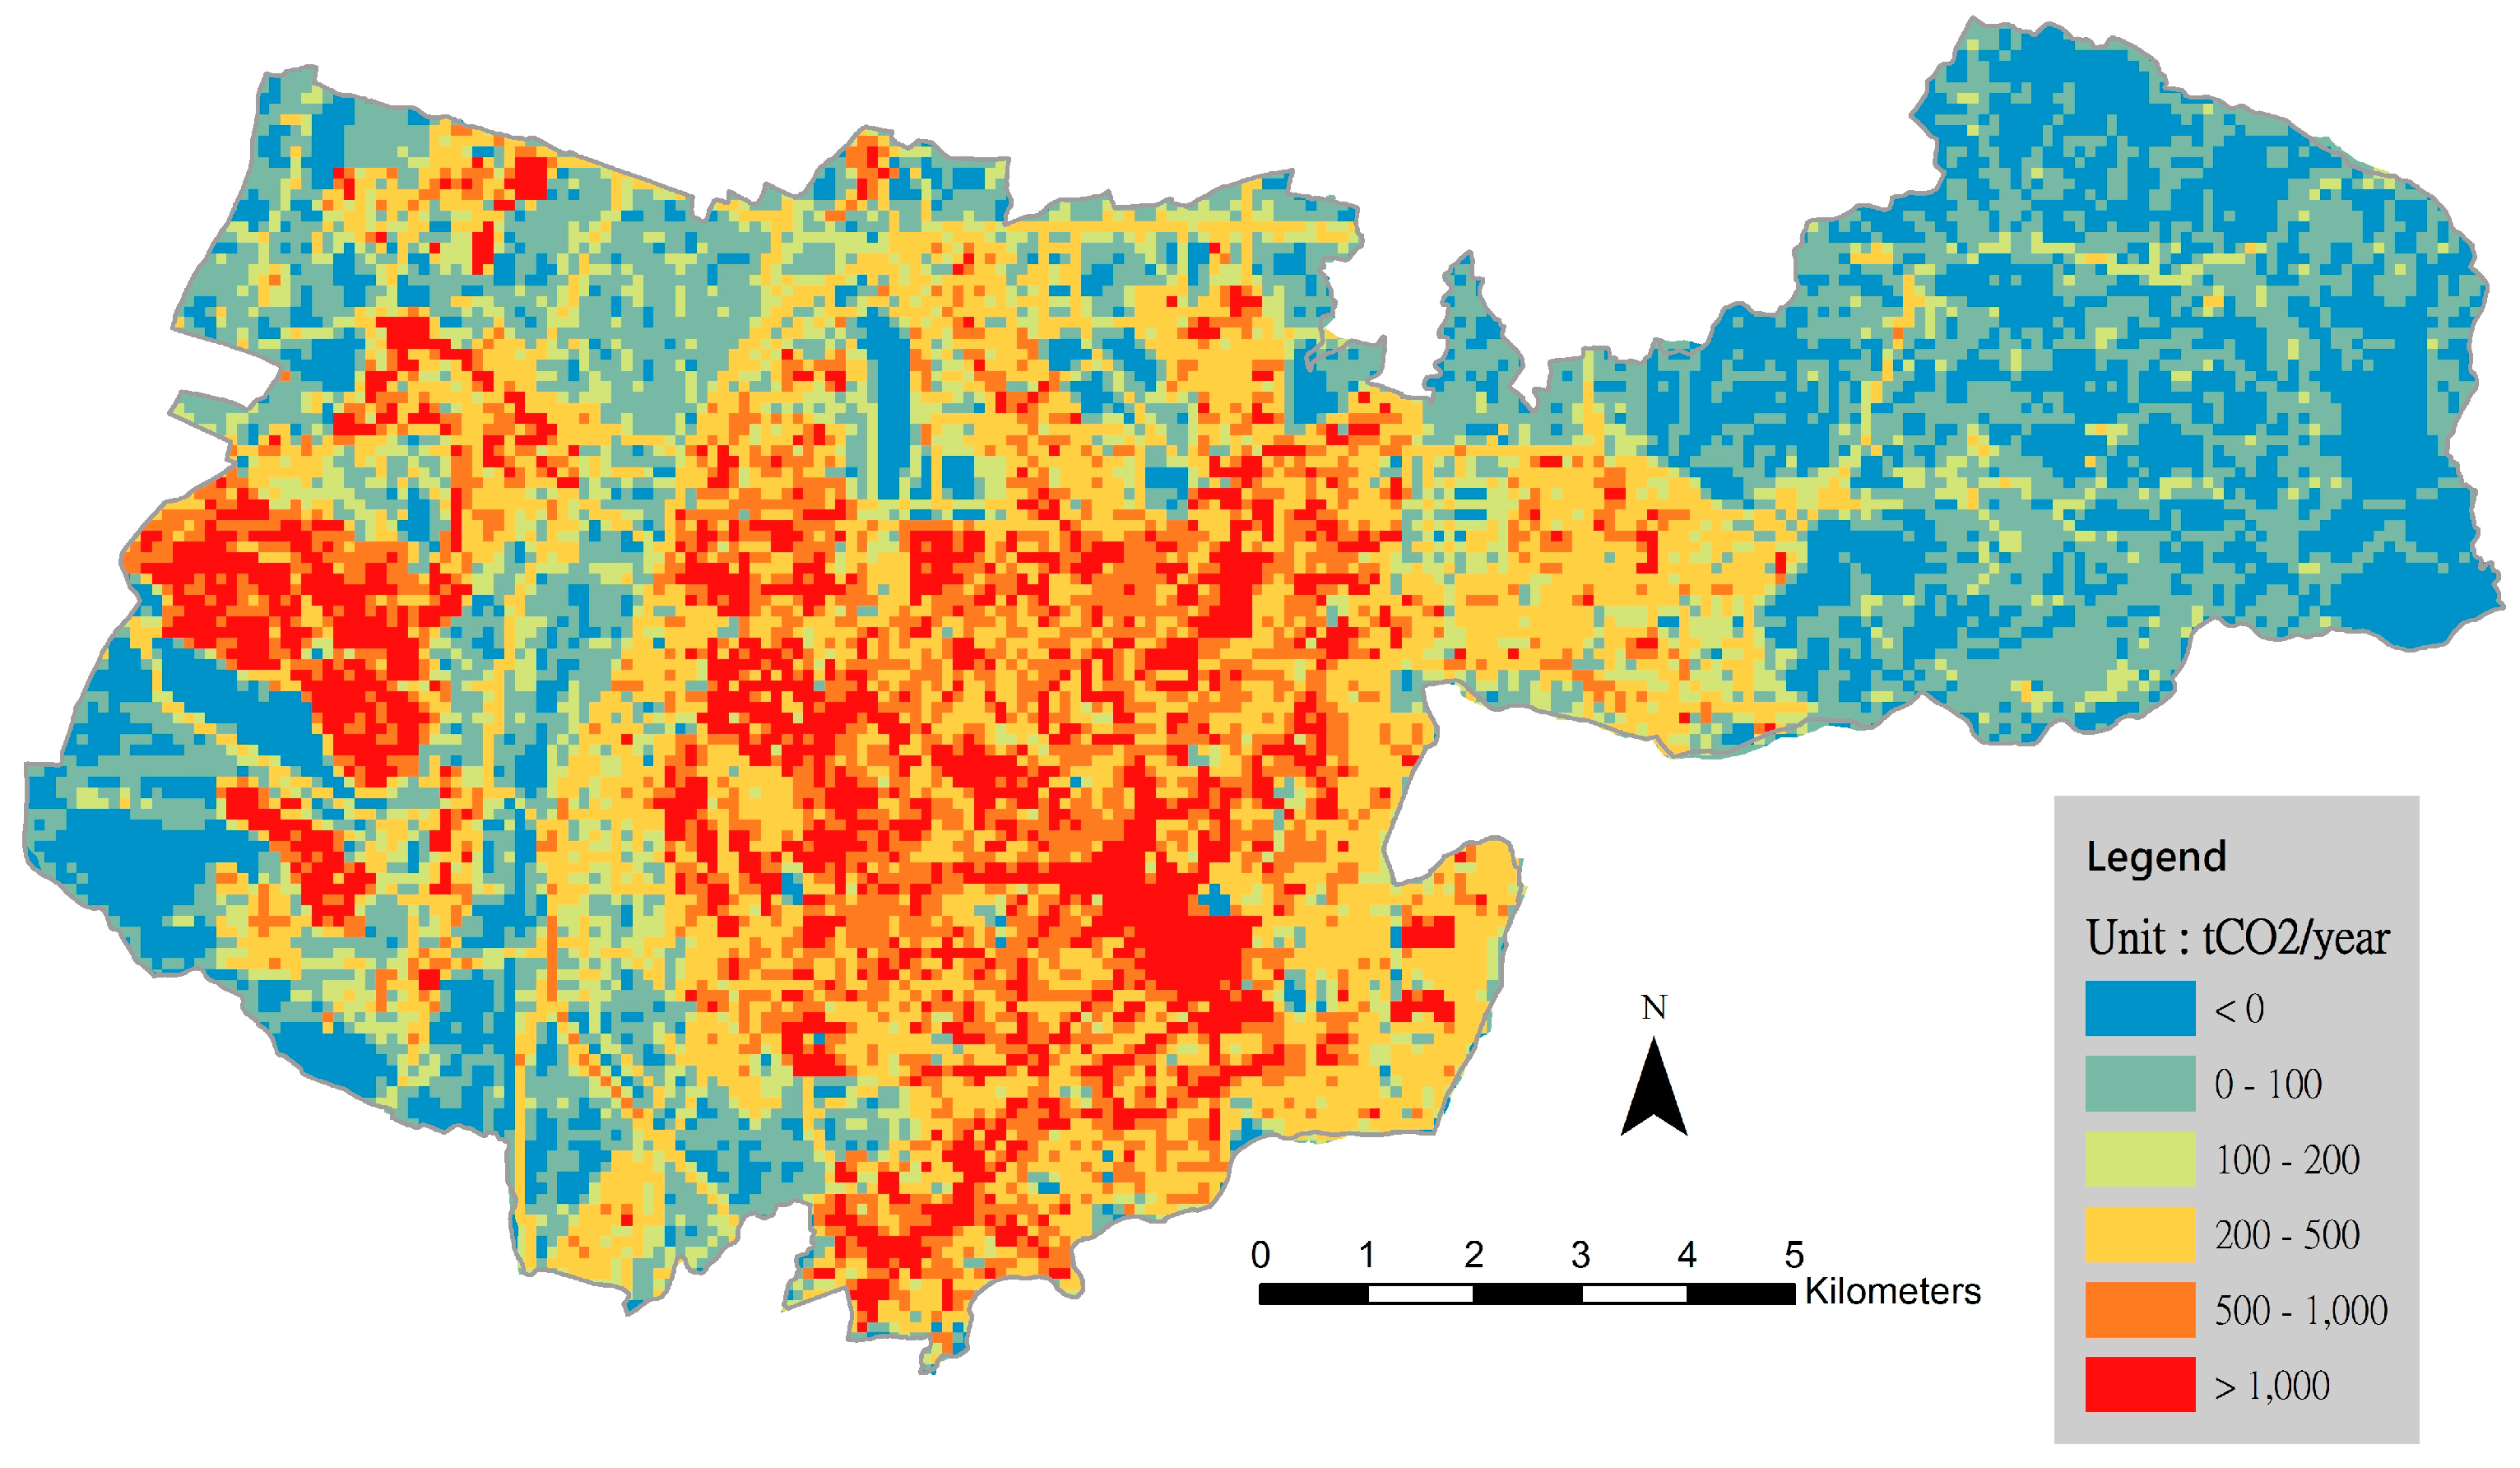
Finally, the total CO2 emissions from traffic and buildings in each 100 × 100 m grid in Taichung were estimated according to the type of land specified and the effects of the city’s carbon sinks (e.g., rivers and parks) on that estimated volume of CO2 emissions were analyzed. On the basis of these results, a carbon budget map for the city was constructed (Figure 12).
4. Discussion
Due to climate change and the influence of the reduction of CO2 emissions, in this research regarding the method and purpose of forecasting traffic volume and estimations of CO2 emissions, the discussion and model application limitations are proposed as follows:
Daily traffic volumes were measured largely at thoroughfares; little such data were collected at typical roads. To increase the availability of traffic volume data at different types of roads, future studies can collect this data continuously and measure the traffic volume of both thoroughfares and common roads on a daily basis and analyze these data to improve the accuracy of prediction models. This research summed up hourly traffic volumes measured at thoroughfares and conducted a regression analysis of maximum traffic volumes at thoroughfares during morning and evening peak hours. Therefore, the CO2 emissions from road traffic predicted by this research were characteristically large.
Regarding urban road travel distance, due to different forms of vehicles, different carbon emissions are generated; in terms of calculation, due to simplification and no consideration of types of fuels, driving speeds, road slopes and other fuel consumption influences, the research result belongs to the result of a larger forecast value. In the four road crossings in a single block in an urban area; regarding the case of measured data of existing traffic volume, practical data are difficult to obtain, thus, this research suggested that in order to increase the accuracy of the estimation formula, in the future, researchers can directly measure the road crossing traffic volume at the four road crossings of a single urban block and expand it for use.
The fuel usage and efficiency and CO2 emissions of vehicles in use vary according to their types and road infrastructure planning. Therefore, future studies that analyze the amount of carbon emissions in an entire city can account for vehicle types and road infrastructure plans to inform their estimation of carbon emissions from road traffic. To estimate the amount of carbon emissions from buildings, future researchers can measure, on the basis of local EUI, the amount of CO2 emissions from electricity used by different types of buildings. The carbon-sink effects of constructed landscapes such as trees or green spaces on the amount of CO2 emissions from different types of buildings can also be measured to explicate how these effects on individual buildings help reduce CO2 emissions on the scale of city blocks.
5. Conclusions
By simplifying the transportation demand mode in this research, the forecast formula of the total traffic volume at important road crossings throughout the day in Taichung is obtained and the relation between building complex development factors and traffic volume generated by the overall urban blocks is analyzed.
Regarding the relation between the development scale of various buildings and the influence of vehicle traffic flows, this research calculates the passenger car units generated by each square meter of area every day, as well as the result of the total annual CO2 emissions. This research aimed at the relation between seven important design factors influencing building design, as well as the total traffic CO2 emissions, in order to further obtain the multiple regression forecast estimation model of the total annual carbon dioxide of vehicles in the blocks.
Furthermore, it is possible to propose the integration of practical deliberation case information of building permits, such as urban planning laws and the Building Act, thus, when an architect designs the development factors, or when urban planners regularly conduct overall inspections of urban planning, it is possible to easily and effectively plan and evaluate urban areas and rapidly calculate the traffic volume in the future. Moreover, after proposing the cooperation of the conversion Geographic Information System information in urban areas, it is possible to clearly obtain the basic information of the traffic volume and present a map of urban traffic environmental characteristics.
Author Contributions
The author would like to thank the Urban Development Bureau of Taichung City Government in all the building permit data. Thanks to Building Permit Management Division for their document support.
Conflicts of Interest
The authors declare no conflicts of interest.
References
- Liao, L.C. The Assessment of the Energy Saving and the Carbon Dioxide Reduction Strategies for Road Transportation Sector; Taipei University Institute of Natural Resourse and Environment Management: Taipei City, Taiwan, 2009; pp. 1–10. [Google Scholar]
- Li, S.S. Method in Estimating CO2 Emissions from Gasoline Vehicles in Taiwan. Master’s Thesis, National Cheng Kung University, Tainan, Taiwan, 2007. [Google Scholar]
- Henning, N.; Dagmar, H.; Martin, L.; Heidi, W. Environmental impact assessment of urban land use transitions—A context-sensitive approach. Land Use Policy 2009, 26, 233–248. [Google Scholar]
- Fuller, R.J.; Crawford, R.H. Impact of past and future residential housing development patterns on energy demand and related emissions. J. Hous. Built Environ. 2011, 26, 165–183. [Google Scholar] [CrossRef]
- Lin, H.T. Green Building in Hot-Humid Climate; Chan’s Arch-Publishing Co., Ltd.: Taipei City, Taiwan, 2003. [Google Scholar]
- Chang, Y.S. Life Cycle Assessment on the Reduction of Carbon Dioxide Emission of Buildings. Ph.D. Thesis, Department of Architecture, National Cheng Kung University, Tainan, Taiwan, June 2002; pp. 67–136. [Google Scholar]
- Lin, H.T. Footprint of Architecture Evaluation Theory; Chan’s Arch-Publishing Co., Ltd.: Taipei City, Taiwan, 2014; pp. 67–164. [Google Scholar]
- Gan, J.J. A Study on the Electricity Consumption Prediction Method of City Blocks. Master’s Thesis, Department of Architecture, National Cheng Kung University, Tainan, Taiwan, 2009; pp. 1–11. [Google Scholar]
- Wang, R.J. A Study on Electricity Consumption Analysis of Residential Area, Ph.D. Thesis, Department of Architecture, National Cheng Kung University, Tainan, Taiwan, May 2005; pp. 107–126. [Google Scholar]
- Po, C.S. Analysis of Energy Saving and Carbon Reduction by the Mode Choice and Trip Assignment Combined Model. Master’s Thesis, Department of Civil and Ecological Engineering, I-Shou University, Kaohsiung, Taiwan, January 2011; pp. 8–40. [Google Scholar]
- Hu, T.Y. Micro-simulation Based Dynamic Traffic Assignment. Transp. Plan. J. 2001, 30, 1–32. [Google Scholar]
- Chen, J.N. A Study of Micro-simulation Based Dynamic Traffic Assignment Model under Mixed Traffic Flow Environment: The Principle of User Equilibrium. Master’s Thesis, Department of Transportation Engineering and Management, Feng Chia University, Taichung, Taiwan, 2005; pp. 5–37. [Google Scholar]
- Wardrop, J.G. Some Theoretical Aspects of Road Traffic Research; Institution of Civil Engineers: London, UK, 1952; pp. 325–378. [Google Scholar]
- Doron, L. Land use for transport projects: Estimating land value. Land Use Policy 2015, 42, 594–601. [Google Scholar]
- Yang, A.T. Structuralized Analysis of Urban Form Impacts on Travel Demand. J. Chin. Inst. Transp. 2006, 18, 391–416. [Google Scholar]
- Jeong, Y.; Lee, G.; Kim, S. Analysis of the Relation of Local Temperature to the Natural Environment, Land Use and Land Coverage of Neighborhoods. J. Asian Archit. Build. Eng. 2015, 14, 33–40. [Google Scholar] [CrossRef]
- Dai, G.F. The Research on the Interaction between Urban Land Use and Carbon Dioxide Concentration. Master’s Thesis, Department of Urban Planning, National Cheng Kung University, Tainan, Taiwan, June 2010. [Google Scholar]
- Hopkins, A.S.; Schellnhuber, H.J.; Pomaz, V.L. Urbanised territories as a specific component of the Global Carbon Cycle. Ecol. Model. 2004, 173, 295–312. [Google Scholar] [CrossRef]
- Lin, T.P.; Lin, F.Y.; Wu, P.R. Multiscale analysis and reduction measures of urban carbon dioxide budget based on building energy consumption. Energy Build. 2017, 153, 356–367. [Google Scholar] [CrossRef]
- She, P.C. A Study of the Influence of Highway Design Factors on Vehicle Carbon Emissions in Taiwan. Master’s Thesis, Institute of Construction Engineering and Management, National Central University, Taoyuan, Taiwan, 2012; pp. 37–58. [Google Scholar]
- Heimbach, C.L.; Cribbins, P.D.; Chang, M.S. Some partial consequences of reduced traffic lane widths on urban arterials. Transp. Res. Rec. 1983, 923, 69–72. [Google Scholar]
- Chen, C.L.; Zhuang, Z.W.; Jiang, Y.H. Research energy consumption and pollution emissions by vehicle. In Proceedings of the Combustion Institute of R.O.C. 18th Symposium, Taiwan, 29 March 2008. [Google Scholar]
- Huang, Y.K.; Tsao, S.M. An analysis of carbon dioxide emissions in transportation sector. Urban Traffic Q. 2003, 18, 1–14. [Google Scholar]
- Ren, C.; Wu, E.N. Urban Climatic Map—An Information Tool for Sustainable Urban Planning; China Building Industry Publishing: Beijing, China, 2012; pp. 11–30. [Google Scholar]
- Lin, F.B. Taiwan Highway Capacity Manual; Institute of Transportation, MOTC: Taipei City, Taiwan, 2011. [Google Scholar]
- Bureau of Energy, Ministry of Economic Affairs, Industrial Technology Research Institute Printed, Vehicle fuel Consumption Guidelines, February 2010. Available online: https://www.moeaboe.gov.tw/ecw/populace/content/wfrmStatistics.aspx?type=5&menu_id=1303. (accessed on 25 December 2017).
- Jiang, M.F. Using 3D Remote Sensing Data to Analyze the CO2 Balance in Vicinity of Road-Case Study of Highway No. 84 at Taiwan. Master’s Thesis, Department of Resources Engineering, National Cheng Kung University, Tainan, Taiwan, 1999; pp. 6–31. [Google Scholar]
- Lin, H.T. Building Carbon Footprint, 2nd ed.; Chan’s Arch-Publishing Co., Ltd.: Taipei City, Taiwan, 2015. [Google Scholar]
- Chen, J.H.; Lin, H.T. The Classification Model of Energy Use Intensity Based on Building Function Types. Master’s Thesis, Department of Architecture, National Cheng Kung University, Tainan, Taiwan, June 2009. [Google Scholar]
- Huang, P.H.; Huang, S.L. Metabolism Approach for Studying the Relationship Between Urbanization and CO2 Emission and Sequestration, first edition. Master’s Thesis, National Taipei University, Taipei, Taiwan, June 2014. [Google Scholar]
Figure 1.
Location of Taichung city (Taiwan).

Figure 2.
Study case reference to the “building permit data mapping” system of the competent government building authority.
Figure 2.
Study case reference to the “building permit data mapping” system of the competent government building authority.

Figure 3.
Relational diagram of the traffic volume at the morning peak and evening peak.

Figure 4.
Relational diagram of street blocks and total traffic volume.

Figure 5.
Relational diagram of total emissions and total traffic volume.

Figure 6.
Relational diagram of applicable factors of award decrees of various floor areas.

Figure 7.
Relational diagram between the total area of an urban block and the total CO2 emissions all year round.
Figure 7.
Relational diagram between the total area of an urban block and the total CO2 emissions all year round.

Figure 8.
Relational diagram between the total floor area of buildings and the total CO2 emissions all year round.
Figure 8.
Relational diagram between the total floor area of buildings and the total CO2 emissions all year round.

Figure 9.
Relational diagram between the length of each road in the block and the amount of traveling vehicles generated in the road by three road widths.
Figure 9.
Relational diagram between the length of each road in the block and the amount of traveling vehicles generated in the road by three road widths.

Figure 10.
The distribution map of passenger car units in Taichung metropolitan area within one day.
Figure 10.
The distribution map of passenger car units in Taichung metropolitan area within one day.

Figure 11.
Amount of CO2 emissions from traffic in Taichung metropolitan area.

Figure 12.
Annual total CO2 emissions of Taichung metropolitan area.


Table 1.
Statistical for block-related factors.
| Case | The Total Area of an Urban Block (m2) | Site Area (m2) | Building Development Land Ratio (%) |
|---|---|---|---|
| 1 | 10,291.7 | 9971.5 | 96.9% |
| 2 | 16,679.2 | 11,773.1 | 70.6% |
| 3 | 13,554.5 | 10,047.6 | 74.1% |
| 4 | 9747.7 | 6145.4 | 63.0% |
| 5 | 3822.4 | 2944.5 | 77.0% |
| 6 | 16,143.3 | 14,387.3 | 89.1% |
| 7 | 6606.4 | 4843.9 | 73.3% |
| 8 | 16,400.0 | 9739.2 | 59.4% |
| 9 | 6856.0 | 6145.4 | 89.6% |
| 10 | 3522.3 | 3127.7 | 88.8% |
| 11 | 20,261.5 | 16,617.5 | 82.0% |
| 12 | 7548.9 | 7548.9 | 100.0% |
| 13 | 9813.0 | 8432.7 | 85.9% |
| 14 | 9831.8 | 3767.8 | 38.3% |
| 15 | 9264.0 | 9264.0 | 100.0% |
| 16 | 26,498.8 | 10,548.6 | 39.8% |
Table 2.
Carbon budget coefficients of buildings and green spaces.
| Land use | CO2 (kgCO2 m−2 yr−1) | References | |
|---|---|---|---|
| Building carbon dioxide emission | Residential I (House) | 15.29 | Lin [28] |
| Residential II (Apartment without elevator) | 13.09 | Lin [28] | |
| Residential III (Apartment with elevator) | 18.62 | Lin [28] | |
| Commercial | 111.33 | Lin [28] | |
| University/High school | 30.74 | Lin [28] | |
| Junior high school | 28.66 | Lin [28] | |
| Elementary school | 21.88 | Lin [28] | |
| Traffic Station | 184.96 | Lin [28] | |
| Post office/Government agencies | 63.04 | Lin [28] | |
| Stadium | 97.43 | Lin [28] | |
| Industrial area | 105.76 | Lin [28] | |
| Hospital | 136.03 | Chen [29] | |
| Religious buildings | 80.76 | Lin [28] | |
| Traditional Market | 42.71 | Chen [29] | |
| Landfill | 44.81 | Lin [28] | |
| Carbon dioxide absorption | Water | −0.02 | Lin [28] |
| Park | −2.24 | Huang [30], Lin [28] | |
| Farmland | −4.59 | Huang [30] |
Table 3.
Statistical of the total traffic volume generated and the total CO2 emissions generated by the total number of vehicles.
Table 3.
Statistical of the total traffic volume generated and the total CO2 emissions generated by the total number of vehicles.
| Case | The Total Area of an Urban Block (m2) | The Total Floor Area (m2) | The Total Traffic Volume (PCU/Day) | The Annual CO2 Emissions by the Total Vehicles (kgCO2/yr) |
|---|---|---|---|---|
| 1 | 10,291.7 | 106,516.1 | 48,015 | 699,090.5 |
| 2 | 16,679.2 | 130,662.3 | 92,276 | 1,295,753.5 |
| 3 | 13,554.5 | 75,925.2 | 48,654 | 616,086.0 |
| 4 | 9747.7 | 26,305.0 | 47,321 | 455,057.5 |
| 5 | 3822.4 | 12,675.2 | 31,922 | 215,804.7 |
| 6 | 16,143.3 | 107,978.7 | 27,933 | 395,774.9 |
| 7 | 6606.4 | 42,656.7 | 10,945 | 98,181.4 |
| 8 | 16,400.0 | 47,283.0 | 94,676 | 1,511,754.3 |
| 9 | 6856.0 | 47,341.0 | 28,063 | 249,743.9 |
| 10 | 3522.3 | 18,860.2 | 81,547 | 616,230.2 |
| 11 | 20,261.5 | 62,957.3 | 63,484 | 1,028,001.9 |
| 12 | 7548.9 | 63,631.0 | 89,963 | 854,514.5 |
| 13 | 9813.0 | 44,720.1 | 24,158 | 245,017.3 |
| 14 | 9831.8 | 16,838.6 | 45,465 | 571,277.4 |
| 15 | 9264.0 | 38,424.3 | 16,007 | 160,771.2 |
| 16 | 26,498.8 | 40,730.6 | 130,807 | 2,441,902.1 |
Table 4.
Statistical for the relation between traffic volume and building design scale in urban block.
Table 4.
Statistical for the relation between traffic volume and building design scale in urban block.
| Case | The Total Area of an Urban Block (m2) | Site Area (m2) | Building Area (m2) | The Total Floor Area (m2) | The Rewards of Building Capacity with Parking Floors Area (m2) | The Rewards of Building Capacity with Open Space Floors Area (m2) | Urban Building Capacity Transfer with Floors Area (m2) | The Annual CO2 Emissions by the Total Vehicles (kgCO2/yr) |
|---|---|---|---|---|---|---|---|---|
| 1 | 10,291.7 | 9971.53 | 5172.38 | 106,516.05 | 3566.66 | 2369.12 | 11,168.07 | 699,090.5 |
| 2 | 16,679.2 | 11,773.10 | 4905.56 | 130,662.31 | 533.33 | 7684.54 | 13,197.35 | 1,295,753.5 |
| 3 | 13,554.5 | 10,047.57 | 4631.52 | 75,925.21 | 4047.45 | 4753.48 | 6642.00 | 616,086.0 |
| 4 | 9747.7 | 6145.43 | 3503.77 | 26,305.03 | 833.33 | 1062.63 | 1928.18 | 455,057.5 |
| 5 | 3822.4 | 2944.46 | 809.45 | 12,675.17 | 433.33 | 903.44 | 1445.31 | 215,804.7 |
| 6 | 16,143.3 | 14,387.31 | 6831.72 | 107,978.68 | 1913.33 | 6401.51 | 12,615.63 | 395,774.9 |
| 7 | 6606.4 | 4843.89 | 2461.70 | 42,656.69 | 515.15 | 2320.36 | 6542.02 | 98,181.4 |
| 8 | 16,400.0 | 9739.19 | 4677.38 | 47,283.02 | 1350.00 | 2268.40 | 4203.50 | 1,511,754.3 |
| 9 | 6856.0 | 6145.35 | 2962.79 | 47,340.98 | 250.00 | 2470.84 | 4039.36 | 249,743.9 |
| 10 | 3522.3 | 3127.67 | 1510.91 | 18,860.16 | 0 | 483.23 | 1570.45 | 616,230.2 |
| 11 | 20,261.5 | 16,617.52 | 7571.38 | 62,957.32 | 2120.00 | 2115.73 | 4004.74 | 1,028,001.9 |
| 12 | 7548.9 | 7548.92 | 4252.06 | 63,631.02 | 0 | 2298.50 | 6895.75 | 854,514.5 |
| 13 | 9813.0 | 8432.73 | 4366.38 | 44,720.06 | 406.67 | 1115.10 | 2750.15 | 245,017.3 |
| 14 | 9831.8 | 3767.80 | 1706.17 | 16,838.64 | 0 | 571.17 | 1705.20 | 571,277.4 |
| 15 | 9264.0 | 9263.96 | 4527.37 | 38,424.30 | 963.33 | 2676.77 | 1255.83 | 160,771.2 |
| 16 | 26,498.8 | 10,548.63 | 4741.82 | 40,730.55 | 0 | 0 | 0 | 2,441,902.1 |
© 2018 by the authors. Licensee MDPI, Basel, Switzerland. This article is an open access article distributed under the terms and conditions of the Creative Commons Attribution (CC BY) license (http://creativecommons.org/licenses/by/4.0/).
Share and Cite
MDPI and ACS Style
Chang, C.-T.; Lin, T.-P. Estimation of Carbon Dioxide Emissions Generated by Building and Traffic in Taichung City. Sustainability 2018, 10, 112. https://doi.org/10.3390/su10010112
AMA Style
Chang C-T, Lin T-P. Estimation of Carbon Dioxide Emissions Generated by Building and Traffic in Taichung City. Sustainability. 2018; 10(1):112. https://doi.org/10.3390/su10010112
Chicago/Turabian StyleChang, Chou-Tsang, and Tzu-Ping Lin. 2018. "Estimation of Carbon Dioxide Emissions Generated by Building and Traffic in Taichung City" Sustainability 10, no. 1: 112. https://doi.org/10.3390/su10010112
Note that from the first issue of 2016, this journal uses article numbers instead of page numbers. See further details here.