Article

Can Phosphate Salts Recovered from Manure Replace Conventional Phosphate Fertilizer?

1
Department of Biobased Products and Energy Crops, Institute of Crop Science, University of Hohenheim, Fruwirthstr. 23, 70599 Stuttgart, Germany
2
Department of Fertilization and Soil Matter Dynamics, Institute of Crop Science, University of Hohenheim, Fruwirthstr. 20, 70599 Stuttgart, Germany
3
Fraunhofer Institute for Interfacial Engineering and Biotechnology IGB, Nobelstr. 12, 70569 Stuttgart, Germany
*
Author to whom correspondence should be addressed.
Agriculture 2017, 7(1), 1; https://doi.org/10.3390/agriculture7010001
Submission received: 16 November 2016 / Revised: 12 December 2016 / Accepted: 16 December 2016 / Published: 7 January 2017
(This article belongs to the Special Issue Enhancing Fertilizer-Use Efficiency in Organic Cropping Systems)

Abstract

:
Pig farming produces more manure than can reasonably be spread onto surrounding fields, particularly in regions with high livestock densities and limited land availability. Nutrient recycling offers an attractive solution for dealing with manure excesses and is one main objective of the European commission-funded project “BioEcoSIM”. Phosphate salts (“P-Salt”) were recovered from the separated liquid manure fraction. The solid fraction was dried and carbonized to biochar. This study compared the fertilizing performance of P-Salt and conventional phosphate fertilizer and determined whether additional biochar application further increased biomass yields. The fertilizers and biochar were tested in pot experiments with spring barley and faba beans using two nutrient-poor soils. The crops were fertilized with P-Salt at three levels and biochar in two concentrations. Biomass yield was determined after six weeks. Plant and soil samples were analysed for nitrogen, phosphorus and potassium contents. The P-Salt had similar or even better effects than mineral fertilizer on growth in both crops and soils. Slow release of nutrients can prevent leaching, rendering P-Salt a particularly suitable fertilizer for light sandy soils. Biochar can enhance its fertilizing effect, but the underlying mechanisms need further investigation. These novel products are concluded to be promising candidates for efficient fertilization strategies.

1. Introduction

European agriculture is currently facing the problem of the accumulation of large amounts of slurry and manure, particularly in regions with high livestock densities, for example northwest Germany, Flanders and the Netherlands. Slurry and manure contain considerable amounts of important plant nutrients, including phosphorus (P) and nitrogen (N). It has been estimated that if the Netherlands applied its manure up to the allowed amount of phosphate on all its agricultural land, in 2015 there would have still been excess manure containing 40–60 million kg of phosphate [1]. Dealing with these manure and nutrient excesses is becoming an increasingly urgent challenge, and is heightened by the trend towards larger farm sizes as a consequence of increasing economic pressure. Manure storage is not only cost-intensive but is also associated with nutrient losses [2], leading to environmental problems such as air pollution (gaseous N emissions in the form of ammonia and nitrous oxide) and groundwater contamination (nitrate leaching).
Today, large livestock producers often buy a substantial proportion of their animal feed instead of growing it on their own farm. Most protein feed used in Europe, for example, is soybean meal, which has to be imported from South America. Farmers are no longer limited by regional feed supply and availability of arable land. Nutrients are imported along with the feed and remain in surplus on the farm within the manure. The livestock farms have too small a land area for the environmentally friendly field application of the accumulating nutrient load without exceeding the legal limits set by the European Union (EU) Nitrates Directive [3] and the EU Water Framework Directive [4]. Consequently, manure is considered a waste rather than a valuable resource. The situation is aggravated by the lack of regionally available, environmentally sound manure treatment solutions and the high costs of storage and disposal. As an example, Dutch farmers pay between €5 and €20 per tonne for the transport of surplus manure to other locations within the Netherlands [5] or even abroad.
By contrast, in other regions nutrients are needed—for example, at sites where arable farming is predominant and animal feed is produced for export. However, the high water content (>90%, [6]) makes long-distance transportation of manure neither profitable nor ecological. As a consequence, soil organic matter contents are depleted at these sites and nutrient deficits replaced through synthetic (N) or mineral (P, and potassium, K) fertilizers [7], which considerably interferes with the global P cycle [8].
Synthetic N fertilizers are mainly produced through the Haber–Bosch process. This process uses N from the air (thus unlimited in availability), but also consumes high amounts of natural gas and energy [9]. In contrast, mineral fertilizers are mainly derived from fossil resources and are, as such, limited. This is especially true for fossil P sources.
As a vital component of DNA and ATP, P is essential for all living organisms. Thus, it is one of the main nutrients needed for crop nutrition. The goal of achieving food security for a growing world population, the increasing use of biomass for biofuel production and the progressive degradation of arable land have all led to P fertilizer becoming more important for agricultural production than ever before.
In 2013/14, annual phosphate fertilizer consumption in Germany was 284,000 t [10]. In 2011, total EU phosphate consumption (fertilizer and industrial use) stood at approx. 4.6 million t per year. This represents 10% of global phosphate demand [11].
Phosphate fertilizer used in agriculture is mainly produced from rock phosphate (RP). However, RP is a finite resource, as with all mined resources. For this reason, in 2014, the EC added it to the list of critical raw materials [11]. Contrary to assertions in previous studies, there are still sufficient supplies of RP, but its extraction is very complex and not (yet) economically viable [12]. In addition, mined RP is increasingly contaminated by uranium and cadmium [13]. As 82% of the phosphorus extracted is used for fertilizers, these pollutants end up in the environment [11].
For this reason, prudent management of available P resources is of paramount importance. Exploiting “fresh” RP resources is one option. Another is the recycling of already “exploited” P, for example from livestock manure.
Livestock manure contains highly plant-available forms of P (inorganic) and N (ammonium) [14]. As such, it is a valuable organic fertilizer and a promising resource for P and N recovery. The manure excreted in EU-27 every year contains 1.8 million t of P, which corresponds to 150% of the amount of P used annually in fertilizers in Europe [2]. Thus, P recovery from manure could theoretically more than meet the entire demand for P fertilizer in Europe—providing the fertilizing effect of the recovered product is comparable.
The EC-funded research project “BioEcoSIM” (“An innovative bio-economy solution to valorise livestock manure into a range of stabilised soil improving materials for environmental sustainability and economic benefit for European agriculture”; grant No. 308637) has succeeded in developing an innovative technology at pilot-scale to recover P and N from pig manure. In a first step, manure is pretreated, so that the P completely dissolves. Subsequently, the manure is separated into a solid and a liquid fraction. The solid fraction is dried and then pyrolyzed to biochar. The P is recovered from the liquid fraction by precipitation and filtered off as a mixture of calcium phosphate (hydroxyapatite), magnesium phosphate and magnesium ammonium phosphate (MAP, struvite). The raw manure contains sufficient magnesium (1.7% dry matter) to allow struvite formation; no additional magnesium source is necessary. In this study, the obtained product is referred to as phosphate salts or “P-Salt”.
This innovative technology has several advantages. It contributes to an environmentally friendly solution to the problem of manure disposal. It addresses the unfavourable nutrient ratio of manure, which often leads to an oversupply of P, as the amount of manure used in fertilization is usually calculated based solely on its N content. This also avoids the accompanying negative environmental consequences, such as P accumulation in soil, surface runoff and eutrophication of waterbodies. As the nutrients P and N are recovered separately, they can be used to create customized fertilizers as transportable and marketable products. This allows the fertilization of crops according to their respective requirements and the balancing of disrupted nutrient cycles. The technology could also reduce the EU’s dependency on P imports. The improvement in P-use efficiency could help to conserve fossil P resources and reduce energy consumption in mining.
Struvite has been shown to be a highly effective, slow-releasing P fertilizer [15,16]. Several studies have found that struvite recovered from different materials can improve the yields of various crops compared to untreated controls [17,18,19]. Struvite recovered from swine wastewater has been shown to increase the biomass yield of maize more than commercial P fertilizer [20].
However, the plant availability of P in recovered products is often low, or at least unpredictable [21]. The assessment of fertilizers based on analytical results alone is not sufficient, because the predicted and actual availability and uptake of P by plants can differ substantially. Johnston and Richards [22] as well as Römer [23] confirmed that some P fertilizers ensure relatively good P availability and supply despite the small amounts contained in water-soluble form. Cabeza et al. [17] concluded that the dissolution of P in soil is a much more accurate indicator of the fertilizing effectiveness of recycled P products than their solubility in water or citric acid. Thus, plant experiments are crucial to evaluate the actual efficacy of the P-Salt in terms of P-fertilizing performance.
Biochar is produced from the solid manure fraction in the BioEcoSIM process and can serve as a potential soil improver. Biochar made from different substrates was reported to have beneficial effects on crop yield, soil quality and soil biological activity [24]. It can be used as an amendment to increase the water and nutrient retention capacity of light soils [25,26], thus aiding the sustainable production of food, feed and energy crops on progressively degrading soils—one measure to help meet the demand of an increasing world population. It also functioned as a means of carbon sequestration in soil [27,28] and has been shown to contribute to the mitigation of greenhouse gas emissions [29,30]. However, the use of biochar as a soil-improving substance is controversial and some studies have found biochar application to have no effect or even adverse effects on crop yield [31,32]. A meta-analysis review concluded that biochar application had a small, but statistically significant influence on crop productivity [33]. In this study, the biochar produced is used together with the recovered P-Salt, underlining the integrated concept of the project.
The combined application of P-Salt and biochar recovered from the same material has not been tested before. Based on results from the use of biochar in combination with conventional fertilizer [34,35,36], we assume that biochar prevents the leaching of nutrients contained in the P-Salt and increases crop yield. Biochar application may promote root development [37] through improved soil structure, resulting in more efficient nutrient uptake from the P-Salt and thus better crop development [38].
There are only a few studies [15,39,40] on the use of P fertilizer recovered from pig manure that used a comparable technique and none of these tested and compared its fertilizing effect on different crop types.
For that reason, this study aimed to test the fertilizing effect of the manure-based P-Salt on two crop types and assess its competitiveness with conventional superphosphate. A further objective was to determine whether the combined application of P-Salt and biochar improves the fertilizing effect through synergy effects. A third objective was to assess whether there are differences in the uptake efficiency of recovered and synthetic nutrients between different crop types.
Based on these objectives, the following hypotheses were set up for the study:
  • P-Salts recovered as struvite from pig manure work equally well as or better than mineral P fertilizer.
  • There is a synergetic effect/an interaction between P-Salt and biochar application with regard to improved soil productivity and biomass yield.
  • Different crop types (cereals/legumes) react differently to P-Salt treatment, and this is also influenced by soil.
These hypotheses were tested by means of pot experiments with spring barley and faba beans. However, an important prerequisite for the use of novel products (in this case P-Salt and biochar) as fertilizers is that they do not have any undesirable effects on plants or soil biota. For this reason, a comprehensive chemical analysis and two bioassays were carried out on the products prior to the pot experiments.

2. Materials and Methods

The experimental part of this study included (1) the comprehensive determination of the chemical composition of P-Salt and biochar; (2) two bioassays to detect any eco-toxic effects on seed germination and crop development; and (3) two pot experiments to assess the fertilizing and soil-improving performance of the products.
This three-stage approach enabled detection of both desired and undesired impacts of the products on plants and soil biota at an early stage of the research project and, if necessary, the adaptation of the production process towards ecologically sound fertilizer products. Manure does not usually contain excessive amounts of problematic substances, such as heavy metals or organic pollutants. The bioassays were performed to determine whether these contaminants are concentrated in the products during the recovery process and to ensure that they do not affect crops.

2.1. Chemical Characterization

The P-Salt used in this study is a complex of struvite, magnesium phosphate and calcium phosphate obtained via the BioEcoSIM process. Pig manure was collected at a farm in Kupferzell (Germany). It was acidified with sulfuric acid to pH 5 and subsequently separated by coarse filtration into a solid and a liquid fraction. The solid fraction was dried and pyrolyzed in a superheated steam atmosphere (45 min at 450 °C). The P-Salt was recovered from the liquid manure fraction by precipitation and then filtered off. It serves as a potential source of P, but also contains N (Table 1). Contents of additional macro- and micronutrients as well as heavy metals are provided in Table A1.

2.2. Toxicity Studies

Preliminary testing in petri dishes showed the germination capacity of barley to be 98% and that of faba beans to be 100%.
Two bioassays were then carried out on the P-Salt and biochar to detect any inhibiting effects on seed germination and early crop growth (Table 2 and Table 3). Both tests employed a direct exposure approach. The P-Salt and biochar were applied to cress and barley at five different levels. The P-Salt applications ranged from 50% to 200% of the optimal P supply (=100%) of 150 mg P per kg substrate. The biochar application rates were calculated based on mass percentage of the cultivation substrate, not nutrient content. Both products were mixed with the substrate and filled into pots. The cress seeds were sown on top of the substrate and lightly covered. The barley seeds were sown at a depth of approximately 1 cm. The pots for the germination test were placed in a climate chamber and taken out regularly to count the number of germinated seeds. The pots for the growth test were placed on tables in a greenhouse. At the end of the test, the crops were cut 0.5 cm above the soil surface, weighed and dried at 60 °C for 48 h. Dry weight was determined and dry matter content calculated.

2.3. Pot Experiments

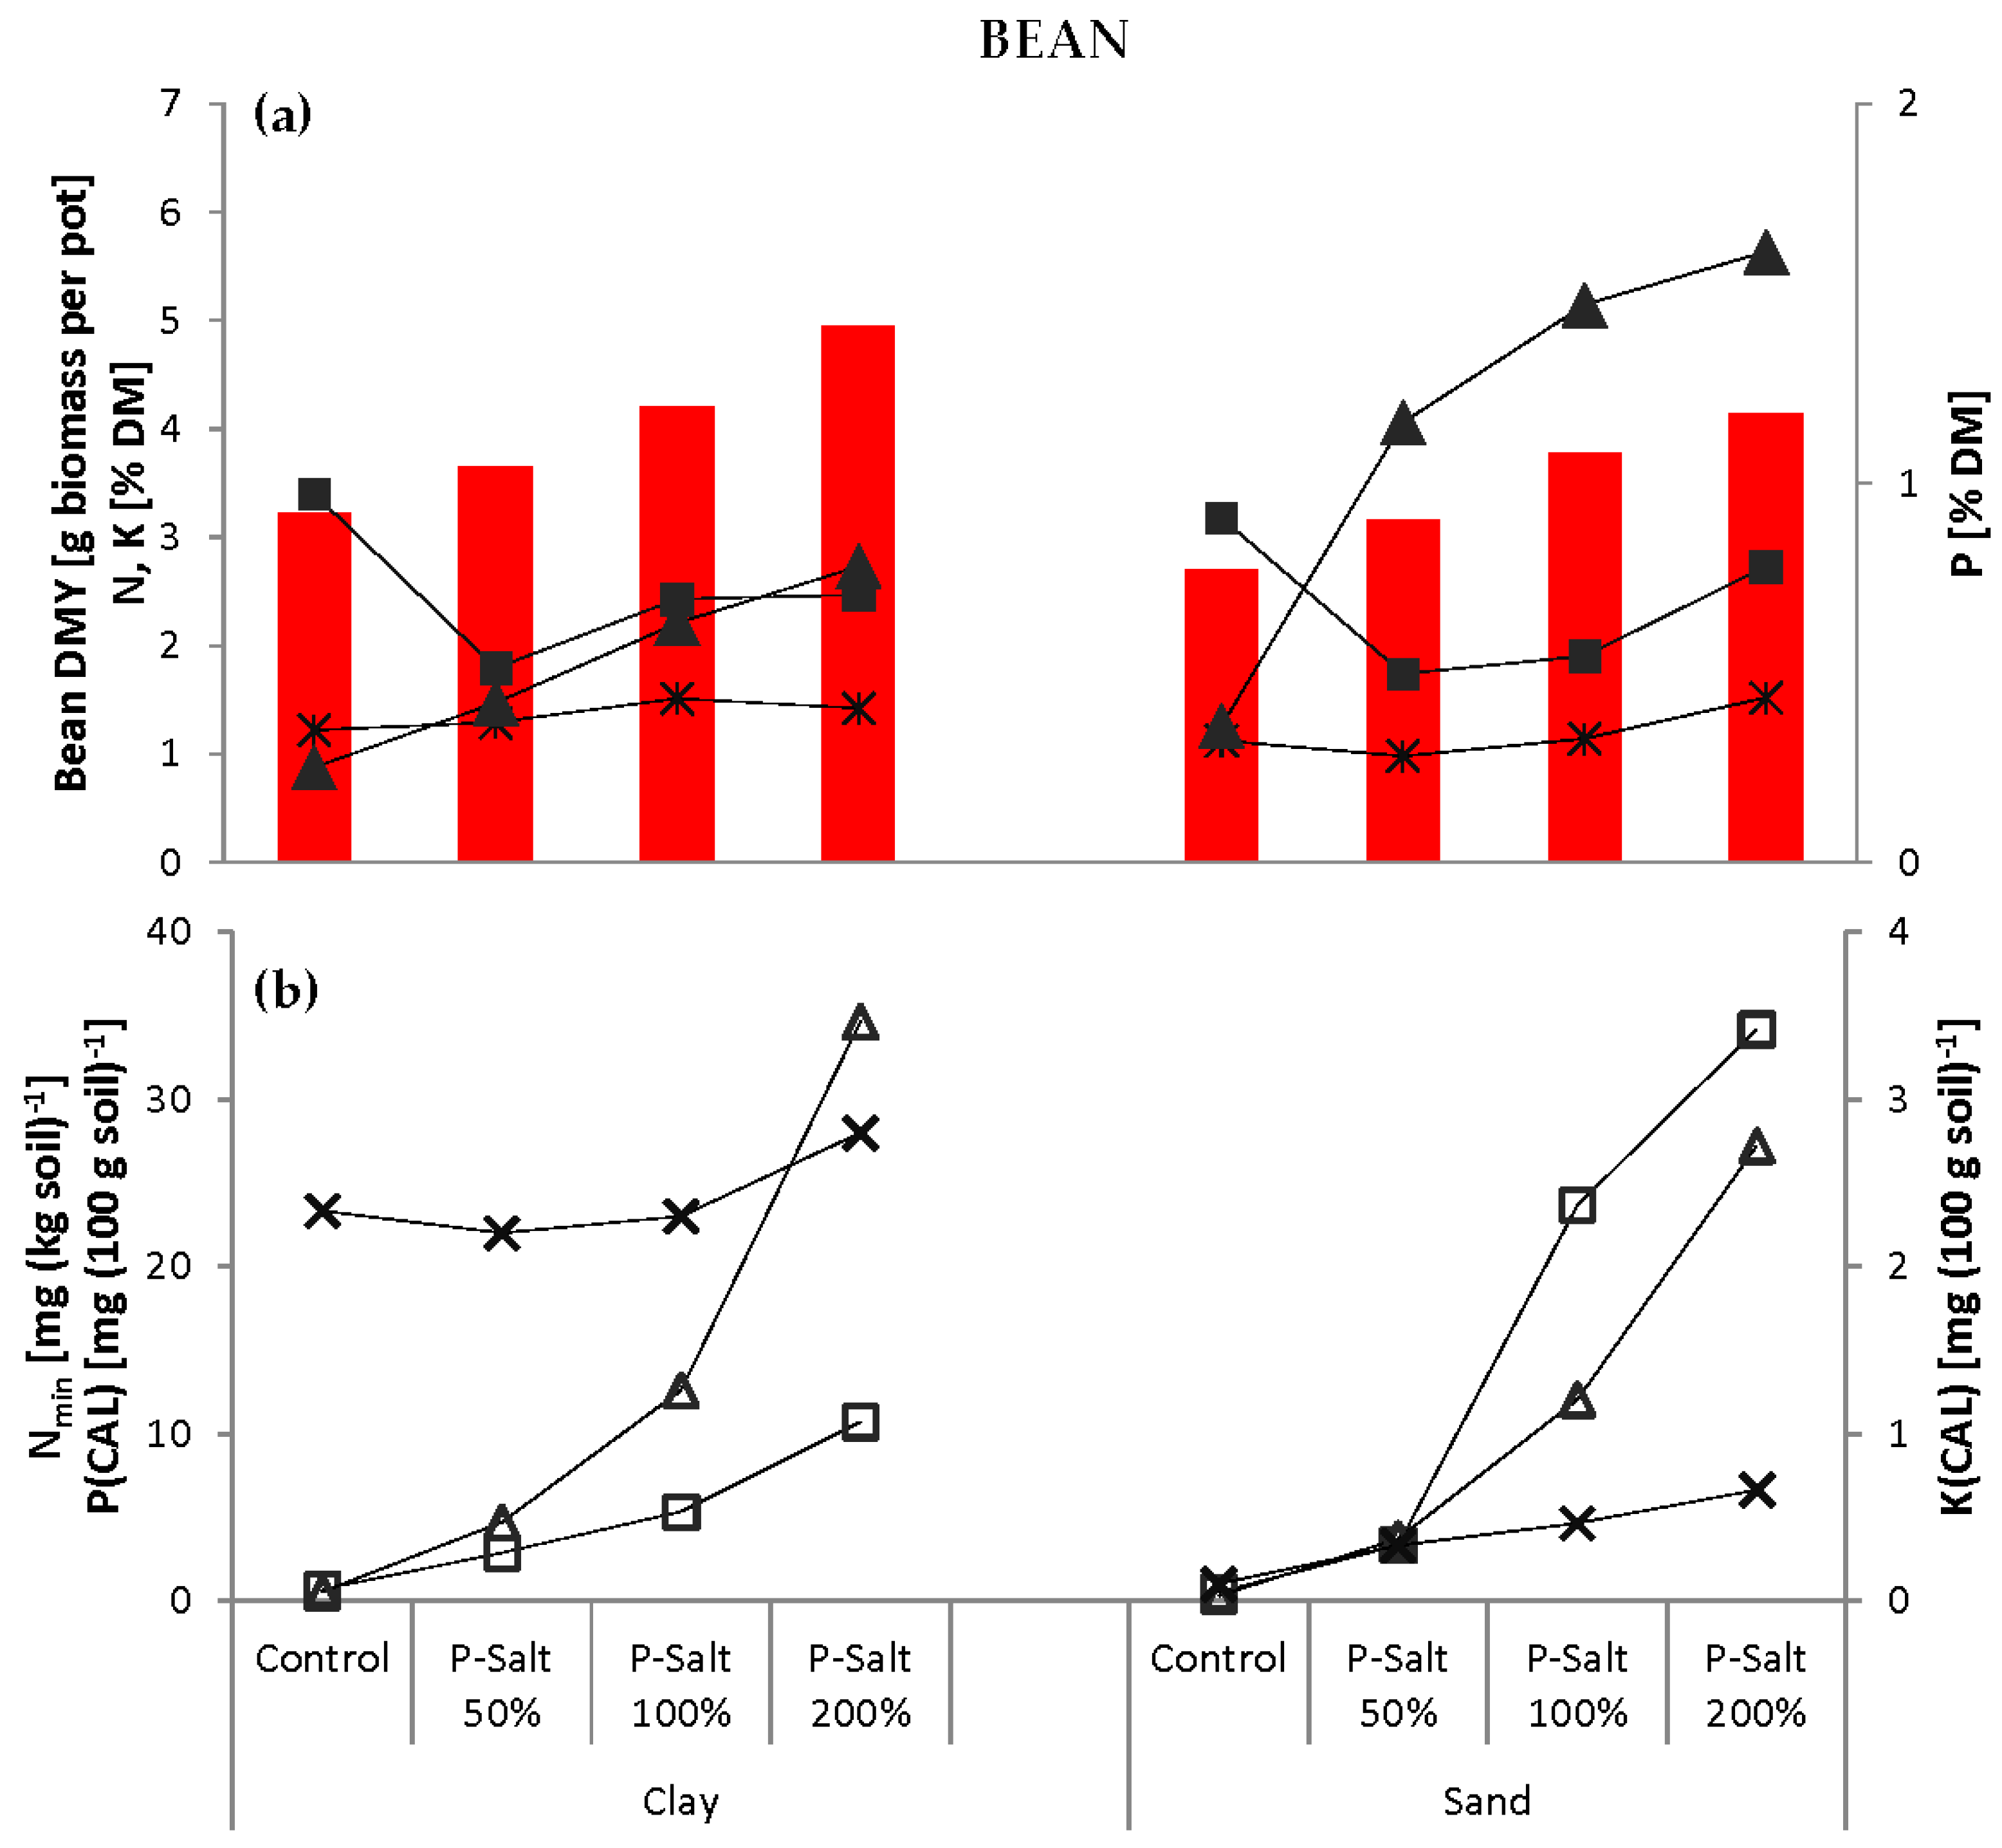
The pot experiments were carried out using two soil substrates. Clay and sand were chosen due to their low concentration and plant availability of P. The P content measured by calcium-acetate-lactate extraction (P(CAL)) in both soils is classified as very low according to Association of German Agricultural Analytic and Research Institutes (VDLUFA, Table 4). Additionally, the clay soil had a high phosphate immobilization potential due to a high concentration of carbonates. The N mineralization potential was low in both soils. Both soils were of low fertility and thus not representative of agricultural soils. The clay soil had good water retention properties, but became very hard when dry and warmed only slowly. The sand soil had zero water retention capacity; water immediately flowed to the bottom of the pots.
The two soils were mixed with varying amounts of P-Salt, P-Salt in combination with biochar or conventional fertilizer (Table 5). The application rates of the P-Salt were calculated based on its total P content. Optimal P supply was defined as 150 mg total P per kg·soil [41], i.e., 0.225 g P or 4.5 g P-Salt pot−1, and is referred to as 100%. A reduced dose (50%) to simulate nutrient shortage and an elevated dose (200%) were included. Levels higher than 200% were not considered reasonable and thus not tested.
The performance of the P-Salt was compared to conventional mineral fertilization with ammonium nitrate NH4NO3 (35% N) and calcium dihydrogen phosphate Ca(H2PO4)2, (24.6% P). Mineral N and P were applied in the same amount as in the P-Salt (Table 5). Other main plant nutrients (K, Mg, Ca) and trace elements were not considered in this experiment.
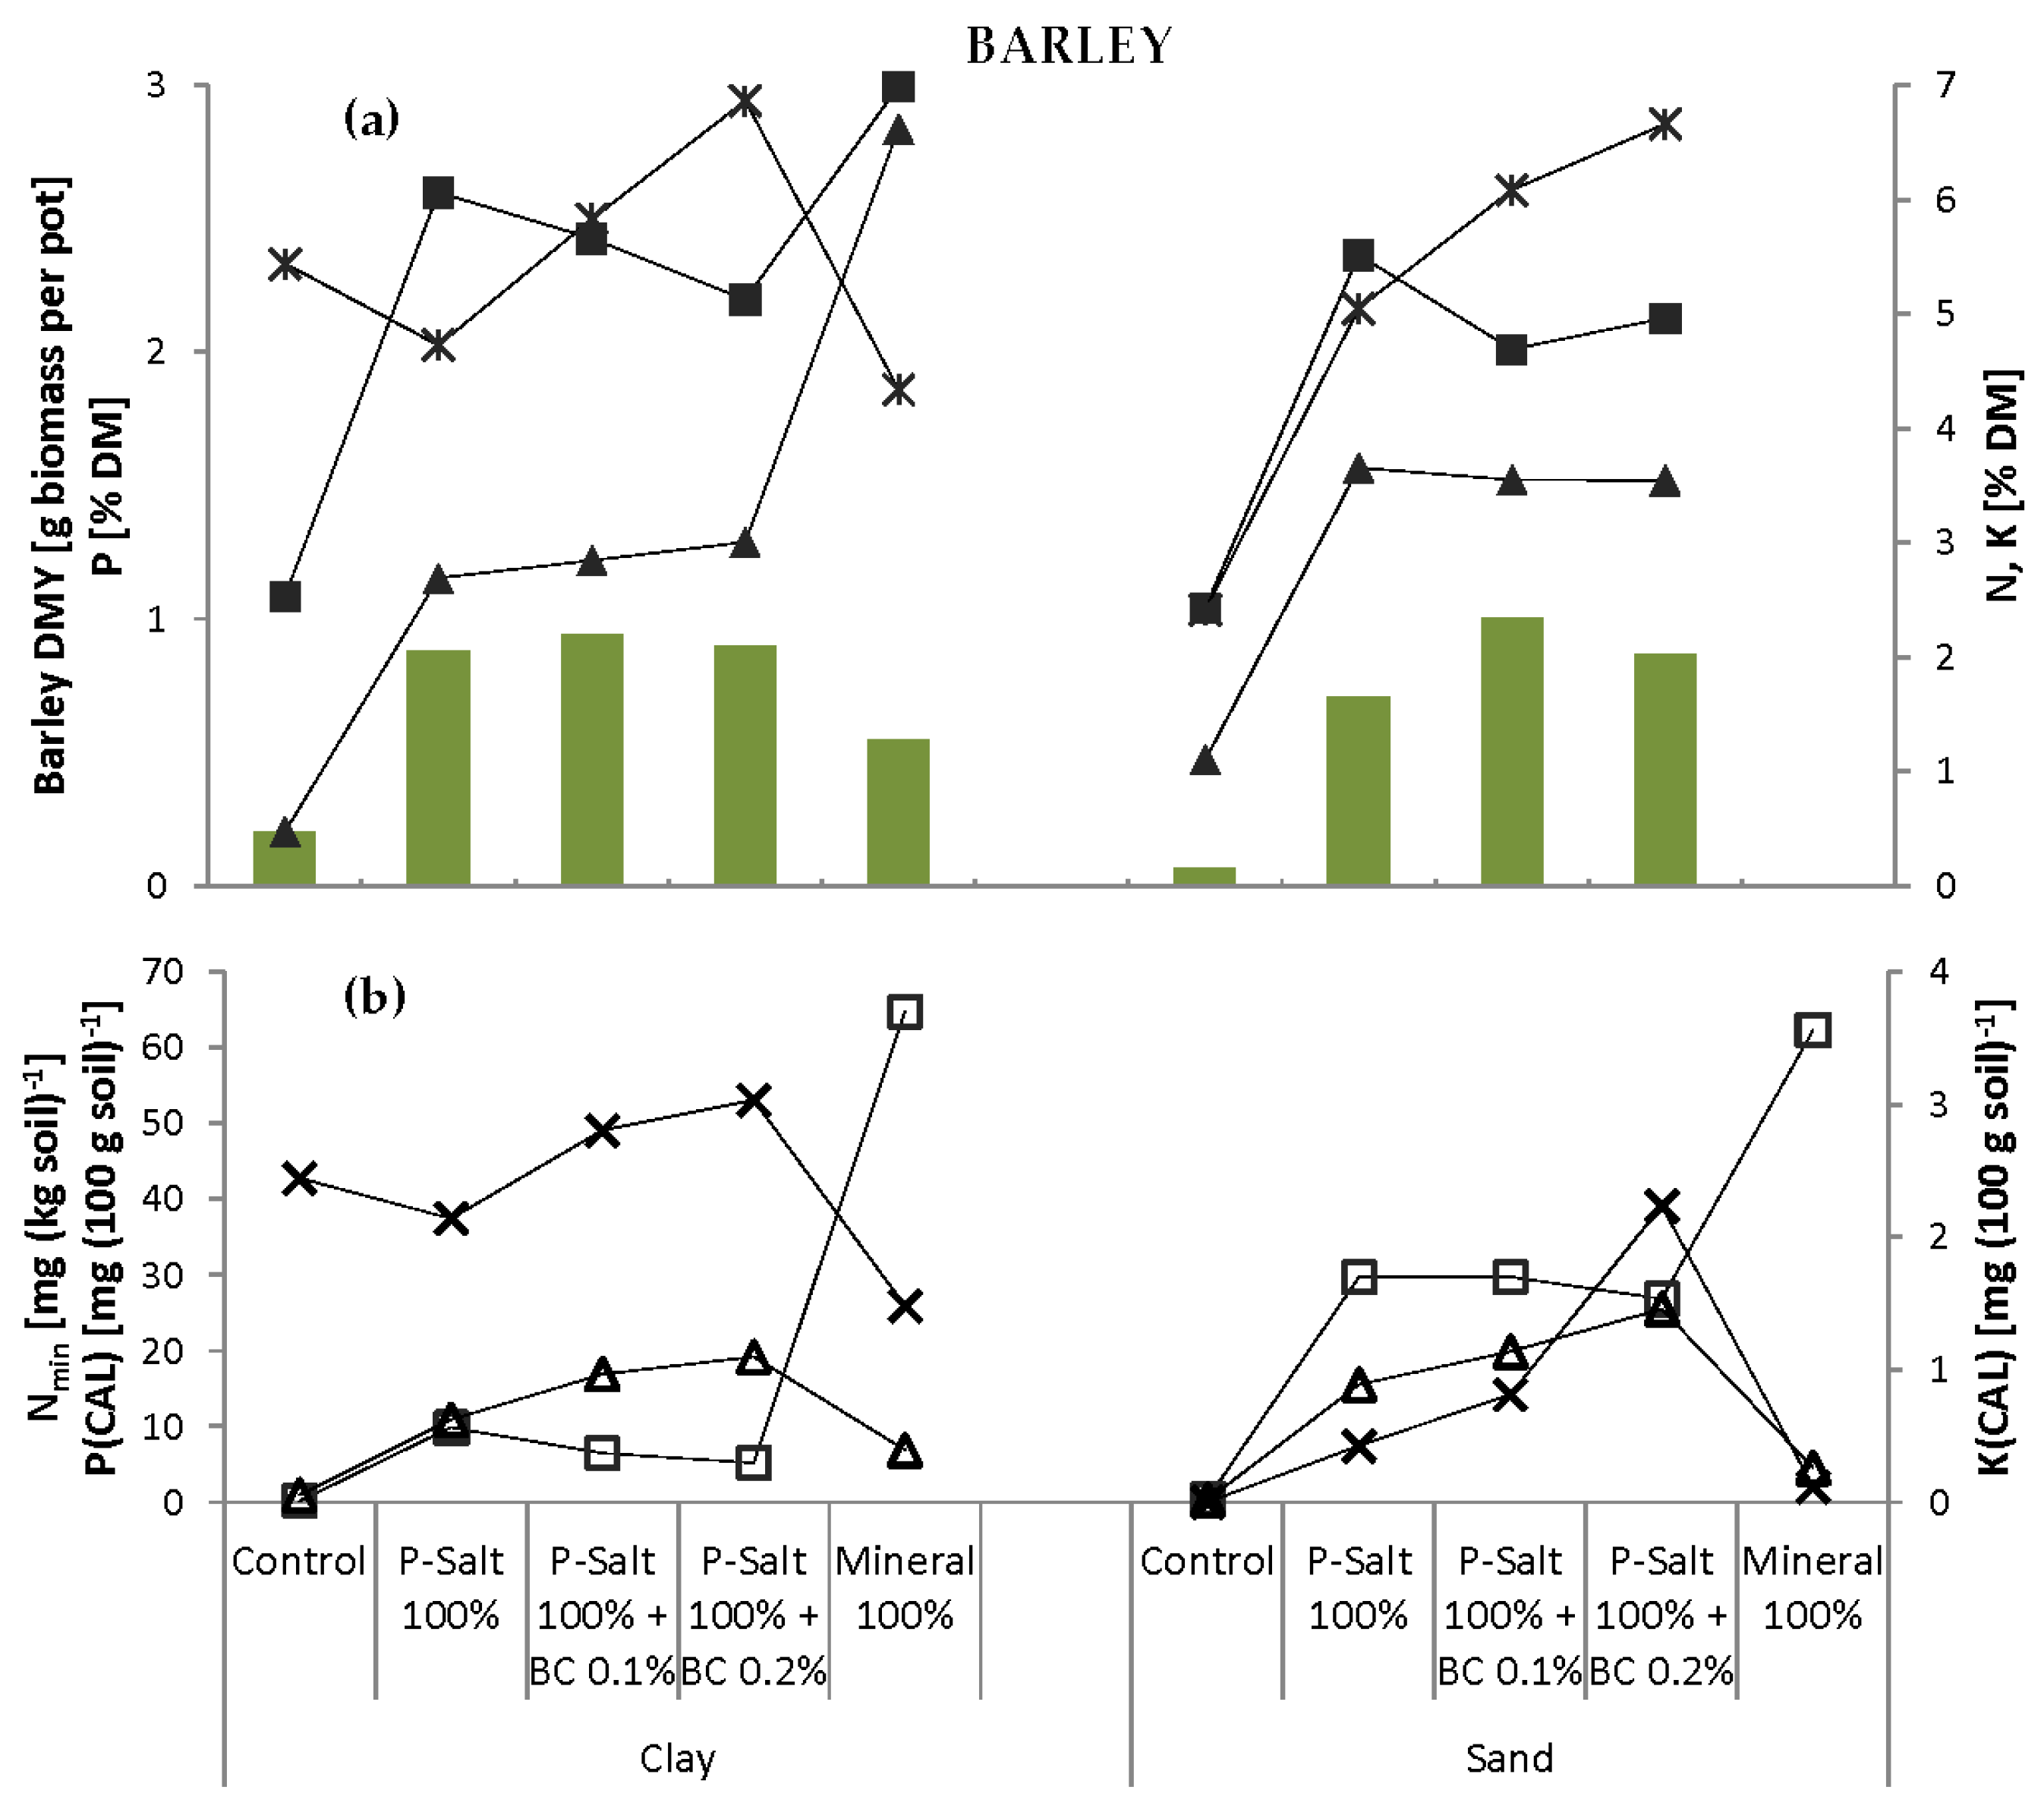
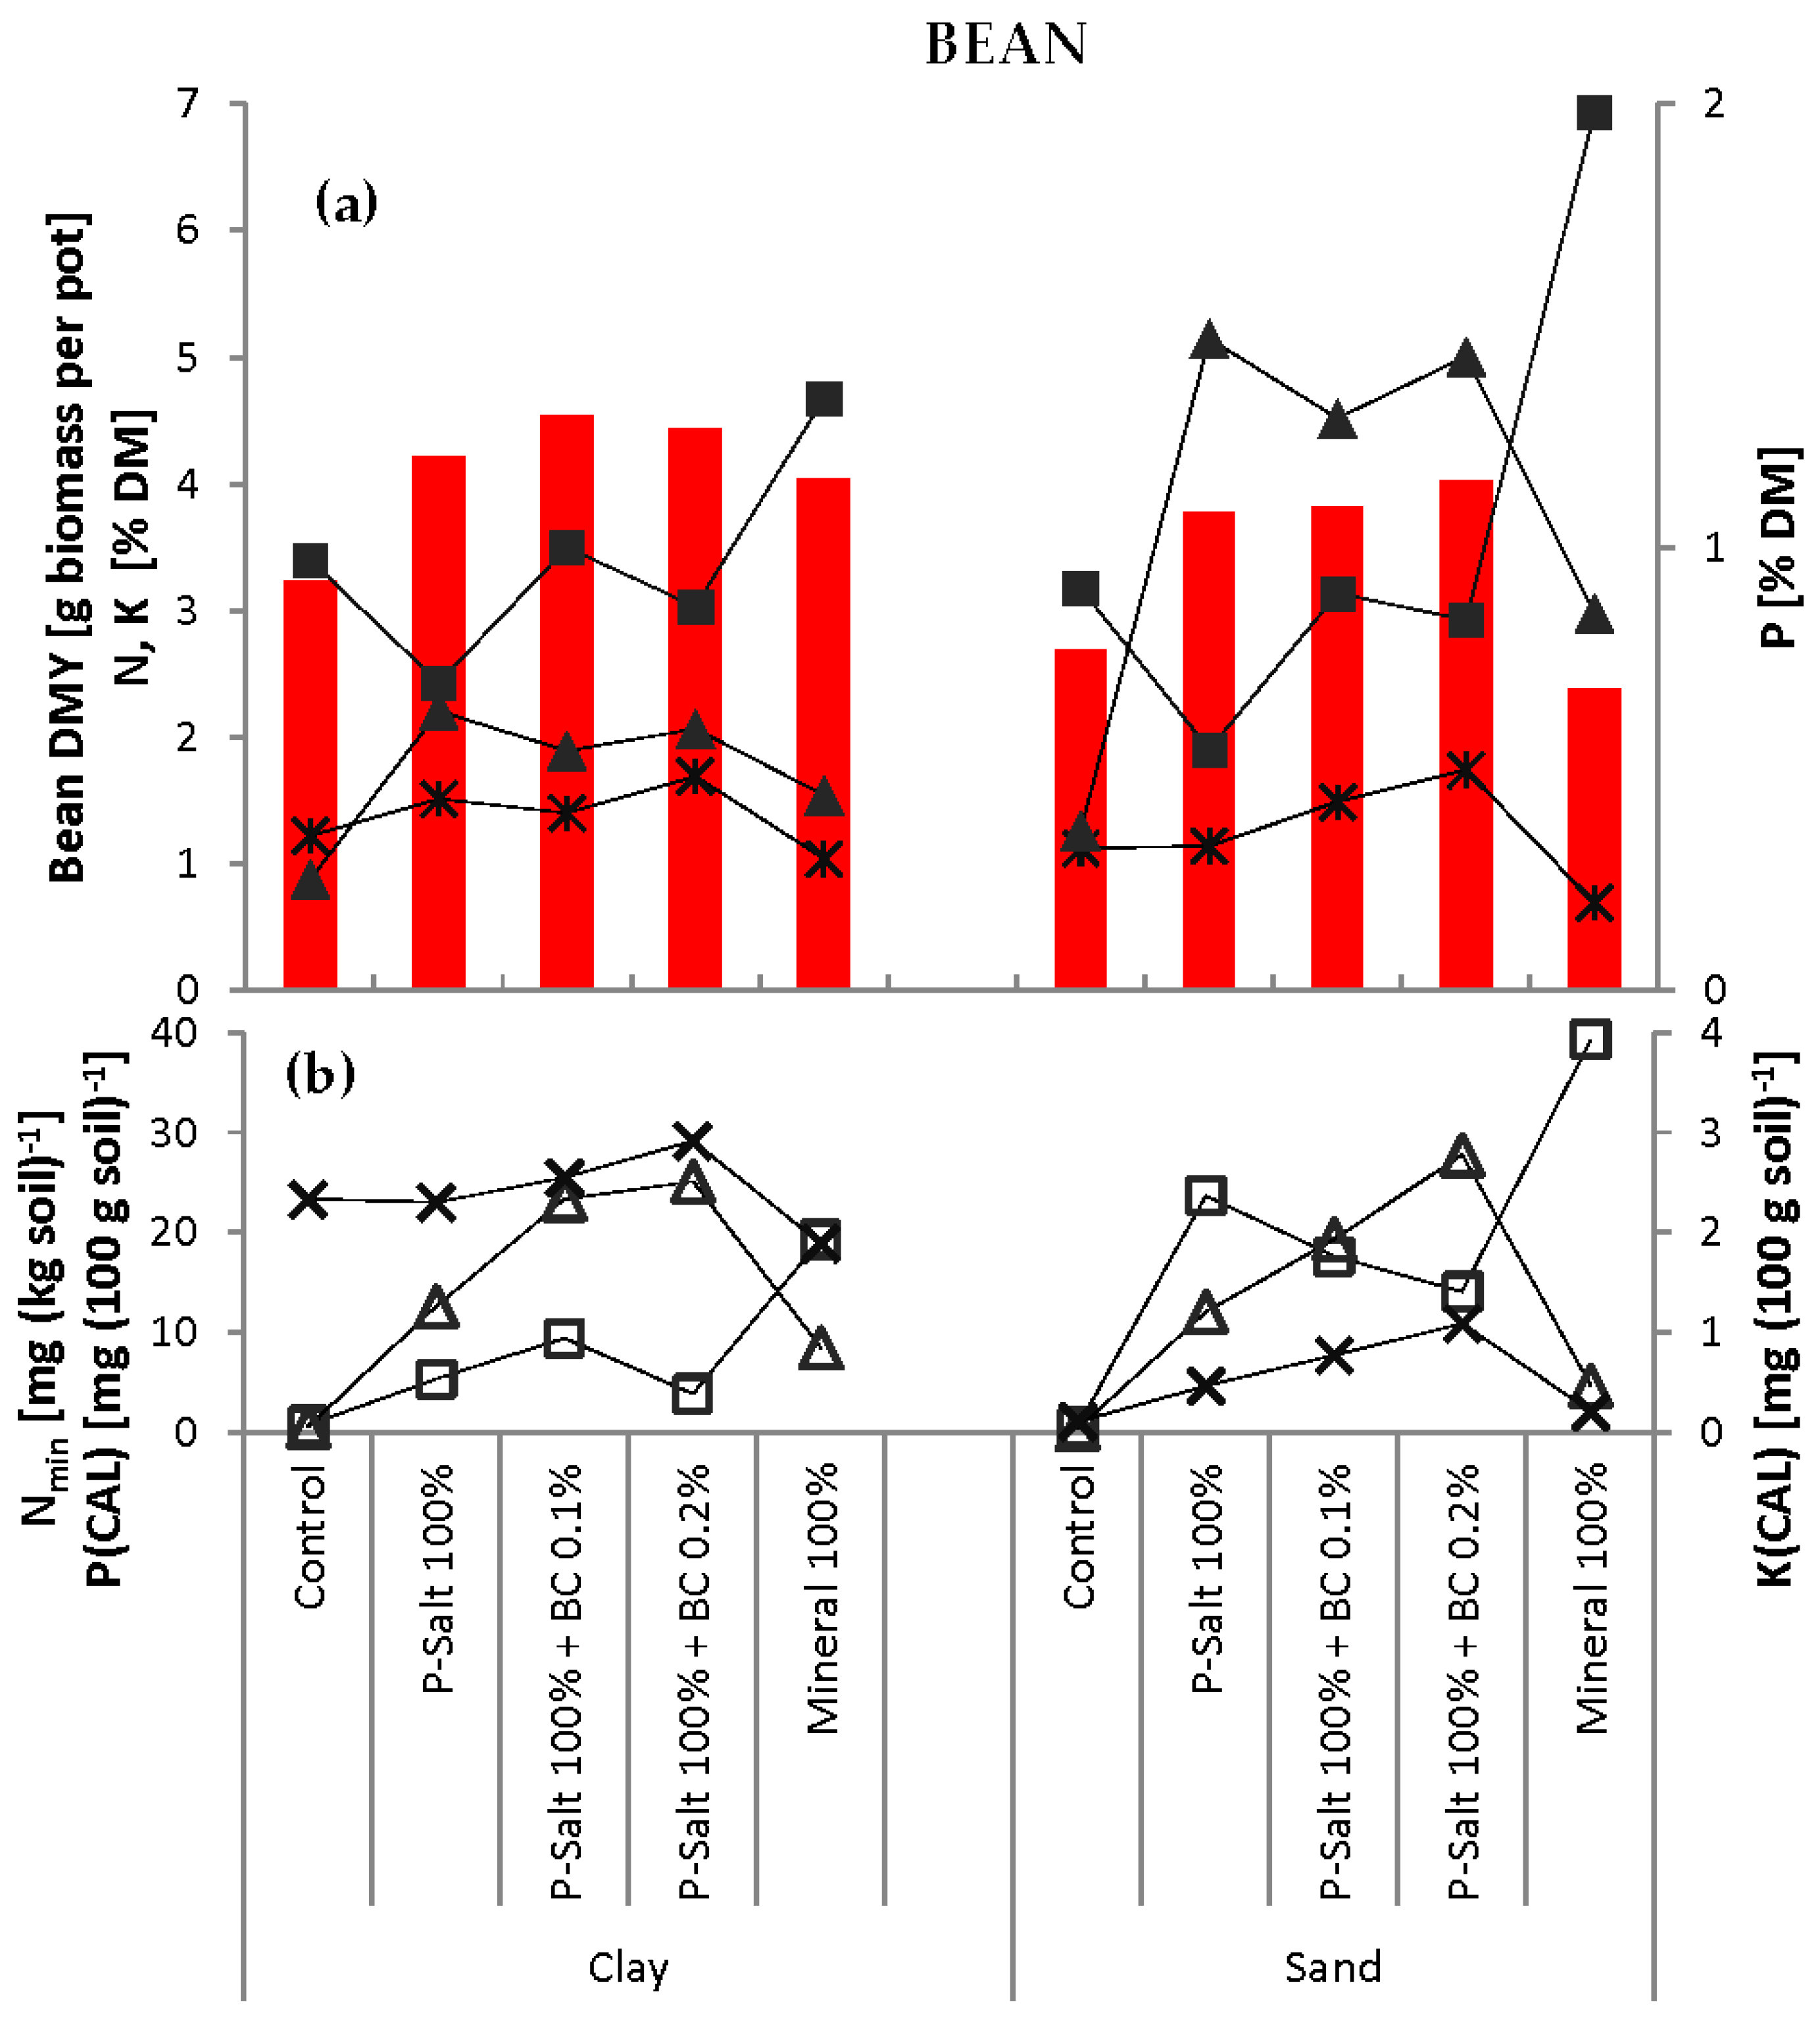
Biochar (BC) was applied in two concentrations (0.1% and 0.2%, equivalent to 1.5 and 3.0 g·pot−1) in combination with the 100% level of P-Salt (Table 5). The experiment also included control pots that remained completely unfertilized. The pot experiments were carried out first with barley, then with faba beans, and with both soils for each test crop.
The required amounts of P-Salt and biochar were mixed thoroughly with 1.5 kg·soil and filled into polypropylene pots (13 × 13 × 13 cm3, Goettinger). The conventional fertilizers (analytical grade NH4NO3 and Ca(H2PO4)2) were dissolved in water to ensure exact dosage of the small amounts and then added to the soil. Pots were initially watered with 300 mL deionized water each.
The prepared pots were sown with either ten seeds of spring barley (Hordeum vulgare L. var. ‘Grace’) or eight seeds of faba bean (Vicia faba L. var. minor var. ‘Isabell’). All pots were set up on a table in a greenhouse with no additional lighting in a randomized complete block design with four replications. After germination, plants were reduced to five per pot. The pots were watered from above with deionized water when necessary to keep the moisture near field capacity. Any leachates were collected and returned to the pots. Air temperature in the greenhouse was approx. 20 °C during the day and 16 °C at night.
The barley plants were treated once against powdery mildew with a combination of propiconazol, tebuconazol and fenpropidin. The bean plants were sprayed once against black bean aphids with Lambda-Cyhalothrin. Both treatments were carried out according to the manufacturer’s (Syngenta Agro GmbH, Maintal, Germany) instructions for the respective crop.
After six weeks (barley BBCH 29/31, faba beans BBCH 39/51), the shoots were cut 0.5 cm above the soil surface, weighed and then dried at 60 °C for 48 h. Dry weight was determined and dry matter content calculated. Soil samples were taken from each individual pot. Roots were washed and dried at 60 °C for 48 h to determine the root dry weight.

2.4. Sample Analyses

The dried shoots were ground in a mixer mill (duration 40 s, frequency 30 min−1; Retsch GmbH, Haan, Germany). Total N concentration in the biomass was determined according to Dumas (DIN EN 13654-2). Concentrations of P, K, Ca and Mg were determined using microwave digestion followed by ICP-OES measurement (DIN EN ISO 11885). All samples were analysed in duplicate. Plant P uptake was calculated from dry matter yield (DMY) and P concentration.
The soil samples were used to determine plant-available N (NO3 and NH4; referred to as Nmin) in fresh soil using CaCl2 extraction followed by FIA (Flow injection analysis) measurement (DIN ISO 14255:1998-11). Plant-available P and K were then determined in air-dried soil using CAL extraction followed by flame photometer or FIA measurement, respectively (OENORM L 1087:2012-12-01). Soil pH was measured using a glass electrode after CaCl2 extraction (DIN ISO 10390:2005).

2.5. Statistical Analysis

Data analysis was performed using SAS software version 9.3 PROC MIXED (SAS Institute Inc., Cary, NC, USA). Soil and treatment as well as their interaction were handled as fixed effects with DMY and nutrients in plant and soil samples as dependent variables. Data were log transformed where necessary. The graphs shown here were plotted with untransformed data. As large differences in biomass development were expected for the two soils, the treatments were compared separately for each soil. The level of significance was α = 0.05. Standard errors (SE) given in tables were calculated as pooled standard error of the mean.

3. Results

3.1. Toxicity Studies

The growth and germination tests with biochar gave somewhat contradictory results (Table 6 and Table 7). In summary, neither P-Salt nor biochar exposed any major risks to soil, crops or environment in terms of their chemical composition and resulting characteristics, as long as the amounts applied are in line with common fertilizing practice.

3.2. Pot Experiments

3.2.1. Effect of Increasing P-Salt Doses on Biomass Yield and Nutrient Concentrations

All P-Salt treatments led to an increase in DMY in both crops (Figure 1 and Figure 2). In barley, this increase was significant even from the moderate 50% dose upwards, but in beans only from 100% upwards. High concentrations (200%) further increased the DMY. However, for barley this was significant only in sand, but not in clay, and for beans vice versa. The DMY of both crops was generally higher in clay than in sand. The effects of the factors ‘treatment’, ‘soil’ and their interaction ‘soil*treatment’ were highly significant (p < 0.0001) in both crops. For reasons of clarity, error bars have not been included in the figures. Instead, variances are expressed as standard errors in the corresponding tables.
The plant N concentration showed different patterns in the two crops, although both crops showed higher values in clay than in sand. In barley, it increased with the P-Salt dosage and was highest (6.5% DM) with the 200% dose in clay. In beans, by contrast, it was relatively high in the controls (3.4% in clay, 3.2% in sand), and only between 1.7% and 2.7% DM in the treated plants. In clay, the N uptake calculated per pot puts this into perspective, where it was similar in all variants (except the 50% dose).
The plant concentration and uptake of P were higher in sand in both crops. In barley, the plant P concentration did not vary between the treatments in clay, but decreased with increasing P-Salt dose in sand. In beans, it increased steadily with P-Salt dose in both soils. The P and K concentrations were lower in beans than in barley; however, beans took up substantially higher amounts of P and K due to their higher DMY. The plant K concentration of barley grown in clay increased with P-Salt dosage. Although levels in treated plants remained below those of the control (5.4% DM), this was relativized by the higher DMY. In contrast, K increased significantly with every P-Salt level in sand. The K concentration of beans only rose with the 100% (clay) and 200% (sand) doses.
Plant-available soil nutrients measured at the end of the experiment showed the same pattern for both crops (Figure 1 and Figure 2). The Nmin and P(CAL) values increased significantly with P-Salt dosage in both soils, and K(CAL) only in sand. The Nmin and P(CAL) contents were mostly higher in sand than in clay. The P(CAL) contents increased sharply from the 100% to the 200% doses. In contrast, K(CAL) contents in clay were similar for all variants except the 200% dose. Higher K(CAL) contents were found in clay than in sand.

3.2.2. Effect of Biochar Addition and Comparison of P-Salt and Mineral Fertilizer

All fertilizer treatments increased DMY in both crops compared to the control, with the one exception of the mineral fertilizer treatment of beans grown in sand (Figure 3 and Figure 4). Biochar addition alone did not have any significant effect on DMY (Appendix A). The application of 0.1% and 0.2% biochar in addition to P-Salt enhanced barley DMY compared to fertilization with P-Salt only; however, this effect was only statistically significant in sand (Figure 3). All P-Salt treatments—with or without biochar—outperformed the mineral fertilizer in terms of DMY, except for beans grown in clay. In sand, it was not possible to harvest any barley biomass from pots treated with mineral fertilizer. The highest DMY overall was obtained with the P-Salt + 0.1% BC treatment (4.5 g·pot−1 for bean grown in clay; 1.0 g·pot−1 for barley grown in sand).
The highest plant N concentration was found in the minerally fertilized plants (7.0% DM in barley, 6.9% DM in beans), followed by the P-Salt treatment in barley and the biochar variants in beans. However, the N uptake in barley was lower with mineral fertilizer than with the P-Salt treatments (Table 8). The N concentration seemed remarkably high in minerally fertilized beans grown in sand, but this was partly an effect of the lower DMY.
The plant P concentration was higher in sand than in clay. There was no difference between the P-Salt alone and the combined treatments with biochar in barley in either soil (on average 1.2% DM in clay, 1.5% DM in sand). Mineral fertilizer considerably increased plant P (to 2.8% DM) in barley grown in clay, whereas it decreased plant P in beans in both soils.
In both crops and soils, the highest plant K concentration was found in plants treated with the combination of P-Salt and 0.2% biochar. Biochar addition almost always significantly increased plant K relative to P-Salt alone and mineral fertilizer. Application of P-Salt with and without biochar resulted in a higher uptake of K than with mineral fertilizer.
By far the highest Nmin contents were found in minerally fertilized pots in both crops and soils. These were followed by the P-Salt variants, but with much lower values. Again, higher values were found in sand. Biochar addition, particularly the 0.2% concentration, seemed to lower Nmin compared to P-Salt alone.
Soil P(CAL) was close to zero in all controls and continuously increased following P-Salt and particularly biochar treatments. The P(CAL) of pots treated with mineral fertilizer was between the control and P-Salt variants, yet unexpectedly low.
The K(CAL) values closely followed the pattern of plant K: highest values were found in pots treated with P-Salt and 0.2% biochar and lowest values in minerally fertilized pots. Application of P-Salt alone and each of the combinations significantly increased K(CAL). Levels were generally higher in clay than in sand. Practically no K(CAL) was measured in sand in the control (0.0 mg·(100·g·soil)−1) and the minerally fertilized pots (0.1 and 0.2 mg·(100·g·soil)−1 for beans and barley, respectively).

3.2.3. Influence of Fertilizer Form on Nutrient Uptake

The N uptake of barley was higher from the P-Salt treatments than from mineral fertilizer. For P uptake, it was the other way around. This was observed in both soils (Table 8).
The nutrient uptake of beans was the reverse for both N and P. The nutrient uptake was of course closely related to the DMY obtained and the concentration of N and P in the crops (Figure 3 and Figure 4).

3.2.4. Influence of Treatment and Soil on Root Dry Matter and Shoot:Root Ratio

As expected, the root development of barley was much more pronounced in sand soil than in clay (Table 9). In sand, even the smallest plants had developed a relatively extensive root system. This is reflected by the low shoot:root ratio. In clay, the two biochar treatments led to a particularly high shoot:root ratio (>9).
In contrast, beans formed more root biomass in clay than in sand and in general considerably more than barley. The shoot:root ratio of the beans followed the same pattern for all treatments in both soils; however, values reached a slightly higher level in sand.

4. Discussion

The findings of this study confirmed the hypotheses that (1) the fertilizing performance of P-Salt recovered from manure is equivalent to that of mineral P fertilizer; (2) there are positive synergies between biochar and P-Salt; and (3) there are differences in reaction to fertilization between crops. These are discussed in the following sections.

4.1. The Fertilizing Performance of P-Salt Is Equivalent to that of Mineral P Fertilizer

The fertilizing performance of P-Salt was evaluated on the basis of DMY and nutrient concentration. In terms of DMY, P-Salt performed better than mineral P fertilizer in both barley and bean crops and in the two soils sand and clay. This is particularly remarkable, as the fertilizers were compared based on total rather than water-soluble P content. The latter differed considerably, with commercial triple superphosphate supplying 43.5% and P-Salt only 1.2% of P in water-soluble form. Analysis by Mazeika et al. [42] of the molecular and morphological structure of manure-derived fertilizer (poultry manure) showed a colocalization of K, S, and P within the derived organo-mineral fertilizers (OMF). This, and the specific structure of the OMF at the molecular and crystalline levels may affect their performance, which can thus be different than that of minerally-derived P fertilizer.
Although barley had a higher DMY with P-Salt fertilization, its P uptake was higher with mineral fertilizer. We concluded that this is an effect of the large water-soluble P-fraction in mineral fertilizer. We hypothesize that in general both fertilizer types have similar yield effects, but that they are based on different dynamics of P-availability over time.
Contrary to expectations, both P concentration and uptake were higher in beans from the P-Salt treatment than from the conventional fertilizer treatment. As a legume, the bean was able to stimulate P mobilization by releasing root exudates, which very likely increased P availability [16] from the P-Salt.
Previous studies comparing P fertilizers/struvites recovered from various materials to commercial P fertilizer have reported that the recycled products increased DMY in maize [20], led to comparable DMY in perennial ryegrass [22], or at least improved DMY compared to untreated controls in several crops [17,18,19,43].
Our findings support the hypothesis that P-Salt is able to compete with commercial products in terms of yield effect and nutrient supply under the conditions tested.
However, we observed a few potential disadvantages of P-Salts compared to mineral fertilizer. The increase in both P and N concentration in barley biomass was considerably higher with mineral fertilizer. This can most likely be attributed to the higher plant-availability of P and N from mineral fertilizer immediately from the beginning of the experiment. These plants probably took up all their required nutrients within the first weeks. In contrast, the crops receiving P-Salt—whose main component struvite is known for its gradual P release [16] and low solubility—were not able to catch up within the remaining time. However, they compensated for the lower nutrient concentration through higher DMY, resulting in a type of nutrient dilution effect. A test duration longer than six weeks may have produced slightly different results, particularly because the amount of plant-available P from both fertilizer types may then have equalized.
In general, the fertilizing effect of mineral fertilizer was more uniform than that of P-Salt. This was apparent from the lower standard deviation of the DMY between replications. The reason for this remains unclear. To ensure a sufficiently uniform distribution, the P-Salt was ground very finely before mixing it with the soil. Fine particle size can positively influence the nutrient availability and thus the fertilizing effect [44]. For future experiments, granulation of the P-Salt should be considered to prevent possible demixing.

4.2. Biochar Improves P-Salt Fertilization Effects

The results of this study confirmed the findings of Schulz and Glaser [36] that biochar enhanced the effects of fertilizer and led to an increase in yield. In addition, we found that the biochar effect differed depending on soil and its positive effect appeared to increase with decreasing soil organic matter and an increasing sand content. Therefore, it was concluded that biochar has huge potential as a soil improver, particularly for more unproductive soils with low organic matter content, such as sand.
Light soils are more often subject to nutrient leaching due to lack of organic matter. Biochar addition may prevent these losses by improving the physical properties of the soil, namely the nutrient and water retention capacity of the soil [45], both valuable in sand. Biochar can absorb considerable amounts of water due to its large specific surface area. This water then remains available for the crops, along with the nutrients dissolved in it. However, the subsequent increased root growth reported by Bruun et al. [45] was only seen to a small extent in this study. The shoot:root ratio of the biochar variants significantly increased in barley grown in clay. This could be an indication of P accumulation in the soil. An increase in soil pH following biochar application [46] can have the indirect effect of higher P availability. This, in combination with the direct effect of a small amount of P from the biochar itself, results in improved P uptake and increased growth [47]. There are certainly interactions between the physical and the biological effects, but it was not possible to draw a conclusion here.
Towards the end of the study, significantly increased contents of P(CAL) and K(CAL) were recorded following biochar application in both crops and soils, which for P is consistent with previous studies [48,49]. The same was observed for plant K concentration and uptake. Hence, the biochar served as a source of P and K for the crops, despite the fact that the analysis found the P contained in the biochar to have very low water solubility. Biochars made from solid manures [1], poultry litter and swine manure [50] or beech-wood [36] are often reported to act as a nutrient source.
Biochar’s normally positive property of retaining nutrients, thus preventing them from leaching can of course also have the negative effect of immobilization and therefore reduced plant-availability of certain nutrients. The treatments with biochar had lower soil Nmin. Although these pots received the same amount of N as those in the “P-Salt only” treatments, it was not entirely plant-available. This suggests the—at least temporary—immobilization of nitrogen by biochar, as also observed in other studies (e.g., [34,35,37,48]). Beans showed a higher plant N concentration in the combined treatments than with P-Salt alone, whereas barley was unable to maintain the N concentration level of the P-Salt treatment. Although the bean seeds were not inoculated with rhizobia, by harvest, N fixation nodules had developed in the majority of pots. Thus, beans were able to meet their N demand by taking up additional N from biological fixation and possibly also mobilizing the N bound to biochar.
It is possible that biochar applied in combination with fertilizer binds nutrients released by the fertilizer. The nutrient release from P-Salt is slow. Therefore, it is assumed that biochar binds fewer nutrients from P-Salt than from mineral fertilizer, which provides the entire nutrient amount applied in readily plant-available forms. Enhanced DMY following the combined application of biochar and P-Salt may be explained by reduced nutrient leaching [48]. Furthermore, this result must stem from a synergistic effect, as the combined application led to higher DMY than with application of either P-Salt or biochar alone (Table A2, [36]). Therefore, it can be concluded that the fertilizing effect of P-salt can be enhanced by combined application with the biochar—a by-product of the BioEcoSIM process. The two biochar concentrations applied in this study did not significantly differ in terms of DMY. However, the 0.2% concentration showed a trend to decreasing DMY in barley in both soils and beans grown in clay. As biochar concentrations ten times as high (1% and 2%) did not show any adverse effect in the preliminary bioassays, a toxic effect of the low concentrations in the main experiment can be discounted. Bruun et al. [45] concluded that rates of 1%–2% by mass improve soil quality. The slight, but statistically insignificant decreases in yield following the 0.2% concentration may be in some way related to limited plant-availability of nutrients as discussed above.
In summary, the positive yield effect of biochar in sand was probably a consequence of factors such as improved soil structure (including water retention and increased soil organic matter), retention of fertilizer nutrients and limited nutrient supply. In combination, this promoted crop growth and yield.

4.3. Crop Types (Cereals/Legumes) React Differently to the P-Salt Treatment

The essential difference between the crop types was the significantly higher positive effect of P-Salt on cereal than legumes. This is revealed by a comparison of the controls with the P-Salt variants. Barley showed a highly positive reaction to N and P supplied by the P-Salt in terms of DMY and both plant concentration and uptake of N and P. Beans, in contrast, produced the same DMY in the control and the 50% treatment. The extremely low soil Nmin and P(CAL) in the controls recorded at the beginning of the experiment suggests that beans were able to meet their nutrient demands using other sources, for example atmospheric N.
The main explanation here is of course that the bean as a legume has the ability to (1) take up additional N from biological fixation; and (2) mobilize P with low plant availability by releasing organic acids. The latter, for instance, has been reported for the uptake of native soil P by white lupin Lupinus albus L. [51].
In addition, the bean has a higher thousand grain weight than barley, providing more nutrients and thus making it less dependent on external nutrient supply during germination and early growth stages. Cereals, in contrast, develop an extensive root system to ensure access to nutrients provided both by the soil and by fertilizer [52].
The moderate DMY response to the P-Salt treatments as well as the lower plant N concentration in beans might be explained by inhibited biological N fixation as a consequence of applied N. This can also cause yield losses [53], yet this was not observed. The benefit of N fertilization of legumes is controversial, although minor N fertilization is sometimes recommended for faba bean production under unfavourable growing conditions, poor seedbed environment or low soil pH.
In sum, the different reactions are ascribable more to the crop type than to the P-Salt. For beans, it would be recommendable to modify the precipitation process in order to obtain a P-Salt with lower N content. We conclude that P-Salt worked well for both crop types tested, supporting the hypothesis that P-Salt could replace conventional P fertilizer.

5. Conclusions and Recommendations

This study explored the potential use of a P-Salt recovered from pig manure as a replacement for conventional mineral P fertilizer.
The P-Salt was found to have the same or even better effects than mineral fertilizer on growth in both crops in both soils. Thus, firstly, the recovered product can replace conventional mineral P in terms of the fertilizing effect for the two crop types tested here. Secondly, and perhaps more importantly, the demand for P fertilizer in European agriculture could theoretically be met by P recycling from manure alone. Ideally, this would render the extraction of “new” P from rock phosphate for fertilizer production superfluous in the medium to long term.
This study did not consider the potential fertilizer replacement value of the P-Salt. Organic products are usually applied in higher amounts in order to compensate for the slower release and lower plant availability of nutrients than with conventional products. If the amounts applied had been adjusted accordingly, the P-Salt would have certainly led to considerably better results than those obtained in this study. In addition, the P-Salt can supply plants and soil with additional microelements and a small amount of organic matter. These aspects render P-Salt recovered from manure by the BioEcoSIM process even more advantageous than conventional fertilizers.
However, the acceptance of such recycled fertilizers by agriculture and horticulture is currently fairly low. One constraint is certainly the reliability of the novel product. The combination of P-Salt and conventional products could serve as a convincing solution for users/farmers: conventional fertilizer provides readily available, water-soluble P in the early growth stages, whereas the slow-releasing P-Salt ensures a continuous supply during the entire growth period. This would allow the entire P fertilizer amount to be administered in one application without the risk of P deficiency in heavy soils with high P immobilization potential (e.g., clay) of water-soluble P. P-Salt also has a strong advantage in light soils with low buffer capacity (e.g., sand) where the slow release of P prevents its leaching or surface runoff. The fertilizing effect of P-Salt can be enhanced by combined application with biochar, which is also a product of the manure recycling process in which P-Salts are extracted.
The results indicate that biochar improves the soil status of sand, suggesting that biochar can be a valuable addition to sandy or degraded soils. However, no significant benefit was seen in the clay soil.
Granulation or pelletizing of finely ground P-Salt and biochar can considerably simplify their handling and turn them into marketable products. A reduction in N content of the P-Salt would avoid the accompanying N application, thus increasing flexibility. The next steps will be a detailed assessment of how the properties of the raw manure influence the emerging products and validation of the presented findings in field-scale experiments.

Acknowledgments

This work was performed within the project “BioEcoSIM”, which received funding from the European Commission under grant agreement No. 308637. We would also like to thank Dagmar Mezger and Astrid Stadtaus for their support with the laboratory analyses, Sven Schabel and Anja Neuberdt for assistance with the pot experiments, Jens Möhring for statistical advice and Nicole Gaudet for revising the manuscript.

Author Contributions

A.E. and I.-M.B. conceived and designed the experiments; A.E. performed the experiments and analysed the data; S.L. and J.B. developed the manure processing technology and contributed materials to be tested; A.E. and I.L. are the lead authors and all authors contributed to paper writing.

Conflicts of Interest

The authors declare no conflict of interest. The founding sponsors had no role in the design of the study; in the collection, analyses, or interpretation of data; in the writing of the manuscript, and in the decision to publish the results.

Appendix A

Table A1. List of additionally analysed parameters measured in phosphate salts (P-Salt) and biochar and methods used.
ParameterUnitMethodP-SaltBiochar
Calcium (Ca)% DMDIN EN ISO 118853.38.3
Magnesium (Mg)% DM2.73.9
Sodium (Na)mg/kg17,6005,310
Boron (B)mg/kg39.198.2
Cobalt (Co)mg/kg<5.005.52
Manganese (Mn)mg/kg5881070
Molybdenum (Mo)mg/kg15.310.9
Selenium (Se)mg/kgDIN EN ISO 17294-2 (E29)5.8<2.0
Iron (Fe)mg/kgDIN EN ISO 1188522002300
Aluminium (Al)mg/kg280870
Lead (Pb)mg/kg<5.0<5.0
Cadmium (Cd)mg/kg0.6<0.5
Chrome (Cr)mg/kg5.911.0
Copper (Cu)mg/kg226158
Nickel (Ni)mg/kg8.27.9
Zinc (Zn)mg/kg23901500
Arsenic (As)mg/kg<4.0<4.0
Thallium (Tl)mg/kgDIN EN ISO 17294-2 (E29)0.3<0.2
Mercury (Hg)mg/kgDIN EN 1483-E12-40.07<0.05
DM, dry matter; DIN, German Organization for Standardization; EN, European Standard; ISO, International Standards Organization.
Table A2. Mean dry matter yield (DMY) of barley and bean treated with increasing biochar (BC) concentrations (n = 4).
ClaySand
Control0.1% BC0.2% BC0.5% BCControl0.1% BC0.2% BC0.5% BC
Barleyg·pot−10.200.280.290.240.070.110.150.13
Beang·pot−13.233.233.873.802.702.832.953.53

References

  1. Schoumans, O.F.; Rulkens, W.H.; Oenema, O.; Ehlert, P. Phosphorus Recovery from Animal Manure: Technical Opportunities and Agro-Economical Perspectives; Alterra Report No. 2158; Wageningen University and Research Centre: Wageningen, The Netherlands, 2010. [Google Scholar]
  2. Oenema, O.; Oudendag, D.; Velthof, G.L. Nutrient losses from manure management in the European Union. Livest. Sci. 2007, 112, 261–272. [Google Scholar] [CrossRef]
  3. European Commission, Council Directive 91/676/EEC of 12 December 1991 Concerning the Protection of Waters against Pollution Caused by Nitrates from Agricultural Sources, 1991. Available online: http://eur-lex.europa.eu/LexUriServ/LexUriServ.do?uri=CELEX:31991L0676:EN:HTML (accessed on 21 December 2016).
  4. European Commission, Directive 2000/60/EC of the European Parliament and of the Council of 23 October 2000 Establishing a Framework for Community Action in the Field of Water Policy, 2000. Available online: http://ec.europa.eu/health//sites/health/files/endocrine_disruptors/docs/wfd_200060ec_directive_en.pdf (accessed on 21 December 2016).
  5. Leenstra, F.; Vellinga, T.; Neijenhuis, F.; de Buisonjé, F. Manure: A Valuable Resource; Research Report; Wageningen University and Research Centre: Wageningen, The Netherlands, 2014. [Google Scholar]
  6. Döhler, H. Faustzahlen für die Landwirtschaft, 14th ed.; Publisher KTBL: Darmstadt, Germany, 2009. [Google Scholar]
  7. Tilman, D.; Cassman, K.G.; Matson, P.A.; Naylor, R.; Polasky, S. Agricultural sustainability and intensive production practices. Nature 2002. [Google Scholar] [CrossRef] [PubMed]
  8. MacDonald, G.K.; Bennett, E.M.; Potter, P.A.; Ramankutty, N. Agronomic phosphorus imbalances across the world’s croplands. Proc. Natl. Acad. Sci. USA 2011, 108, 3086–3091. [Google Scholar] [CrossRef] [PubMed]
  9. Ritter, S.K. The Haber-Bosch Reaction: An early chemical impact on sustainability. Chem. Eng. News 2008, 86, 33. [Google Scholar]
  10. Statistisches Bundesamt. Statistisches Jahrbuch Deutschland 2015, 1st ed.; Statistisches Bundesamt: Wiesbaden, Germany, 2015. [Google Scholar]
  11. European Commission. Report on Critical Raw Materials for the EU—Critical Raw Materials Profiles; European Commission: Brussels, Belgium, 2014. [Google Scholar]
  12. Van Kauwenbergh, S.J. World Phosphate Rock Reserves and Resources; IFDC Report; International Fertilizer Development Center (IFDC): Muscle Shoals, AL, USA, 2010. [Google Scholar]
  13. Franz, M. Phosphate fertilizer from sewage sludge ash (SSA). Waste Manag. 2008, 28, 1809–1818. [Google Scholar] [CrossRef] [PubMed]
  14. Eghball, B.; Wienhold, B.J.; Gilley, J.E.; Eigenberg, R.A. Mineralization of Manure Nutrients. J. Soil Water Conserv. 2002, 57, 470–473. [Google Scholar]
  15. Achat, D.L.; Daumer, M.-L.; Sperandio, M.; Santellani, A.-C.; Morel, C. Solubility and mobility of phosphorus recycled from dairy effluents and pig manures in incubated soils with different characteristics. Nutr. Cycl. Agroecosyst. 2014, 99, 1–15. [Google Scholar] [CrossRef]
  16. Talboys, P.J.; Heppell, J.; Roose, T.; Healey, J.R.; Jones, D.L.; Withers, P.J. Struvite: A slow-release fertiliser for sustainable phosphorus management? Plant Soil 2015, 401, 109–123. [Google Scholar] [CrossRef] [PubMed]
  17. Cabeza, R.; Steingrobe, B.; Römer, W.; Claassen, N. Effectiveness of recycled P products as P fertilizers, as evaluated in pot experiments. Nutr. Cycl. Agroecosyst. 2011, 91, 173–184. [Google Scholar] [CrossRef]
  18. Li, X.Z.; Zhao, Q.L. Recovery of ammonium-nitrogen from landfill leachate as a multi-nutrient fertilizer. Ecol. Eng. 2003, 20, 171–181. [Google Scholar] [CrossRef]
  19. Yetilmezsoy, K.; Sapci-Zengin, Z. Recovery of ammonium nitrogen from the effluent of UASB treating poultry manure wastewater by MAP precipitation as a slow release fertilizer. J. Hazard. Mater. 2009, 166, 260–269. [Google Scholar] [CrossRef] [PubMed]
  20. Liu, Y.; Rahman, M.M.; Kwag, J.-H.; Kim, J.-H.; Ra, C. Eco-friendly production of maize using struvite recovered from swine wastewater as a sustainable fertilizer source. Asian Australas. J. Anim. Sci. 2011, 24, 1699–1705. [Google Scholar] [CrossRef]
  21. Kahiluoto, H.; Kuisma, M.; Ketoja, E.; Salo, T.; Heikkinen, J. Phosphorus in manure and sewage sludge more recyclable than in soluble inorganic fertilizer. Environ. Sci. Technol. 2015, 49, 2115–2122. [Google Scholar] [CrossRef] [PubMed] [Green Version]
  22. Johnston, A.E.; Richards, I.R. Effectiveness of different precipitated phosphates as phosphorus sources for plants. Soil Use Manag. 2003, 19, 45–49. [Google Scholar] [CrossRef]
  23. Römer, W. Vergleichende Untersuchungen zur Pflanzenverfügbarkeit von Phosphat aus verschiedenen P-Recycling-Produkten im Keimpflanzenversuch. J. Plant Nutr. Soil Sci. 2006, 169, 826–832. [Google Scholar] [CrossRef]
  24. Lehmann, J.; Rillig, M.C.; Thies, J.; Masiello, C.A.; Hockaday, W.C.; Crowley, D. Biochar effects on soil biota—A review. Soil Biol. Biochem. 2011, 43, 1812–1836. [Google Scholar] [CrossRef]
  25. Laird, D.A.; Fleming, P.; Davis, D.D.; Horton, R.; Wang, B.; Karlen, D.L. Impact of biochar amendments on the quality of a typical Midwestern agricultural soil. Geoderma 2010, 158, 443–449. [Google Scholar] [CrossRef]
  26. Major, J.; Lehmann, J.; Rondon, M.; Goodale, C. Fate of soil-applied black carbon: Downward migration, leaching and soil respiration. Glob. Chang. Biol. 2010, 16, 1366–1379. [Google Scholar] [CrossRef]
  27. Rogovska, N.; Laird, D.; Cruse, R.; Fleming, P.; Parkin, T.; Meek, D. Impact of Biochar on manure carbon stabilization and greenhouse gas emissions. Soil Sci. Soc. Am. J. 2011, 75, 871. [Google Scholar] [CrossRef]
  28. Vaccari, F.P.; Baronti, S.; Lugato, E.; Genesio, L.; Castaldi, S.; Fornasier, F.; Miglietta, F. Biochar as a strategy to sequester carbon and increase yield in durum wheat. Eur. J. Agron. 2011, 34, 231–238. [Google Scholar] [CrossRef]
  29. Spokas, K.A.; Reicosky, D.C. Impacts of sixteen different biochars on soil greenhouse gas production. Ann. Environ. Sci. 2009, 3, 179–193. [Google Scholar]
  30. Case, S.D.C.; McNamara, N.P.; Reay, D.S.; Whitaker, J. Can biochar reduce soil greenhouse gas emissions from a Miscanthus bioenergy crop? GCB Bioenergy 2014, 6, 76–89. [Google Scholar] [CrossRef] [Green Version]
  31. Reents, H.J.; Levin, K. Wirkung von Biochar und Organischem Dünger auf Pflanzenwachstum und Bodeneigenschaften. In Beiträge zur 12. Wissenschaftstagung Ökologischer Landbau Ideal und Wirklichkeit: Perspektiven ökologischer Landbewirtschaftung; Neuhoff, D., Stumm, C., Ziegler, S., Eds.; Verlag Dr. Köster: Berlin, Germany, 2013; pp. 232–235. [Google Scholar]
  32. Spokas, K.A.; Cantrell, K.B.; Novak, J.M.; Archer, D.W.; Ippolito, J.A.; Collins, H.P.; Boateng, A.A.; Lima, I.M.; Lamb, M.C.; McAloon, A.J.; et al. Biochar: A Synthesis of Its Agronomic Impact beyond Carbon Sequestration. J. Environ. Qual. 2012, 41, 973. [Google Scholar] [CrossRef] [PubMed]
  33. Jeffery, S.; Verheijen, F.; van der Velde, M.; Bastos, A.C. A quantitative review of the effects of biochar application to soils on crop productivity using meta-analysis. Agric. Ecosyst. Environ. 2011, 144, 175–187. [Google Scholar] [CrossRef]
  34. Alburquerque, J.A.; Salazar, P.; Barrón, V.; Torrent, J.; del Campillo, M.D.; Gallardo, A.; Villar, R. Enhanced wheat yield by biochar addition under different mineral fertilization levels. Agron. Sustain. Dev. 2013, 33, 475–484. [Google Scholar] [CrossRef]
  35. Atkinson, C.J.; Fitzgerald, J.D.; Hipps, N.A. Potential mechanisms for achieving agricultural benefits from biochar application to temperate soils: A review. Plant Soil 2010, 337, 1–18. [Google Scholar] [CrossRef]
  36. Schulz, H.; Glaser, B. Effects of biochar compared to organic and inorganic fertilizers on soil quality and plant growth in a greenhouse experiment. Z. Pflanzenernähr. Bodenk. 2012, 175, 410–422. [Google Scholar] [CrossRef]
  37. Olmo, M.; Villar, R.; Salazar, P.; Alburquerque, J.A. Changes in soil nutrient availability explain biochar’s impact on wheat root development. Plant Soil 2016, 399, 333–343. [Google Scholar] [CrossRef]
  38. Major, J.; Rondon, M.; Molina, D.; Riha, S.J.; Lehmann, J. Nutrient Leaching in a Colombian Savanna Oxisol Amended with Biochar. J. Environ. Qual. 2012, 41, 1076–1086. [Google Scholar] [CrossRef] [PubMed]
  39. Achat, D.L.; Sperandio, M.; Daumer, M.-L.; Santellani, A.-C.; Prud’Homme, L.; Akhtar, M.; Morel, C. Plant-availability of phosphorus recycled from pig manures and dairy effluents as assessed by isotopic labeling techniques. Geoderma 2014, 232, 24–33. [Google Scholar] [CrossRef]
  40. Ackerman, J.N. Reclaiming Phosphorus as Struvite from Hog Manure. Ph.D. thesis, University of Manitoba, Winnipeg, Canada, 2012. [Google Scholar]
  41. Bremer, H.; University of Hohenheim, Stuttgart, Germany. Personal communication, 2013.
  42. Mazeika, R.; Dambrauskas, T.; Baltakys, K.; Mikolajunas, M.; Staugaitis, G.; Virzonis, D.; Baltrusaitis, J. Molecular and morphological structure of poultry manure derived Organo-Mineral Fertilizers (OMFs). ACS Sustain. Chem. Eng. 2016, 4, 4788–4796. [Google Scholar] [CrossRef]
  43. Massey, M.S.; Davis, J.G.; Ippolito, J.A.; Sheffield, R.E. Effectiveness of recovered magnesium phosphates as fertilizers in neutral and slightly alkaline soils. Agron. J. 2009, 101, 323. [Google Scholar] [CrossRef]
  44. Bauer, P.J.; Szogi, A.A.; Vanotti, M.B. Agronomic effectiveness of calcium phosphate recovered from liquid swine manure. Agron. J. 2007, 99, 1352–1356. [Google Scholar] [CrossRef]
  45. Bruun, E.W.; Petersen, C.T.; Hansen, E.; Holm, J.K.; Hauggaard-Nielsen, H. Biochar amendment to coarse sandy subsoil improves root growth and increases water retention. Soil Use Manag. 2014, 30, 109–118. [Google Scholar] [CrossRef]
  46. Novak, J.M.; Busscher, W.J.; Laird, D.L.; Ahmedna, M.; Watts, D.W.; Niandou, M.A. Impact of biochar amendment on fertility of a southeastern coastal plain soil. Soil Sci. 2009, 174, 105–112. [Google Scholar] [CrossRef]
  47. Madiba, O.F.; Solaiman, Z.M.; Carson, J.K.; Murphy, D.V. Biochar increases availability and uptake of phosphorus to wheat under leaching conditions. Biol. Fertil. Soils 2016, 52, 439–446. [Google Scholar] [CrossRef]
  48. Lehmann, J.; Pereira da Silva, J., Jr.; Steiner, C.; Nehls, T.; Zech, W.; Glaser, B. Nutrient availability and leaching in an archaeological anthrosol and a ferralsol of the central amazon basin: Fertilizer, manure and charcoal amendments. Plant Soil 2003, 249, 343–357. [Google Scholar] [CrossRef]
  49. Glaser, B.; Lehmann, J.; Zech, W. Ameliorating physical and chemical properties of highly weathered soils in the tropics with charcoal—A review. Biol. Fertil. Soils 2002, 35, 219–230. [Google Scholar] [CrossRef]
  50. Subedi, R.; Taupe, N.; Ikoyi, I.; Bertova, L.; Zavattaro, L.; Schmalenberger, A.; Leahy, J.J.; Grignani, C. Manure-derived biochars behave also as fertilizer. In Book of Abstracts Ramiran 2015 16th International Conference Rural-Urban Symbiosis; TUTech Verlag: Hamburg, Germany, 2015; p. 80. [Google Scholar]
  51. Gonzalez-Ponce, R.; Garcia Lopez De Sa, M.E. Efficacy of magnesium ammonium phosphate recovered from wastewater on white lupin plant. A greenhouse experiment. Agrochimica 2008, 52, 352–359. [Google Scholar]
  52. Hamblin, A.P.; Tennant, D. Root length density and water uptake in cereals and grain legumes: How well are they correlated? Aust. J. Agric. Res. 1987, 38, 513–527. [Google Scholar] [CrossRef]
  53. Mengel, K.; Kirkby, E.A. Principles of Plant Nutrition, 5th ed.; Kluwer Academic Publishers: Dordrecht, The Netherlands, 2001. [Google Scholar]
Figure 1. Dry matter yield (DMY) and nutrient concentration in biomass, graph upper panel, (a), and soil, graph lower panel, (b), of barley treated with increasing P-Salt levels compared to untreated control. Different letters in the table indicate statistically significant differences between treatments (α = 0.05, n = 4). SE: pooled standard error of the mean.
Agriculture 07 00001 g001

ControlP-Salt 50%P-Salt 100%P-Salt 200% ControlP-Salt 50%P-Salt 100%P-Salt 200%SE
Clay Sand
BiomassDMY abcc abcd0.036
N ■abbcc abcd0.044
P ▲abbb abbcc0.038
K ✲abbcc abcd0.049
SoilNminabcd abcd0.241
P(CAL) △abcd abcd0.088
K(CAL) ✖aaab abcd0.075
Figure 2. Dry matter yield (DMY) and nutrient concentration in biomass, graph upper panel, (a), and soil, graph lower panel, (b), of faba beans treated with increasing P-Salt levels compared to untreated control. Different letters in the table indicate statistically significant differences between treatments (α = 0.05, n = 4). SE: pooled standard error of the mean.
Agriculture 07 00001 g002

ControlP-Salt 50%P-Salt 100%P-Salt 200% ControlP-Salt 50%P-Salt 100%P-Salt 200%SE
Clay Sand
BiomassDMY aabc aabb0.069
N ■abcc abbc0.057
P ▲abcd abcd0.026
K ✲aabcbc aaab0.041
SoilNminabcd abcd0.135
P(CAL) △abcd abcd0.076
K(CAL) ✖aaab abcd0.054
Figure 3. Dry matter yield (DMY) and nutrient concentration in biomass, graph upper panel, (a), and soil, graph lower panel, (b), of barley treated with P-Salt only (“P-Salt 100%”), P-Salt and biochar (“P-Salt + BC 0.1%”, “P-Salt + BC 0.2%”) and mineral fertilizer (“Mineral 100%”) compared to untreated control. Different letters in the table indicate statistically significant differences between treatments (α = 0.05, n = 4). SE: pooled standard error of the mean.
Agriculture 07 00001 g003

ControlP-Salt 100%P-Salt 100% + BC 0.1%P-Salt 100% + BC 0.2%Mineral 100% ControlP-Salt 100%P-Salt 100% + BC 0.1%P-Salt 100% + BC 0.2%Mineral 100%SE
Clay Sand
BiomassDMY abbbc abcc-0.036
N ■abbcd abcc-0.044
P ▲abbbc abbb-0.038
K ✲abacb abcc-0.049
SoilNminabccd abbbc0.241
P(CAL) △abccd abcde0.088
K(CAL) ✖ababccd abcde0.075
Figure 4. Dry matter yield (DMY) and nutrient concentration in biomass, graph upper panel, (a), and soil, graph lower panel, (b), of faba beans treated with P-Salt only (“P-Salt 100%”), P-Salt and biochar (“P-Salt + BC 0.1%”, “P-Salt + BC 0.2%”) and mineral fertilizer (“Mineral 100%”) compared to untreated control. Different letters in the table indicate statistically significant differences between treatments (α = 0.05, n = 4). SE: pooled standard error of the mean.
Agriculture 07 00001 g004

ControlP-Salt 100%P-Salt 100% + BC 0.1%P-Salt 100% + BC 0.2%Mineral 100% ControlP-Salt 100%P-Salt 100% + BC 0.1%P-Salt 100% + BC 0.2%Mineral 100%SE
Clay Sand
BiomassDMY abbbb abbba0.069
N ■abcabd abaac0.057
P ▲abcbcd abcbd0.026
K ✲abcacbd aabcd0.041
SoilNminabcde abccd0.136
P(CAL) abccd abcde0.076
K(CAL) ✖aaabc abcde0.054
Table 1. Characteristics of phosphate salts (P-Salt) and biochar.
ParameterUnitMethodP-SaltBiochar
Total volatile solid content% DMDIN EN 15935:2012-1117.3-
P total% DMDIN EN ISO 118855.06.0
 of which
 P water soluble% DMVDLUFA II, 4.1.41.20.4
 P citric acid soluble% DMVDLUFA II, 4.1.39.513.5
 P neutral ammonium citrate soluble% DMVDLUFA II, 4.1.49.513.2
N total% DMDIN ISO 138788.13.0
Ammonium N (NH4-N)% DMDIN 38406-E52.4<0.05
Nitrate N (NO3-N)% DMCaCl2-extraction-<0.00051
K% DMDIN EN ISO 118852.02.1
S% DMDIN EN ISO 118854.70.3
pH-DIN EN 121767.08.8
DM, dry matter; N, nitrogen; P, phosphorus; K, potassium; S, sulfur; VDLUFA, Association of German Agricultural Analytic and Research Institutes.
Table 2. Experimental set-up of seed germination test.
CropCress (Lepidium sativum)
10 seeds per pot
Spring barley (Hordeum vulgare var. ‘Grace’)
2 seeds per pot
Substrate + pots30 g (biochar)/50 g (P-Salt) cultivation substrate (TKS 1, Floragard) per pot (polypropylene, 7 × 7 × 8 cm3, Goettinger)
Treatments + replicationsP-Salt: 0, 0.125, 0.25, 0.313, 0.375 and 0.5 g P-Salt per pot (control, 50%, 100%, 125%, 150% and 200% of optimal P supply); 10 replications
Biochar: 0, 0.03, 0.06, 0.15, 0.3 and 0.6 g biochar per pot (control, 0.1%, 0.2%, 0.5%, 1.0% and 2.0%); 8 replications
Duration14 days19 days
Conditions20 °C, 16 h light, 8 h dark; climate chamber KBK/LS 4600 (Ehret GmbH & Co. KG, Emmendingen, Germany)
Initial watering with 100 mL deionized water per pot; additional spraying when required
TKS, the product name of the substrate.
Table 3. Experimental set-up of crop growth test.
CropCress (Lepidium sativum)
20 seeds per pot
Spring barley (Hordeum vulgare var. ‘Grace’)
10 seeds per pot; after germination reduction to 3 seedlings per pot
Substrate + pots250 g cultivation substrate (TKS 2, Floragard) per pot (polypropylene, 11 × 11 × 12 cm3, Goettinger)
Treatments + replicationsP-Salt: 0, 0.375, 0.75, 0.938, 1.125 and 1.5 g per pot; 4 replications
Biochar: 0, 0.25, 0.5, 1.25, 2.5 and 5 g per pot; 4 replications
Duration2 weeks6 weeks
ConditionsGreenhouse; initial watering with 250 mL deionized water per pot to soak substrate; additional watering when required
Table 4. Characteristics of soil substrates.
SoilNminP(CAL)K(CAL)pH
mg·(kg·soil)−1mg·(100·g·soil)−1
Clay1.70.72.98.1
Sand0.80.010.178.0
Nmin, mineralized nitrogen, CAL, calcium-acetate-lactate method.
Table 5. Overview of all treatments and corresponding N and P application rates.
TreatmentN AppliedP AppliedBiochar
g·pot−1
Control---
P-Salt 50%0.1800.113-
P-Salt 100%0.3600.225-
P-Salt 200%0.7200.450-
Mineral 100%0.3600.225-
P-Salt 100% + BC 0.1%0.3600.2251.5
P-Salt 100% + BC 0.2%0.3600.2253.0
BC: biochar.
Table 6. Results of germination test.
CressBarley
P-SaltSeed germination up to 27% lower following application in the tested ranges.Seed germination enhanced by up to 30% by doses up to and including the 100% dose; no further increases at higher doses.
BiocharNo effect in any of the tested concentrations.Moderate concentrations of up to 1% did not have any negative effect.
Table 7. Results of crop growth test.
CressBarley
P-SaltDry matter yield (DMY) was not significantly influenced by doses up to and including the 150% dose. The 200% dose resulted in 19% lower DMY compared to the control.Tendency for decreasing DMY with increasing P-Salt dosage; however, the growth-retarding effect was only statistically significant for the two highest levels (31% and 18% lower DMY).
BiocharDMY appeared to decrease with increasing concentration. However, the adverse effect was only significant for the two highest concentrations with 19% and 20% lower DMY than in the control.DMY not influenced by any concentration tested.
Table 8. Mean nutrient uptake into shoots for fertilizer forms with/without biochar (BC) addition tested. Different letters in the table indicate statistically significant differences between treatments (α = 0.05, n = 4).
ClaySandSE
ControlP-Salt 100%P-Salt 100% + BC 0.1%P-Salt 100% + BC 0.2%Mineral 100%ControlP-Salt 100%P-Salt 100% + BC 0.1%P-Salt 100% + BC 0.2%Mineral 100%
BarleyNmg·pot−15.13a53.48b53.37b41.69bc38.11c1.64a38.88b46.88b43.20bno crop0.138
P0.41a10.17b11.48b11.59b15.46c0.32a11.04b13.74c11.69bno crop0.145
K11.02a41.71b54.96bc61.78c23.64d1.63a35.60b60.83c57.96cno crop0.166
BeanNmg·pot−1109.69a102.24a158.47b117.83a189.14c85.56a71.89b119.48c117.86c165.11d0.077
P8.08a26.52b24.48b26.21b17.80c9.70a55.57b49.18b57.63b20.25c0.085
K39.41a63.57b63.46bc69.71c42.07a30.18a43.09b56.81c70.12d16.44e0.091
SE: pooled standard error of the mean.
Table 9. Mean root dry matter and shoot:root ratio of barley and faba beans for fertilizer forms with/without biochar (BC) addition tested. Different letters in the table indicate statistically significant differences between treatments (α = 0.05, n = 4).
UnitClaySandSE
ControlP-Salt 100%P-Salt 100% + BC 0.1%P-Salt 100% + BC 0.2%Mineral 100%ControlP-Salt 100%P-Salt 100% + BC 0.1%P-Salt 100% + BC 0.2%Mineral 100%
BarleyRoot dry matter g·pot−10.22ns0.19ns0.10ns0.11ns0.14ns0.42a0.44a0.66b0.40ano crop0.067
Shoot:root ratio-1.01a4.42b9.83c9.64c4.20b0.16a1.79b1.65b2.88bno crop0.180
BeanRoot dry matter g·pot−14.65b4.37b4.20b5.05b3.11a2.00a2.66b2.78b3.02b1.60a0.087
Shoot:root ratio-0.71a1.00bc1.13cd0.96ab1.37d1.35ab1.45ab1.49ab1.33a1.50b0.114
SE: pooled standard error of the mean, ns: not significant.

