

Abstract
Maximizing agricultural production on existing cropland is one pillar of meeting future global food security needs. To close crop yield gaps, it is critical to understand how climate extremes such as drought impact yield. Here, we use gridded, daily meteorological data and county-level annual yield data to quantify meteorological drought sensitivity of US maize and soybean production from 1958 to 2007. Meteorological drought negatively affects crop yield over most US crop-producing areas, and yield is most sensitive to short-term (1–3 month) droughts during critical development periods from July to August. While meteorological drought is associated with 13% of overall yield variability, substantial spatial variability in drought effects and sensitivity exists, with central and southeastern US becoming increasingly sensitive to drought over time. Our study illustrates fine-scale spatiotemporal patterns of drought effects, highlighting where variability in crop production is most strongly associated with drought, and suggests that management strategies that buffer against short-term water stress may be most effective at sustaining long-term crop productivity.
Export citation and abstract BibTeX RIS
1. Introduction
Drought causes significant yield reductions in rainfed agricultural systems, both globally and within the United States. Since 1900, an estimated 2 billion people have been affected by drought, and annual drought-related costs are estimated at 6–8 billion US dollars globally (United Nations Food and Agriculture Organization 2013). Feeding the rapidly growing global population under anticipated climate change requires detailed accounts of the drivers of agricultural production and yield gaps in order to ensure a stable and sufficient food supply while avoiding negative consequences of land use change (Foley 2005, Lobell et al 2009, Foley et al 2011, van Ittersum et al 2013). The frequency, intensity and duration of drought are projected to rise over many agriculturally important areas globally, including much of North America (Dai 2013), and expected to threaten food production and security at regional to global scales (Parry et al 2004, Schlenker and Roberts 2008, Wheeler and Braun 2013). As a result, it is necessary to understand the sensitivity and resilience of existing cropping systems to drought in order to effectively plan for and mitigate impacts of droughts in the future.
Recent research has well explored the effects of climate trends and variability on food production in both the US and globally, with a particular focus on rising temperatures and extreme heat (Lobell and Asner 2003, Twine and Kucharik 2009, Lobell et al 2011, Lobell et al 2013, Asseng et al 2015, Moore and Lobell 2015, Ray et al 2015). In this study, we focus on drought effects, and use the term 'drought' to refer specifically to meteorological drought which we define following Mishra and Singh (2010) as a 'precipitation deficit with respect to average values'. As a precipitation deficit considers both water supply (precipitation) and demand (evapotranspiration), drought is driven by complex interactions among precipitation, temperature, vapor pressure, and solar radiation, making assessments of drought impacts on agricultural production particularly challenging (Mishra and Singh 2010, Liu et al 2016). Although previous work has quantified drought effects at field to regional scales (Hlavinka et al 2009, Lobell et al 2014, Zipper and Loheide 2014, Zipper et al 2015), studies on the sensitivity of major agricultural crops to drought at the continental scale are rare.
Understanding spatial and temporal variability of drought impacts on crop yield is critical to both plan for and mitigate the potential negative consequences of drought. In particular, the timescales (i.e. drought duration) and timing (i.e. time of year drought occurs) at which drought exerts the strongest impact on yield are yet to be quantified across the US, but such information can help farmers, governmental organizations, and other stakeholders design and implement drought mitigation strategies and early warning systems (Wu et al 2004, Wilhite et al 2007). Furthermore, understanding spatial patterns of drought sensitivity as well as changes in these patterns over time can help stakeholders plan for regional and continental shifts in actual and realized production under future climate change. Collectively, this knowledge will help guide management and policy responses to drought at the field, county, and national levels by illuminating where and when agricultural production is most negatively impacted by drought, with ramifications for future crop production potential and global food security.
To address these knowledge gaps, we use a long-term (1957–2008), fine-resolution (5' × 5') gridded US-scale daily meteorological dataset and detrended county-level maize and soybean yield data to answer the following research questions:
- (1)To what extent is variability in US maize and soybean yield associated with meteorological drought, and how does this relationship vary spatially?
- (2)What timescales and timing of meteorological drought exert the strongest influence on crop yield?
- (3)Where and how has the sensitivity of crop yield to meteorological drought changed over time?
2. Methodology
2.1. Drought severity calculation
To quantify drought severity, we calculate the standardized precipitation evapotranspiration index (SPEI) (Vicente-Serrano et al 2009) at 1–12, 18, and 24 month timescales from 1958 to 2007 at a monthly timestep. The SPEI considers both water supply (precipitation) and water demand (reference evapotranspiration) and therefore is particularly relevant to agricultural production, in which plant water use can reduce root zone soil moisture and lead to drought (Mishra and Singh 2010, Vicente-Serrano et al 2015). As such, the SPEI has been widely used for assessing the impacts of meteorological drought on agricultural production (Vicente-Serrano et al 2012, Shi and Tao 2014, Ming et al 2015, Potopová et al 2015, 2016, Araujo et al 2016). Furthermore, as a multiscalar index, the SPEI allows us to directly compare effects of drought at different timescales, unlike the widely used Palmer drought severity index (Alley 1984, Liu et al 2016), and has been shown to be particularly effective at characterizing drought during the summer months most critical to agricultural production (Vicente-Serrano et al 2012).
Required input data for SPEI is monthly precipitation deficit, defined as the difference between precipitation and evapotranspiration. To calculate monthly precipitation deficit, we use a daily gridded meteorological dataset covering the entire continental United States at 5' resolution, which is described in Motew and Kucharik (2013), and contains precipitation, temperature, relative humidity, wind speed, and incoming solar radiation. This dataset was selected as it contains all necessary variables to calculate daily Penman-Monteith reference evapotranspiration (Allen et al 1998), which has been shown to be more accurate than temperature-based methods for long-term assessment of drought (Sheffield et al 2012). Furthermore, the 50 year period we use for analysis is longer than other publicly available meteorological datasets containing the same variables such as METDATA (Abatzoglou 2013) or North American Regional Reanalysis (NARR; Mesinger et al 2006), both of which began in 1979. In brief, this dataset represents a composite of meteorological station data, primarily Global Historical Daily Climatology and National Climatic Data Center TD3200 and TD3210, gridded NCEP/NCAR (Kalnay et al 1996) and NCEP/DOE AMIP-II (Kanamitsu et al 2002) reanalysis data. Daily meteorological variables were used to calculate daily Penman-Monteith reference evapotranspiration and precipitation deficit, defined as precipitation—reference evapotranspiration. Daily precipitation deficits were accumulated to monthly values and monthly SPEI was calculated at each timescale using the R package 'SPEI' for each grid point. Gridded monthly SPEI was then aggregated to the county level as an average of all pixels within each county using the R package 'sp'.
2.2. Crop yield data processing
We obtained nationwide county-level maize and soybean yield data from the US Department of Agriculture National Agricultural Statistics Service (NASS) for the period of 1958–2007. As the length of crop yield records differs among states, we retained only counties with less than 5 years of missing data between 1958 and 2007, resulting in 1647 and 1044 counties for maize and soybean, respectively. This led to the exclusion of some states and counties which did not begin reporting county-level yield until post-1958, most notably Texas, which began reporting county-level yield in 1968. In addition, yield data for irrigated crops is only reported for a small number of states for limited period of time. Therefore, to assess the extent to which irrigation mediates the drought effects, we further extracted separate irrigated and non-irrigated maize yield data from NASS for Nebraska in order to perform a detailed case study on the impacts of irrigation. Prior to analyzing drought effects, we detrended the crop yield data using linear regression to eliminate the gradual trend in yields due to non-climatic factors such as genetic and agronomic improvements (Wu and Wilhite 2004, Mavromatis 2007, Sun et al 2012, Shi and Tao 2014, Potopová et al 2015).
2.3. Statistical model fitting
We define drought sensitivity as the slope of a linear relationship between an annual SPEI metric (e.g. July 1 month SPEI) and detrended crop yield anomalies (Hlavinka et al 2009, Vicente-Serrano et al 2013). As a more negative SPEI value corresponds to more severe drought, a positive slope indicates the yield is lower during more severe drought years. Figure S1 shows a timeseries of SPEI and yield anomalies for several states included in the analysis. For each county and crop, we employed a factorial approach to fit 70 separate linear relationships, based on 5 different months of the growing season (May–September) and 14 different timescales (1–12, 18, and 24 months). For each relationship, we extracted the slope, adjusted R2, and p-value of the relationship based on two-tailed t-test. For each county, the best relationship was defined as the timing (i.e. month of growing season) and timescale (i.e. drought duration) combination with the highest adjusted R2 (Vicente-Serrano et al 2013). To assess irrigation impacts on drought sensitivity, we separately fit July 1 month SPEI (the best predictor identified from prior analysis; see section 3.3) relationships to irrigated and non-irrigated maize yield anomalies.
We also performed multivariate adaptive regression splines (MARS) analysis using the R package 'earth' to test potential nonlinearities and asymmetries in drought effects (Lobell et al 2014). To quantify shifts in drought sensitivity over time, we fit linear regressions using 1 month July SPEI to the first and last 25 years of data (1958–1982 and 1983–2007, respectively), and tested for significant differences between periods using analysis of covariance. Counties where slopes were not significant in either period or did not have significant differences between periods were labeled 'no change', and remaining slopes were tested to see if they shifted towards shallower slopes (lower value), steeper slopes (higher value), or positive to negative/negative to positive.
3. Results
3.1. Spatiotemporal patterns of crop yield
During the past 50 years (1958–2007), US annual average maize and soybean yield have steadily increased over time (mean trends of 0.101 Mg ha−1 yr−1 and 0.025 Mg ha−1 yr−1, respectively), accompanied by a simultaneous increasing trend in the range of spatial variability (figure 1(e)). Crop yield variability over time (indicated by the coefficient of variation, or C.V.) is typically lower in higher-yielding regions with stronger increasing yield trends, and conversely variability is higher in areas with lower productivity and weaker increasing yield trends. Specifically, for maize production, we find the strongest increasing yield trend and lowest yield variability in Midwestern states such as Iowa, Minnesota and Nebraska (0.119, 0.123 and 0.130 Mg ha−1 yr−1, respectively) whereas more marginal production regions in the southeastern US such as Virginia and North Carolina had the weakest increasing trends (0.075 and 0.071 Mg ha−1 yr−1) and higher yield variability, particularly in the central parts of the states (figures 1(a) and (c)). Similar spatial patterns were observed for soybean production; the greatest yield trend and lowest yield variability was observed in Wisconsin and Nebraska (0.037 and 0.036 Mg ha−1 yr−1, respectively) and southern states like Oklahoma (0.007 Mg ha−1 yr−1) showed the lowest yield increases (figures 1(b) and (d)).

Figure 1. Coefficient of variation (C.V.) of crop yields over the study period of 1958–2007 for (a) maize and (b) soybean. Long-term trend in crop yields (Mg ha−1 yr −1) for (c) maize and (d) soybean at the county-level used for detrending in yield anomaly calculation, and (e) annual distribution of yield over and the entire US-level for maize (brown) and soybean (pink).
Download figure:
Standard image High-resolution image3.2. Spatial variability of drought impacts
Our results showed marked spatial variations in the relationships between drought and crop yields (figure 2). Overall, the strength of the relationship between SPEI and yield is much greater for maize than soybean production (figure 2(e)), which is reasonable given the lower production levels of soybean observed in figure 1. While on average SPEI is associated with 12.6% and 12.8% yield variation for maize and soybean, respectively, adjusted R2 for the fitted relationships ranged widely from 0% to 57% for maize and 0% to 67% for soy across the study area. Two regions were further distinguished according to the magnitude and direction of drought effects: (1) a large region concentrated in central and southeastern US including northern Missouri, southern Illinois, western Kentucky and Tennessee, and the Atlantic coastal plain, where SPEI and yield had a strong positive correlation (meaning more severe drought was associated with larger negative yield anomalies, which we define as increased drought sensitivity), and (2) Midwestern states (such as western Nebraska and the Dakotas, northwestern Iowa, and eastern Wisconsin) where SPEI has a weakly positive or even negative relationship with detrended crop yields (indicative of reduced drought sensitivity or even higher yield during drought periods) (figures 4(a)–(d)).
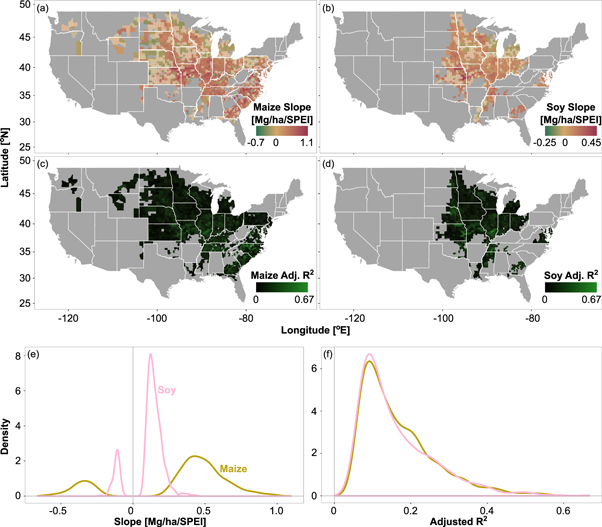
Figure 2. Spatial variability of drought effects on crop yield. Slope of the relationship between yield anomaly and SPEI for (a) maize and (b) soybean, respectively, for best overall linear model. Semi-transparent counties do not have statistically significant relationships between yield anomaly and SPEI at p < 0.05. A positive slope indicates yield losses in response to drought while a negative slope indicates yield gains in response to drought. (c) and (d) Show adjusted R2 of relationship between yield anomaly and SPEI relationship for maize and soy, respectively. (e) and (f) Show density plots of slope and adjusted R2 for all counties with p < 0.05.
Download figure:
Standard image High-resolution imageWe also observe weak or negative maize drought sensitivity in heavily irrigated areas such as western Nebraska (Wilhelmi and Wilhite 2002, Hornbeck and Keskin 2014) (figures 2(a) and S2), which may indicate an irrigation-induced decoupling from meteorological conditions. To further explore the effects of irrigation on drought sensitivity, we separately analyzed irrigated and non-irrigated maize yield for Nebraska, one of the few states with long-term yield data available for both irrigated and non-irrigated maize production. We find that irrigation decouples yield from interannual drought variability, with SPEI significantly correlated with irrigated yield anomalies in only 8% of total counties (n = 7), compared to non-irrigated yield anomalies in 60% of counties (n = 50). In counties with statistically significant relationships, drought sensitivity of non-irrigated maize is an average of ∼2.8 times higher, with irrigated yield in one county even showing negative drought sensitivity indicating higher yield during drought (figure 3(a)). Similarly, SPEI is more strongly correlated with yield anomalies in non-irrigated than irrigated counties (mean adjusted R2 of 19.5% versus 8.7%, respectively) (figure 3(b)). Taken in tandem, these results indicate that irrigation is effectively decoupling crop production from weather variability, and thus reducing or eliminating yield sensitivity to meteorological drought.
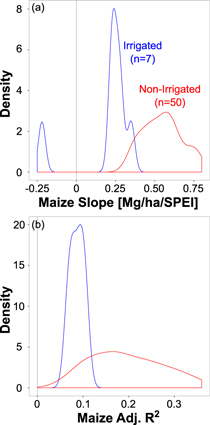
Figure 3. Density plots showing (a) slope and (b) adjusted R2 of relationship between maize yield anomaly and 1 month July SPEI for irrigated (blue) and non-irrigated (red) yield for all Nebraska counties with significant (p < 0.05) relationships between SPEI and maize yield anomalies.
Download figure:
Standard image High-resolution image3.3. Timescales and timing of drought impacts
Both maize and soybean yield anomalies are most strongly correlated with drought at short (1–3 month) timescales occurring during July and August. Overall, yield in 66% of counties has the strongest relationships with 1–3 month drought timescales for maize (n = 1095) and 75% for soybean (n = 779). Maize is most sensitive to 1 month drought occurring in July, which corresponds to silking and reproductive stages of plant development (Otegui et al 1995, Çakir 2004, Campos et al 2004) (figures 4(a) and (b)) while soybean, traditionally planted later than maize, is most sensitive to 2 month droughts occurring in August (figures 4(c) and (d)). For both crops, as the timescale of drought considered increases, the timing of most extreme drought sensitivity tends to shift later in the year. For example, of the counties with the strongest significant (p < 0.05) relationship between SPEI and maize yield at a 1 month timescale, the majority (71%) are most strongly correlated with July SPEI, and only 9% by August SPEI; however, for counties with the strongest relationship at 2 or 3 month timescales, the percentage of counties most strongly correlated with August and September SPEI (which include July climatic conditions due to the 2 month calculation timescale) increase.
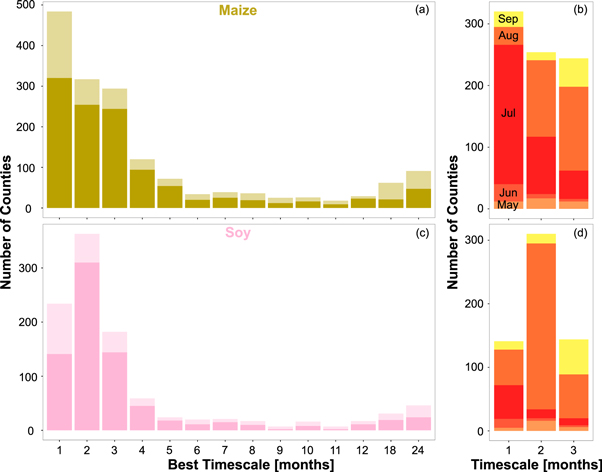
Figure 4. Histograms showing (a) timescale with best fit for relationship between detrended maize yield and SPEI across all counties (semi-transparent color indicates p > 0.05). (b) Distribution of the month with best relationship between detrended maize yield and SPEI for counties with significant fits best most strongly correlated with 1, 2, and 3 month timescales. (c) and (d) are the same, but for soybean.
Download figure:
Standard image High-resolution imageWe also find that drought sensitivity at short timescales shows nonlinear effects on both maize and soybean yields (figure 5). For example, the sensitivity to drought increases dramatically when the SPEI drops below −0.4 for maize, indicating that nonlinear effects of water stress may be driving enhanced yield losses during more extreme drought (Lobell et al 2014). In contrast, at extreme positive SPEI values (indicating wet conditions) we observe a decrease in both maize and soybean yield, which we attribute to excess moisture leading to oxygen stress (Nosetto et al 2009, Zipper et al 2015, Booth et al 2016) and other meteorological changes associated with wet conditions, such as lower incoming radiation, cooler temperatures, and few growing degree days during the growing season.

Figure 5. Nonlinear responses of crop yield to drought from multivariate adaptive regression splines analysis (MARS) for (a) maize and (b) soybean.
Download figure:
Standard image High-resolution image3.4. Shifts in drought sensitivity over time
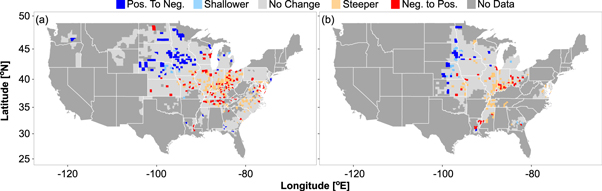
Our results also highlight consistent spatial patterns in changing sensitivity for both maize and soybean between the 1958–1982 and 1983–2007 periods (figure 6). We observe that shifts towards reduced drought sensitivity, defined as a lower slope of the relationship between yield and SPEI, are prevalent in the northern and western parts of the study domain (NE Iowa, Nebraska, Minnesota, Dakotas), while increased drought sensitivity is more common in the central and southeastern part of the study domain (Ohio, Kentucky, Tennessee, Illinois, southern Indiana).
Figure 6. Shift in the crop yield response to drought between 1958–1982 and 1983–2007 periods for (a) maize and (b) soybean. 'No Change' category means no significant changes in slope (p > 0.05) between the two intervals. Shallower indicates that the slope of the relationship between yield anomaly and SPEI was lower in 1983–2007 than 1958–1982, and 'Pos. To Neg.' indicates that the slope shifted from positive (lower yield during meteorological drought) to negative value (higher yield during meteorological drought). 'Steeper' indicates that the slope increased and 'Neg. To Pos.' that the slope shifted from negative to positive between 1958–1982 and 1983–2007 intervals. Categories of 'Steeper' and 'Neg. To Pos.' indicate increasing drought sensitivity, whereas 'Pos. to Neg.' and 'Shallower' indicate decreasing drought sensitivity.
Download figure:
Standard image High-resolution image
4. Discussion
One of the grand challenges at the heart of the food–energy–water nexus is ensuring global food security for a growing population while conserving land and water resources; accomplishing this requires maximizing productivity and managing variability on existing agricultural lands, in addition to other strategies including reducing agricultural inputs and food waste (Foley 2005, Gleeson et al 2010, Wada et al 2010, 2012, 2014, Foley et al 2011, McLaughlin and Kinzelbach 2015). In order for agricultural systems to effectively adapt to climate change, it is imperative to understand how climate variability, particularly extremes such as drought, impacts agricultural production (Rosenzweig and Tubiello 2007, Chen et al 2014). In this study, we quantify spatio-temporal patterns of drought sensitivity of US maize and soybean production to identify both where and when meteorological drought shows the strongest association with changes in agricultural production.
Our results reveal large spatial variations in drought impacts and sensitivity (figure 2), with drought associated with an average of ∼13% of observed county-level yield variability for both maize and soybean, with R2 > 50% in some regions. Relatively consistent spatial patterns were detected between maize and soybean; we hypothesize that county-level variability in drought sensitivity is controlled primarily by local physical features, including soil water retention characteristics and availability of shallow groundwater, as the SPEI does not take into account soil water or groundwater storage (Ma et al 2014). The Atlantic Coastal Plain, for instance, has highly variable growing season precipitation (Busscher et al 1992) and sandy soils, which can increase drought sensitivity due to poor water retention (Busscher et al 1992, Zipper et al 2015).
Low or negative drought sensitivity also tends to cluster on the edge of agriculturally productive areas (e.g. northern Wisconsin and Michigan, the western Dakotas in figure 2). This aligns with globally observed patterns showing that drier conditions can increase NPP in boreal regions (Chen et al 2013) and is likely associated with our focus on meteorology, rather than soil moisture, as a drought indicator. We hypothesize that negative drought sensitivity in these regions is due to increased solar radiation and temperatures accompanying drier growing seasons which overshadow potential negative impacts of drought; this is supported by previously work which demonstrated that higher temperatures are associated with positive yield anomalies over the northern and western Great Plains (Lobell and Asner 2003).
We also observe that negative drought sensitivity occurs in regions where a supplemental source of water, such as irrigation or shallow groundwater, is available to crops but not considered in the calculation of SPEI, and thus mitigates drought stress (Mishra and Singh 2010). For example, negative drought sensitivity is associated with some regions that have characteristically shallow water tables and poorly drained soils, such as the Des Moines lobe in northeastern Iowa (figure 2), suggesting that production in regions with shallow groundwater may be buffered from drought. Previous work has shown that crops can receive a groundwater yield subsidy (defined as an increase in yield due to the presence of shallow groundwater; Zipper et al 2015), particularly during drought (Ayars et al 2005, Nosetto et al 2009, Soylu et al 2014, Zipper et al 2015, Booth et al 2016), and recent work has suggested that shallow groundwater may locally exert an influence over the surface energy balance in areas including northeastern Iowa and eastern South Dakota (Hain et al 2015).
A second widespread supplemental water source is irrigation (Ozdogan and Gutman 2008, Hain et al 2015). Not surprisingly, results from our irrigated case study in Nebraska indicate that irrigation effectively decouples crop productivity from drought (mean adjusted R2 for irrigated crops = 8.7%) (figure 3). These results agree with previous studies (e.g. Troy et al 2015, Araujo et al 2016) which document a reduction in crop yield sensitivity to dry conditions when irrigation is used as a mitigation tool. While irrigation may be an effective tool for reducing sensitivity to drought, groundwater abstraction already exceeds sustainable yield in many aquifers and is increasing in many regions, both in the US and worldwide, including the agriculturally important High Plains and Central Valley systems (figure S2; Gleeson et al 2010, 2012, Wada et al 2010, 2012). Therefore, a cautious approach incorporating additional irrigation as a short-term drought response along with other drought impact mitigation practices, such as reversing a trend of declining agroecosystem crop diversity (Aguilar et al 2015), which is associated with increased drought sensitivity (Lin 2011). Continued advances in plant breeding and genetics for more drought tolerant crops may also contribute to future reductions in drought sensitivity (Boyer and Westgate 2004, Cattivelli et al 2008, Gosal et al 2009, Manavalan et al 2009).
Our results also reveal that short-term droughts (1–3 month) occurring in the critical reproductive period of the growing season (July–August) tend to be the dominant driver of yield variability, with soybeans slightly more susceptible to droughts later in the growing season (figure 4). Not surprisingly, short drought timescales are more important than long timescales for yield responses of the annual crops studied here, because crop growth and performance is more sensitive to short-term weather events that rapidly and substantially alter soil moisture conditions (Wu and Wilhite 2004). This result differs from studies showing the importance of long-term drought on perennial and natural ecosystems (Anderegg et al 2013, Barbeta et al 2015), and underscores the importance of managing for short-term drought in annual cropping systems. The observed critical timing of July (maize) and August (soy) agrees well with previous results that demonstrate that the period at or near pollination is most critical for eventual grain yield and further highlights the need for precision agricultural approaches including monitoring and risk assessment from both meteorological and agronomic drought during (NeSmith and Ritchie 1992, Otegui et al 1995, Paz et al 1998, Çakir 2004, Wu and Wilhite 2004, Wu et al 2004).
Moreover, short-term drought has nonlinear effects on crop yield, with extremely low and high values of SPEI damaging to both maize and soy production (figure 5). These nonlinear effects are consistent with the physiological understanding of crop growth in which under extremely negative SPEI conditions, plant growth is suppressed due to water stresses and may even reach thresholds that cause plant mortality, while at high SPEI values excess moisture and accompanying oxygen stress likely lead to yield losses (Nosetto et al 2009, Zipper et al 2015, Booth et al 2016). This interpretation agrees with Troy et al (2015), which found a threshold-type response of both maize and soybean to temperature and precipitation extremes. Overall, potential nonlinear effects imply that using a linear relationship at the county level may underestimate the negative impacts of drought during the most extreme conditions, indicating that our estimates of drought sensitivity may be conservative.
Furthermore, we observe spatially distinct shifts in drought sensitivity across the US, with increasing drought sensitivity in central and southeastern counties, and reduced sensitivity in the northern and western part of our study domain (figure 6). Increasing drought sensitivity may be explained by shifts towards higher yielding cultivars across much of the US; breeding and biotechnology, which has led to significant increases in yield (figure 1(e)) (Cattivelli et al 2008). However, as absolute yield during normal conditions increases, the magnitude of potential yield losses due to drought has also risen. While work in Africa has attributed increasing yield sensitivity to meteorological conditions to reduced soil fertility (Shi and Tao 2014), this is likely not the case in the US where there is a large surplus in fertilizer applications (MacDonald et al 2011). In contrast, previous work indicates that increased drought sensitivity has accompanied recent maize yield increases in Indiana, Illinois, and Iowa, and may be attributed to the elimination of other potential drivers of yield loss (e.g. nutrient deficiency) by modern agricultural practices (Lobell et al 2014). These results further highlight that the historically productive central and southeastern US may be at higher risk from drought, particularly when drought occurs during critical reproductive stages of crop development (Campos et al 2004). Interestingly, decreased drought sensitivity in the northern and western part of the study domain corresponds with areas in which agricultural land use has expanded recently into areas previously considered marginal (e.g. eastern South Dakota), which already has a significant environmental footprint (Wright and Wimberly 2013, Lark et al 2015, Reitsma et al 2015). Collectively, this analysis reveals patterns of shifting sensitivity which shed light on the spatial vulnerability of current US cropping systems and further suggests locations where adaptation is necessary to reduce losses during future drought.
However, it is important to note two potential limitations to the SPEI for agricultural applications. First, it is a measure of meteorological drought, and therefore may not reflect the actual soil moisture regime experienced by crops. While soil moisture-based methods of drought quantification exist (e.g. Sheffield et al 2004, Narasimhan and Srinivasan 2005, Hunt et al 2009, Carrao et al 2016), observational soil moisture datasets are sparse both spatially and temporally (Hunt et al 2009), and these methods typically rely on either modeled or satellite-derived input data when being applied over large spatial scales. Recent land surface modeling efforts, however, indicate that the majority of soil moisture variability over our study area is driven by the growing season precipitation deficit, which indicates there is likely a strong connection between meteorological and agronomic drought over our research area (Livneh and Hoerling 2016). Second, the SPEI uses reference evapotranspiration, which is meant to represent the atmospheric demand for water standardized to a grass reference crop, rather than the actual evapotranspiration rate (Allen et al 1998). This approach may overestimate the precipitation deficit early in the growing season and/or underestimate the precipitation deficit during the peak growing season, when actual evapotranspiration may be ∼10%–20% greater than reference conditions (Allen et al 1998). Thus, as SPEI is calculated based only on meteorological input data, our results assess the sensitivity of maize and soybean yield to meteorological drought.
Overall, these results highlight the challenge of sustaining a stable food supply in the face of drought (Cattivelli et al 2008). Our results contribute to our understanding of climate-induced yield variability by quantifying spatial and temporal variability in drought sensitivity across the US for two major crops—maize and soybean—of which the US contributes to 40% and 35% of global annual production, respectively (FAOSTAT 2015). Such spatiotemporal understanding allows us to identify both where and when meteorological drought is most strongly associated with crop yields, as well as how sensitivity to drought has evolved over time, which can help guide drought response and mitigation at field, county, state, and national levels.
5. Conclusions
In conclusion, we find that drought is associated with an average of 13% of US maize and soybean yield variability over a 50 year period (1958–2007), and that short-term droughts occurring at critical months during the peak growing season are most strongly correlated with yield anomalies. However, there is substantial spatial variability in both the magnitude and direction of drought effects, which we suggest are due to local physical characteristics (e.g. water table depth, soil texture, topography) and agricultural management (e.g. irrigation). In rare cases, we observe that the effects of meteorological drought can be beneficial, particularly in marginal lands or areas with a supplemental water source, which likely corresponds to areas with a net positive annual water balance. In both maize and soybean, the yield response to drought has changed over time in a spatially distinct pattern, with areas in the north and west of the US' crop-producing region becoming less sensitive to drought, and areas in the central and southeast becoming more sensitive. Furthermore, by considering only yield, we also likely underestimate the sensitivity of total agricultural production, as harvested area has also been observed to decrease in response to drought (Lesk et al 2016). Coping with future drought challenges requires a multi-pronged approach (Foley et al 2011, McLaughlin and Kinzelbach 2015), including development of more drought-tolerant cultivars as well as sustainable adoption of agronomic mitigation practices such as irrigation. Our study provides detailed spatio-temporal analysis of long-term drought effects on crop production and highlights where research, management, and policy changes may be needed to buffer future crop production from anticipated changes in drought frequency and severity. As the US contributes disproportionally to global crop production, our results have significant implications for global agricultural output and, hence, food security.
Acknowledgments
The authors were supported by a graduate student pursuit from the National Socio-Environmental Synthesis Center (SESYNC) and the National Science Foundation Water Sustainability & Climate program (DEB-1038759). We gratefully acknowledge comments from the editorial staff and two anonymous reviewers, which significantly improved the quality of the manuscript.