

Abstract
Field measurements, satellite observations, and models document a thinning trend in seasonal Arctic lake ice growth, causing a shift from bedfast to floating ice conditions. September sea ice concentrations in the Arctic Ocean since 1991 correlate well (r = +0.69, p < 0.001) to this lake regime shift. To understand how and to what extent sea ice affects lakes, we conducted model experiments to simulate winters with years of high (1991/92) and low (2007/08) sea ice extent for which we also had field measurements and satellite imagery characterizing lake ice conditions. A lake ice growth model forced with Weather Research and Forecasting model output produced a 7% decrease in lake ice growth when 2007/08 sea ice was imposed on 1991/92 climatology and a 9% increase in lake ice growth for the opposing experiment. Here, we clearly link early winter 'ocean-effect' snowfall and warming to reduced lake ice growth. Future reductions in sea ice extent will alter hydrological, biogeochemical, and habitat functioning of Arctic lakes and cause sub-lake permafrost thaw.
Export citation and abstract BibTeX RIS
Changes were made to this article on 16 September 2016. The acknowledgements has been updated.
1. Introduction
Arctic coastal lowlands in northern Alaska, western Canada, and Siberia are lake-rich, with lakes representing 20%–40% of the land surface mosaic (Duguay et al 2003; Hinkel et al 2005, Smith et al 2007, Grosse et al 2013, Jones and Arp 2015). Lakes in these regions have largely formed from or are influenced by the presence and degradation of near-surface permafrost (Hopkins 1949, Jorgenson and Shur 2007, Grosse et al 2013). Ice thickness relative to lake depth sets a fundamental regime of these lakes with a large proportion freezing solid with bedfast ice by the end of winter. For example, on the Barrow Peninsula in May of 1992, 77% of the lakes froze completely solid, with the remaining lakes having floating ice atop liquid water (Jeffries et al 1996). More recent and broader inventories of lake ice regimes, that included very small lakes, shows that 72% had bedfast ice regimes and that these conditions accounted for 52% of the lake surface area across the entire North Slope of Alaska (Grunblatt and Atwood 2014). The impact of bedfast ice lakes on permafrost is profound because frozen ground is preserved where mean annual bed temperatures are below 0 °C, whereas in slightly deeper lakes, liquid water maintained below floating ice creates thawed zones in the sub-lake permafrost (Brewer 1958, Lachenbruch et al 1962, Ling and Zhang 2003). Time-series analysis of late winter radar imagery on the Barrow Peninsula starting in 1992, however, shows that 36% of lakes with bedfast ice had shifted to a floating ice regime by 2011 (Surdu et al 2014), with similar shifts documented in other regions of northern Alaska (Arp et al 2012). This regime shift in shallow thermokarst lakes is attributed to thinner lake ice growth caused primarily by warmer, snowier winters (Arp et al 2012), yet the broader climatic processes driving this regime shift are not fully understood.
Analysis of the climate record from Barrow, Alaska shows a 2.7 °C increase in air temperature between 1979 and 2012 coinciding with a period in which sea ice concentrations declined by 15% (Wendler et al 2014). At the onset of the Arctic winter, October, open-water extent increased by 45% off the Barrow coast and air temperature (+7.2 °C) and precipitation (+48 mm) increased substantially. Analysis of the ERA-Interim reanalysis data from 1989 to 2008 also show the greatest warming in the autumn attributed to increases in atmospheric water content from more open water that enhances surface warming (Screen and Simmonds 2010). This mode of Arctic amplification has also been observed from satellite data showing the highest increase in surface temperatures in November and strongly increasing open-ocean evaporation from August to October (Boisvert and Stroeve 2015). Enhanced precipitation has been observed in Barrow (Wendler et al 2014) including a trend towards higher early winter (defined as October–November–December) snowfall (Arp et al 2012) delivered primarily from storms tracking off the Arctic Ocean. An increase in heavy snowfall events in the Arctic and more widely throughout the Northern Hemisphere have also been linked to greater moisture flux from reduced sea ice (Liu et al 2012, Bintanja and Selten 2014). Warmer air temperatures and higher snowfall in the early winter strongly impact the degree of refreeze of the active-layer (Jafarov et al 2014) as well as ice growth on freshwater lakes and ponds (Zhang and Jeffries 2000) that propagates through to late winter and spring. A focused experiment on the impact of reduced sea ice concentrations in the Arctic Ocean on early winter climate and the influence on seasonal lake ice growth is thus warranted.
Sea ice decline (Stroeve et al 2007) is one of the major causes of amplified Arctic warming and moistening (Serreze et al 2009, Screen and Simmonds 2010) that extends well beyond the Arctic Ocean to terrestrial systems (Post et al 2013). Cold season warming associated with rapid sea ice loss events may propagate 1500 km inland resulting in permafrost degradation (Lawrence et al 2008). Sea ice loss induced warming and changing seasonality are believed to be contributing to earlier green-up of vegetation and increased terrestrial primary productivity (Bhatt et al 2010). Record low (second lowest) sea ice extent, along with dry and warm conditions in northern Alaska in 2007, have been linked to the large Anaktuvuk River fire (Hu et al 2010) suggesting that presently observed and projected future warming may be contributing to episodic releases of terrestrial carbon stored in the tundra (Mack et al 2011). However, establishing the linkage between components in complex systems (e.g. sea ice and tundra fires) based on correlation of time-series data can be challenging (Post et al 2013, Alexeev et al 2015).
Inferring causality between correlated time-series presents a fundamental challenge in understanding complex responses to climate change with the effects of declining sea ice offering a prime example (Post et al 2013). A map pointing at the possible link between sea ice near the northern Alaskan coast and northern Alaska lake ice conditions is shown in figure 1(a). This map of point-by-point correlation between the modeled early winter ice thickness for lakes on the North Slope and 0.25° × 0.25° sea ice concentration product developed by Walsh et al (2014) shows a strong signal in the Beaufort and Chukchi seas. Therefore more sea ice in the fall should mean thicker lake ice in the early winter. Accordingly, the sea ice concentration in September also correlates well with the declining extent of late winter bedfast ice near Barrow, AK (figure 1(e) Surdu et al 2014). These observations serve as the basis for our experimental design. Here we address this challenge by performing a model experiment using a Weather Research and Forecasting (WRF) regional climate model and utilizing the output from that model to diagnose the growth of lake ice in two winters with drastically different maximum lake ice thickness (MLIT) measurements, availability of satellite image classified lake ice regimes, and sea ice conditions (1991/92 and 2007/08). WRF is forced with NCEP/NCAR reanalysis data (NNRP) for those two winters which also had significantly different sea ice coverage: the fall of 2007 being the second lowest year on record, while the fall of 1991 was a year of relatively high sea ice extent, especially near the Alaskan Beaufort Sea coast (figure 1(a)).
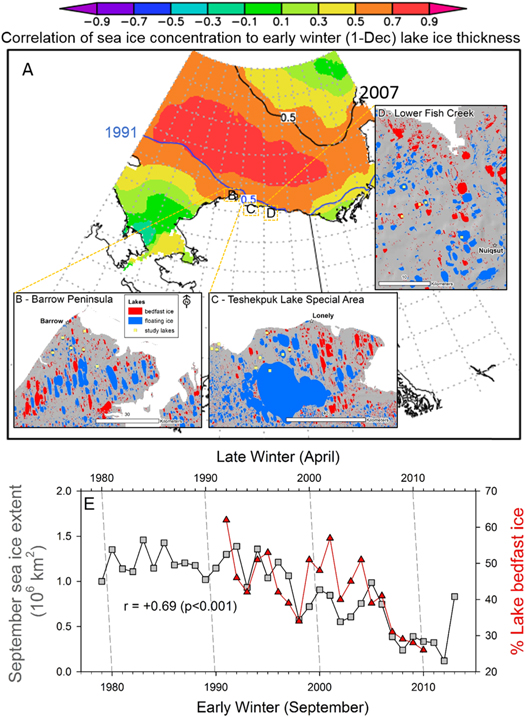
Figure 1. The correlation between early winter sea ice extent and late winter lake ice growth. (a) Map of northern Alaska including the Beaufort and Chukchi Seas. The blue and green lines show the location of September 0.5 contour for sea ice concentration based on Walsh et al (2014) for 1991 and 2007, correspondingly; shaded field shows the correlation between September mean sea ice concentration and modeled early winter lake ice thickness; (b)–(d) inset maps showing the abundance of lakes with both bedfast-(red) and floating-(blue) regimes in 2009 (from Grundblatt and Atwood (2013)). (e) Time series of September Arctic sea ice extent (based on Walsh et al 2014 for the area shown in figure 1(a), gray squares) with the percentage of late winter observed bedfast lake area from ERS-1/2 satellite radar imagery (red triangles; from Surdu et al 2014).
Download figure:
Standard image High-resolution imageTo control for the effects of sea ice, we imposed the 1991/92 sea ice conditions on the 2007/08 winter atmosphere, and visa versa, to produce forcing datasets for a lake ice growth model. The results of these experiments were used to quantify and compare the relative role of sea ice presence or absence in the early winter in the Beaufort Sea on end of winter MLIT and lake ice regimes so that the impact of continued sea ice loss can be evaluated relative to other mechanisms.
2. Methods
2.1. The experiment, reanalysis data and WRF model
For our experiment, we ran the WRF model in a limited area mode when MLIT measurements of >2 m were reported (1991/92) (Jeffries et al 1996, Zhang and Jeffries 2000) and also during 2007/08 when MLIT measurements were 1.5 m. As noted above, the Beaufort Sea was almost completely ice covered in the early winter of 1991, while the situation was drastically different in 2007 (figure 1(a)). The experiment consisted of two separate sets of runs: (1) running 'regular' 1991/92 and 2007/08 winters with sea ice from the corresponding years; and then: (2) replacing ocean surface conditions (sea ice and SST) in 1991/92 with those from a year of low sea ice concentration in the study domain (2007/08), and vice versa—replacing surface conditions of 2007/08 with those from 1991/92. This was done in order to test whether the lateral atmospheric forcing played a role in forming early winter response in solid precipitation and air temperatures, which are the key drivers of lake ice growth, end of winter MLIT, and ultimately the landscape composition of lake ice regimes. The model was run at a 15 km horizontal resolution, which is deemed sufficient enough to resolve the most essential feature in this simulation—extent of sea ice. The model was driven with 6-hourly NCEP/NCAR reanalysis (NNRP) data (Kalnay et al 1996, Kistler et al 2001). The NNRP product was chosen because it is readily available and produces very reasonable results in the study region. ERA-Interim (Dee at al 2011) is also widely used for regional climate simulations with WRF. We feel that the choice of reanalysis product was not critical for the results, which is why we chose NNRP. Without going into further details, first and foremost important factor guiding our choice of years for this study was that 2007 and 1991 sea ice conditions were vastly different. Also, 1991 was significantly colder than 2007 and the large-scale atmospheric circulation patterns looked different. Nevertheless, (see supplementary section) the effect of sea ice decline on temperature and precipitation looked very similar in both years.
Sea ice concentration and SSTs in the study domain was taken from the standard NNRP release. All model runs started on August 1 and ran until June 1 of the next year. WRF domain, design details and validation experiments confirming the applicability of WRF in our case are described in the supporting information (text S1, figures S1–S5).
It is logical to assume that the presence of open ocean water in the Arctic Ocean could be important for air temperature and the amount of moisture in the air across the North Slope of Alaska. The model experiments are summarized in table 1. The names of experiments are formed based on the year of atmospheric lateral forcing and type of surface conditions, e.g.: 2007—a 'regular' 2007 run with surface and atmospheric forcing taken from the corresponding year; 1991ice2007—1991/92 NCEP/NCAR atmospheric forcing with ice surface boundary conditions from 2007/08. Winter air temperature and snow water equivalent from WRF runs are given for Barrow (early winter is October–November–December, late winter is January–February–March).
Table 1. List of experiments with WRF and a summary of model output for each experiment (early winter is October–November–December and late winter is January–February–March for air temperature and snow-water equivalent means; for lake ice early winter is 1-December and late winter is the maximum lake ice thickness typically recorded in late May or early June).
| Experiment name | Atmospheric boundary conditions | Surface boundary conditions | Winter air temperature (°C) (early/late winter) | Snow-water equivalent (mm) (early/late winter) | Lake ice thickness (m) (early/late winter) |
|---|---|---|---|---|---|
| 1991 | 1991/92 | 1991/92 | −23.6/−31.0 | 22.0/51.8 | 0.91/2.04 |
| 2007 | 2007/08 | 2007/08 | −14.2/−30.3 | 37.0/100.7 | 0.59/1.48 |
| 1992ice2007 | 1991/92 | 2007/08 | −20.0/−30.9 | 25.3/52.2 | 0.70/1.91 |
| 2007ice1991 | 2007/08 | 1991/92 | −17.0/−30.4 | 29.7/99.8 | 0.81/1.62 |
In the results section, the 2007–1991 difference in temperature and precipitation will be compared with 2007 and 1991 runs where sea ice and sea surface temperature were swapped with values from 1991 and 2007, respectively. The 2007–2007ice1991 difference will give us the effect of low sea ice extent in 2007, and correspondingly, 1991–1991ice2007 will give the same for 1991. Our experiments indicate that the temperature response in both cases is quite similar (supporting information, figure S2), although the winds were different for the two years (supporting information, figure S6), which validates the technique.
2.2. Ice thickness observations, simulations, and ice regime analysis
Records of lake ice thickness (Zice) measured in late winter (mid-March to early May) when the ice is near its MLIT have been made systematically on several lakes on the Barrow Peninsula starting in 2003 (ALISON) (Morris and Jeffries 2010) and on several lakes on the Alaskan North Slope including the Arctic Coastal Plain (ACP) since 2012 (CALON) (Arp et al 2015) (figure 1(c)). Additional lake ice measurements for this late winter period have previously been reported and summarized going back to 1962 (Arp et al 2012). MLIT is estimated from these field observations using the modified Stefan equation (Stefan 1890, USACE 2004) (supporting information, text S2). Lake ice growth and thickness for the entire winter was simulated using a model based on Stefan's Law (Lepparanta 1983) (supporting information, text S1), forced with air temperature and snow depth data on a daily time-step from the National Weather Service station in Barrow, AK (station WBAN # 700260, WMO # 27502). WRF output interpolated to Barrow location of air temperature and snow-water equivalent (SWE, converted to snow depth by assuming a standard density) from each of the four experimental runs were used to force the ice growth model. Sensitivity analysis of ice growth models also using Barrow climate data show that snow is the key driver of interannual variability (Zhang and Jeffries 2000) and that Arctic Alaska lake snow depths and densities deviate from tundra snow by approximate factors of 0.6 and 1.3, respectively (Sturm and Liston 2003). Accordingly, we simulated lake ice thickness over the period spanning our climate-sea ice experiments using these corrections and with 'no-snow' and '2X-snow' scenarios compared with observational 1-December ice thickness and MLIT data. The relationship of MLIT to the proportion of bedfast-ice lakes and floating-ice lakes is based on late winter synthetic aperture radar imagery (ERS-1/2) and analysis for the Barrow Peninsula in northern Alaska from 1992 to 2011 presented by Surdu et al (2014) (supporting information, figure S9).
3. Results
3.1. Reciprocal sea ice experiment
The difference in lake ice growth between the experiments 2007 and 2007ice1991 shows the effect of more open ocean water in 2007. The associated delayed freeze-up in 2007, which was simulated by prescribing sea ice from 1991/92 in the 2007 experiment, led to a significant warming on the ACP (figure 2(a)), presented by the difference in air temperature between experiments 2007–2007ice1991. The positive temperature anomaly, which is most pronounced in the coastal areas (figure 2(a)) was part of a large-scale warm anomaly over the ocean (supplementary information, figures S2(c) and (d)). The difference in precipitation between these two experiments averaged over October–November–December is shown in figure 2(b). This difference represents what can be called 'ocean effect' snow. The amount of extra precipitation that fell on the ground because of more open ocean water, was higher by 10–20 mm of SWE (which can amount up to about 15%–20% of WRF-modeled SWE in the total snow depth) in some areas of the North Slope in the 'regular' 2007 run compared to the run with the sea ice from 1991. Open water area next to the Alaskan coast contributed to the higher temperatures and availability of moisture in the air (figure S7), which explains the more intensive snowfall in the 2007 early winter when sea ice was far removed from the ACP coast.
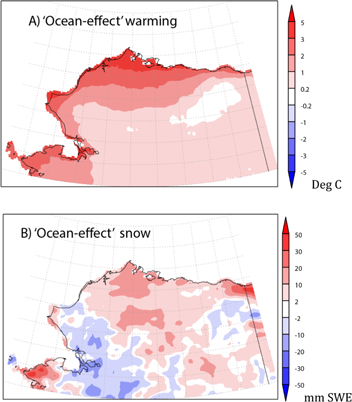
Figure 2. 'Ocean effect' warming and snow as a result of less sea ice. (a) 'Ocean effect' warming in northern Alaska in 2007, difference between October–November–December mean air temperature (deg K) in two runs 2007 and 2007ice1991, (b) 'ocean-effect' snow, difference between October–November–December snow accumulation in two runs 2007 and 2007ice1991, mm of water equivalent.
Download figure:
Standard image High-resolution image3.2. Lake ice growth forced by WRF output
WRF temperatures and precipitation fields obtained in our experiments were applied to a model of lake ice growth (supporting information, text S2, equation (1)) (figure 3). MLIT for the two years used in the analysis are reproduced very well (observations are shown by circles). When our lake ice model was forced with data from experiments with swapped sea ice and surface temperature, the modeled lake ice thickness changed consistently in both years. Lake ice thickness forced with WRF output from 2007ice1991 (which resulted in colder temperatures and less precipitation) increased 9% when compared to the regular 2007 run. Similarly, lake ice thickness in the 1991ice2007 WRF run decreased by 7% (by approximately the same difference as in 2007–2007ice1991 case) compared to the regular 1991 run, because the temperatures are warmer and more precipitation is formed (because of less sea ice). Generally speaking, the 1991ice2007–1991 differences in air temperature and precipitation are qualitatively similar to 2007–2007ice1991 (figures S2 and S5). The impact of reduced MLIT in the 1991ice2007 experiment on the area of lakes frozen solid by the end of winter (bedfast ice) was estimated to decrease by 9%, whereas in the opposing experiment (2007ice1991) we estimate the area of bedfast ice increased by 13% (figure 3(b)).
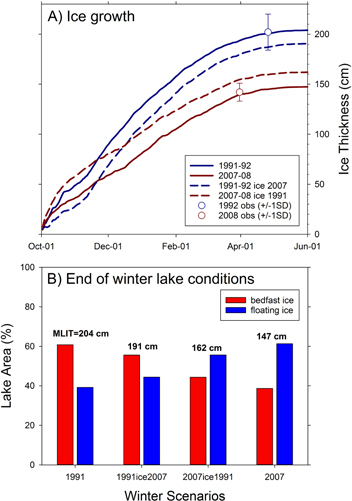
Figure 3. The reciprocal model experiment applied to lake ice growth simulations. (a) Simulated ice growth curves for the four model experiment scenarios (1991, 2007, 1991ice2007, and 2007ice1991) compared to field measurements and (b) the expected impact of maximum ice thickness (MLIT, values above bar sets) on the proportion of bedfast ice and floating ice lakes on the Barrow Peninsula based on radar analysis presented in Surdu et al (2014).
Download figure:
Standard image High-resolution imageThe dashed lines in figure 3 (representing lake ice thickness from runs with replaced sea ice/SST) immediately diverge from the corresponding 'regular' runs, but then after ∼2.5 months they converge and more closely track the unperturbed curves. The moment when the differences between the corresponding perturbed and unperturbed runs saturate is determined by the time of the complete freeze-up of the Arctic Ocean in 2007 (late October). This is very much consistent with the fact that the estimated 'ocean-effect' snow, calculated by month for 2007, is expectedly strongest in October (see figure S8 in supplementary section). For example, 2007 SWE was reduced by 9 mm (60%) by then end of October when 1991 sea ice conditions were imposed on atmospheric conditions.
4. Discussion
This study used WRF as a tool for quantifying the effect of declining fall sea ice extent on meteorological drivers (precipitation and temperature) and ultimately on lake ice thickness the following winter. Two years with different early winter sea ice extent and lake ice thicknesses on the North Slope were chosen for comparison (1991/92 and 2007/08). The effect of sea ice on the temperature and precipitation the following winter is quantified by replacing sea ice and SST in 2007 run by those from 1991 and similarly for 1991, and analyzing the differences. The obtained differences were used to force a lake ice growth model and as a result our estimate for the effect of low sea ice area in 2007 is 15 cm thinner ice compared to a year (1991) when the Arctic Ocean was almost completely ice covered by October. Based on a recent analysis of the spatial extent of bedfast ice on the Barrow Peninsula (Surdu et al 2014), an additional 15 cm of lake ice equates to a 13% increase in bedfast ice extent. Similarly, forcing the ice growth model with 1991/92 climate with 2007 sea ice extent resulted in 13 cm reduction in ice thickness and corresponding 9% decrease in bedfast ice extent for lakes on the Barrow Peninsula.
Satellite observations of bedfast ice extent from 1992 to 2011 on the Barrow Peninsula show a decline of 11% per decade (Surdu et al 2014) and 21% per decade for lakes near Nuiqsut, AK between 1980 and 2011 (Mellor 1987, Arp et al 2012). These multi-decadal observed changes in lake ice regime are of similar magnitude as suggested by our experiments that isolate the impact of sea ice extent on early winter climatology and corresponding late winter lake ice thicknesses. The precipitous decline in sea ice over this period is correlated to these shifts in lake ice regimes (r = +0.69, p < 0.001). Our model experiments clearly demonstrate the link sea ice extent has on climate processes impacting terrestrial freshwater systems, thus going beyond simple correlation of sea ice dynamics (Post et al 2013) and establishing a clear causative and quantifiable link to sea ice decline and variability.
A shift in the balance of lakes with bedfast and floating ice regimes extends beyond lacustrine ecosystem dynamics. The high abundance of thermokarst lakes often covering 20%–40% of Arctic lowlands is owed to ice-rich continuous permafrost that allows their formation, continued expansion, and eventual drainage (Grosse et al 2013). The ice regime of a lake links its surface dynamics to sub-lake permafrost by creating deep thaw zones (taliks) below lakes with floating ice regimes (Brewer 1958, Lauchenbroch 1962, Zhang and Jeffries 2000). Thus, besides the fundamental warming and wetting driven by declining sea ice and its link to regional permafrost degradation (Lawrence et al 2008), an enhanced sea-ice driven regime shift in Arctic lakes towards floating ice conditions will accelerate permafrost thaw widely where bedfast lakes previously dominated. Ice-out timing and open-water evaporation also diverge sharply by a lake's ice regime creating additional changes in terrestrial surface energy and moisture balance (Arp et al 2015). These changes are in addition to the more apparent dichotomies in ecosystem services provided by lakes with bedfast and floating ice regimes, such as the provision of overwintering fish habitat and winter water supply for industry and municipalities in the Arctic (Jones et al 2009).
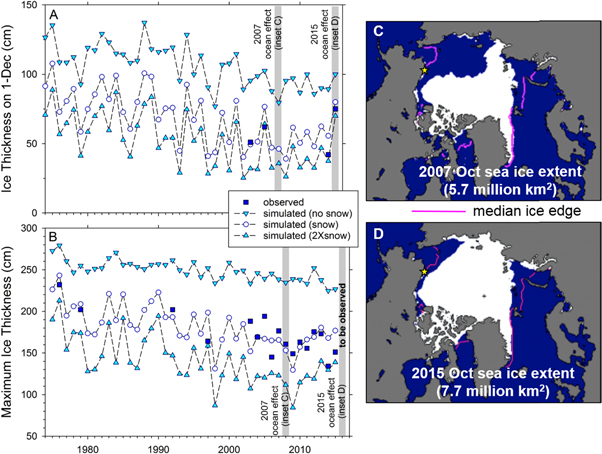
Our very recent observations of lake ice thickness on the Barrow Peninsula (figure 1(b)) and the area north of Teshekpuk Lake (figure 1(c)) in November 2015 (figure 4(a)) reflect the fact that there was very little snow (<5 cm) on lake surfaces. As a result the early winter lake ice thickness as of 1-December 2015 was simulated to be 81 cm and a new real-time ice thickness buoy on Teshekpuk Lake showed that ice thickness surpassed 80 cm on that date (http://arcticlakeice.org/real-time-data/). Compared to the historic record of simulated early winter (1-December) ice thicknesses, 2015 lake ice is quite thick and similar to 1991 (figure 4(a)). This apparent deviation from a long-term trend of thinner early winter ice thickness and declining MLIT however, matches observed high sea ice extent in October 2015 (figure 4(d)), with the ice pack close to the Beaufort Sea coastline.
Figure 4. October ocean-effect snow drives variable lake ice growth. (a) Early winter lake ice thickness estimated from lake ice growth model forced with observed snow (open circles) and double- and no-snow on the North Slope; (b) same as in (a) for maximum lake ice thickness; (c) and (d) 2007 and 2015 October sea ice extent (figures from the National Snow and Ice Data Center (NSIDC), Barrow, AK indicated with a gold star).
Download figure:
Standard image High-resolution image
October ocean-effect snow drives variable lake ice growth
The importance of these processes is further exemplified by modeling scenarios of no-snow on lakes, compared to observed snow depth data (based on lake-corrected tundra station data), and 2X-snow depth simulations (figure 4). Snow-free conditions can readily occur depending on timing of freeze-up relative to snowfall and associated wind regimes during and after snowfall in the early winter (Sturm and Liston 2003). No-snow simulations grow thick lake ice, averaging 2.5 m MLIT and ranging from 2.2 to 2.8 m, similar to results by Zhang and Jeffries (2000) showing maximum ice thickness of 2.4 m. Such a snow-free scenario would freeze nearly all lakes solid on the Barrow Peninsula (figure 1(b)) and the Teshekpuk Lake Special Area (figure 1(c)) on outer ACP of northern Alaska. Conversely, twice the estimated snow depth on lakes would result in an average MLIT of 1.4 m, ranging from 0.8 to 2.1 m (figure 4(b)), such that majority of lakes would have liquid water and degrading sub-lake permafrost. These extreme snow scenarios highlight the important role of snow on lake ice growth and our analysis indicates that sea ice extent in the early winter exerts a first order control on freshwater ice growth conditions. Even historically normal snowfall, if associated with high wind conditions, can yield essentially snow-free bare ice conditions that will grow very thick ice under normal Arctic winter temperature regimes. The current winter 2015/16 may provide an example of such conditions.
In years when fall sea ice is close to the Beaufort and Chukchi Sea Coast, air temperature is cold and little moisture is available for precipitation. Conversely, large open ocean water extents in the early winter, which are increasingly common and projected to increase substantially in the future (Barnhart et al 2016), will produce weather patterns (warmer temperature and more snow) that reduce lake ice growth resulting in an accelerated regime shift in the many shallow lakes located in Arctic coastal lowlands. The 'ocean-effect' snow deserves special attention as it can be particularly impactful because of its timing in relation to freeze-up and potential to yield very high snowfall accumulation in short periods of time, similar to lake-effect snowstorms (Burnet et al 2003). Uncertainty about the frequency and magnitude of 'ocean-effect' snow as sea ice diminishes is likely a key question that will have strong implications for future shifts in lake ice regimes and loss of sub-lake permafrost.
Acknowledgments
Funding for this study was provided primarily by the National Science Foundation (ARC-1417300, 1203473) with additional funding from the Arctic Landscape Conservation Cooperative, the US Geological Survey Alaska Science Center, the Bureau of Land Management Arctic Field Office and Alaska EPSCOR. We thank Andrew Parsekian, Ben Gaglioti, Guido Grosse, Richard Beck, and Matthew Whitman who assisted with field work and logistics for this study. Additional logistical support was provided by the staff from Community Polar Services, Inc., and Toolik Field Station. The majority of data used in this analysis are publically available at https://aoncadis.org/ and available at http://arcticlakes.org/. Any use of trade, product, or firm names is for descriptive purposes only and does not imply endorsement by the US Government.