

Abstract
Some of the most damaging impacts of climate change are a consequence of changes to the global water cycle. Atmospheric warming causes the water cycle to intensify, increasing both atmospheric water vapor concentrations and global precipitation and enhancing existing patterns of precipitation minus evaporation (P − E). This relationship between temperature and precipitation therefore makes understanding how precipitation has changed with global temperatures in the past crucial for projecting changes with future warming. In situ observations cannot readily estimate global precipitation sensitivity to temperature (dP/dT), as land precipitation changes are affected by water limitation. Satellite observations of precipitation over ocean are only available after 1979, but studies based on them suggest a precipitation sensitivity over wet tropical (30N–30S) oceans that exceeds the Clausius–Clapeyron value. Here, we determine for the first time precipitation sensitivity using longer (1930–2005), island-based in situ observations to estimate dP/dT over islands. The records show a robust pattern of increasing precipitation in the tropics and decreasing precipitation in the subtropics, as predicted from physical arguments, and heavy precipitation shows a stronger sensitivity than mean precipitation over many islands. The pattern and magnitude of island-based dP/dT agree with climate models if masked to island locations, supporting model predictions of future changes.
Export citation and abstract BibTeX RIS
1. Introduction
Rising global temperatures will result in substantial changes to the Earth's hydrological cycle, with warmer temperatures leading to increasing global precipitation [1]. While the observed and modeled sensitivity of atmospheric water vapor concentrations to warming is consistent with the Clausius–Clapeyron relationship [2, 3] (∼7%/K), energy budget constraints lead to a reduced sensitivity of global precipitation to warming (dP/dT) in climate models and satellite observations of ∼2%–3%/K [4, 5]. At regional scales, precipitation sensitivity is expected to vary greatly due to increasing horizontal transport of atmospheric water vapor [1] combined with atmospheric circulation changes [6–8]. Thus, some parts of the world will get wetter while others get drier, with significant consequences for people and ecosystems. In particular, warming is expected to cause increasing precipitation on average in the tropics and decreasing precipitation in the subtropics, in the respective ascending and descending branches of the Hadley circulation, and this pattern of change is expected to emerge more clearly over the ocean than land [1, 9, 10]. Analysis of satellite observations and climate model data suggests that the expected wet-gets-wetter, dry-gets-drier signal is beginning to emerge [10–13], though this pattern may not apply over land, at least at regional scales [14].
The clearest change in precipitation due to anthropogenic warming is expected to occur over oceans [15]. Analyzing changes to observed precipitation over ocean regions is therefore important for understanding and constraining anthropogenic influences on the global water cycle. Satellite observations of precipitation show increases with temperature over tropical (30N–30S) oceans, with changes that may even exceed the Clausius–Clapeyron scaling in wet regions with dP/dT estimated at 11%–15%/K [5, 11]. However, some climate models appear to significantly underestimate these observed changes [5, 11]. Long observational records of precipitation, particularly over the ocean, would help to reduce uncertainty in estimates of precipitation sensitivity and improve our understanding of this discrepancy. However, observational records over the ocean are sparse in the the pre-satellite era (pre-1979).
In this paper we use in situ island observational records of precipitation from 1930–2005 to calculate precipitation sensitivity in ocean regions and to determine whether long-term observationally based estimates are consistent with physical expectations and climate models. Precipitation sensitivity to global temperature change is used in order to capture the response to large scale warming. By calculating how precipitation changes with global temperature variations rather than analyzing precipitation trends over time, we can remove some of the uncertainties due to changing observational coverage and missing data that affect long-term trends in precipitation [16]. Precipitation trends due to anthropogenic influences are expected to be noisy over the 20th century, emerge slowly, and can be regionally suppressed by the response to anthropogenic aerosols [10, 17]. Precipitation sensitivity is also better suited to compare the behavior between different regions.
While dP/dT is influenced by short-term and long-term variations in global temperature, it shows a robust value across past and future climate [7, 11]. These are compared to estimates from the satellite-based precipitation observations dataset, for 1979–2005, using data masked both to the island coverage and to all ocean to check consistency between observational datasets and to compare the in situ island dP/dT values with those from surrounding ocean regions. Historical climate model simulations are analyzed both using all ocean data and masking to the coverage of the island stations, to evaluate the models compared to both long in-situ and shorter satellite records. It is also important to understand the local impacts of climate change on tropical islands, which are vulnerable to land degradation from soil erosion due to heavy rainfall [18, 19]. As extreme precipitation is expected to increase more than the mean [7, 20] in many regions, we also investigate precipitation sensitivity for the most intense precipitation.
2. Methods
The CRUTS3.22 gauge-based monthly gridded observational precipitation dataset [21] is aggregated to a 1° × 1° grid. The dataset includes measurements for 1901–2013, however we only analyze data from 1930–2005 for which we have sufficient gauge coverage and climate model data. Island gridboxes are selected if less than 1/8 of the surrounding region is land. This criterion avoids selecting coastal regions and large islands. A gridbox is included in the analysis when it contains at least 1 observing station. For each gridbox, the precipitation sensitivity to global temperature, calculated from the HadCRUT4 dataset [22], dP/dT, is calculated in %/K compared to local precipitation climatology. This is done for annual mean precipitation (ANN) and seasonal means for October, November, December (OND), January, February, March (JFM), April, May, June (AMJ), July, August, September (JAS) following Polson et al [13]. It should be noted that the island observations are biased to the tropical wet regions (see figure 1 and table S1). Furthermore, as tropical islands tend to be rainier than nearby ocean [19], all precipitation changes are calculated as a percentage of local climatology. Throughout the paper we refer to in situ station observations to distinguish these from the satellite-based observations. We note that the precipitation dataset used has been interpolated to 1° × 1° gridboxes rather than using individual stations [21] which enables better comparison with climate models.
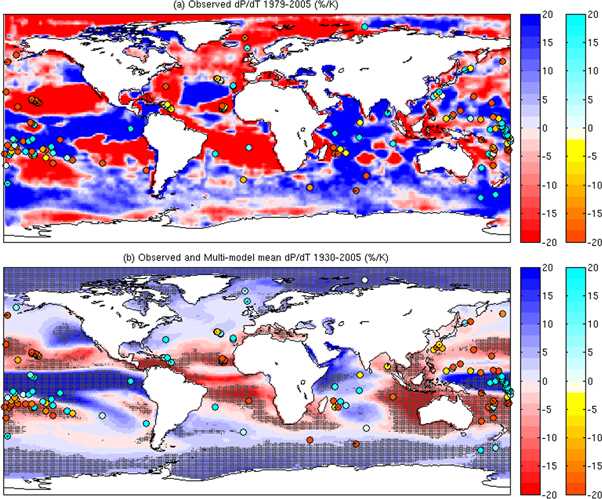
Figure 1. Comparison of annual island-based, model simulated and satellite retrieved pattern of precipitation sensitivity dP/dT (%/K). (a) 1979–2005 for observed islands (CRUTS3.22—dots) and observed ocean dP/dT (satellite-based GPCP—map) with 65% of gridboxes agreeing on the sign of dP/dT, and (b) 1930–2005 for islands observations (CRUTS3.22—dots) and multi-model mean dP/dT for all ocean (map; 71% of gridboxes agreeing on the sign of dP/dT). Hatching shows where ≥75% of simulations give dP/dT of the same sign.
Download figure:
Standard image High-resolution imageThe 2.5° × 2.5° resolution monthly GPCP [23] satellite-based observational dataset is used to compare the results for the island coverage and all ocean for 1979–2005. Precipitation sensitivity is calculated for the satellite observations interpolated to the grid and masked to the island station coverage of CRUTS3.22 and for all ocean. Historical simulations from the coupled model intercomparison project (CMIP) [24] 5 are also analyzed for the periods 1930–2005 and 1979–2005 (see supplement for model information). The model data are aggregated to the same grid as the CRUTS3.22 dataset and masked to both the island data coverage and to all ocean, for the period 1930–2005 and the satellite period 1979–2005.
Only years where precipitation data are available are included in the linear regression of precipitation against temperature at each gridpoint. dP/dT is calculated using an ordinary least square fit slopeline and the uncertainty on the observed dP/dT is calculated from the standard error of the slopeline which will include white noise variability and uncertainty due to errors or inhomogeneities in the observations. Estimates of dP/dT vary with internal variability (included in model spread); however, the uncertainty due to different realizations of internal variability in the same model is similar to that for the slopeline uncertainty for most but not all models (see supplementary material), and the mean ratio of the internal variability to slopeline uncertainty is 1.0.
Island station coverage is not constant with time; therefore area mean dP/dT values are calculated by averaging over all local gridbox dP/dT values. In this case dP/dT is calculated as the absolute change in P per degree K before calculating the area weighted mean dP/dT as a percentage of the area-weighted mean P climatology. This avoids biasing to dry regions where dP/dT will be much larger as a percentage of the local climatology. Area mean dP/dT is calculated for all available island stations (global), all tropical island stations (30°S–30°N), and for the latitudinal bands 40°S–20°S, 20°S–0°, 0°–20°N and 20°N–40°N. This is repeated for all ocean for the satellite observations and models. The area mean dP/dT values are largely insensitive to removing ENSO from the precipitation and temperature data (see supplementary material).
The wet-gets-wet, dry-gets-drier paradigm explains much of the climate model simulated change in precipitation over ocean. To investigate whether the long island records show evidence for this, we calculate tropical mean dP/dT for the wettest regions (there is not sufficient island coverage to investigate the dry regions (table S1)). Mean dP/dT across the wet tropical (30°S-30°N) ocean regions is calculated using a fixed wet region mask derived from the GPCP dataset. For each season individually it is defined as all gridboxes in the upper 33.3 percentile of precipitation in over 2/3 of years [13]. These masks are applied to the CRUTS3.22 dataset and model simulations. Using a fixed mask based on the GPCP dataset allows us to calculate dP/dT for the island stations over the 1930–2005 period, however it does not take account of each model simulation's own climatology, which may shift the location of the wet regions with respect to the GPCP dataset. Nor does it account for changes in the location of the wet regions with time [13]. While the movement of the wet regions would help to identify cleaner signals, this cannot be done, due to sparse data coverage.
Daily precipitation from the global historical climatology network (GHCN) [25] stations and temperature from HadCRUT4 are analyzed to investigate the precipitation sensitivity of extreme precipitation for 1930–2005. Only stations in the islands gridboxes selected from the CRUTS3.22 dataset are analyzed, but not all CRUTS3.22 islands have daily data. A station is included where there are observations in over 60% of days and in all months in each year, where there are more than 40 wet days in a year, and more than half of all years meet these criteria, giving a total of 157 stations. For each station, extremes of dP/dT are calculated for the mean precipitation for all days where P exceeds the 90th percentile of wet day precipitation within each year, P>90, in response to changes in the global annual mean temperature T. dP/dT is also calculated for the ANN, Pann, for each station where daily precipitation data are first averaged to monthly mean, then annual mean values. To test whether the island extreme and mean precipitation sensitivities are statistically different, we use a Mann–Whitney test, where the null hypothesis, H0, is that dP>90/dT and dPann/dT for all islands are from the same population with equal medians and the alternative hypothesis, H1, is that they are from different populations where the median of dP>90/dT > dPann/dT.
3. Results
In situ island stations record a pattern of precipitation sensitivity that is broadly similar to that expected from climate models and satellites (figure 1). For 1979–2005, dP/dT is the same sign in the in situ and satellite observations in 65% of gridboxes, despite relatively coarse resolution of satellite data and large uncertainty of satellite data in high latitudes [23]. Using data for the full record from 1930–2005, the local dP/dT across all tropical (30N–30S) islands significantly exceeds the Clausius–Clapeyron scaling in many regions, with an annual mean value across all tropical regions sampled of 12.7%/K (5%–95% = 8.63%–16.63%/K) for global temperature (table 1) and 12.8%/K using local temperature. Using local temperature rather than global values results in spatial patterns that show local precipitation tending to increase with local temperature, capturing changes due to local interannual variability rather than global temperature. This result is consistent with the tropical mean dP/dT values for the shorter period (1979–2005) from the in situ observations (10.5%/K (5%–95% = −2.55%–23.10%/K)) and the satellite observations masked to the tropical island coverage (14.2%/K (5%–95% = 4.58%–24.23%/K)). The annual tropical mean precipitation sensitivity for all tropical islands is therefore not significantly dependent on the observational dataset or the length of the analysis period, however the uncertainty is substantially reduced when using the longer record. The seasonal tropical mean values also show tropical precipitation tending to increase with temperature; although not always over the shorter satellite period (table 1). For example, OND tropical mean dP/dT is negative for 1979–2005 from both the in situ and satellite observations, but lies within the model spread, suggesting that internal variability could account for the differences between the time periods (see figure S2 for seasonal values).
Table 1. Tropical mean (30°S–30°N) precipitation sensitivity dP/dT (%/K). dP/dT shown for two sets of observations, islands-station based CRUTS3.22 and satellite-based GPCP. Uncertainty range in brackets is 5th–95th percentiles. MMM is multi-model mean, italics show where the multi-model mean is outside the 5th–95th uncertainty range of observations.
| Data | Area | JFM | AMJ | JAS | OND | ANN |
|---|---|---|---|---|---|---|
| 1930–2005 (black) and 1979–2005 (gray) Islands only | ||||||
| CRU | Tropics | 13.8(9.11–18.38) | 15.9(10.05–21.82) | 14.5(7.46–20.96) | 9.7(3.58–15.50) | 12.7(8.63–16.63) |
| 11.2(−3.11–25.41) | 14.3(−3.51–32.42) | 0.1(−19.92–18.34) | −3.1(−21.03–14.17) | 10.5(−2.55–23.10) | ||
| MMM | Tropics | 10.5 | 9.2 | 11.4 | 10.1 | 9.0 |
| 1979–2005 Islands only | ||||||
| GPCP | Tropics | 15.5(4.14–27.13) | 27.9(14.49–41.51) | 7.1(−5.72–19.96) | −10.0(−22.72–3.72) | 14.2(4.58–24.23) |
| MMM | Tropics | 12.7 | 13.2 | 13.2 | 11.8 | 12.9 |
| 1979–2005 All ocean | ||||||
| GPCP | Tropics | 4.0(3.32–4.67) | 4.4(3.77–5.04) | 4.5(3.92–4.99) | −3.1(−3.67 to −2.50) | 2.4(2.03–2.83) |
| MMM | Tropics | 2.1 | 2.5 | 2.3 | 2.15 | 2.2 |
The spatial distribution of the in situ observations and multi-model mean annual dP/dT for 1930–2005 (figure 1(b)) indicates that the models tend to capture the same broad patterns of precipitation sensitivity as the in situ island observations; 71% of gridboxes have dP/dT of the same sign for the in situ observations and multi-model mean. The annual multi-model mean dP/dT for 1930–2005 masked to tropical islands is 9%/K, somewhat lower than the best estimate of in situ island observations but within uncertainties (figure 2(a)). Overall, the precipitation sensitivities for both observational datasets are consistent with each other and with expectations from the climate models (figure 2). The multi-model mean spatial patterns of dP/dT are strongly correlated with the multi-model mean precipitation trends over time (dP/dt), with a correlation coefficient of 0.65 (p-value < 0.001) and the regions where dP/dT is positive/negative in the multi-model mean are similar to the regions where precipitation is increasing/decreasing in the CMIP5 representation concentration pathways simulations [23]. This suggests that the regression of precipitation to global temperatures captures the changes due to long-term warming, not just interannual variability. Exceptions can be regions where aerosol influences dominate, such as monsoon regions [17].
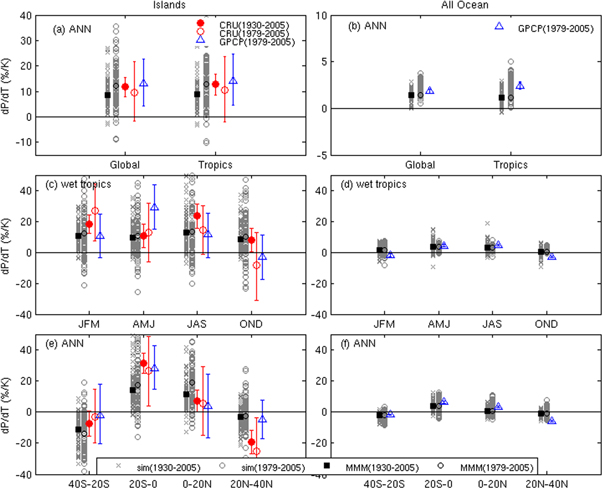
Figure 2. Average precipitation sensitivity to temperature (dP/dT, %/K) for observations (island-based CRUTS3.22-red, GPCP-blue) and models (individual simulations are gray (sim), multi-model means are black (MMM)) for 1930–2005 and 1979–2005. Left-hand column shows the CRUTS3.22 and GPCP observations and models masked to islands coverage. Right-hand column shows the GPCP observations and the models masked to all ocean. (a) and (b) Annual global and tropical dP/dT, (c) and (d) seasonal dP/dT for wet tropics, and (e) and (f) annual dP/dT for four zonal bands, 40S–20S, 20S–0, 0–20N, and 20N–40N. Uncertainty range on the observations are the 5th–95th percentiles.
Download figure:
Standard image High-resolution imageIsland data show a strong precipitation sensitivity in the wettest regions of the tropical ocean. The island and satellite observations, and models show precipitation increasing with higher temperature in the wet tropics (table S2 and figures 2(c) and (d)). Our model estimates may slightly underestimate changes in the wet regions, as the region is selected based on the satellite observations rather than their own climatology. The 1930–2005 seasonal tropical wet region dP/dT for the in situ island observations ranges from 8%–24%/K, with a mean value across all seasons of 15%/K. These values are similar to the area mean values for all tropical stations (figure S2), suggesting that the tropical island station coverage captures the response in the wettest regions rather than the overall tropical mean. For the satellite observations for 1979–2005, the seasonal tropical dP/dT for a fixed wet region mask ranges from −3%–29%/K for the islands and −4%–8%/K for all ocean (table S2). However, if we allow the wet regions to move intra-annually and inter-annually, the annual satellite dP/dT value is 9.1%/K for all ocean for global temperature (11.7%/K for tropical mean sea surface temperature), exceeding the seasonal range calculated using the fixed wet region mask (see Polson et al [13]). Hence precipitation sensitivity can be underestimated if the shifting location of the wet regions is not taken into account.
We next examine how dP/dT at the locations of the island stations compares to all ocean zonal values for the satellite observations and models. The annual mean dP/dT from the satellite observations masked to all tropical ocean is 2.4%/K (5%–95% = 2.03%–2.83%/K), significantly lower than the island mask value of 14.2%/K (table 1). Models also give larger values for the island coverage than all ocean (tables 1 and S2). This discrepancy is due to the bias of the island coverage in the tropics to wetter regions (table S1), which tend to have larger positive dP/dT values compared to smaller negative values in the dry regions. Note that tropical mean dP/dT for the satellite observations masked to the island coverage calculated in its native 2.5° × 2.5° resolution, is 4%/K and thus lower than when data are first interpolated to the higher resolution of the in situ dataset, because the lower resolution gives greater weight to sparsely island-covered dry regions. Thus zonal mean patterns of dP/dT from the island data capture the expected patterns of tropical moistening and subtropical drying over ocean in both hemispheres based on the multi-model all-ocean mean (figures 2(e), S3, and S4(a) and (b)), but show a larger magnitude of response. This is not due to higher precipitation over islands in this case [19], as the island dP/dT does not differ significantly from the nearby ocean gridboxes based on satellite data or the few models that best resolve the islands (figure S1). Instead it is due to the tendency for islands to fall in regions with stronger precipitation response, since subsampling models at island locations shows a similar larger response. After subsampling, the islands and model data are consistent yet capture the sign of precipitation change over zonal bands from the full coverage. Hence the islands are reasonable proxies for precipitation sensitivity to temperature for nearby ocean regions and support the multi-model precipitation changes.
Over the longer period of 1930–2005, the island observations and model estimates of dP/dT are better constrained (figure 2) than over the shorter satellite era (1979–2005). Both show significantly positive precipitation sensitivity in the tropics and negative values in the subtropics (figure 2(e)) and significantly positive precipitation sensitivity across all seasons in the wet tropics. Results in figure 2 for 1930–2005 are robust to extending the uncertainty range in the slopeline by a factor of 2 to conservatively capture low frequency variability (see supplementary material), except for the wet tropics in AMJ and OND and the zonal mean dP/dT for 0–20 N, for which the 5th percentile is no longer greater than zero. The zonal mean patterns of dP/dT (figure S3) for observations and individual simulations also correlate much better with the multi-model mean pattern for the 1930–2005 period than for the 1979–2005 period (figures S4(c) and (d)). Extending the analysis period therefore improves the signal-to-noise ratio of the precipitation sensitivity, reducing the uncertainty in the local estimates of dP/dT, and improving the consistency between the island observations and the models, but at the cost of more limited spatial coverage, particularly for dry regions.
We now examine the sensitivity of heavy precipitation to temperature. Using daily precipitation station data from GHCN [25], dP/dT is calculated for days within each year where P exceeds the 90th percentile of wet day precipitation, P>90. Figure 3 shows dP>90/dT for each station for the extreme precipitation. The daily station data tends to be biased to regions where the annual mean dPann/dT is negative, however there are 16% more stations where dP>90/dT > 0 than those where dPann/dT > 0. For those stations where the dP>90/dT > 0, the increase in the heaviest precipitation tends to be larger than the increase in the annual mean (i.e. dP>90/dT > dPann/dT) (figure 3(b)). A Mann–Whitney test shows that the difference between the change in extreme and mean precipitation is statistically significant at the 5% level. For stations where both dP>90/dT > 0 and dPann/dT > 0, the extremes show significantly stronger precipitation sensitivity compared to mean precipitation (10% significance level). Note that we do not observe the saturation or decrease in extreme daily precipitation further out in the tail of the precipitation distribution seen in some studies when using the highest local daily temperature values [26]. For stations where dP>90/dT < 0, there is no statistically significant difference between the values of dP>90/dT and dPann/dT, although on average the decrease in annual precipitation with warming there is greater than that for dP>90/dT (figure 3(c)). Wet day percentiles can be sensitive to changes in wet day frequency [27], so we therefore repeated the analysis using the all day 95th percentile (which gives similar thresholds for the majority of stations) and found similar results.

Figure 3. Precipitation sensitivity (dP/dT, %/K) for heavy precipitation. (a) patterns for days where P > 90th percentile of wet day precipitation, P>90 (GHCN station daily data). (b) Difference between dP/dT for extreme precipitation and annual mean precipitation (Pann), i.e. dP90/dT − dPann/dT, for stations where dP90/dT > 0 (blue). Black lines shows stations where dP90/dT > 0 and dPann/dT > 0. (c) dP90/dT − dPann/dT for stations where dP90/dT < 0 (red). Black lines shows stations where dP90/dT < 0 and dPann/dT < 0.
Download figure:
Standard image High-resolution image
4. Discussion and conclusions
These results show for the first time that island station observations provide a tighter constraint for precipitation sensitivity dP/dT than the shorter satellite record, and that the island data support physical expectations and climate model simulations if sampled at the same locations. Tropical ocean regions are shown to get wetter, and subtropical regions drier, with increasing global temperature. The in situ island observations of dP/dT also significantly exceeds the Clausius–Clapeyron scaling in the tropics. The tropical island observations are generally consistent with the multi-model mean simulated estimates of dP/dT when appropriately masked to the data coverage, although there is a very large range among different models. The similarity of the dP/dT and dP/dt spatial patterns in models and the insensitivity of the area mean results to removing the influence of ENSO (the largest component of tropical interannual variability), suggests that these results are capturing the changes due to long-term warming, not just interannual variability. However, the precipitation changes will also be affected by anthropogenic aerosol forcing and projected changes of precipitation with warming are sensitive to the emissions scenario due to the effects of aerosols [28]. Furthermore, local precipitation can be highly sensitive to small shifts in large-scale circulation patterns [29].
The relative sparsity of the island observations and wide spread of model simulation values results in large uncertainties in zonal estimates of dP/dT. Nevertheless, the in situ island observations provide important insights into precipitation sensitivity over ocean regions and support the pattern and magnitude of precipitation sensitivity simulated by climate models. This supports model predictions of important changes to the global water cycle with further global warming. They also show that in some regions heavy precipitation reacts more sensitively to warming then mean precipitation. The most intense precipitation increases at a rate that exceeds the mean in many locations, which may have damaging impacts for tropical island soil erosion.
Acknowledgments
The authors thank Richard Allan for discussion, and the data providers the Climatic Research Unit at the University of East Anglia, Gridded Precipitation Climatology Project, Global Historical Climatology Network and the Met Office Hadley Centre for making their data available. We acknowledge the World Climate Research Programme's Working Group on Coupled Modeling and we thank the climate modeling groups for making available their model output. For CMIP, the US Department of Energy's Program for Climate Model Diagnosis and Intercomparison provides support and led development of software infrastructure in partnership with the Global Organization for Earth System Science Portals. DB and GH are supported by the ERC funded project TITAN (EC-320691). GH was further supported by NCAS and the Wolfson Foundation and the Royal Society as a Royal Society Wolfson Research Merit Award (WM130060) holder. SS is grateful for support under NSF grant 1461517.