


Abstract
Smut fungi are plant pathogens mostly parasitizing wild species of grasses as well as domesticated cereal crops. Genome analysis of several smut fungi including Ustilago maydis revealed a singular clustered organization of genes encoding secreted effectors. In U. maydis, many of these clusters have a role in virulence. Reconstructing the evolutionary history of clusters of effector genes is difficult because of their intrinsically fast evolution, which erodes the phylogenetic signal and homology relationships. Here, we describe the use of comparative evolutionary analyses of quality draft assemblies of genomes to study the mechanisms of this evolution. We report the genome sequence of a South African isolate of Sporisorium scitamineum, a smut fungus parasitizing sugar cane with a phylogenetic position intermediate to the two previously sequenced species U. maydis and Sporisorium reilianum. We show that the genome of S. scitamineum contains more and larger gene clusters encoding secreted effectors than any previously described species in this group. We trace back the origin of the clusters and find that their evolution is mainly driven by tandem gene duplication. In addition, transposable elements play a major role in the evolution of the clustered genes. Transposable elements are significantly associated with clusters of genes encoding fast evolving secreted effectors. This suggests that such clusters represent a case of genome compartmentalization that restrains the activity of transposable elements on genes under diversifying selection for which this activity is potentially beneficial, while protecting the rest of the genome from its deleterious effect.
Introduction
Smut fungi represent a large group of more than 2,500 species mostly parasitizing grasses. The most prominent examples are Ustilago maydis causing smut disease on maize and teosinte, Sporisorium reilianum causing head smut on maize and sorghum, Ustilago hordei infecting barley and oats, and Sporisorium scitamineum infecting sugarcane (Vánky 2012). Related to these monocot-infecting species is Melanopsichium pennsylvanicum, a smut fungus infecting Persicaria species (Sharma et al. 2014). Smut fungi are nonobligate pathogens that form a dikaryon by sexual mating for the initiation of infection-related development like filamentous growth and appressoria formation. As biotrophic parasites they need living plant tissue to complete their life cycle. Initial growth in the plant tissue occurs intracellularly. During this stage of infection the dikaryotic fungal hyphae are completely encased by the host plasma membrane establishing a tight interface for the exchange of signals between host and pathogen. At later stages, fungal hyphae are found between cells, and in and around the veins—presumably to access nutrients from the vascular tissue. Most smut fungi initially cause asymptomatic infection with disease symptoms developing specifically in male and female flowers where the infected tissue becomes replaced by masses of black teliospores. Ustilago maydis can induce large, spore-filled tumors in flower tissue but can also induce tumors in all above-ground tissues of a maize plant (Brefort et al. 2009; Vollmeister et al. 2012) allowing the observation of symptoms at early stages of the plant development. This explains in part why this species has become a model to analyze genes contributing to virulence in biotrophic fungi (Dean et al. 2012).
With the availability of quality draft genome sequences, the genetic study of host-pathogen interactions which aims at understanding how smut fungi establish a compatible relationship has entered a new era. Previous genomics studies revealed that the interaction with the respective host is largely determined by approximately 300 genes predicted to encode novel secreted protein effectors (Kämper et al. 2006; Schirawski et al. 2010; Laurie et al. 2012). Effectors are proteins interfering with the function of the host cells, enabling virulence (van der Hoorn and Kamoun 2008). Effectors are typically secreted and can be grouped into apoplastic effectors that remain in the apoplast after secretion, and cytoplasmic effectors that pass through the apoplast but are then taken up and function inside host cells. Functionally characterized are the apoplastic effectors Pep1 and Pit2 (Hemetsberger et al. 2012; Mueller et al. 2013) as well as the three cytoplasmic effectors Cmu1, Tin2, and See1 (Djamei et al. 2011; Tanaka et al. 2014; Redkar et al. 2015). These effectors all have a virulence function which explains why they are maintained by the pathogen. It also explains their variability that is driven by strong diversifying selection attributed to similarly fast evolving host targets in an ongoing molecular arms race scenario. Less than 20% of these effector genes are species-specific and 34% are conserved in the three grass-infecting smut fungi sequenced (Laurie et al. 2012). In M. pennsylvanicum, significant effector gene losses—up to 27% of the repertoire of the grass-infecting species—have been observed, suggesting to reflect a recent host jump to its dicot host Persicaria (Sharma et al. 2014). In U. maydis and S. reilianum about 25% of effector genes is arranged in clusters in the genome, while clustering is less apparent in U. hordei and M. pennsilvanicum (Laurie et al. 2012; Sharma et al. 2014). In U. hordei it has been hypothesized that this is caused by enhanced dispersal due to a higher content of repetitive elements (8% relative to 3–4% in the other smut genomes [Laurie et al. 2012; Sharma et al. 2014]). The mechanisms by which clustering evolves are unknown, but the similarity of clustered genes suggests that it results from gene amplification events followed by rapid diversification. In U. maydis and S. reilianum clusters are maintained at syntenic positions but typically display low sequence conservation (Schirawski et al. 2010). Clusters were also instrumental in describing virulence functions to certain effectors. The deletion of several complete clusters allowed to detect virulence phenotypes that were much less pronounced when individual effector genes from these clusters were deleted (Kämper et al. 2006; Schirawski et al. 2010; Brefort et al. 2014).
Smut fungi have several more distant relatives, of which (among others) Malassezia globosa and Pseudozyma flocculosa have been sequenced (Xu et al. 2007; Lefebvre et al. 2013). Malassezia globosa is associated with common skin diseases like dandruff and atopic eczema. This basidiomycete has one of the smallest fungal genomes with a genome size of only 9 Mb. Encoded proteins show on average 52% amino acid identity to the closest homologs in U. maydis while less than 3% of all genes appear to be in synteny with U. maydis (Xu et al. 2007). Clusters for secreted effectors are missing in Ma. globosa. Instead, clusters encoding secreted lipases, aspartyl proteases, phospholipase C enzymes, and acid sphingomyelinases that likely aid in using lipids and proteins of the host for growth were detected (Xu et al. 2007). Pseudozyma flocculosa is related to plant pathogenic smuts but is unable to parasitize plants. It is used as a biocontrol agent against powdery mildews. Its genome sequence revealed about 50% amino acid identity in encoded proteins. While genes sitting on the same chromosome in P. flocculosa are also located in the same chromosome in U. maydis, their ordering is not conserved, a phenomenon called mesosynteny (Hane et al. 2011). Most notably a specific subset of effector genes implicated in virulence in U. maydis is missing in P. flocculosa (Lefebvre et al. 2013).
The fungus S. scitamineum causes smut whip disease in sugarcane. The apex of infected plants develops a whip-like sorus in which massive amounts of spores are produced. Infected plants sprout early and develop more tillers that can also become infected, leading to significant losses in sugarcane production (Alexander and Ramakrishnan 1980). Population analyses indicate that the fungus migrated only recently from Asia to other continents through spread of infected plant material (Raboin et al. 2007). Due to the growing importance of sugarcane for biofuel production, breeding of resistant cultivars is of growing importance for controlling this disease. While the response of resistant and susceptible cultivars to infection by S. scitamineum has been studied in quite some detail (Que et al. 2009; Su et al. 2013; Que, Su, et al. 2014), the pathogen side has only recently been addressed by sequencing two strains, one from China isolated from sugarcane cultivar “ROC”22 (strain 2014001, [Que, Xu, et al. 2014]) and one from Brazil (SSC39B [Taniguti et al. 2015]).
Here, we provide the genome sequence of the S. scitamineum strain SscI8 from South Africa. We place this sequence in the context of clustering of effector genes using a comparative approach that includes U. maydis, S. reilianum, U. hordei, M. pennsylvanicum, P. flocculosa, and Ma. globosa. In order to conduct an unbiased comparative analysis, we predicted all candidate secreted effector proteins (CSEPs) of all seven genomes using an updated bioinformatic pipeline and introduced a new statistical procedure to assess the significance of co-occurrence of candidate genes. Since our approach was used independently for each species, to prevent any systematic bias, we obtained a high quality data set of CSEP clusters that were formed by evolutionary processes and not by chance associations. Data analysis revealed that S. scitamineum features the largest amount of CSEP clustering compared with previously sequenced species, both in terms of number of clusters and their sizes. This adds a new tool to prioritize effector candidates for future functional analyses. Building families of homologous clusters between species revealed that only the CSEP clusters from S. scitamineum, S. reilianum, U. maydis, U. hordei, and M. pennsylvanicum but not of P. flocculosa or Ma. globosa are homologous and therefore had a common ancestor in the ancestral species of the group. We show that genes in CSEP clusters are significantly related and conclude that CSEP clusters evolve by tandem duplication. Our results reveal a strong association of CSEP gene clusters with interspersed repeats, likely originating from yet uncharacterized transposable elements. The relative paucity of repeated sequences in the rest of these genomes suggests that smut species achieve an efficient control of invasive elements by restricting their activity to certain genome compartments where they contribute to the creation of genetic diversity. We propose that clusters of CSEP genes in smut fungi are a case of genome compartmentalization and function as “evolutionary cradles” (Croll and McDonald 2012).
Materials and Methods
Fungal Strains
The sequenced haploid S. scitamineum strain SscI8 was isolated from germinated spores collected by Sharon McFarlane from sugarcane grown at Mount Edgecombe, South Africa. Strain SscI8 is able to form dikaryotic filaments when mated with the compatible S. scitamineum strains SscI1 and also when mated with an a1b1 strain of the maize smut fungus Ustilago maydis. Therefore SscI8 must carry an a2 mating type locus and a specificity at the b mating type locus that is different from b1. In smut fungi including S. scitamineum, mating of compatible haploid strains is prerequisite for development of the infectious form.
Generation and Assembly of the Genome Sequence of SscI8
Total DNA of the S. scitamineum strain SscI8 was isolated and depleted for mitochondrial DNA as described previously (Schirawski et al. 2010). The DNA was sequenced to about 30-fold coverage by genomic shotgun reads in combination with multispan paired-end reads on the GS FLX 454 platform (454 Life Sciences). Assembly of the sequence readouts using the 454 “Newbler” assembler resulted in 1,198 contigs that could be further assembled by integrating the paired-end information to 47 scaffolds comprising 19.63 Mb.
Prediction of Open Reading Frames, Proteome Analysis
Gene calling was done using GeneMark-ES version 2 (Ter-Hovhannisyan et al. 2008). Annotation was aided by exonerate hits (Slater and Birney 2005) of protein sequences from U. maydis, S. reilianum, and U. hordei, respectively, to uncover gene annotation gaps. In addition, the orthologous protein sequences of the four species were inspected by multi t-coffee alignments to further validate the gene structure in S. scitamineum. The different gene structures and evidences were displayed in GBrowse (Stein et al. 2002), followed by manual validation and correction of all coding sequences. The final call set comprises 6,673 protein-coding genes. In addition, 116 tRNA-encoding genes are predicted using tRNAscan-SE (Lowe and Eddy 1997). The protein-coding genes were analyzed and functionally annotated using the Pedant system (Walter et al. 2009), accessible at http://pedant.helmholtz-muenchen.de/genomes.jsp?category=fungal. The genome and annotation were submitted to the European Nucleotide Archive, ENA at http://www.ebi.ac.uk/ena/data/view/LK056649-LK056695.
Repeats and Low-Complexity Sequences
Determination of repeat sequences involved first the calculation of de novo repeat families followed by assessment of known repeat elements in a second step. Families of previously unknown interspersed repeat elements were identified by RepeatScout (Price et al. 2005). Repeat families were included when they comprised more than ten repeats and when their consensus sequence length was longer than 50 bp. Additionally, low complexity and simple sequence repeats were determined with the tools NSEG (Wootton and Federhen 1993) and Tandem-Repeat-Finder (Benson 1999) that are part of the RepeatScout procedure and remove them from the interspersed repeat library.
The RepBase database (Jurka et al. 2005) was used to detect previously published families of transposable elements, pseudogenes, and retroviruses. In order to determine the exact locations of the repetitive elements on the genome, we used the RepBase library and the calculated library of interspersed repeat families as input for RepeatMasker (Smit et al. 1996). RepeatMasker was also used to find and mask genomic regions of low complexity. We applied the automated classification tool TEclass (Abrusán et al. 2009) to categorize the predicted repeat sequences into the four main transposable element categories DNA transposon, long interspersed nuclear element, short interspersed nuclear element, and retrotransposon with long terminal repeats. The assembled library of interspersed repeats provided the input for calculating evidence for repeat induced point mutations (RIP). We used RIPCAL (Hane and Oliver 2008) to calculate dinucleotide frequencies of all interspersed repeats and of nonrepetitive control sequences.
Analyses of Divergence and Synteny
The newly sequenced SscI8 strain was aligned with the scaffolds from the 2014001 strain and with the chromosome sequences of the Ssc39 strain using TBA (Blanchette et al. 2004). The code of the blastZwrapper program of TBA was modified in order to use LastZ instead of the deprecated BLASTZ program. The resulting alignment was further processed using MafFilter (Dutheil et al. 2014) in order to discard ambiguously aligned regions. A window of 10 nt was slid by 1 nt along the genome alignment and windows with more than three gaps were discarded. From the resulting alignment blocks, 883 nonoverlapping windows of 10 kb without synteny breaks were generated and pairwise nucleotide differences were computed using MafFilter.
Synteny was assessed at the nucleotide level, using all contig/chromosomal sequences from S. scitamineum strain SscI8, U. maydis, and S. reilianum. The program Promer from the Mummer 3.0 package was used, allowing comparison based on 6 phases (Kurtz et al. 2004).
Annotation of CSEPs
SignalP version 4.1 was used for signal peptide prediction and ProtComp 9.0 (online version) for localization prediction (http://linux1.softberry.com/berry.phtml). We used two prediction schemes. First, we considered all genes predicted to be secreted by SignalP (that is, genes with a signal peptide) as encoding CSEPs. In addition, genes predicted to be extracellular by ProtComp were also considered as encoding CSEPs in the absence of predicted signal peptide, as these could be nonconventionally secreted proteins. A second, more stringent prediction was derived by 1) excluding genes where ProtComp confidently predicted a nonextracellular location (score higher or equal to 8) and 2) excluding genes predicted to have an extracellular localization but with low confidence (score lower or equal to 8). The more stringent definition is potentially biased toward extra-cellular localization and may miss CSEPs translocated into the host cells. A large majority (84.6%) of additional genes in the extended set, however, appeared to contain mostly genes predicted to be membrane bound, less likely to act as effectors unless they are processed or serve a protective function (supplementary table S5, Supplementary Material online).
Phylogenetic Reconstruction
All 44,716 protein sequences from the seven genomes of U. maydis, S. reilianum, U. hordei, S. scitamineum, Ma. globosa, P. flocculosa, and M. pennsylvanicum were gathered to perform an all-against-all BLASTp search, using the sequences both as query and database (Altschul et al. 1990). The query results were given as input to the SiLiX program to build families of homologous proteins (Miele et al. 2011). In order to perform a phylogenetic reconstruction, only families of orthologous genes can be used. We therefore tried various values of identity and coverage with SiLiX, and found that the maximum number of usable families was obtained when a minimum 35% identity on 40% of the average length was used for gathering two genes into a common family. With such parameters, SiLiX inferred 12,593 families, of which 1,764 had exactly one member in each species. This restricted set of families of one-to-one homologs was considered free from hidden paralogy, providing the candidate gene sets for inferring the phylogenetic relationships of the seven species. Each family was subjected to two independent pipelines, one on the nucleotide sequences and one on the protein sequences. The protein families were aligned using the clustal omega program, with default parameters for protein sequences (Sievers and Higgins 2014). We filtered the resulting alignment using Gblocks to remove ambiguously aligned regions (Castresana 2000), with option “'b5 = h” to exclude positions containing more than 50% gaps, and used PhyML (Guindon et al. 2010) to build a phylogeny on the resulting filtered alignments (LG model of protein substitution [Le and Gascuel 2008], with a four-classes discretized gamma distribution of rates was used, and the best tree of Nearest Neighbor Interchanged [NNI] and Subtree Pruning and Regrafting [SPR] topological searches was kept). Support values were computed using the approximate likelihood ratio test (aLRT) method (Anisimova and Gascuel 2006). A species tree was constructed from all gene trees using the distance supermatrix approach (SDM method weighted by alignment lengths (Criscuolo et al. 2006)). A balanced minimum evolution tree was inferred from the resulting distance supermatrix using FastME (Desper and Gascuel 2002), using NNI, SPR, and TBR (Tree Bifurcation and Reconnection) tree topology refinement. The tree was rooted using the midpoint method, as implemented in the Phangorn package for R (Schliep 2011). A similar pipeline was run on the nucleotide sequences, with the following distinctions: 1) the Macse codon alignment software was used to align sequences at the codon level (Ranwez et al. 2011) and the CodonPhyML software was used to infer phylogenies with a codon model (Gil et al. 2013). All options were set identical to the PhyML run, with the exception that a M0 codon model was used with a four-classes discretized gamma distribution of rates, a cF3X4 model for equilibrium frequencies and a free transition over transversion rate ratio (kappa parameter). To explicitly account for the possibility of incomplete lineage sorting (ILS) as a source of phylogenetic incongruence, we used the ASTRAL coalescent-based super tree reconstruction method, on both protein and codon gene trees (Mirarab et al. 2014). Default parameters were used in both cases.
Gene Ontology Analysis
We used the proteome of U. maydis to associate Gene Ontology (GO) terms to each gene family, using blast2GO (Conesa et al. 2005). Thirteen thousand three hundred thirty-six annotations could be retrieved on 4,113 U. maydis genes. The topGO package (Alexa et al. 2006) from Bioconductor (Gentleman et al. 2004) was used to perform GO terms enrichment analyses. P values for each GO term (Grossmann et al. 2007) were computed using Fisher’s classic test with the parent-child correction. The set of 1,846 families of one-to-one orthologs was tested against all 4,113 annotated genes and reported categories significant at the 5% level for the three ontologies “Biological Process”, “Molecular Function,” and “Cellular Component” (supplementary table S1Supplementary Material online).
CSEP Cluster Detection
Each contig or chromosome of one species was converted to a vector of 0 and 1 according to annotated protein-coding genes. Genes confidently predicted to be CSEPs using our “strict” method were coded as 1, others as 0. The exact coordinates of genes and their orientation was ignored. Stretches of contiguous 1 were extended by flanking genes if they show a similarity to their neighboring genes (BLASTp’s E value < 1e-6). To allow for CSEP prediction errors, as well as “outliers” such as transposase genes, we slid a window of ten genes along the vector and counted the number of 1. When this count exceeded a threshold of seven genes, entries coded as 0 were converted to 2 in the given window. Entries with a two flanked by either a 1 or another 2 on each side were kept, while entries flanked by a 0 were converted back to 0. Clusters were ultimately defined as stretches of numbers higher than 0 (supplementary fig. S7, Supplementary Material online). The number and size of detected clusters depend on the window size and threshold used for the smoothing procedure. A lower threshold for instance typically outputs more and larger clusters. This comes however at the cost of statistical power, as such clusters are more likely to occur by chance only. A window size of ten genes and threshold of seven genes were chosen as they were found to provide a good compromise between number of candidate cluster and their significance. Such thresholds have been consistently applied to the detection of clusters in all seven genomes.
CSEP Cluster Significance
To assess the significance of each cluster for a given genome, we distributed randomly all genes on each chromosome, disregarding their prediction as a CSEP, yet respecting the total number of genes on each chromosome. Gene-rich chromosomes in the genome will therefore be gene-rich in the resampled, artificial chromosomes. We subsequently applied our cluster prediction algorithm on the resulting chromosomes and noted the size of the resulting clusters. By repeating the procedure 10,000 times, the probability of observing by chance a cluster with at least the same size of the tested one on a particular chromosome was computed. This provided a P value for the cluster, which was further corrected for multiple testing using the false discovery rate (FDR) method (Benjamini and Hochberg 1995). This FDR indicates the probability that the observed pattern of CSEP clustering could arise by chance given the number of genes on the corresponding chromosome and the global proportion of CSEP genes in the genome.
Building of CSEP Cluster Families
Test of Relatedness of Genes
As opposed to the E value defined on] 0, +inf[, the p-value is bounded between 0 and 1. E values and P values are very similar for low values (typically E value < 0.1) and P values ≈ 1 for E values > 10. We kept the default threshold of BLASTp (E value < 10) to report HSPs. We considered as a measure of relatedness between two genes the minimum P value of all reported HSP, with each of the two genes considered as target and query. Pairs of genes with no reported HSPs were attributed a P value of 1.
To assess whether clustered genes are more related to each other than other contiguous genes in the genome a statistical test was developed. As in the cluster detection procedure, we considered chromosomes as ordered series of genes, regardless of their exact position and orientation. The average P value of all pairs of genes within a given cluster was computed for each cluster. The null distribution of this statistic was computed using all possible sets of contiguous genes with the same size as the tested cluster. A P value was computed as follow:
p-value [relatedness] = “number of sets with a statistic lower or equal to the observed one”/ “total number of sets”.
For a cluster of size n and a genome of size m, there are at maximum m-n + 1 of such sets (only sets of genes on the same chromosome were considered).
Comparison and Reconstruction of Ancestral Cluster Sizes
The size of clusters of all species has been compared, with the exception of Ma. globosa which shares no homologous cluster with the other species. If a cluster is missing in one species, its size was coded as NA. Species were then compared in a pairwise manner using a paired Student test, after having log-transformed all cluster sizes to ensure normality. Normality of the transformed variables was confirmed for all species by a Shapiro test, with significance threshold set to 5%. The FDR method was used to account for multiple testing (Benjamini and Hochberg 1995).
In order to infer the cluster size of ancestral species, the six cluster subfamilies which contained one homolog in each of the five smut species S. scitamineum, S. reilianum, U. maydis, U. hordei, and M. pennsylvanicum were selected. The log-transformed cluster sizes were considered as a continuous character, evolving according to a Brownian model. The model was fitted on the SDM phylogeny obtained from codon sequences (fig. 2A) with the restricted maximum likelihood method, using the “ace” function from the R package APE (Paradis et al. 2004).
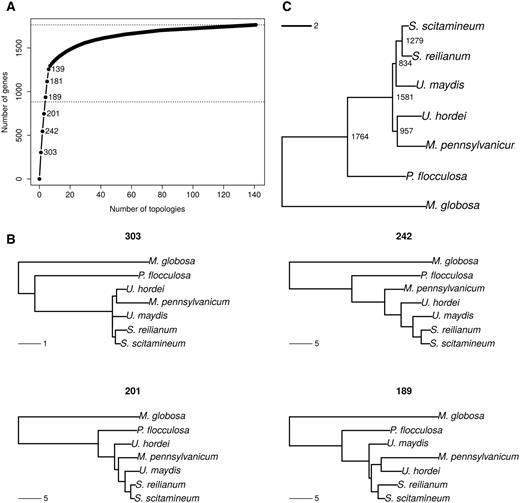
—Phylogeny reconstruction and genealogy variation using a codon model. (A) Cumulative distribution of number of genes per topology. Numbers indicate the frequencies of the six most frequent topologies. The middle horizontal dotted line indicates half of the genes under study. (B) Four most frequent topologies with their corresponding frequency. Genealogies are examples of genes taken for each topology class. (C) Species tree obtained by combining all gene trees using the Super Distance Matrix method.
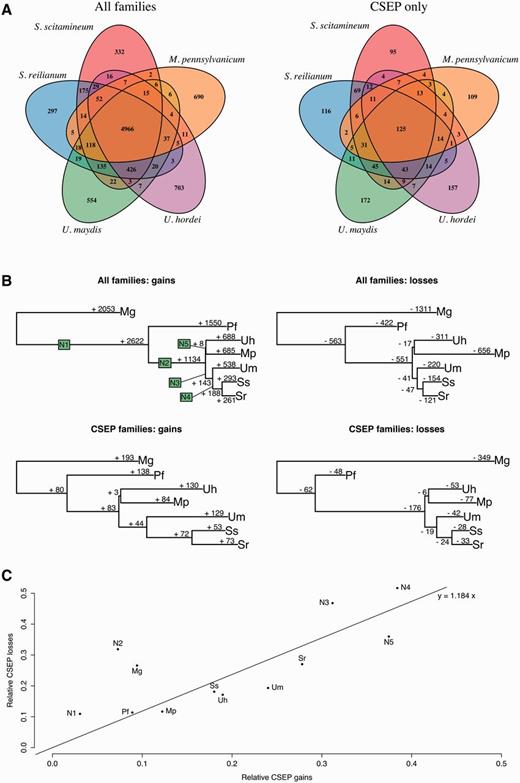
—Evolution of gene families. (A) Repartition of homologous gene families among five smut species. Homologous gene families are plotted as 5-fold Venn diagrams, for all genes families (e.g., 4,966 gene families have at least one homolog in the five species) and CSEP genes only (e.g., 125 families have at least one homologous CSEP in all five genomes). (B) Number of gains and losses for each gene family and for each CSEP gene family. (C) Proportion of CSEP losses relative to all family losses plotted against the proportion of CSEP gains relatives to all family gains. Species code is as follow: S. scitamineum (Ss), S. reilianum (Sr), U. maydis (Um), U. hordei (Uh), M. pennsylvanicum (Mp), and P. flocculosa (Pf). Ancestral branches are arbitrarily labeled as N1–N5.
Comparison of Proportions of CSEP Genes in Clusters
For each cluster, we computed the proportion of CSEP genes as the ratio between the numbers of genes annotated as CSEPs using our strict criterion and the total number of genes in the cluster, ignoring genes annotated as transposases. The analysis was conducted in S. scitamineum, S. reilianum, U. maydis, and U. hordei, for which transposase annotations were available. Homologous clusters for all pairs of species were tested using Student’s paired test on untransformed data, with correction for multiple testing (Benjamini and Hochberg 1995). In one comparison (U. maydis vs. S. reilianum), data for U. maydis significantly departed the null hypothesis of a normal distribution (Shapiro test, P value = 0.005). The corresponding resulting P value might therefore be erroneous.
Measures of Substitution Rates in Clustered and Nonclustered Genes
In order to assess the rate of mutation in distinct categories of genes, we estimated the rate of synonymous substitutions (Ks) using the method of Nei and Gojobori (1986). As synonymous substitutions are assumed to be neutral, the rate of synonymous substitutions is directly proportional to the mutation rate. To limit saturation because of multiple substitutions, we compared the three most closely related species in our data set, S. scitamineum, S. reilianum, and U. maydis. We used the same pipeline as for phylogenetic inference in order to get families of 1:1 orthologs, yet with these three species only. This lead to 5,391 gene families which we aligned using MACSE (Ranwez et al. 2011) and filtered using Gblocks (Castresana 2000). Synonymous rates were computed as the average over the three pairwise distances between S. scitamineum, S. reilianum, and U. maydis, using the PopGen module of BioPerl (Stajich et al. 2002). Ks values could be computed for 5,358 families where sequences were not too divergent for the Jukes–Cantor correction to be applied. The comparison of gene categories was conducted using the nonparametric Kruskal–Wallis rank test. Post hoc tests were conducted using the agricolae package for R (de Mendiburu 2014) and significance groups were determined using an FDR of 1%, using the FDR method (Benjamini and Hochberg 1995).
Comparison of Distances to Repeats and Genes
To test whether repeat elements play a role in the evolution of CSEP clusters, each gene (CSEP and non-CSEP) of each of the seven species under study was compared to their respective repeat map in order to compute the distance toward the closest repeat. In order to compare all seven genomes, we reannotated the genomes of M. pennsylvanicum, P. flocculosa, and Ma. globosa using the same pipeline that we developed for S. scitamineum, S. reilianum, U. maydis, and U. hordei. Distances to the closest genes were also computed using the same method. Genes were further classified into four categories: located within a CSEP cluster (“Clustered” category), not located within a CSEP cluster but homologous to a gene located in a CSEP cluster in another species (“Homologous” category) and genes neither clustered, nor homologous to a clustered gene (“Standalone” category). This latter category was further divided depending on whether the gene encode a CSEP or not. The distribution of distances for each category was compared using a Kruskal–Wallis rank test with Post hoc tests as implemented in the agricolae package for R (de Mendiburu 2014). An FDR of 1% was used for correcting for multiple testing. Only repeat classes represented by at least 100 occurrences in a genome were tested.
Results and Discussion
Smut Genomes Display Conserved Synteny but Distinct Repeat Dynamics
We obtained and annotated the genome sequence of the haploid S. scitamineum strain SscI8. Repeat annotation was done using a database of known repeat sequences combined with de novo annotation (see Materials and Methods). In order to compare the distribution of repeats in distinct genomes, we generated repeat annotations for the five smut fungi as well as the two relatives P. flocculosa, and Ma. globosa. The overall repeat content (excluding tandem repeats) of 3.23% in S. scitamineum compared with 2.49% in the closest sequenced relative S. reilianum (table 1). This number can be traced back to the higher content of interspersed repeats in S. scitamineum, that is, repeats originating from transposable elements. The compact genome of Ma. globosa displays the lowest amount of repeats and displays the lowest amount of simple and tandem repeats. Pseudozyma flocculosa, on the contrary, contains 13.88% repeat sequences, the majority of which being tandem repeats (11.24%) and simple repeats (5.11%, note that distinct repeat classes can overlap), while it contains very little interspersed repeats. Interestingly the content of simple and tandem repeats is similar in U. maydis, U. hordei, S. reilianum, M. pennsylvanicum, and S. scitamineum, whereas the content of interspersed repeats differs in these species (table 1). Despite the smaller percentage in S. scitamineum, the sequences of interspersed repeats show the same pattern of dinucleotide frequencies as U. hordei, with a characteristic lack of CpG dinucleotides in interspersed repeats when compared to the frequency of nonrepetitive control sequences (supplementary fig. S1, Supplementary Material online). This pattern is not observed in S. reilianum and U. maydis. In U. hordei, such lack of CpG dinucleotides was attributed to the occurrence of Repeat Induced Point mutations (RIP) (Laurie et al. 2012), a mutational mechanism that protects the genome from invasion of transposable elements, but which has so far only been experimentally demonstrated in ascomycetes. Our results suggest that RIP-like processes also occur in S. scitamineum and might be widespread among smut fungi (Horns et al. 2012).
Characteristics of Analyzed Genomes
| S. scitamineum | S. reilianum | U. maydis | U. hordei | M. pennsylvanicum | P. flocculosa | Ma. globosa | |
|---|---|---|---|---|---|---|---|
| Assembly statistics | |||||||
| Total contig length (Mb) | 19.5 | 18.2 | 19.7 | 20.6 | 19.2 | 23.3 | 8.9 |
| Total scaffold length (Mb) | 19.6 | 18.4 | 19.8 | 21.15 | 19.2 | 23.3 | 8.9 |
| Average base coverage | 30× | 20× | 10× | 25× | 339× | 28× | 7× |
| N50contig (kb) | 37.6 | 50.3 | 127.4 | 48.7 | 43.4 | 38.6 | 655 |
| N50scaffold (kb) | 759.2 | 738.5 | 817.8 | 307.7 | 121.7 | 919.9 | 660 |
| Chromosomes | 23 | 23 | 23 | 8 | |||
| GC-content (%) | 54.4 | 59.7 | 54 | 52 | 50.9 | 65.1 | 52 |
| Coding (%) | 57.8 | 62.6 | 56.3 | 54.3 | 54 | 66.3 | 53.3 |
| Noncoding (%) | 51.1 | 54.3 | 50.5 | 43.4 | 46.9 | 63.7 | 49.2 |
| Coding sequence | |||||||
| Percent coding (%) | 62 | 65.9 | 61.1 | 57.5 | 56.6 | 54.3 | 69.4 |
| Average gene size (bp) | 1,819.1 | 1,858 | 1,836 | 1,708 | 1,734 | 2,097 | 1,450 |
| Average gene density (gene/kb) | 0.34 | 0.36 | 0.34 | 0.33 | 0.33 | 0.29 | 0.48 |
| Protein-coding genes | 6,693 | 6,648 | 6,786 | 7,113 | 6,279 | 6,877 | 4,286 |
| Exons | 10,214 | 9,776 | 9,783 | 10,907 | 9,278 | 19,318 | 6,377 |
| Average exon size | 1,191 | 1,221 | 1,230 | 1,107 | 527 | 658 | 975 |
| Exons/gene | 1.5 | 1.47 | 1.44 | 1.53 | 1.48 | 2.8 | 1.5 |
| tRNA genes | 116 | 96 | 111 | 110 | 126 | 176 | 82 |
| Secretome | |||||||
| Protein with signal peptide | 622 | 632 | 625 | 538 | 419 | 622 | 241 |
| CSEP genes (relaxed) | 702 | 708 | 729 | 694 | 521 | 737 | 303 |
| CSEP genes (strict) | 537 | 542 | 553 | 484 | 362 | 554 | 200 |
| Noncoding sequence | |||||||
| Introns | 3,521 | 3,103 | 2,997 | 3,161 | 2,999 | 12,427 | 2,092 |
| Introns/gene | 0.53 | 0.46 | 0.44 | 0.44 | 0.48 | 1.8 | 0.5 |
| Average intron length (base) | 130.1 | 144 | 142 | 141 | 191.4 | 141 | 76 |
| Average intergenic distance (bp) | 1,114 | 929 | 1,127 | 1,186 | 1,328 | 1,273 | 639 |
| Repeat sequences (%) | |||||||
| DNA transposon | 0.25 | 0.13 | 0.29 | 0.89 | 0.29 | 0.35 | 0.16 |
| LINE | 0.27 | 0.04 | 0.35 | 4.62 | 0.40 | 0.09 | 0.05 |
| SINE | 0.05 | 0.03 | 0.05 | 0.27 | 0.10 | 0.10 | 0.04 |
| LTR retrotransposon | 0.69 | 0.13 | 1.15 | 4.82 | 1.17 | 0.31 | 0.22 |
| Unclassified non-LTR-retrotransposon | 0.01 | 0.01 | 0.02 | 0.10 | 0.032 | 0.01 | 0.00 |
| Unclassified retrotransposon | 0.29 | 0.12 | 0.21 | 1.47 | 0.39 | 0.17 | 0.08 |
| Unclassified | 0.08 | 0.02 | 0.08 | 0.38 | 0.04 | 0.03 | 0.00 |
| Total TEclass | 1.60 | 0.45 | 2.11 | 11.84 | 2.32 | 1.01 | 0.53 |
| Simple sequence repeats | 1.59 | 2.00 | 1.75 | 1.59 | 1.54 | 5.11 | 0.66 |
| Total excl. tandem repeats | 3.23 | 2.49 | 3.90 | 13.56 | 3.95 | 6.16 | 1.25 |
| Tandem repeats | 4.54 | 6.97 | 4.22 | 5.20 | 5.16 | 11.24 | 2.60 |
| Total repeat coverage | 6.68 | 8.26 | 6.70 | 16.45 | 6.72 | 13.88 | 3.27 |
NOTE.—LINE, long interspersed nuclear element; SINE, short interspersed nuclear element; LTR, long terminal repeats. Statistics for the newly sequenced genome of S. scitamineum are presented along with statistics for S. reilianum, U. maydis, U. hordei, M. pennsylvanicum, P. flocculosa, and Ma. globosa genomes. Chromosome numbers were determined by pulsed gel electrophoresis for U. maydis and Ma. globosa (Boekhout et al. 1998), and by optical mapping for S. reilianum and U. hordei (Kämper et al. 2006; Laurie et al. 2012). Gene-wise statistics are based on an updated annotation for these genomes. Annotations for M. pennsylvanicum, P. flocculosa, and Ma. globosa were not modified from their respective original publications. For the sake of consistency, however, CSEP were predicted using the methodology introduced in the present work, and corresponding statistics are reported.
The genome of strain SscI8 of S. scitamineum was compared with the published genomes of strain 2014001 from China and strain SSC39 from Brazil. The South African strain SscI8 is found to be more closely related to the Brazilian strain (0.3% nucleotide difference on average in 10 kb windows) than to the Chinese strain (2.6% nucleotide difference on average in 10 kb windows).
Gene calling enhanced by manual annotation of all scaffolds allowed the prediction of 6,693 nuclear protein-coding genes for S. scitamineum SscI8, which together covered 62.2% of the available sequence. This number is higher than what was reported for the S. scitamineum strains from China (6,142 predicted genes) and from Brazil (6,677), due to differences in methodologies for gene annotations. The S. scitamineum genome displays features (number of protein coding genes, exon length, GC content) similar to the S. reilianum and U. maydis genomes (table 1). The genome of S. scitamineum shows a high level of synteny with the genome of S. reilianum (supplementary fig. S2, Supplementary Material online). A notable exception is scaffold 14, that is homologous to chromosomes 1 and 20 of S. reilianum, suggesting a chromosomal rearrangement. As chromosomes 1 of U. maydis and S. reilianum are syntenic, this rearrangement must have occurred in the S. scitamineum lineage. Another S. scitamineum fusion event occurred between chromosome 17 and 23 of S. reilianum (supplementary fig. S2, Supplementary Material online), that are syntenic between U. maydis and S. reilianum. These two events have also been reported for the S. scitamineum Brazilian strain, suggesting that it occurred before the last common ancestor of the two strains (Taniguti et al. 2015). In addition, the comparison of S. reilianum and U. maydis revealed that chromosome 5 of U. maydis is a fusion of chromosome 5 and a large part of chromosome 20 of S. reilianum (see also fig. 1 in [Schirawski et al. 2010]). The comparison of S. scitamineum and U. maydis reveals the same rearrangement, suggesting that this event occurred either in the U. maydis lineage or in the ancestor of the two Sporisorium species.
Phylogenomic Analysis of Homologous Gene Families Suggests Rapid Speciation and Incomplete Lineage Sorting
To reconstruct the phylogeny, we built homologous gene families of the five sequenced smut genomes of U. maydis (Kämper et al. 2006), S. reilianum (Schirawski et al. 2010), U. hordei (Laurie et al. 2012), the newly sequenced S. scitamineum strain SscI8, M. pennsylvanicum (Sharma et al. 2014), as well as the nonpathogenic P. flocculosa (Lefebvre et al. 2013) and the dandruff-associated fungus Ma. globosa (Xu et al. 2007) by performing an all-against-all BLAST search on all proteins using BLASTp (Altschul et al. 1990) and the SiLiX algorithm to recover homology relationships (Miele et al. 2011). This approach led to 12,593 gene families, containing both orthologous and paralogous genes.
Among the 12,593 reconstructed families of homologous genes in the seven sequenced genomes, 1,764 families consist of one-to-one homologs and can be considered free of hidden paralogy (see Materials and Methods). A GO terms enrichment analysis was conducted on this set of selected genes and showed that it is biased toward house-keeping functions (supplementary table S1, Supplementary Material online). Each of these families was independently aligned and the regions with uncertain alignment were masked before performing a phylogenetic reconstruction, leading to 1,764 gene trees, one for each family. We performed two independent phylogenetic reconstructions for each gene: one at the protein level using the PhyML software (Guindon et al. 2010) and one at the codon level using the CodonPhyML software (Gil et al. 2013). While both approaches resulted in very similar conclusions, the codon-based trees had significantly higher support values (0.73 vs. 0.77 on average, P value < 2.2e-16, Wilcoxon test) and we discuss results for this analysis only, referring to protein-based trees as supplementary material (supplementary fig. S3, Supplementary Material online). One hundred forty-one distinct topologies are supported by at least one gene, and the four most represented topologies represent 935 gene families, that is, more than half of the total number of gene families analyzed (fig. 1A). The three most represented topologies (supported by 746 genes) differ only by the position of M. pennsylvanicum, and put S. scitamineum as the closest relative of S. reilianum (fig. 1B). The other branching orders are, by increasing distance: U. maydis, U. hordei, P. flocculosa, and Ma. globosa. This phylogeny is consistent with previous ITS and ribosomal RNA sequence analyses (Kellner et al. 2011), as well as with the phylogeny reported by Que, Xu, et al. (2014). Three alternative branching patterns for M. pennsylvanicum were inferred, with similar frequency: 303 genes support a common ancestor between M. pennsylvanicum and U. hordei. Two hundred forty-two genes support M. pennsylvanicum as an outgroup to U. hordei, U. maydis, and the two Sporisorium species, and 201 genes support M. pennsylvanicum at an intermediate branching point between U. hordei and U. maydis. When protein models are used, these three topologies are also found to be the most frequent, yet in a different order: the most frequent gene topology grouped M. pennsylvanicum with U. maydis and the two Sporisorium species (271 genes), while 240 genes support M. pennsylvanicum branching before U. hordei and 203 genes support a branching with U. hordei (supplementary fig. S3, Supplementary Material online). The fourth most frequent genealogy (189 genes) inverts the position of U. maydis and the U. hordei, M. pennsylvanicum group (fig. 1B). The remaining 137 alternative topologies are all represented each by a minority of genes (six on average). These alternative tree topologies have significantly lower support than the majority trees (Fisher’s exact test on the number of nodes with an aLRT (Anisimova and Gascuel 2006) value at least equal to 0.9, P value < 2.2e-16).
We used the distance super-matrix approach to infer the species tree from the set of all gene trees, with both protein (fig. 1C) and codon models (supplementary fig. S3C, Supplementary Material online; Criscuolo et al. 2006). The resulting super-trees are nearly ultrametric, which means that the inferred sequence divergence are good indicators of divergence times. The generated species trees suggest that Ma. globosa and P. flocculosa are rather distant outgroups to the five plant pathogens S. reilianum, S. scitamineum, U. maydis, U. hordei, and M. pennsylvanicum. In addition, these super-trees are congruent with the most frequent gene topologies (fig. 1B), and supports a grouping of U. hordei with M. pennsylvanicum, as reported in Sharma et al. (2014). The resulting branch length is however very short, supporting the idea that the speciation events leading to U. hordei, M. pennsylvanicum and the common ancestor of U. maydis, S. reilianum, and S. scitamineum are very close in time and that ILS occurred (Dutheil and Hobolth 2012). The species relationships were confirmed by the use of a reconstruction method explicitly allowing for ILS (Mirarab et al. 2014) as a source of incongruence.
Annotation and Comparison of the Secretomes Reveal Higher Rates of Gains and Losses of CSEP-Encoding Genes
In order to study the evolutionary history of CSEPs, we performed a comprehensive analysis of the proteomes of the five sequenced smut genomes and their relatives P. flocculosa and Ma. globosa. In order to be able to compare all seven secretomes, we submitted each proteome to the same pipeline for annotating CSEPs, combining bioinformatic prediction tools. We defined two sets of predicted CSEPs, “relaxed” and “strict” (table 1). The relaxed set contains proteins with a predicted signal peptide or a predicted extracellular localization with no signal peptide (presumed to be secreted unconventionally). The strict set is a refinement of the relaxed set, where proteins with extra-cellular localization predicted with a score lower than eight are discarded, as well as proteins with a predicted signal peptide and a nonextracellular localization confidently predicted with a score higher or equal to eight (see Materials and Methods and supplementary table S2, Supplementary Material online). The relaxed set potentially contains a certain proportion of false predictions, including secreted proteins that are membrane-bound, whereas the strict set might be biased toward apoplastic effector proteins that are not taken up by the host cell. Importantly, when applied to U. maydis, the strict set (553 genes) contains the three effector genes reported to be taken up by the host, Cmu1 (Djamei et al. 2011), Tin-2 (Tanaka et al. 2014), and See1 (Redkar et al. 2015). It is noteworthy that our strict definition of CSEPs is very similar to the one introduced in Mueller et al. (2008) and is still less stringent than previously published approaches that led to smaller numbers of candidates: in U. maydis 426 CSEPs were predicted based on a consensus between SignalP and ProtComp (Kämper et al. 2006) while the definition proposed by Laurie et al. (2012) for U. hordei is more selective (333 CSEPs), as it adds additional steps to discard putative nonfunctional effectors based on their repeat content.
We classified a homologous gene family as a CSEP family if all its sequences encode CSEPs and we compared the species distribution of members of each of these families (fig. 2A). As previously reported (Sharma et al. 2014), we find that CSEP genes tend to be more species-specific than other genes, a property resulting from their fast evolution. In order to gain further insights into the dynamics of genes, we fitted a model of gene evolution in order to estimate the number of gains and losses for each branch of the phylogenetic tree, while accounting for the uncertainty on the ancestral states and the possibility of multiple independent gains and losses along the phylogeny (Cohen et al. 2008). We report that for the four grass pathogens, gene gains and losses are remarkably proportional to the divergence of species (fig. 2B). As previously noted by Sharma et al. (2014), M. pennsylvanicum displays an excess of gene losses, while the number of gene gains is as expected based on the divergence time since the last common ancestor with U. hordei (fig. 2B). Compared with Sharma et al. (2014) where gain and losses unique to a single species were inferred, our model-based approach encompasses more events and allows for multiple gains and losses. Contrary to Sharma et al. (2014), we do not find that losses are more frequent for CSEP genes. We plotted the ratio of CSEP losses over all gene losses as a function of CSEP gain over all gene gains, and found that the two rates are linearly dependent (fig. 2C). Melanopsichium pennsylvanicum does not appear as an outlier, suggesting that gene losses are independent of the CSEP status of the gene. If the speciation of M. pennsylvanicum occurred via gene loss, there is therefore no evidence so far that CSEP genes are involved.
Statistical Assessment of CSEP Gene Clusters Reveals the Largest CSEP Clusters in the Genome of S. scitamineum
Two approaches have previously been used to define clusters of CSEP genes in a genome. The first one uses contiguous stretches of CSEP genes (Kämper et al. 2006; Schirawski et al. 2010; Sharma et al. 2014). The second approach, introduced by Sharma et al. (2014) uses gene coordinates and a window scan to look for CSEP genes in close proximity. Both types of approaches lack a statistical assessment of the detected clusters: obviously, the number of CSEP genes that one expects in a contiguous stretch or in a genome region of a given size depends on the global proportion of CSEPs in the genome or chromosome. If a given chromosome contains 1,000 genes, among which only ten are CSEPs, finding five contiguous CSEP genes on that chromosome is very unlikely to be the result of chance. If, on the other hand, this given chromosome contains 200 CSEP genes, there is a 20% chance of observing a stretch of at least five contiguous CSEP genes, even if CSEP genes are distributed randomly along the chromosome. We here report the first statistical test of clusters of CSEP genes. Following the work by Kämper et al. (2006), our definition of CSEP genes cluster is based on the occurrence of contiguous stretches of CSEP genes. In addition, our algorithm allows for a proportion of non-CSEP genes within the cluster, here set to a maximum of three genes out of ten (to accommodate prediction errors, insertion in a cluster of moving non-CSEP genes such as a transposase gene, or former CSEPs that are now degenerated), as well as the inclusion of flanking homologous, non-CSEP genes. Because of these additional criteria, the expected distribution of cluster size under the null hypothesis of a random distribution of CSEP genes cannot be computed analytically, and we rely on a permutation procedure for its assessment. This algorithm provides a list of all clusters of at least two CSEP genes for all chromosomes or contigs of a given genome, with their corresponding P value.
We applied this new cluster detection algorithm to the five sequenced smut fungi and Ma. globosa and P. flocculosa. We name clusters in all species using the convention “species name–chromosome/contig number–cluster number,” so that cluster Um-chr19-2 is the second cluster on chromosome 19 of U. maydis, previously labeled 19A in (Kämper et al. 2006). We identify 35 clusters of CSEPs with a maximum FDR of 10% after correction for multiple testing (supplementary table S3, Supplementary Material online). All genomes display significant clustering of CSEP genes, yet to distinct degrees (table 2). Sporisorium scitamineum appears to have the largest cluster (33 genes), the highest number of significant clusters (10 clusters) and the highest number of clustered CSEP genes (147 genes). All significant clusters of U. maydis and S. reilianum overlap with previously published clusters (Kämper et al. 2006) and diversity regions (Schirawski et al. 2010; supplementary table S3, Supplementary Material online). Overall, we show that gene clusters of size less than 4 (including several of the diversity regions of Schirawski et al. [2010]) are not statistically significant given the proportion of CSEP genes on the chromosome they are localized in. The fact that smaller clusters do not depart from the expected distribution of cluster sizes under the hypothesis of a random distribution of CSEP along the genome does not preclude their functional relevance. In this work, however, we aim at understanding the evolution of CSEP clusters and therefore focus on clusters that cannot be explained by a random distribution of CSEP genes. While we provide the complete list of clusters in all seven genomes (supplementary table S3, Supplementary Material online), we only consider in the following the clusters that remain significant after correction for multiple testing (FDR < 10%, highlighted in gray in supplementary table S3, Supplementary Material online).
Number and Size of Clusters of CSEP Genes in the Five Sequenced Smut Fungi and Their Relatives P. flocculosa and Ma. globosa
| Nb Clusters with Size ≥ 3 | Nb Clusters (FDR ≤ 10%) | Size of the Largest Cluster | Average Cluster Size (FDR ≤ 10%) | Nb Clustered Genes (FDR ≤ 10%) | |
|---|---|---|---|---|---|
| S. scitamineum | 18 | 10 | 33 | 15 | 147 |
| S. reilianum | 22 | 9 | 17 | 11 | 103 |
| U. maydis | 22 | 9 | 29 | 11 | 100 |
| U. hordei | 9 | 0 | 6 | 0 | 0 |
| M. pennsylvanicum | 6 | 2 | 10 | 8 | 15 |
| P. flocculosa | 25 | 3 | 26 | 18 | 54 |
| Ma. globosa | 7 | 4 | 8 | 5 | 20 |
Reconstruction of Homology Relationships between Cluster Families Sheds Light on the Mechanisms of Their Evolution
We inferred the evolutionary relationships of clusters of CSEP genes in smut fungi and their relatives in order to understand their origin and evolution. We developed a BLASTp-based procedure that groups CSEP gene clusters from all seven species with at least one homologous CSEP. By extension, we consider two clusters of CSEP genes as homologous if they contain at least one gene with homologs within the two clusters. Following gene homology relationships, we further introduced the following distinction for cluster homology types: orthologous clusters are formed of homologous clusters belonging to distinct species, whereas paralogous clusters refer to homologous clusters located in the same species. In order to aid the visualization of similarities between clusters, we developed a hierarchical clustering procedure that represents the evolutionary relationships of CSEP clusters based on the distribution of homologous genes.
All 35 significant clusters were grouped into 15 families (supplementary table S3, Supplementary Material online). In several cases, the interspecific comparison allowed to extend the annotation of clusters, by including neighboring genes not predicted to encode a secreted effector but homologous to CSEPs in other species. In addition, ten clusters not detected by analyzing individual genomes were discovered by such an interspecies comparison (see supplementary table S3, Supplementary Material online, for a detailed list). Each family of clusters was displayed as a Circos diagram to visualize the gene-wise relationships (Krzywinski et al. 2009; figs. 4 and 5;supplementary fig. S3, Supplementary Material online). The diagram shows all clusters from a given family, together with homology relationships between genes. Two genes connected by a line were found to share some similarity (the degree of which being represented by the thickness of the line) and therefore inferred to be homologous. In order to assess the synteny context of the clusters, up to three flanking genes are also plotted with their homology relationships.
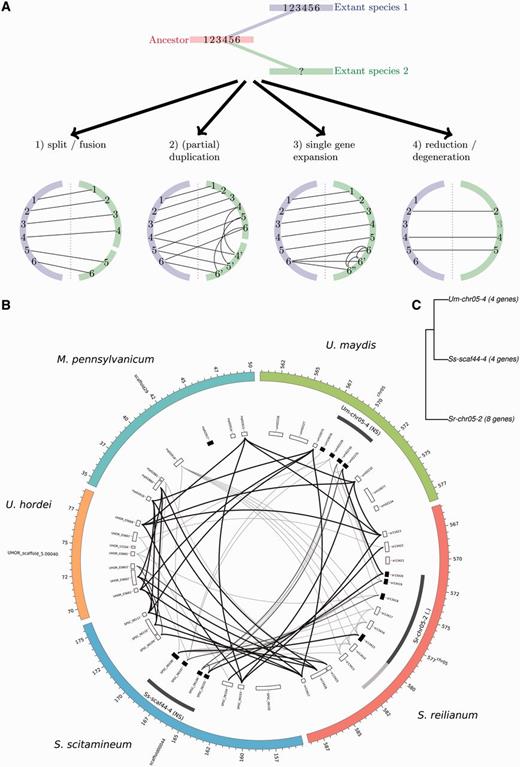
—Mechanisms of cluster evolution. (A) Different types of events affecting evolution of a single cluster. The evolution of a CSEP cluster comprising six genes is depicted in relation to divergence of two species: species 1 (in blue) keeps the ancestral organization of the cluster while species 2 (in green) undergoes evolutionary changes. Corresponding expected Circos diagrams for the two species are depicted for four cases. (B) Example of cluster family 9. Circos diagram showing relationships between homologous gene clusters. Outer ring: contigs/chromosomes. First inner ring: CSEP clusters as detected (dark gray) and homology extensions (light gray). Significance codes are as follow: <0.001 (***), <0.01 (**), <0.05 (*), <0.1(.), > 0.1 (nonsignificant, NS). Second inner ring: genes. CSEP genes are shaded in black, transposase-related genes in gray. Inner part: gene similarities, a link between two genes implies at least one blast hit with an E value < 1e-6. Thin gray highlighted links correspond to genes with at least 40% protein identity on 10% of their length, thick black links to genes with at least 50% identity on 20% of their length. (C) Relationships between homologous clusters for cluster family 9 showing subfamilies and cluster sizes (see Materials and Methods for a description of the clustering algorithm).
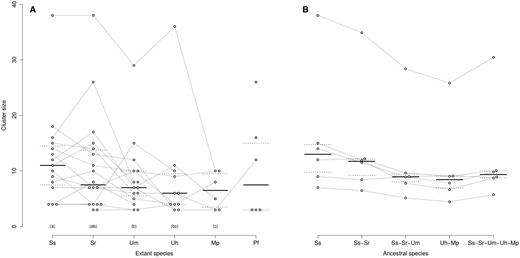
—Size evolution of CSEP clusters. Each dot represents one cluster in one species. Orthologous clusters between species are connected by a gray line. For each species, the horizontal black line shows the median of cluster sizes, and the dotted lines the first and third quartiles. Species with identical letter (a, b, or c) are not significantly different respectively to their cluster sizes with a false discovery rate below 10% after correction for multiple testing. (A) This graph displays the detected clusters from table 2. (B) This graph displays cluster size in the ancestral species, as estimated using a Brownian model (see Materials and Methods), together with observed values for S. scitamineum. Species code as in figure 2.
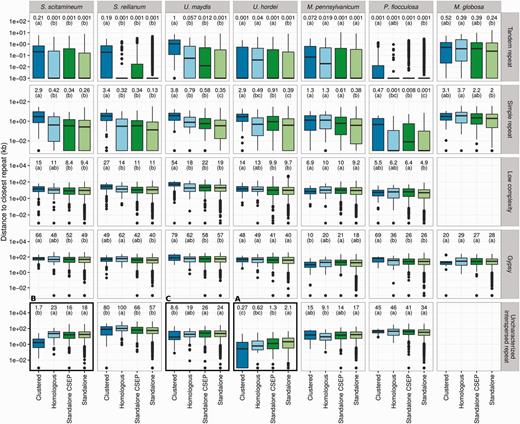
—Association of genes with repeats for the five smut fungi and the outgroup species P. flocculosa and Ma. globosa. The distribution of the distance for each gene to the closest repeat is compared for four categories: genes located within a CSEP cluster (“Clustered” category), not located in a cluster but homologous to a CSEP gene located in a cluster of another species (“Homologous” category) and genes neither clustered nor homologous to a clustered gene (“Standalone CSEP” for CSEP genes, and “Standalone” category for others). Calculations are done separately for each selected repeat class each repeat class indicated on the right. Distances are in log scales, box-and-whiskers plots show the median and 25–75% intervals. Median distances for each category are reported on top, as well as significance groups (see Materials and Methods). Distances labeled with the same letter are not significantly different, with a false discovery rate lower than 1% after correction for multiple testing. All distances are in kb. Framed panels are discussed in more details in the main text. See supplementary figure S6, Supplementary Material online, for additional repeat classes.
We consider that distinct types of events can affect the evolution of CSEP gene clusters, as illustrated in figure 3A. A CSEP cluster can be split because of genomic rearrangement (fig. 3A, case 1). The common origin of the two split clusters can be recovered by single gene homology relationships with a larger cluster in another species. Several species and their corresponding phylogeny are however needed in order to reconstruct the most likely ancestral state of the cluster, that is, to distinguish between a split and a fusion scenario. A CSEP cluster can undergo a (partial) duplication, a scenario that leads to a pattern of homology relationships similar to the split/fusion scenario, but with additional intraspecific paralogy relationships (fig. 3A, case 2). A related case, that we designate “single gene expansion” occurs when a single gene is duplicated, typically several times (fig. 3A, case 3). Finally, we have to consider the loss of CSEP genes in a cluster, either by genomic rearrangement, or by pseudogenization or loss of CSEP function because of loss or alteration of the secretion signal (fig. 3A, case 4). The evolutionary history of each cluster family is complex, as it is a mixture of several of these events occurring at different time points along the multiple species phylogeny. To this natural complexity one has to add the difficulty of recovering ancient homology relationships inherent to fast-evolving genes. In the next paragraphs, we investigate in details the evolutionary history that led to each cluster family.
Clusters of CSEPs in Ma. globosa and P. flocculosa Are Unrelated to Clusters in Plant-Pathogenic Smuts
The four CSEP clusters of Ma. globosa were gathered into three families containing no cluster from other species (families 13–15; table 3; supplementary figs. S3M, S3N, and S3O, Supplementary Material online). Gene clusters in Ma. globosa are therefore not only more rare, but are also unrelated to clusters in the other species. These clusters contain lipase genes (Xu et al. 2007). The lipase gene clusters reported in Xu et al. (2007) are, however, only partially overlapping with the ones reported here, as they contain genes that are not considered as CSEP genes with our criteria (supplementary table S4, Supplementary Material online).
Organization of Clusters in Families and Subfamilies for the Seven Species Considered in This Work
| Family | Subfamily | S. scitamineum | S. reilianum | U. maydis | U. hordei | M. pennsylvanicum | P. flocculosa | Ma. globosa | |||||||
|---|---|---|---|---|---|---|---|---|---|---|---|---|---|---|---|
| 1 | 1 | Ss-scaf02-1 | 38 | Sr-chr19-1 | 38 | Um-chr19-2 | 29 | Uh-scaf17-2 | 36 | Mp-scaf25-1 | 10 | ||||
| 2 | Ss-scaf09-1 | 11 | Sr-chr06-3 | 15 | Um-chr06-2 | 8 | |||||||||
| 2 | 1 | Ss-scaf30-2 | 18 | Sr-chr08-2 | 13 | Um-chr08-5 | 12 | Uh-scaf37-3 | 3 | ||||||
| 3 | 1 | Ss-scaf44-2 | 16 | Sr-chr05-4 | 26 | Um-chr05-6 | 8 | ||||||||
| 2 | Sr-chr01-2 | 3 | Um-chr01-4 | 3 | Pf-scaf17-2 | 3 | |||||||||
| 3 | Uh-scaf41-1 | 6 | Pf-scaf01-4 | 3 | |||||||||||
| 4 | Ss-scaf38-3 | 10 | Sr-chr11-1 | 4 | Um-chr11-1 | 15 | Uh-scaf07-1 | 10 | |||||||
| 4 | 1 | Ss-scaf36-1 | 14 | Sr-chr10-1 | 11 | Um-chr10-1 | 10 | Uh-scaf24-1 | 4 | Mp-scaf10-1 | 8 | ||||
| 5 | 1 | Ss-scaf21-1 | 4 | Sr-chr02-1 | 4 | Um-chr02-1 | 3 | Uh-scaf61-1 | 4 | ||||||
| 2 | Sr-chr20-3 | 4 | |||||||||||||
| 3 | Sr-chr01-4 | 3 | |||||||||||||
| 4 | Ss-scaf33-3 | 13 | Sr-chr12-1 | 7 | Um-chr12-1 | 6 | |||||||||
| 6 | 1 | Ss-scaf21-2 | 15 | Sr-chr02-2 | 14 | Um-chr02-3 | 6 | Uh-scaf61-1 | 6 | Mp-scaf71-1 | 3 | Pf-scaf03-1 | 12 | ||
| 7 | 1 | Ss-scaf44-1 | 4 | Sr-chr05-6 | 4 | ||||||||||
| 2 | Ss-scaf44-5 | 12 | Sr-chr05-1 | 17 | Um-chr20-1 | 7 | Uh-scaf40-2 | 11 | Mp-scaf29-1 | 5 | |||||
| 8 | 1 | Ss-scaf14-4 | 7 | Sr-chr20-5 | 7 | Um-chr05-3 | 7 | Uh-scaf36-1 | 3 | Mp-scaf34-1 | 3 | ||||
| 2 | Ss-scaf46-1 | 8 | Sr-chr07-4 | 10 | Um-chr07-2 | 5 | Uh-scaf43-1 | 4 | |||||||
| 9 | 1 | Ss-scaf44-4 | 4 | Sr-chr05-2 | 8 | Um-chr05-4 | 4 | ||||||||
| 10 | 1 | Ss-scaf45-1 | 9 | Sr-chr21-1 | 7 | Um-chr21-2 | 10 | Um-scaf09-1 | 9 | Mp-scaf37-1 | 10 | ||||
| 11 | 1 | Pf-scaf22-1 | 26 | ||||||||||||
| 2 | Pf-scaf01-8 | 3 | |||||||||||||
| 12 | 1 | Pf-scaf15-1 | 16 | ||||||||||||
| 13 | 1 | Mg-scaf17_1-1 | 3 | ||||||||||||
| 2 | Mg-scaf1_1-2 | 4 | |||||||||||||
| 3 | Mg-scaf8_1-1 | 8 | |||||||||||||
| 4 | Mg-scaf8_1-2 | 3 | |||||||||||||
| 14 | 1 | Mg-scaf1-2-2 | 4 | ||||||||||||
| 15 | 1 | Mg-scaf3_1-1 | 4 | ||||||||||||
NOTE.—Species are displayed column-wise, with the cluster nomenclature and their corresponding size. Clusters on the same row are inferred to be orthologous and belong to the same subfamily. Clusters grouped in the same family but on distinct rows are paralogous.
We find 11 clusters of at least four CSEP genes in P. flocculosa, although only the three largest ones (more than 12 genes) appear to be significant after correction for multiple testing. The largest cluster is located on scaffold 22 and has 26 genes (among which are 17 CSEPs, cluster family 11; table 3; supplementary fig. S4K, Supplementary Material online). It contains P. flocculosa-specific gene duplications, as well as nine genes with homologous genes in other locations of the P. flocculosa genome. Only one gene within this cluster, pf05965, shows similarities with genes in U. maydis (um03924), S. reilianum (sr14829), and M. pennsylvanicum (mp01368), as well as with another P. flocculosa gene (pf00755, on scaffold 2). um03924 encodes the Rep1 repellent, a repetitive, processed protein responsible for surface hydrophobicity and aerial hyphal growth of U. maydis (Wösten et al. 1996). pf05965 appears to have a single homolog in U. hordei (UHOR_08891) and S. scitamineum (SPSC_05566). Even a BLAST E value threshold as low as 0.1 did not detect more homologous genes, which emphasizes the species specificity of this cluster. The pf00755 gene shows high similarity with rep1 but is not predicted to be secreted. pf05965 is a much shorter version of the gene, containing only a short segment of the N terminal part, encompassing the first of the twelve repeats only, and displaying the Kex2 recognition motif. pf05965 appears to be more similar to pf00755 than to homologous genes in other species, suggesting a duplication event in the ancestry of P. flocculosa, after its divergence from smut fungi. The pf05965 encoded protein is predicted to be secreted. To assay its function, it would be interesting to assess if pf05965 can complement the U. maydis rep1 mutant or whether this short version has a P. flocculosa specific function. The second largest cluster is located on scaffold 15 and contains 16 genes, of which nine encode CSEPs (family 12; table 3; supplementary fig. S4L, Supplementary Material online). This cluster contains a central part of eight genes, seven of which are CSEPs, and one, pf04670, not a CSEP but homologous to its neighboring gene, pf04669, itself a CSEP. Two more flanking CSEPs, pf04680 and pf04665 are included in the cluster definition but are separated each by three unrelated non-CSEPs. In the central cluster, only pf04676 displays homology with genes in S. scitamineum (SPSC_00645, 59% identity), S. reilianum (sr16807, 57% identity), U. maydis (um06365, 50% identity), U. hordei (UHOR_08891, 43% identity), and M. pennsylvanicum (mp04690, 36% identity). Only the S. reilianum homolog sr16807 encodes a CSEP, suggesting a rather divergent evolution of these genes or annotation errors. Family 6 contains the last of the significant clusters of P. flocculosa, containing 12 genes located on scaffold three. Family 6 contains six homologous clusters, one in each analyzed species except Ma. globosa, suggesting a rather ancient origin.
Among nonsignificant clusters (i.e., groups of at least three CSEPs with FDR higher than 10% when testing for random association), only three can be mapped to clusters in other species. Cluster family 3 (table 3; supplementary fig. S4C, Supplementary Material online) that consists of two clusters in U. hordei, three clusters in U. maydis, two in S. scitamineum, and four in S. reilianum, as well as two clusters of three genes each in P. flocculosa, one on scaffold 1 and one on scaffold 2. An additional CSEP cluster of three genes on scaffold 14 of P. flocculosa is homologous to a cluster of three genes on chromosome 1 of U. maydis (um11443, um00538, and um1444). These analyses illustrate that P. flocculosa displays a similar amount of CSEP clustering as the plant pathogenic Ustilaginales as noted before by Lefebvre et al. (2013). Our results show, however, that the majority of these clusters has evolved independently of the clusters found in the smut fungi. The biological role of gene clusters in P. flocculosa remains to be characterized.
Eight Cluster Families Are Shared by Pathogenic Smuts
Eight cluster families (families 1, 2, 4, 5, 7, 8, 9, and 10; supplementary table S3, Supplementary Material online) exclusively group clusters from the five plant pathogens with no homologous cluster in P. flocculosa or Ma. globosa (supplementary fig. S4, Supplementary Material online), suggesting that these clusters originated from the last common ancestor of U. hordei, U. maydis, S. scitamineum, S. reilianum, and M. pennsylvanicum. Families 2, 4, 9, and 10 contain one cluster only in each species. No trace of a homologous cluster from family 2 could be found in M. pensylvannicum, suggesting a secondary loss (Sharma et al. 2014). We also noticed that clusters in U. hordei tend to be smaller in these four families. As synteny is not fully conserved between the four species, it is difficult to assess whether the clusters in U. hordei have been shuffled because of, for instance, transposable elements. It is noteworthy that the cluster in family 2 has several paralogs spread on other contigs (supplementary fig. S4B, Supplementary Material online). These paralogs are however more similar to each other than they are to their homologs in other species and are absent from the M. pennsylvanicum genome, suggesting that these duplications are not ancestral but occurred later on the U. hordei branch, after the split with M. pennsylvanicum.
Family 9 contains a cluster of four CSEP genes in U. maydis on chromosome 5 (labeled as cluster 5_3 in [Schirawski et al. 2010] fig. 3B). The S. scitamineum scaffold 44 contains a homologous cluster of four genes. The orthologous cluster is however reduced to a single gene in U. hordei (UHOR_03665, fig. 3B). The conservation of synteny with flanking genes suggests that this reduced cluster is not the result of rearrangement or shuffling due to transposable elements. Thus, the genes in the cluster were either excised in U. hordei, or expanded in the other species. Interestingly, while UHOR_03665 encodes a protein with a predicted signal peptide, it is confidently predicted by ProtComp to encode a membrane bound mitochondrial protein (integral score 9.1) and was therefore not considered as a CSEP according to our criteria. In S. reilianum, the cluster expanded further with one gene (sr13415) being specifically amplified to five copies (fig. 3B). The species phylogeny allows in this case to conclude a species-specific expansion, since the alternative—less parsimonious—scenario would involve independent losses in U. maydis and S. scitamineum. This family is therefore likely an example of birth and growth of a cluster by duplication of CSEP genes (fig. 3A, case 3).
Cluster family 10 contains only one significant cluster in U. maydis on chromosome 21. However, homologous clusters can be inferred by synteny in the four other pathogenic smuts (supplementary fig. S4J, Supplementary Material online). While this cluster seems to be rather conserved in size and synteny, several genes are not predicted as CSEPs in other species. Further experimental evidence is needed to assess whether the corresponding proteins are indeed not secreted or if they are incorrectly annotated.
Families 1, 5, 7, and 8 contain at least two paralogous clusters in at least one species, defining subfamilies of clusters. Two scenarios can lead to multiple related clusters: 1) one ancestral cluster is split by a genomic rearrangement, resulting in two smaller clusters (fig. 3A, case 1), and 2) one cluster is (partially) duplicated (fig. 3A, case 2). In the latter case, one of the two paralogous clusters retains a similar composition to the ancestral cluster. The distinction between these two scenarios is complicated by 1) the absence of an outgroup, preventing the reconstruction of the ancestral cluster and 2) the occurrence of more recent evolutionary events posterior to the duplication/split. Family 8 is composed of two subfamilies with one cluster in each species (table 3, supplementary fig. S4H, Supplementary Material online). The split or duplication of the ancestral cluster therefore occurred in the common ancestor of the five species, with a secondary loss of one subfamily in M. pennsylvanicum. Family 7 is composed of one subfamily with one cluster in each of the five smut fungi, and one subfamily of a smaller cluster of four genes specific to S. reilianum and S. scitamineum (supplementary fig. S4G, Supplementary Material online). This smaller cluster is most likely a more recent acquisition that happened in the common ancestor of the two Sporisorium species, after the split from U. maydis. The sizes of these clusters suggest that the new, smaller cluster arose by duplication (fig. 3A, case 2) and not by splitting of an ancestral cluster. Family 5 contains two subfamilies of clusters. One subfamily lacks a cluster in U. hordei, suggesting a birth of this cluster in the last common ancestor of U. maydis, S. scitamineum, and S. reilianum. The second subfamily is represented in the four species, but with two additional clusters in S. reilianum, one on chromosome 20 and one on chromosome 1 (supplementary fig. S4E, Supplementary Material online). Homologous genes for these clusters are found in S. scitamineum (one single gene [SPSC_02294] on scaffold 16 and two genes [SPSC_01738 and SPSC_01739] on scaffold 14), but not in U. maydis or U. hordei. The conservation of synteny between the two Sporisorium species around these loci supports their homology, and further suggests that these clusters originated in the ancestor of S. reilianum and S. scitamineum from single genes and have further expanded in the S. reilianum lineage. Cluster family 1 includes the largest clusters, including cluster 19A in U. maydis (labeled Um-chr19-2 in this work), together with cluster 6A (labeled Um-chr06-2; Kämper et al. 2006). These two clusters form distinct subfamilies with one homologous cluster in the genomes of S. reilianum and S. scitamineum (supplementary fig. S4A, Supplementary Material online). A homologous cluster of ten genes is found in M. pennsylvanicum (Sharma et al. 2014), yet we find that several of the clustered genes are the results of lineage-specific duplications as they are more similar to each-other than to genes from other species (supplementary fig. S4A, Supplementary Material online). Cluster Um-chr06-2 is reduced to one homologous CSEP in U. hordei (UHOR_12257, not shown). A U. hordei cluster of similar size to U. maydis Um-chr19-2 and S. scitamineum Ss-scaf02-1 can be predicted, yet several of the corresponding genes are either similar to transposases or not predicted to encode CSEPs (9 genes out of 36, as opposed to 22/29 in Um-chr19-2 and 32/38 in Ss-scaf02-1). A possible explanation is that these genes encode degenerated effectors that have lost their secretion signal (fig 3A, case 4).
Clusters of CSEPs Are Dynamic Gene Families
Several of the clustered genes are paralogs, suggesting tandem repeat duplication as a possible mechanism of evolution. In order to further test this hypothesis, we developed a statistical “relatedness” test to assess whether clustered genes in a given genome are more likely homologous to each other as opposed to other contiguous sets of genes of comparable size (see Materials and Methods). We report that with the exception of cluster Um-chr21-2, the proportion of paralogs within statistically significant clusters in the seven genomes is significantly higher than expected by chance from randomly selected sets of contiguous genes with equivalent size (supplementary table S3, Supplementary Material online). Similarly, 85% of clusters with at least three CSEPs showed a significant relatedness (global FDR lower than 10%). These results support the role of tandem duplication as a plausible mechanism of cluster genesis.
We further investigated the dynamics of clusters of CSEPs by comparing the size of homologous clusters in distinct species. We show that clusters in S. scitamineum are significantly larger than in U. maydis, U. hordei, and M. pennsylvanicum (fig. 4A). Sporisorium scitamineum SscI8 also displays larger clusters than S. reilianum, but the difference is not found significant. Using cluster families present in all five plant pathogens, we reconstructed the size of CSEP clusters in the ancestor species of S. scitamineum and S. reilianum (noted Ss-Sr), Ss-Sr and U. maydis (noted Ss-Sr-Um), U. hordei and M. pennsylvanicum (noted Uh-Mp) and Ss-Sr-Um and Uh-Mp (noted (Ss-Sr-Um-Uh-Mp). The resulting inferred cluster sizes are shown in figure 4B. Even if one considers that the smaller size of U. hordei CSEP cluster results from secondary reduction due to the activity of transposable elements, these results show a trend toward a global increase of cluster sizes along the lineage of S. scitamineum, with smaller clusters in the Ss-Sr and Ss-Sr-Um ancestors.
In several cases (Family 1-1, 3-4, 7-2, 10-1, see table 3; supplementary figs. S3A, S3C, S3G, and S3J, Supplementary Material online) clusters in U. hordei are not significantly reduced but several of the residing genes are not classified as CSEPs. The assembly of the U. hordei genome is the one with the lowest quality, preventing in some cases to correctly build gene models because of contig breaks that might in one instance (UHOR_14482) account for not finding a secretion signal. This does not however account for the general significant trend of a lower proportion of CSEP genes in U. hordei clusters (supplementary fig. S5, Supplementary Material online).
A closer investigation revealed that such non-CSEP clustered genes are unrelated to clustered CSEPs, and in addition they do not show homology with any clustered genes in other species. This suggests that these genes have moved because of genome rearrangements promoted by the activity of mobile elements.
Genes in Clusters Are Associated with Repeated Elements
The reduced amount of clustering in CSEPs of U. hordei has been noted before and was proposed to result from the activity of transposable elements that might have affected genome organization and shuffled existing gene associations (Laurie et al. 2012). According to this hypothesis, we expected unclustered CSEP genes in U. hordei homologous to clustered genes in other smut genomes to be significantly associated with interspersed repeats. In order to test this prediction, we computed the distance to the closest repeat for each gene and each repeat class in the genomes of all five smut fungi as well as the two related species P. flocculosa and Ma. globosa (fig. 5; supplementary fig S6, Supplementary Material online). In U. hordei, nonclustered CSEP genes homologous to a clustered CSEP gene in another species are significantly closer to an interspersed repeat (median distance: 620 bp; fig. 5, framed panel A, light blue box) than standalone genes, that is, genes not belonging to any cluster and not homologous to a clustered gene in any other species (median distance: 2,100 bp; fig. 5, framed panel A, light green box). This difference is not significant in U. maydis and S. scitamineum, and a significant difference, but with opposite direction is measured in S. reilianum. This relationship only holds for uncharacterized, de novo predicted interspersed repeats, while characterized interspersed repeats linked to transposable elements such as Copia, Gypsy, or Jockey do not show this effect (supplementary fig. S6, Supplementary Material online). This supports the hypothesis that these CSEP genes in U. hordei have moved because of their association with transposable elements. Interestingly, unclustered CSEP homologous to a clustered CSEP in another species are also significantly associated to interspersed repeats in M. pennsylvanicum, the closest relative of U. hordei.
Next, we assessed whether CSEP genes are associated with repeats, as it has been hypothesized that repeated sequences could be drivers of adaptation due to their mutagenic effect (Raffaele and Kamoun 2012; Gladieux et al. 2014; Grandaubert et al. 2014). Only in U. hordei have standalone genes encoding a CSEP a significantly shorter distance to interspersed repeats (fig. 5, framed panel A, dark green box, median distance: 1,300 bp for standalone CSEPs vs. 2,100 bp for other standalone genes, light green box). Interestingly, clustered CSEP genes in U. maydis, S. scitamineum, and U. hordei are significantly closer to uncharacterized interspersed repeats than other genes (fig. 5, dark blue vs. light green boxes: 270 bp vs. 2,100 bp in U. hordei [framed panel A], 1,700 bp vs. 18,000 bp in S. scitamineum [framed panel B] and 8,600bp vs. 24,000 bp in U. maydis [framed panel C]). In M. pennsylvanicum and S. reilianum the distances to uncharacterized repeats do not significantly differ, but distances to repeats are much larger in S. reilianum (80,000 bp vs. 15,000 bp, fig. 5). Clusters of M. pennsylvanicum are however significantly associated to the EnSpm repeat family, that is virtually absent (<100 copies) in other smut genomes (supplementary fig. S6, Supplementary Material online). These results suggest that the association of interspersed repeats with CSEPs is in most smut fungi restricted to clusters of CSEP genes, suggesting that clusters of genes encoding CSEPs are an example of genome compartmentalization (Rouxel et al. 2011). The effect of such repeats on genome reorganization as observed in U. hordei is thus likely a secondary effect of this association, potentially resulting from a less stringent control of the activity of transposition. It is noteworthy that only uncharacterized interspersed repeats, resulting from de novo prediction are associated with CSEP clusters, suggesting the involvement of a particular class of transposable elements that remains to be characterized. Such uncharacterized repeats do not show any particular patterns of gene-association in P. flocculosa, the closest outgroup species in our data set, and are absent from the reduced genome of Ma. globosa (supplementary fig. S6, Supplementary Material online).
Repeats Play Multiple Roles in the Evolution of Clusters of CSEPs
The general potentially beneficial mutagenic effect of repeat sequences—whether they result from transposable elements or not—on adaptability has been previously discussed (Raffaele and Kamoun 2012; Grandaubert et al. 2014). In the case of CSEP gene clusters evolving mostly by duplication, we hypothesize that repeat elements may play multiple roles at distinct stages of the evolution of these clusters, which we summarize in figure 6. Repeat elements associated to a CSEP may mediate their duplication by homologous recombination (fig. 6A). At this stage, the further expansion of CSEP clusters does not require repeat elements to occur, as long as duplicated genes are similar enough to permit homologous recombination. Repeat elements, if present, will enhance further expansion of the cluster, as well as the putative copying of genes to an ectopic location in the genome (fig. 6B). The two new copies most likely will have inherited the original function of the parental gene. Purifying selection will favor concerted evolution of the two copies via gene conversion, if an altered gene product interferes with the function of the product from the other copy. A certain amount of divergence is needed to uncouple the evolution of the two copies, which can be favored by repeat elements: the fast evolution of repeats prevents gene conversion and therefore allows individual copies to accumulate variation (Ohta 2000; fig. 6C). Under the strong selective pressure that typically characterizes CSEP genes, the resulting increased adaptability is expected to compensate the negative effect due to interference with the original function of the gene. Lastly, as reported elsewhere (Grandaubert et al. 2014), repeat elements play a role as mutagens, catalyzing the fast acquisition of new functions, either by modifying the gene product content or by modifying its expression, for instance by altering promoter regions (Raffaele and Kamoun 2012; Gladieux et al. 2014; Grandaubert et al. 2014). Through the insertion of new repeat copies or by RIP-slippage, transposable elements might also inactivate CSEP genes, abolishing effector secretion or affecting effector expression (fig. 6D).
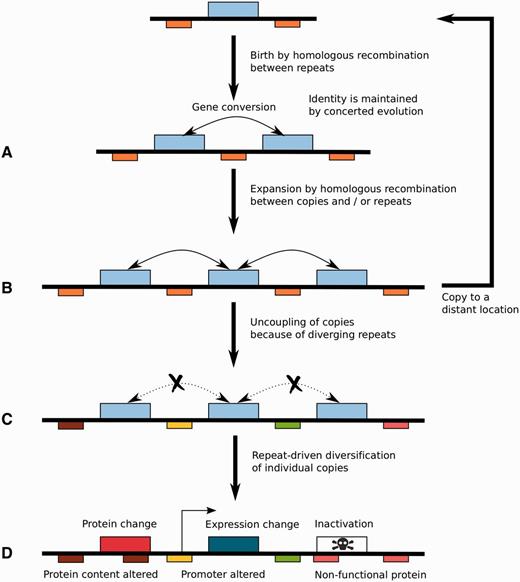
—Proposed role of transposable elements in the evolution of CSEP clusters. Upper blue boxes designate CSEP genes. Lower boxes show repeat elements. Identical elements share the same color, whereas diverged elements are depicted with distinct colors. Crossed dotted arrows indicate the suppression of gene conversion.
The Genome Localization of Genes Encoding CSEPs Is Under Selection
Effector proteins play a fundamental role in the life cycle of pathogens, because they are thought to permit and modulate the interaction with the host. As such, effectors are typically rapidly evolving in response to the reciprocal evolution of their interacting host proteins. Effectors are also expected to play a role in adaptation and in jumps to new hosts, eventually leading to speciation (Stukenbrock and McDonald 2009; Giraud et al. 2010; Stukenbrock 2013; Dong et al. 2014). As more genomes of pathogens are studied, more mechanisms enforcing adaptability of pathogens via the evolution of effector genes are uncovered. In some species effectors are found in distinct regions of the genome (Rouxel et al. 2011; Raffaele and Kamoun 2012; Jonge et al. 2013; Grandaubert et al. 2014). Genome compartmentalization can be advantageous both at the functional and evolutionary level. From a functional point of view, genes physically linked can be coregulated, either because they share regulatory sequences or by means of epigenetics regulation (Hurst et al. 2002). At the evolutionary scale, linked genes can be horizontally cotransferred as a functional unit, as has been demonstrated for cluster of genes involved in secondary metabolism (Wisecaver et al. 2014). Alleles of linked loci also have a higher chance to be vertically cotransmitted and to cosegregate in populations, reducing the possibility of allele incompatibility. The genome localization of a gene also plays an important role. For instance, a high mutation rate can be advantageous for CSEP genes under evolutionary arms race since it increases the diversity for natural selection to act on. A high mutation rate is however disadvantageous for housekeeping genes evolving mostly under purifying selection, because the newly generated alleles will be almost exclusively deleterious. As different regions of the genome evolve under distinct mutation rates (Wolfe et al. 1989; Dillon et al. 2015), the location of genes can be under selection, and grouping CSEP genes might be beneficial as they would share the same genomic context. Possible causes underlying the variation of mutation rates along the genome include the proximity of repeats which can induce mutations because of RIP-slippage, the RIP mechanism introducing mutation in the vicinity of the target repeated region (Grandaubert et al. 2014).
To test whether clusters of CSEP genes are associated with a higher mutation rate, we compared the rate of mutations in clustered CSEP genes with the rate of mutation in nonclustered genes (CSEP and non-CSEP). We computed the rate of synonymous substitutions (Ks) using the counting method of Nei and Gojobori (1986), where Ks is proportional to the mutation rate under the hypothesis that synonymous substitutions are neutral. We focused on the three most closely related species in our data set, S. scitamineum, S. reilianum, and U. maydis, to minimize saturation of substitution counts. We report for all three species that the rate of synonymous substitutions is significantly higher in clustered CSEP genes compared to standalone CSEP and non-CSEP genes (fig. 7, Kruskal–Wallis rank test with correction for multiple testing, FDR of 1%). While it cannot be distinguished whether this high mutation rate is selected for or is simply a by-product of the evolution by duplication of the clustered genes, these results are consistent with the idea that clusters of CSEP genes in smut fungi are a form of “evolutionary cradle” (Croll and McDonald 2012), that is, specialized genome compartments where rapid and recurrent adaptation is occurring.
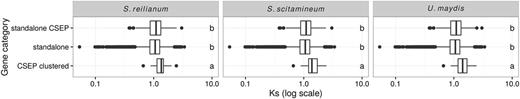
—Mutation rate in clustered CSEP genes versus nonclustered genes. The rate of synonymous substitution (Ks) was used as a proxy for the mutation rate in clustered CSEP genes and CSEP and non-CSEP standalone genes. For each species, groups with a distinct letter are significantly different according to a Kruskal–Wallis rank test with an FDR of 1%, adjusted for multiple testing.
Another evolutionary advantage of genome compartmentalization is the isolation of CSEP genes. Because CSEP genes are typically under strong selection (Stukenbrock and McDonald 2009; Stukenbrock et al. 2011; Raffaele and Kamoun 2012) they are hazardous to the genome: selective sweeps at these loci will affect the evolution of the neighboring regions because of genetic linkage (Kim and Stephan 2003). Isolating these genes can therefore protect the rest of the genome from the hitchhiking effect of their fast evolution. Yet grouping genes under strong positive selection can also turn to be disadvantageous because interference between selective sweeps may significantly impair the efficacy of selection. To illustrate this trade-off, we computed for each gene the distance to the closest flanking gene (fig. 8). In support of the hitchhiking hypothesis, we observed in all species a general trend towards CSEP genes (fig. 8, dark green boxes) being more distant to any other gene than standalone, non-CSEP genes (fig. 8, light green boxes), and this effect was often even stronger for clustered CSEP genes. In S. scitamineum for instance, the distance between two standalone, non-CSEP genes is 360 bp on average (fig. 8, framed panel, light green boxes), compared with 430 bp for standalone, CSEP genes and 600 bp for clustered CSEP genes (fig. 8, framed panel, light blue and dark blue boxes). Increased intergenic distance in clusters of CSEP genes can therefore be favored to circumvent selective sweep interference by increasing the number of recombination events between loci. This might also explain why splitting of clusters and moving apart clustered genes might be favored. While compartmentalization is typically observed in genomes lacking sexual reproduction and has been argued to have evolved as a compensating mechanism to generate diversity (Raffaele and Kamoun 2012), our results suggest that it might also be advantageous in recombining species, in particular with gene-dense genomes undergoing recurrent selection.
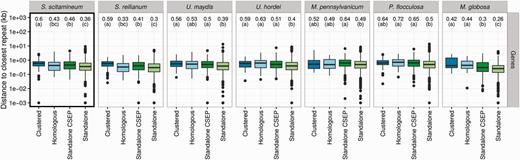
—Distribution of intergenic distances for the five smut fungi and two related species. The distribution of the distance for each gene to the closest gene is compared for four categories: genes located within a CSEP cluster (“Clustered” category), not located in a cluster but homologous to a CSEP gene located in a cluster of another species (“Homologous” category) and genes neither clustered nor homologous to a clustered gene (“Standalone CSEP” for CSEP genes, and “Standalone” category for others). See figure 5 for legends.
Conclusions
Clusters of CSEPs are a characteristic feature of smut fungi. They originate and grow by tandem gene duplication followed by rapid evolution. This mode of evolution is beneficial as it creates genome compartments where rapid adaptation is permitted with minimal cost for the rest of the genome. The expansion of CSEP clusters also happens at the intergenic level, a mechanism that might have evolved to counteract the effect of increasing selection impairment because of recurrent selective sweeps at linked genes undergoing strong positive selection. Such an expansion ultimately increases the probability for such clusters to be split apart by genome rearrangement. The association of clustered (or once-clustered) CSEP genes with interspersed repeats suggests an important role of such elements in the formation and evolution of virulence clusters.
Acknowledgments
Our work was supported through the LOEWE program of the state of Hesse through SYNMIKRO and through the Max Planck Society. J.Y.D. would like to thank Eva H. Stukenbrock for her comments on a previous version of this manuscript.
Literature Cited
Author notes
3Present address: Department of Evolutionary Genetics Max Planck Institute for Evolutionary Biology, Plön, Germany
4Present address: DOE Joint Genome Institute, Walnut Creek, California
5Present address: Microbial Genetics, Institute of Applied Microbiology, Aachen Biology and Biotechnology, RWTH Aachen University, Germany
Associate editor: Laura Rose
Data deposition: This project has been deposited at European Nucleotide Archive, ENA under the accession PRJEB6265.
