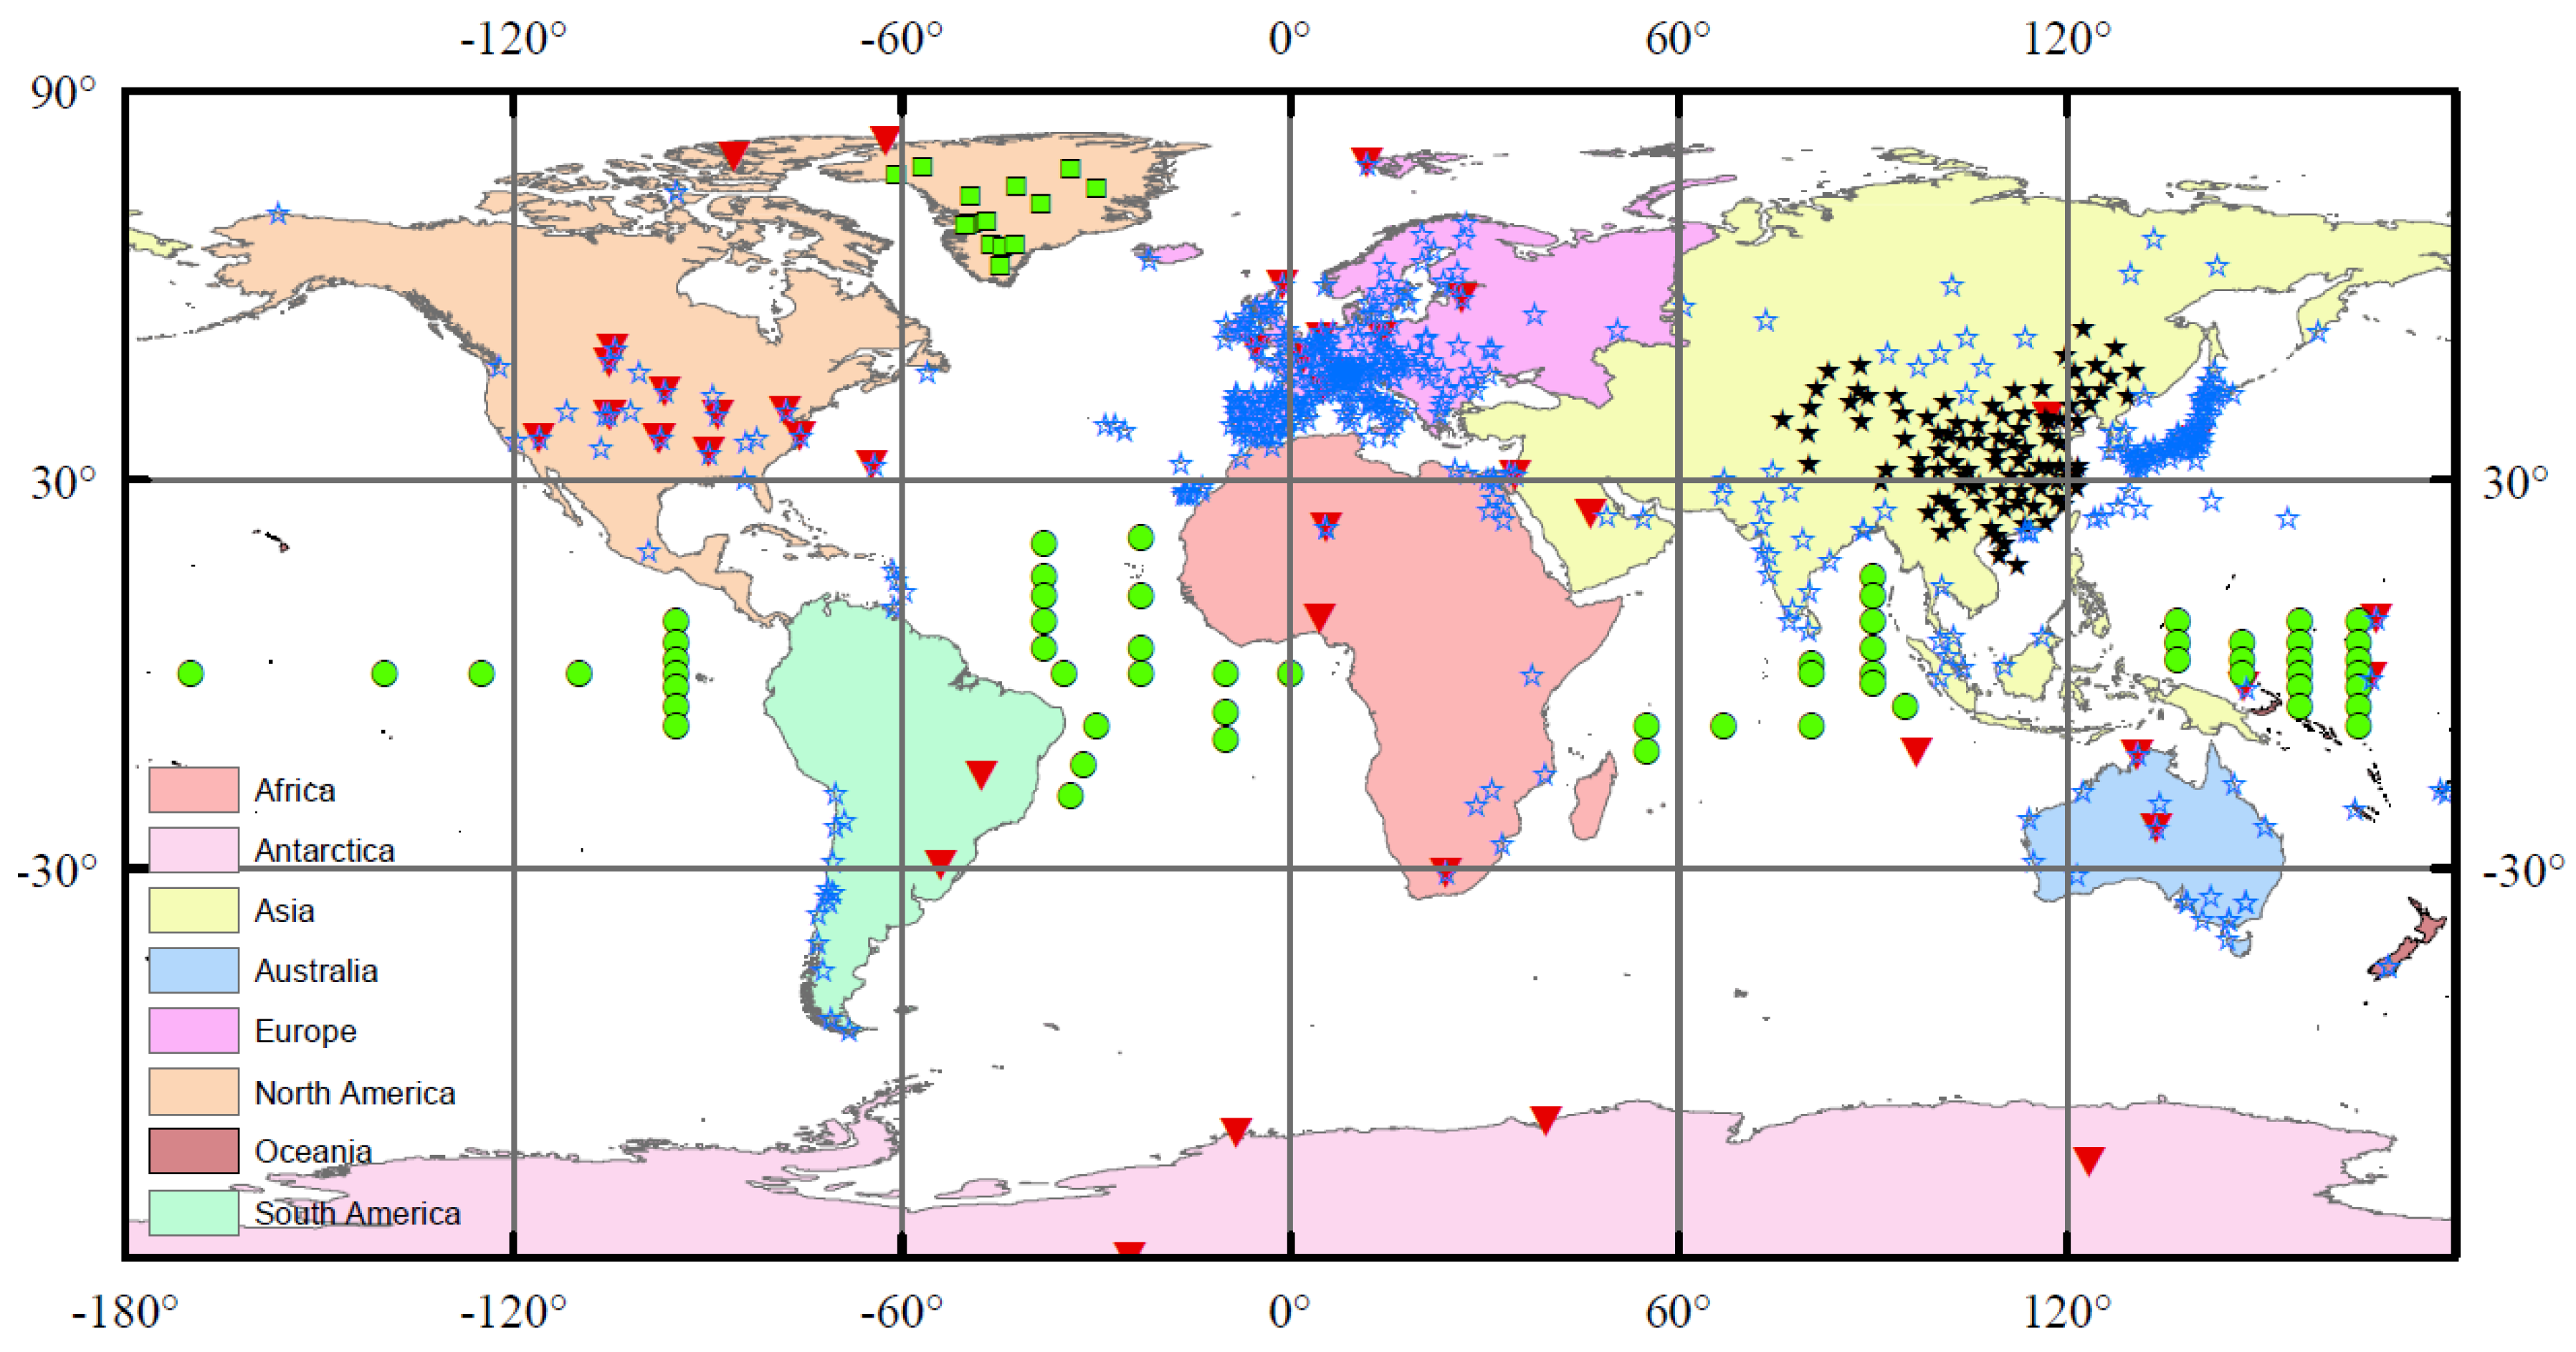
3.1. Validation Using Ground Measurements
In this study, the estimated
Rs values on the original grid scale were compared with ground-based observations within the grid cells. To perform the comparison, all of the selected global reanalysis
Rs products were projected onto a 1° spatial resolution using a bilinear interpolation of a weighted average of pixels in the nearest 2-by-2 neighborhood to match that of the CERES-EBAF (Ed2.7)
Rs data. Please note that the spatial representativeness of ground measurements is one potential error source for
Rs evaluation. Monthly representation errors at the surface sites with respect to their 1° surroundings were on average 3.7% (4 W/m
2) [
58]. Four measures were used to characterize model performance: the correlation coefficients (R), root mean squared errors (RMSE), bias, and the ratio of the standard deviation of the reanalysis or the satellite product to that of the surface measurements (σ). This last is also a good indicator to test whether the reanalysis matches the surface measurements well.
Table 2 shows the validation results of the
Rs monthly values of the six reanalysis products by comparison with surface measurements at the selected 674 stations from 2001 to 2009. The statistical measures calculated using the various surface observation network sources as the evaluation data were shown in
Table 2. It was apparent that all selected reanalysis
Rs products overestimated monthly
Rs when compared to the surface measurements from the five networks.
The ERA-Interim monthly
Rs product had an overall R of 0.98, a positive bias of 4.15, an RMSE of 19.56 W/m
2, and a ratio (σ) of 1.02 when the BSRN observations were used as validation data. When GEBA, Buoy, GC-NET, and CMA were used as validation data, the biases were 10.17 W/m
2, −2.86 W/m
2, −10.84 W/m
2, and 23.15 W/m
2, respectively. The ERA-Interim monthly
Rs product had an overall R of 0.95, a bias of 11.25 W/m
2, an RMSE of 27.70 W/m
2, and a ratio (σ) of 1.03. Because high correlation coefficients profit from the strong latitudinal dependencies of both surface-observed and reanalysis estimated
Rs, the correlation coefficients after removal of the
Rs seasonal cycle are also provided in
Table 2. The latter coefficients were calculated to reduce the impacts of seasonal cycles on the quality of
Rs agreement between surface observations and the reanalysis product, except that both include a common seasonal cycle. The MERRA
Rs product overestimated
Rs compared to most of the surface observational networks, except for GC-NET. When BSRN, GEBA, Buoy, GC-NET, and CMA were used as validation data, the biases of MERRA monthly
Rs product were 13.80 W/m
2, 22.17 W/m
2, 3.60 W/m
2, −6.09 W/m
2, and 34.38 W/m
2, respectively. The MERRA monthly
Rs product had an overall R of 0.95, a bias of 22.36 W/m
2, an RMSE of 34.13 W/m
2, and a ratio (σ) of 1.05.
One of the main purposes of NCEP-DOE was to update the parameterizations of the physical processes in NCEP-NCAR including the shortwave radiation parameterization. Clearly, the NCEP-DOE Rs product had a better accuracy than NCEP-NCAR compared to most of the surface observation networks, except for the Buoy observations. The biases of the NCEP-NCAR monthly Rs product were 40.12 W/m2, 48.95 W/m2, 5.77 W/m2, 35.73 W/m2, and 71.95 W/m2 for the BSRN, GEBA, Buoy, GC-NET, and CMA observations, whereas these values were 20.48 W/m2, 33.67 W/m2, −20.14 W/m2, 12.20 W/m2, and 45.75 W/m2 for NCEP-DOE. The NCEP-DOE monthly Rs product had an overall R of 0.90, a bias of 30.83 W/m2, an RMSE of 46.82 W/m2, and a ratio (σ) of 1.06. The CFSR showed biases of 8.97 W/m2, 13.99 W/m2, 30.91 W/m2, 5.84 W/m2, and 30.69 W/m2 compared to the BSRN, GEBA, Buoy, GC-NET, and CMA observations, respectively. The overall R, bias, RMSE, and ratio (σ) of the CFSR monthly Rs product was 0.95, 18.57 W/m2, 32.23 W/m2, and 1.10. Similarly to NCEP-DOE, the JRA-55 monthly Rs product overestimated Rs compared to most of the surface observational networks, except for the Buoy observations. The biases were 12.46 W/m2, 20.06 W/m2, -15.58 W/m2, 4.75 W/m2, and 32.23 W/m2 for the BSRN, GEBA, Buoy, GC-NET, and CMA observations, respectively. The overall R, bias, RMSE, and ratio (σ) of the JRA-55 monthly Rs product were 0.95, 19.15 W/m2, 31.71 W/m2, and 1.00, respectively.
The reanalysis monthly mean
Rs products were divided into summer (JJA) and winter (DJF) seasons to assess the seasonal dependency of their accuracy.
Table 3 displays the seasonal validation results for the monthly
Rs of the six reanalysis data sets using surface measurements collected from 674 stations from 2001 to 2009. It was apparent that almost all the reanalysis Rs products showed better accuracy in DJF than that in JJA, except for the ERA-Interim Rs product at the CMA and BSRN stations, for the MERRA, JAR-55, and NCEP-DOE Rs products at the Buoy stations, and for the JAR-55 at the GC-net stations. They showed higher bias in DJF, but lower bias in JJA.
Furthermore, the evaluations were also conducted over different regions to address the spatial representativeness issue because the measuring instruments and measurement methods change by country more than by climate regime [
53]. The whole world was divided into nine sub-regions, which include North American, South American, Asia, Europe, Africa, Australia, Oceania, Antarctic, and the oceans.
Table 4 summarizes the statistical measures for the evaluation results of the monthly
Rs products from the reanalysis data using surface measurements at the selected 674 stations from 2001 to 2009. Relatively small discrepancies were found for the ERA-Interim
Rs product. The biases of the ERA-Interim monthly
Rs were 2.32 W/m
2, 4.64 W/m
2, 2.06 W/m
2, 4.71 W/m
2, and −2.20 W/m
2 for North America, Europe, Oceania, and Antarctica, whereas these values were 20.62 W/m
2, 12.64 W/m
2, 13.79 W/m
2, and 10.92 W/m
2 for Asia, Africa, South America, and the whole of the oceans, respectively. According to the validation results shown in
Table 2,
Table 3 and
Table 4, we concluded that the limited number of surface observations cannot entirely represent the spatial variability of
Rs globally.
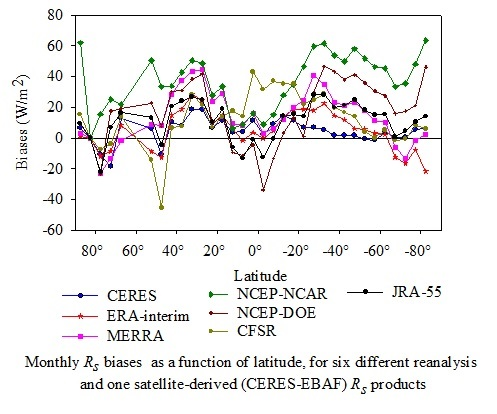
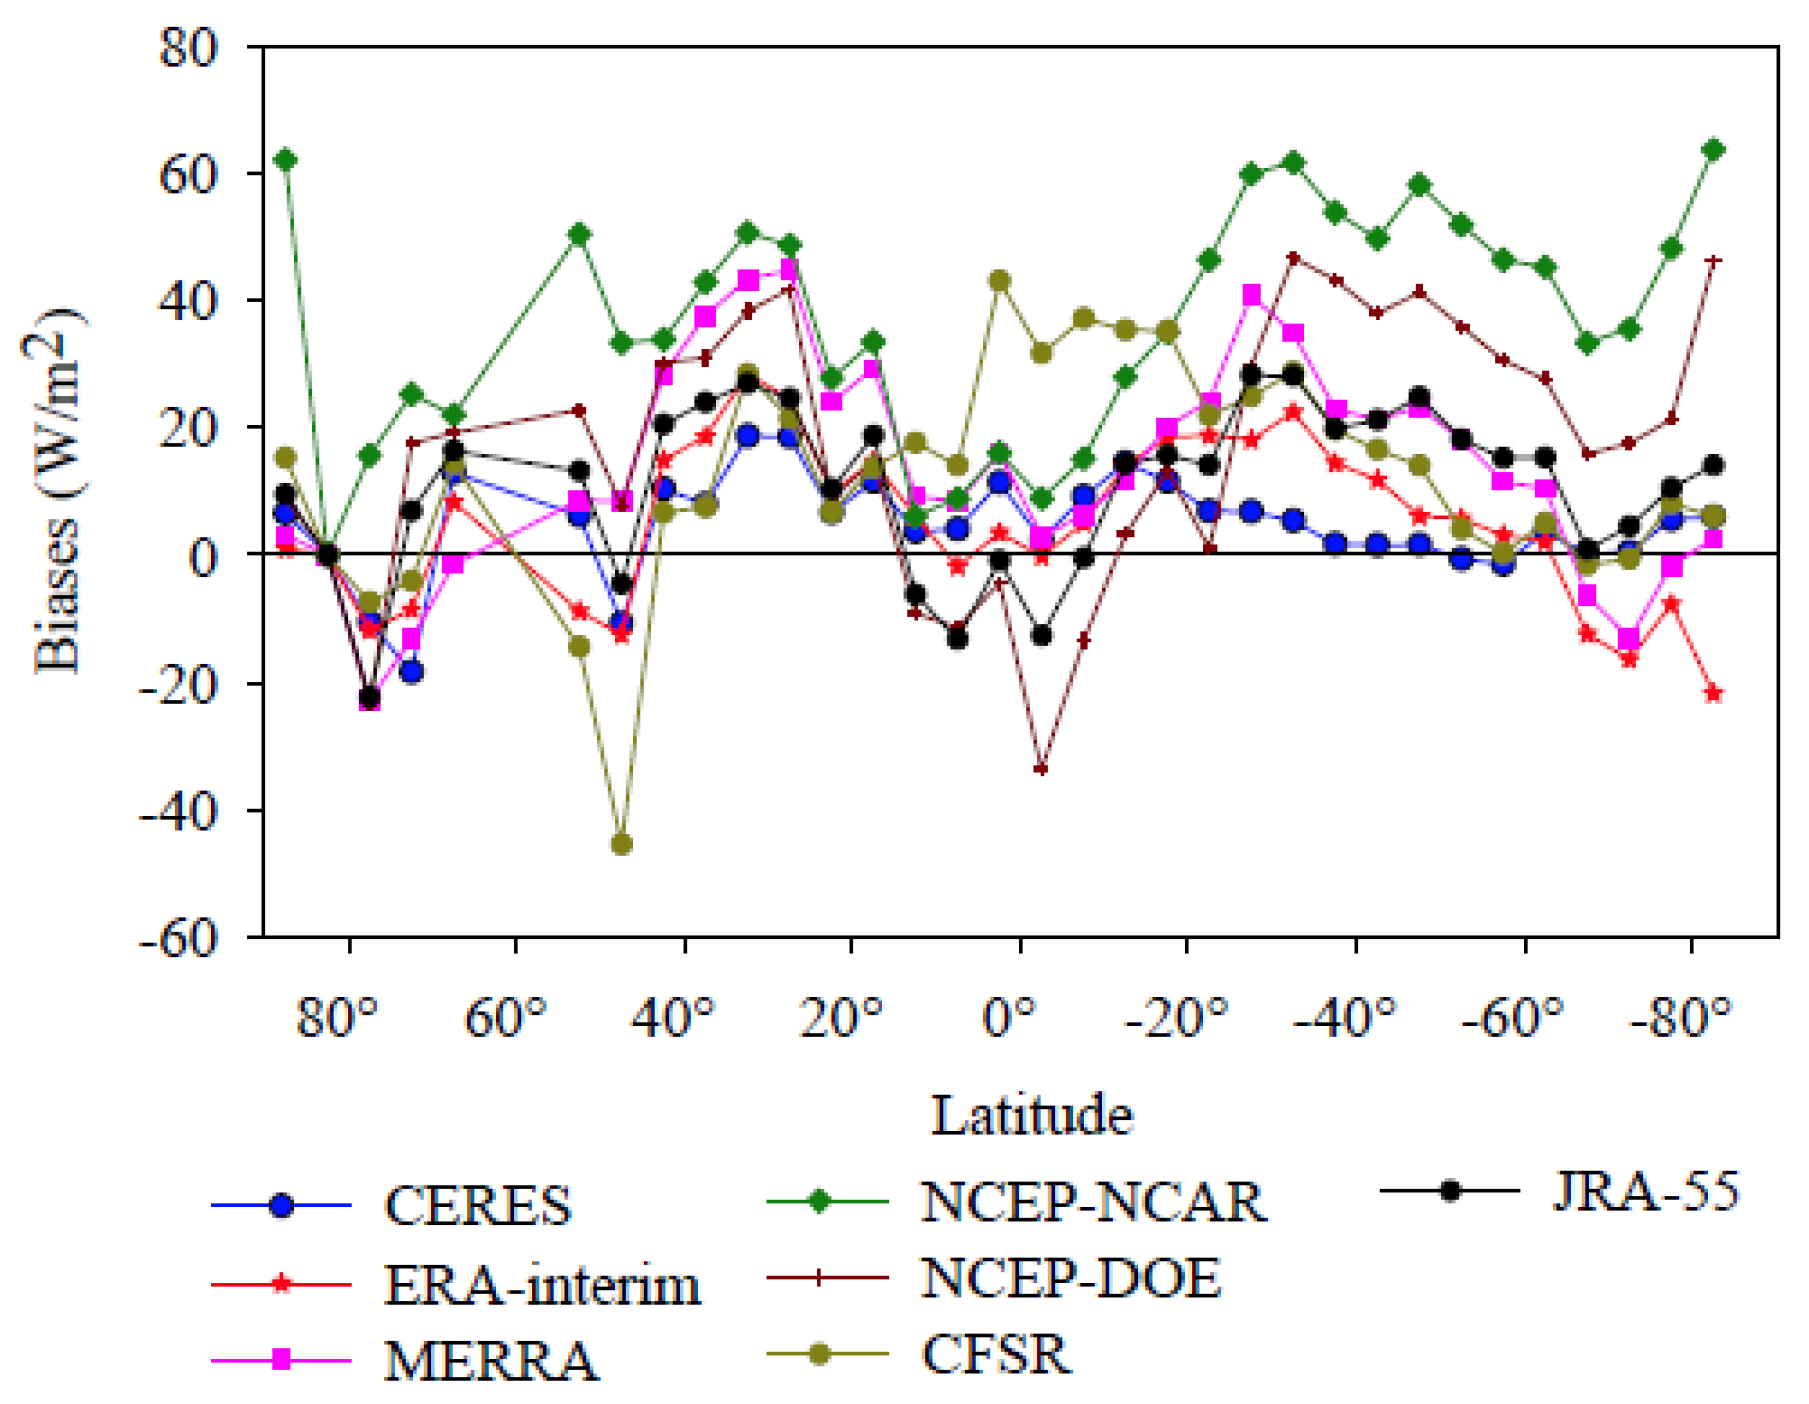
To investigate the latitudinal dependencies of the monthly
Rs from the reanalysis products, the biases for the monthly
Rs products were calculated as a function of latitude and are shown in
Figure 2. In this figure, the calculated biases were averages over the biases of the monthly reanalysis
Rs at sites located within latitudinal bands of 5°. Most of the reanalysis
Rs products showed a pronounced latitudinal dependence in their biases, except for the ERA-Interim and JRA-55 products. The averaged bias weighted by the area of the latitudinal band was also calculated for each reanalysis
Rs product. The averaged bias values weighted by the area of each latitudinal band were 5.32 W/m
2, 11.25 W/m
2, 21.62 W/m
2, 9.43 W/m
2, 9.95 W/m
2, and 7.02 W/m
2 for ERA-Interim, MERRA, NCEP-NCAR, NCEP-DOE, CFSR, and JRA-55, respectively. The biases obtained in this way were smaller than those of the reanalysis
Rs products, as shown in
Table 2, which indicates that the mean model biases at the 674 sites are effected by the which they are determined and which further confirms that a limited number of surface observations cannot represent the spatial variability in the
Rs evaluation results.
3.2. Comparison with CERES-EBAF
Although the Rs values from the reanalysis products have been evaluated using 674 sites from various observation networks around the world, many land and oceanic surfaces are still under-represented. Moreover, the reanalysis systems differ in their model structure, physical parameterization, spatial resolution and vertical resolution, and in the data assimilation methods. It is impossible to discuss in detail all the differences among the reanalysis methods in the context of this paper. Rather, to address this issue, a broad view of the seasonal time scales of the differences will be provided by comparing the reanalysis Rs data with independent data from satellite retrieval of Rs.
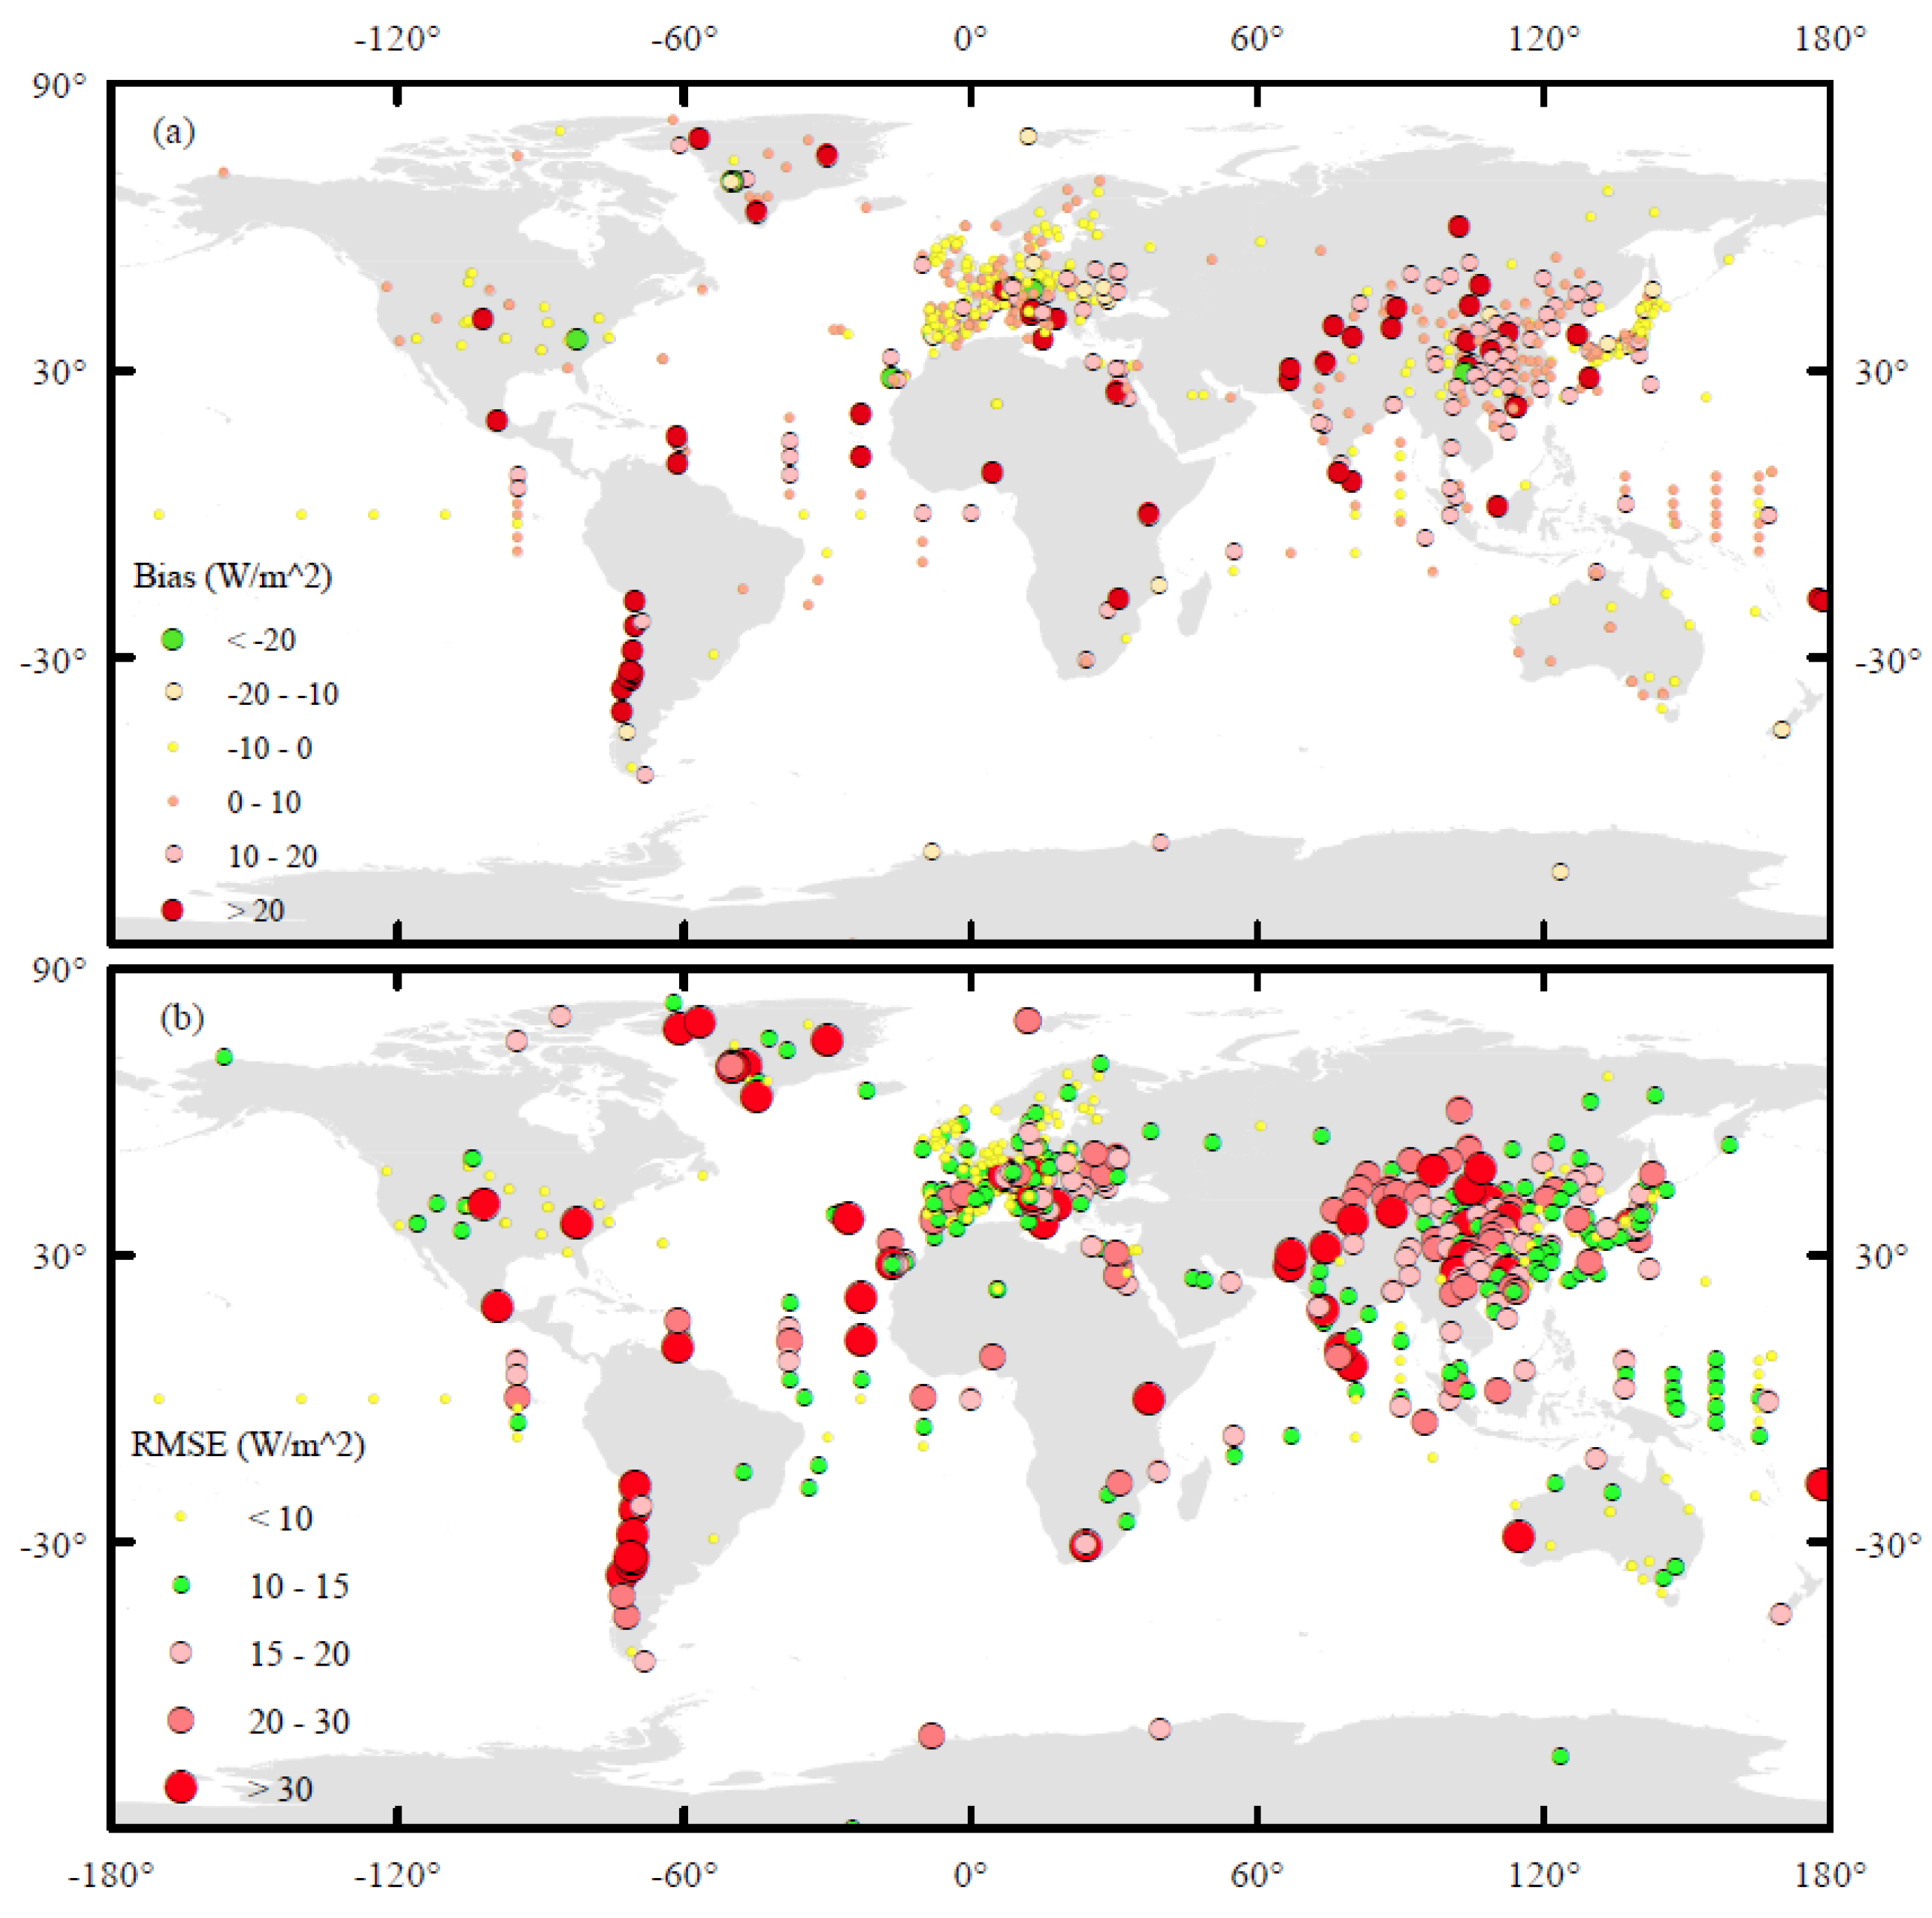
The satellite retrieval of
Rs from the CERES-EBAF product was used in this study. Firstly, the CERES-EBAF monthly
Rs data were validated against the surface observed
Rs at the 674 sites, as shown in
Figure 3. The CERES-EBAF
Rs product correlates well with the surface measurements by the small biases, and RMSE was found at most sites for the CERES-EBAF
Rs product. The absolute error was less than 10 W/m
2 at 484 out of 674 sites and the RMSE was less than 20 W/m
2 at 546 out of 674 sites.
Table 5 shows that the CERES-EBAF
Rs product agreed better with surface observations than that of the reanalysis products, as shown in
Table 2 and
Table 3. The biases of the CERES-EBAF
Rs product were −1.28 W/m
2, 2.10 W/m
2, 4.39 W/m
2, 8.77 W/m
2, and 7.31 W/m
2 for the BSRN, GEBA, Buoy, GC-NET, and CMA observations, respectively. The seasonal validation results for the CERES-EBAF
Rs product are also shown in
Table 5. Clearly, the biases and the RMSE have been greatly reduced compared to the values calculated from the reanalysis products, whereas the correlation coefficients increased, especially for the Buoy, GC-NET, and CMA observations. For example, the CERES-EBAF had a bias of 7.31 W/m
2 at the CMA sites, whereas the biases of the six reanalysis
Rs products ranged from 23.15 W/m
2 to 71.95 W/m
2. Previous studies have pointed out that the reliability of data obtained in China has often been dubious because of the technical failures and operating problems [
54,
55]. However, this study found that the bias and RMSE of the CERES-EBAF
Rs product were 11.36 W/m
2 and 19.38 W/m
2, respectively, in DJF using the quality-controlled CMA surface observations as the validation data, whereas these values were 1.30 W/m
2 and 18.04 W/m
2 in JJA. Generally, the validation results should be worse than those derived in JJA when heavy clouds occur. Clouds and aerosols are two of the most important factors in
Rs estimation. The only data available at the CMA sites were the climatologies of clouds (cloud fraction (CF)) and aerosols (<10 km visibility frequencies). It was found that the frequencies of visibility lower than 10 km in DJF were 20% higher than in JJA. Therefore, it can be concluded that the quality-controlled CMA
Rs observations are good enough to be used to validate the
Rs products, either from reanalysis or from satellite observations. It can also be concluded that the differences between
Rs products and surface measurements might have been related to aerosols, clouds and their interactions as represented in the algorithm, especially in DJF when heavy air pollution occurs. The evaluation results for the CERES-EBAF
Rs product in the various sub-regions are shown in
Table 6 and further confirm that the CERES-EBAF
Rs product achieves high precision and is therefore qualified to represent surface observations on a large scale. Therefore, CERES-EBAF can be used to validate the
Rs obtained from the six reanalysis products.
Before comparison using CERES-EBAF
Rs data, the obtained six global reanalysis
Rs products under study were projected onto a 1° spatial resolution using the bilinear interpolation of a weighted average of pixels in the nearest 2-by-2 neighborhood to match that of the CERES-EBAF
Rs data.
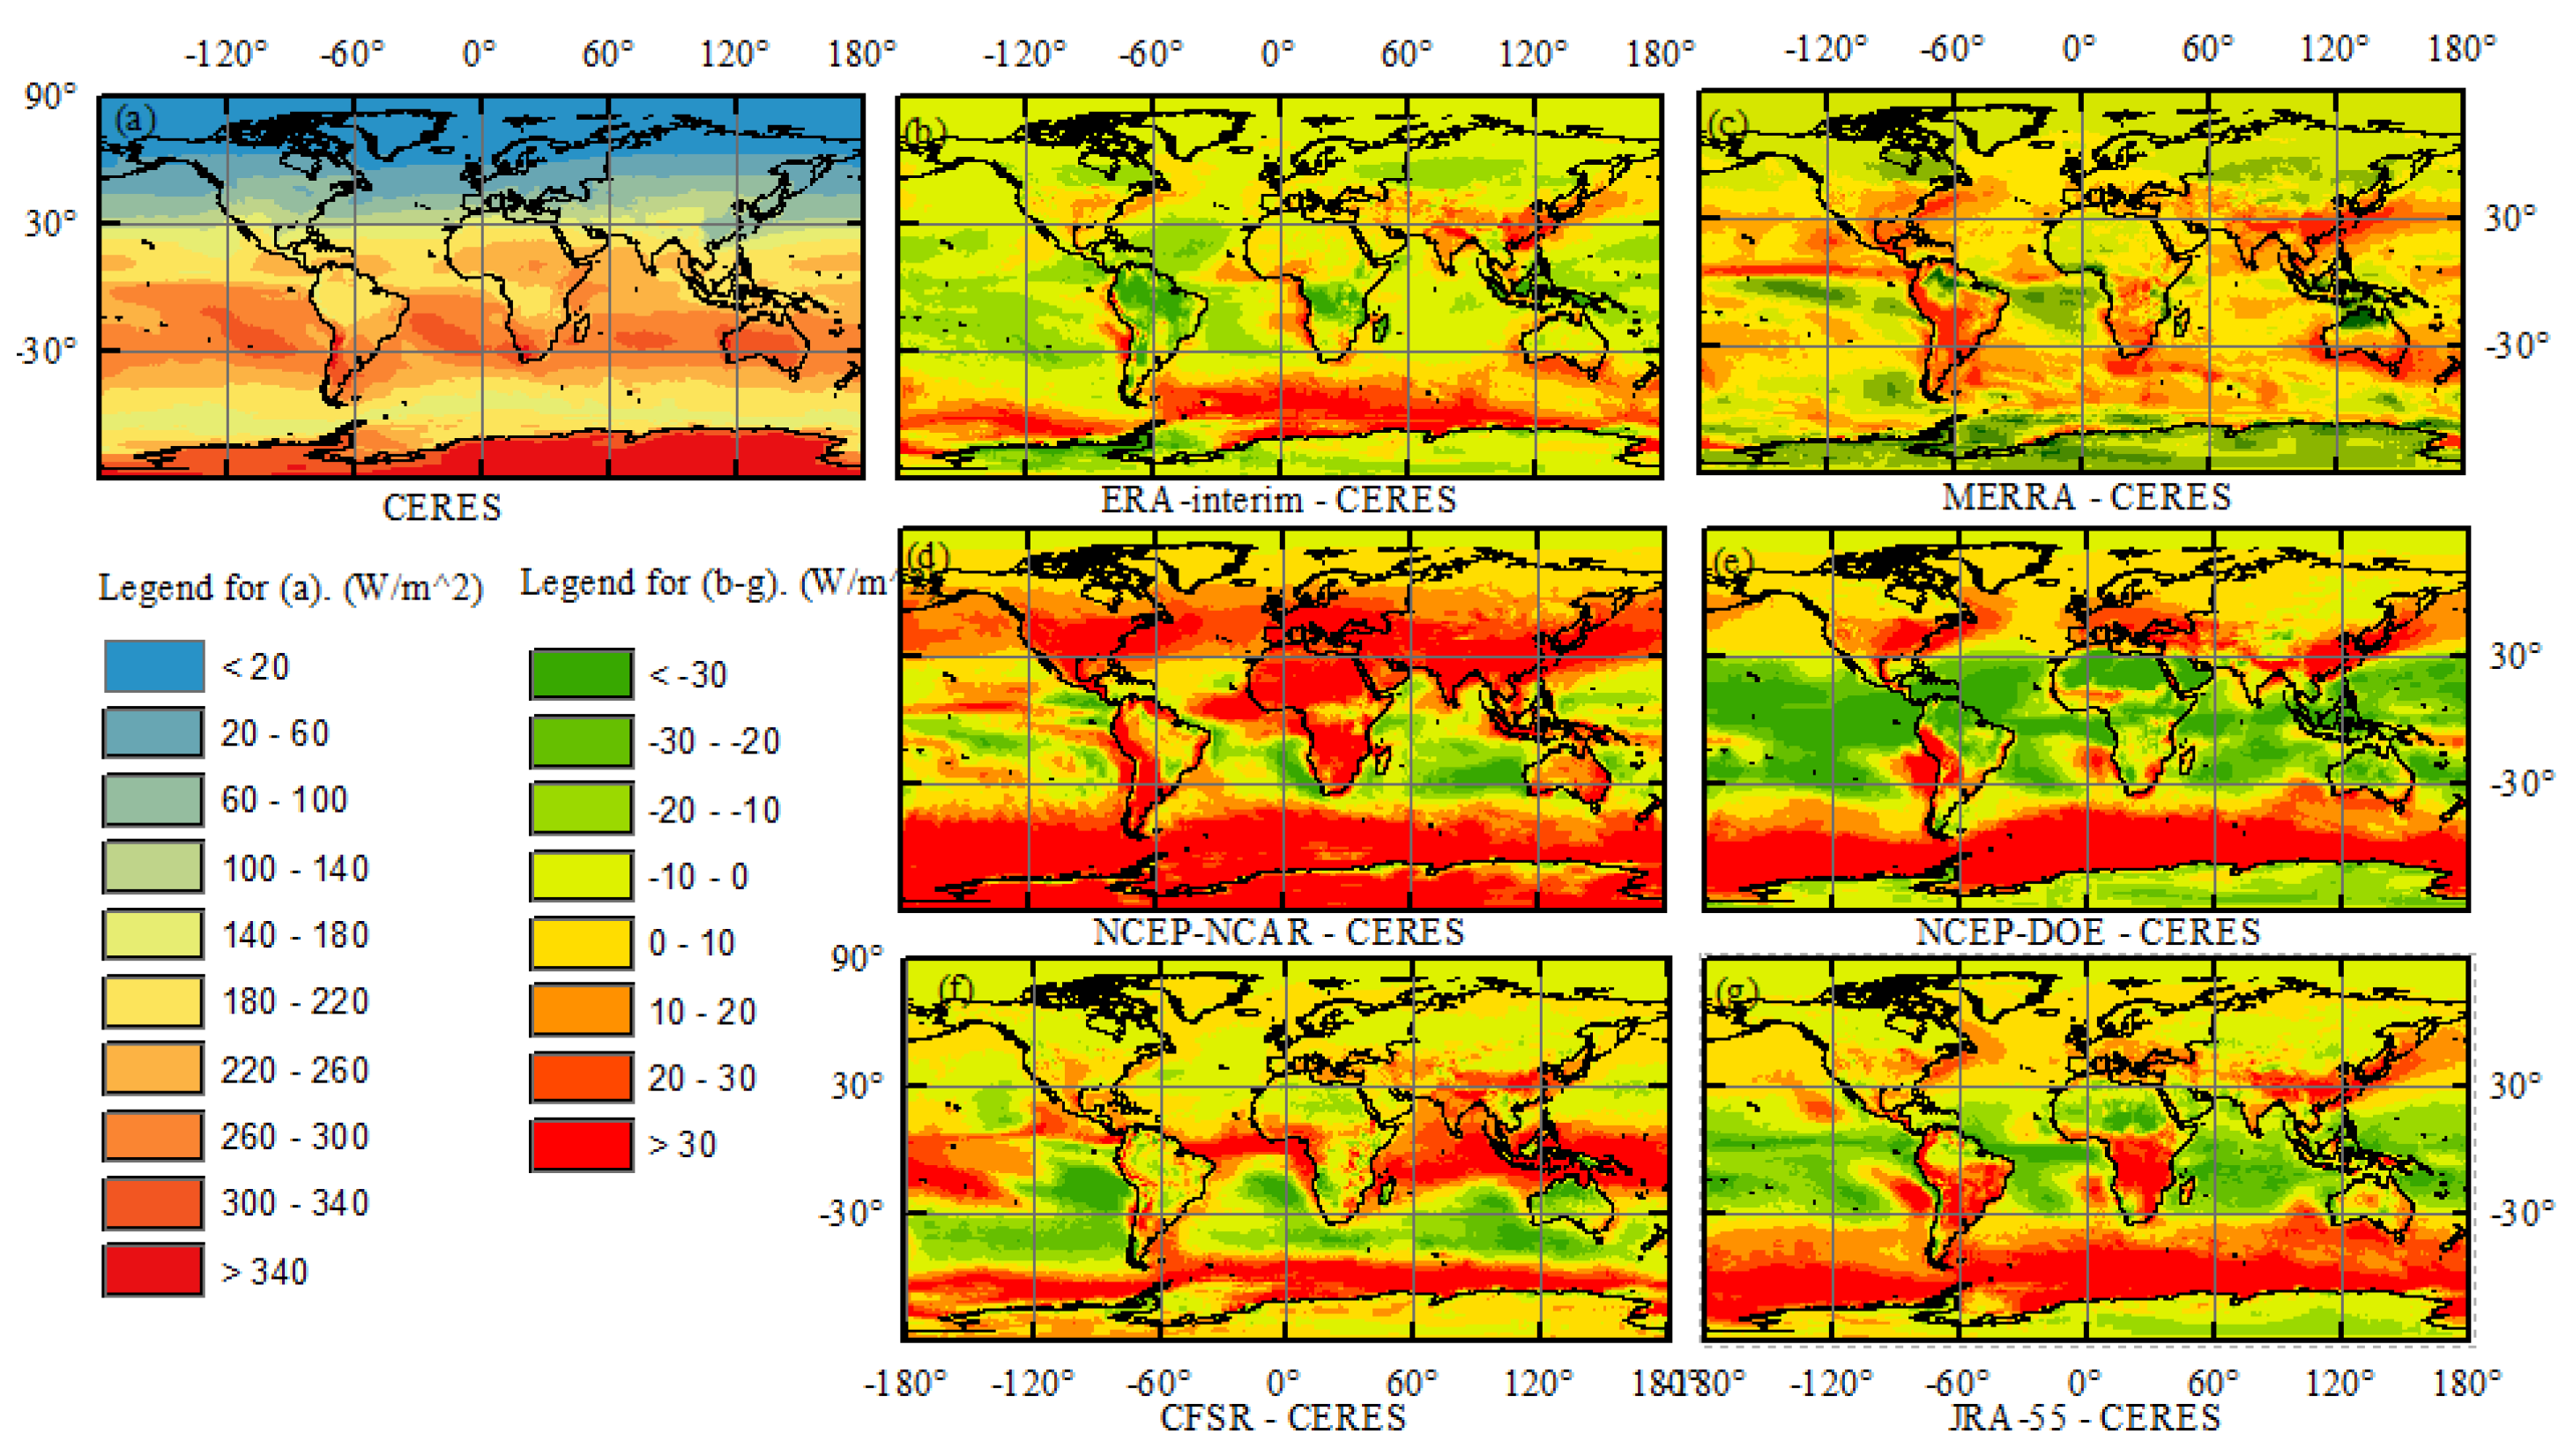
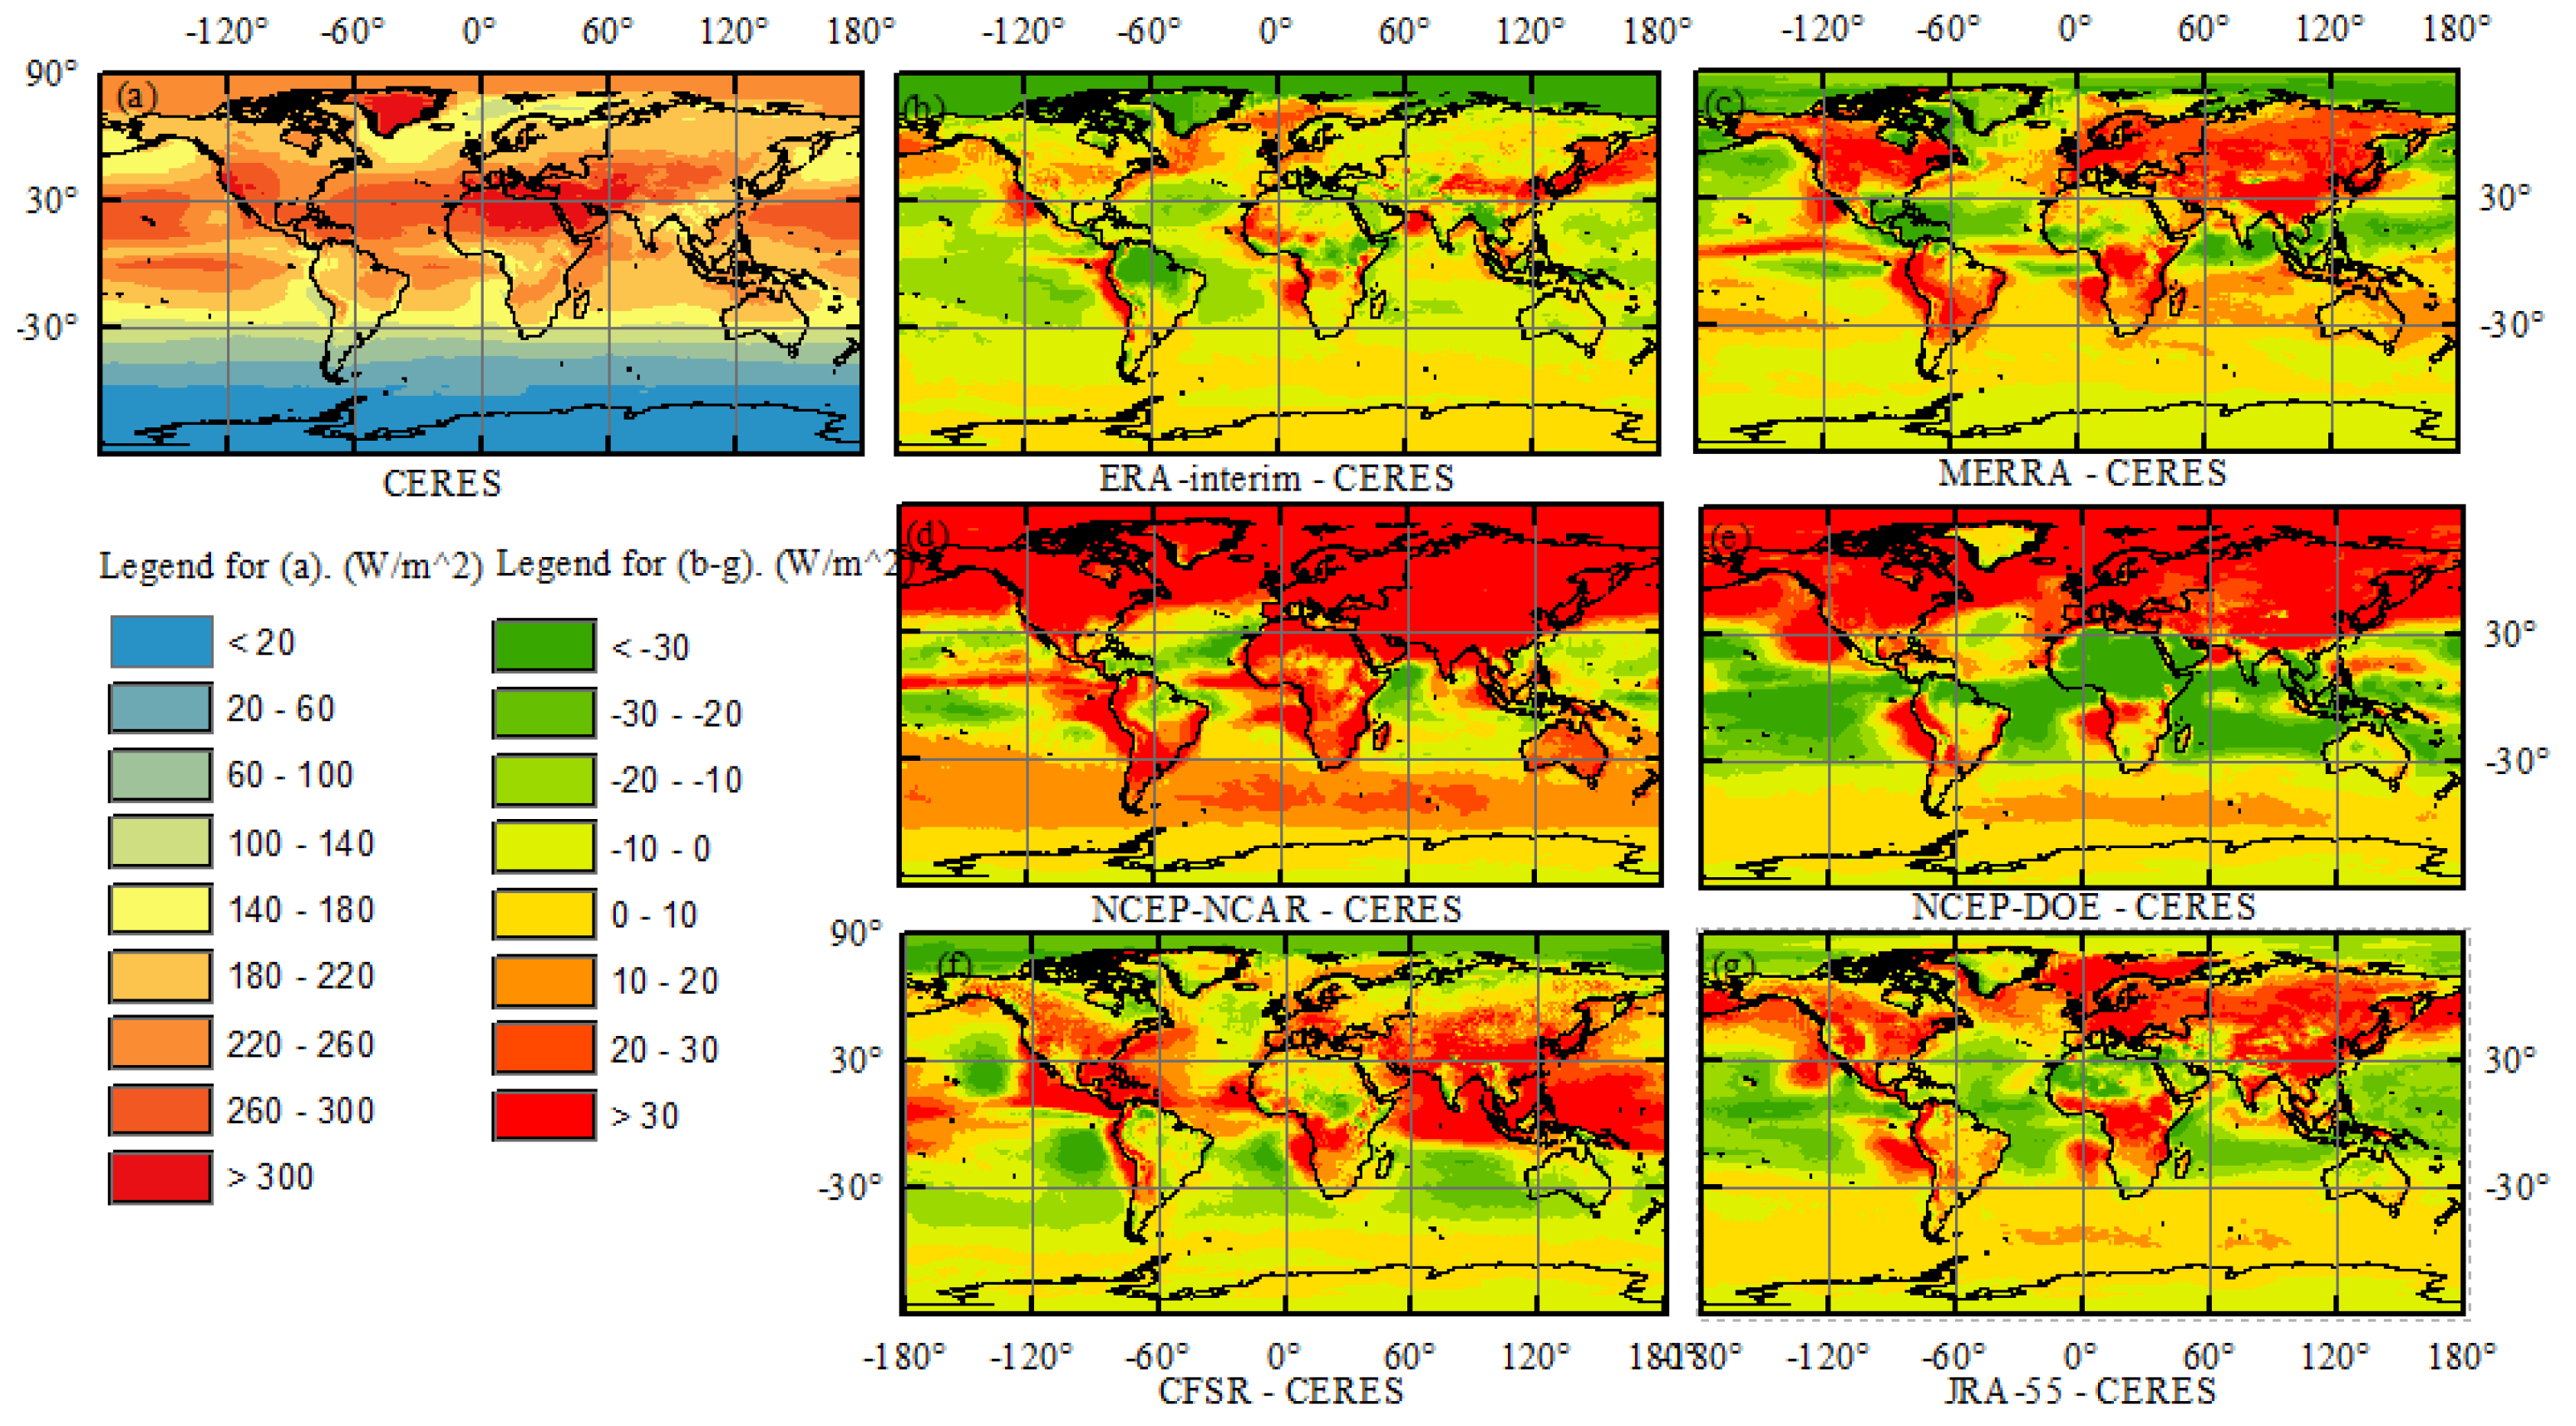
Figure 4 and
Figure 5 display the CERES-EBAF monthly
Rs climatologies for DJF (December, January, and February) and JJA (June, July, and August) for the nine-year period (2001–2009), and also the biases between the reanalyzed
Rs product and the CERES-EBAF
Rs product (reanalysis minus CERES MODIS) for DJF and JJA. As shown in
Figure 4, the CERES-EBAF
Rs climatology for DJF indicates that greater
Rs was received in the latitudinal bands between 0°S and 30°S, and also the Antarctic in DJF, whereas smaller
Rs was received in the Northern hemisphere. It was also shown that the greater
Rs values were received in the Northern Pacific, the Northern Atlantic, the tropical oceans, and also in Greenland in JJA. Solar transmission is determined primarily by clouds and aerosols (which were not available for comparison in this study). Previous studies have reported that the discrepancies in the reanalysis CF products might be reflected in the surface radiation fields [
59,
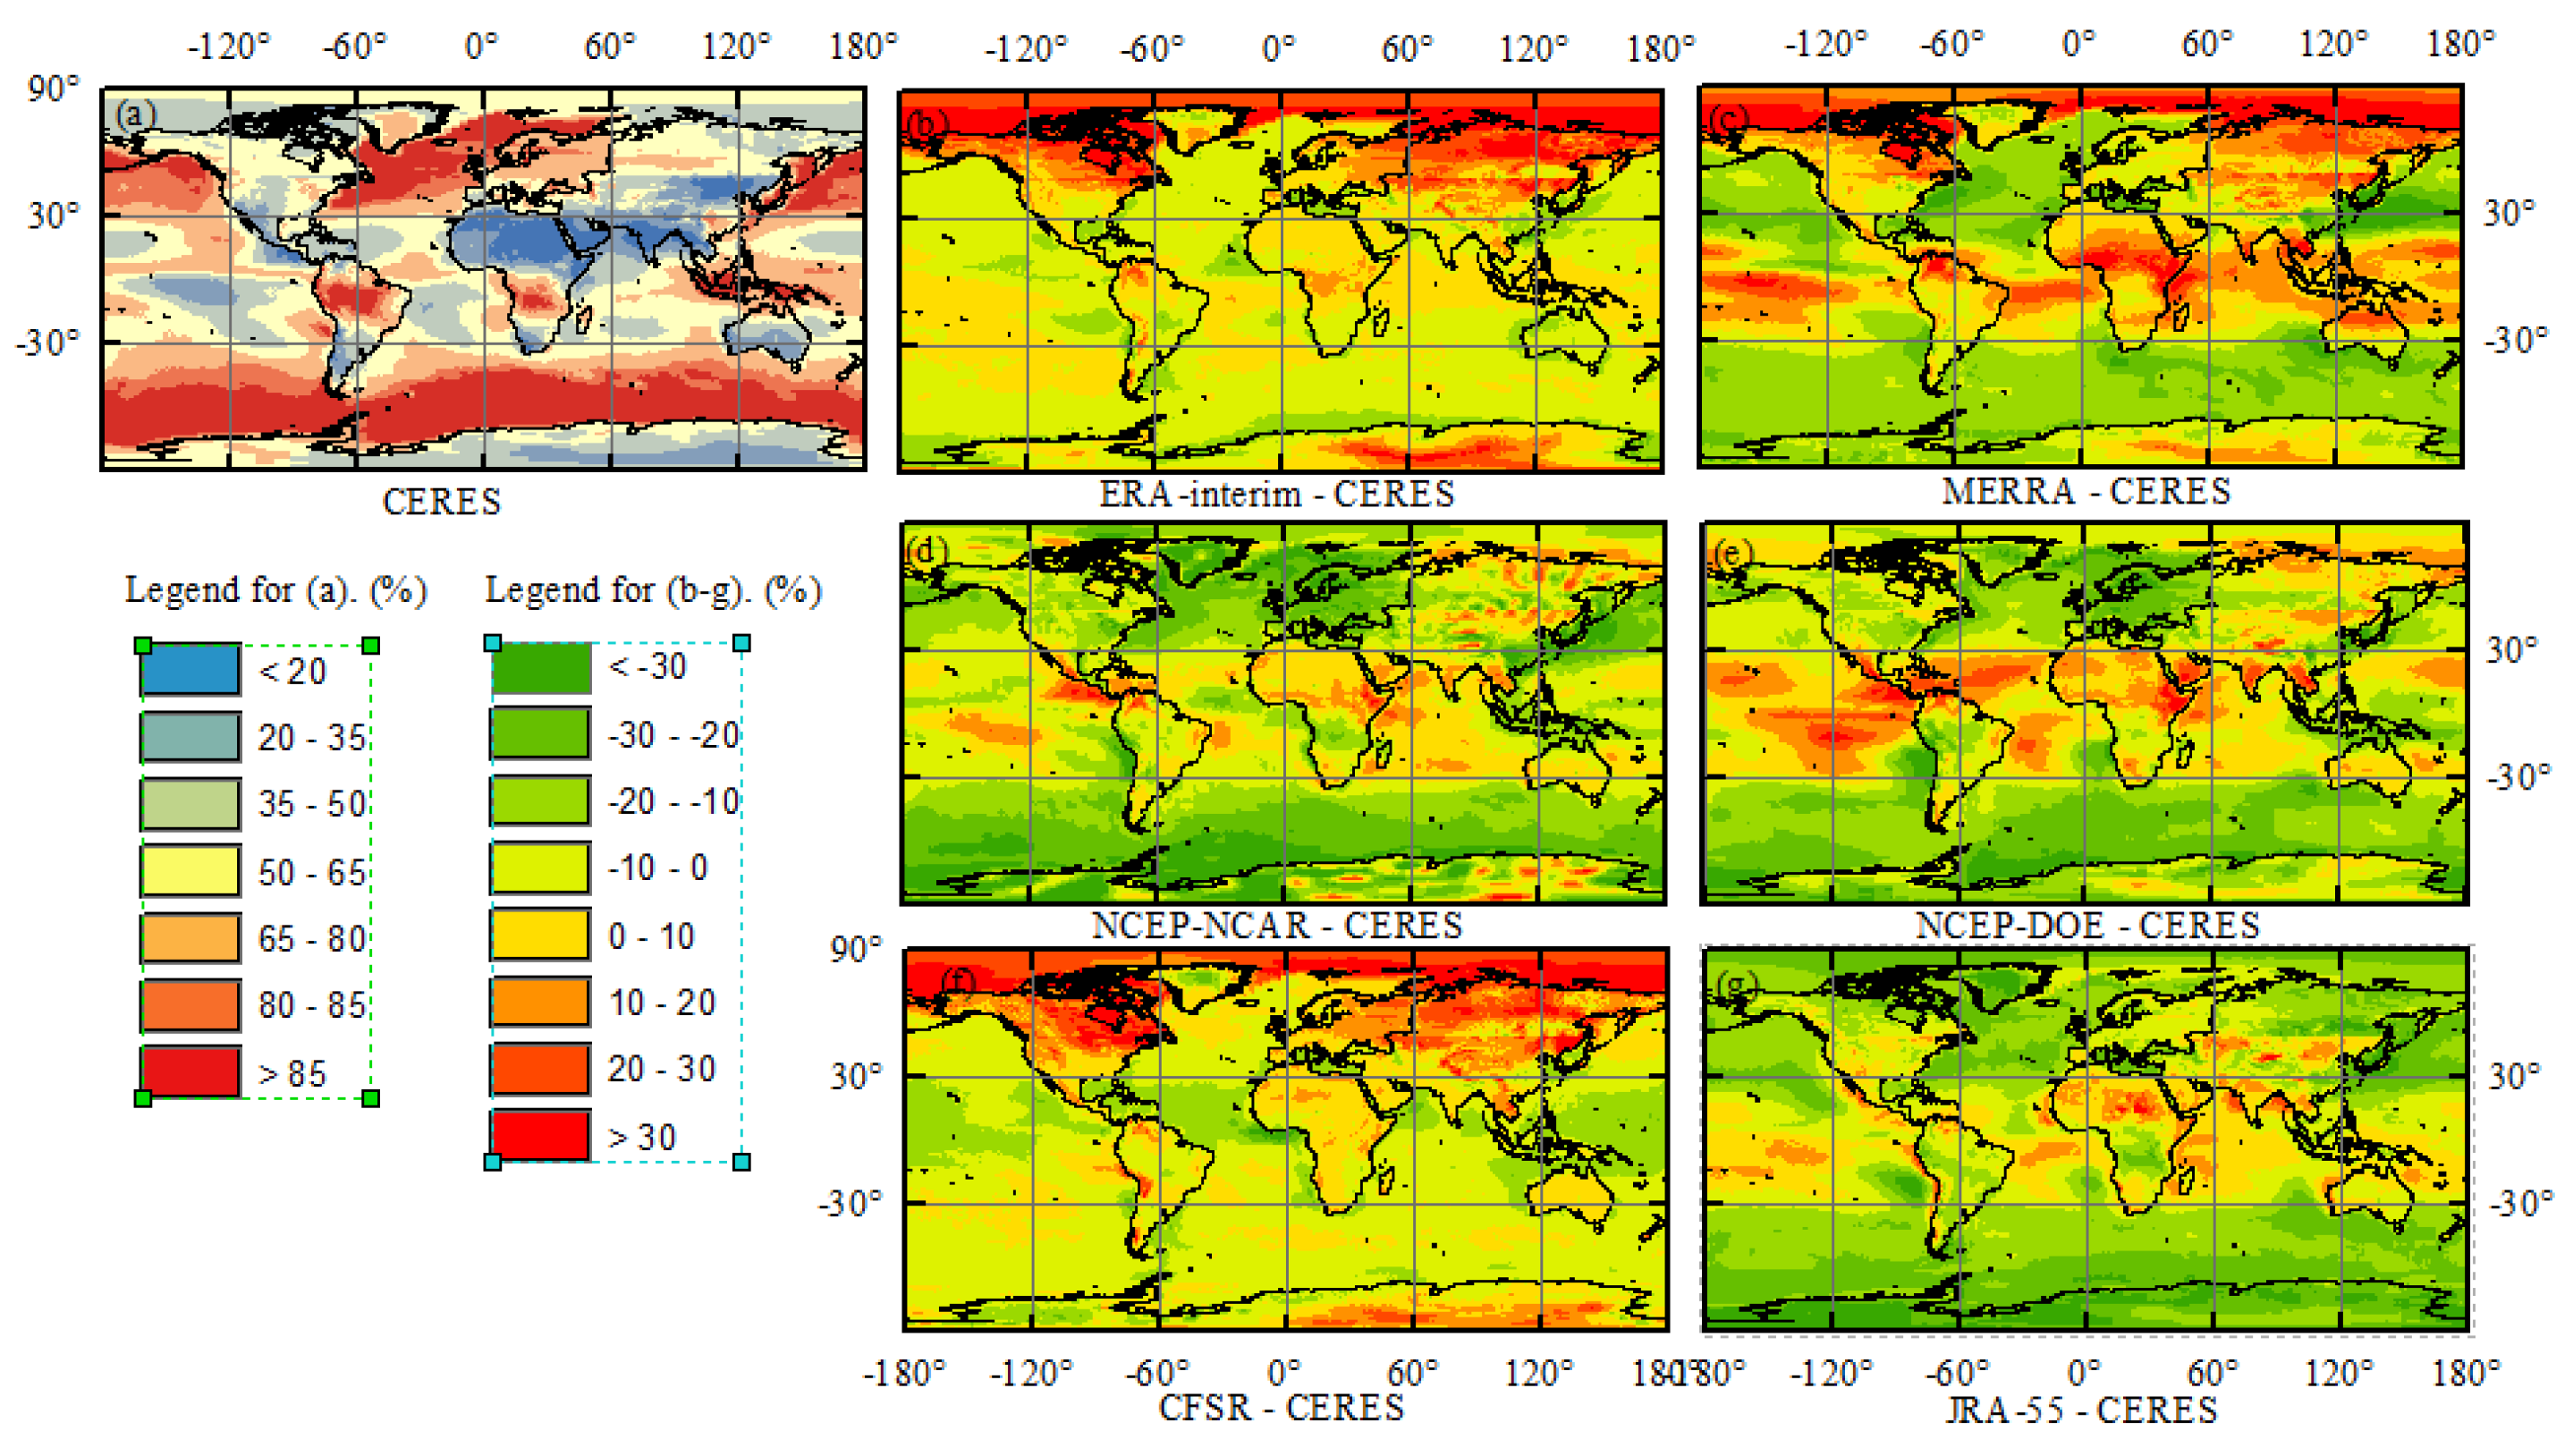
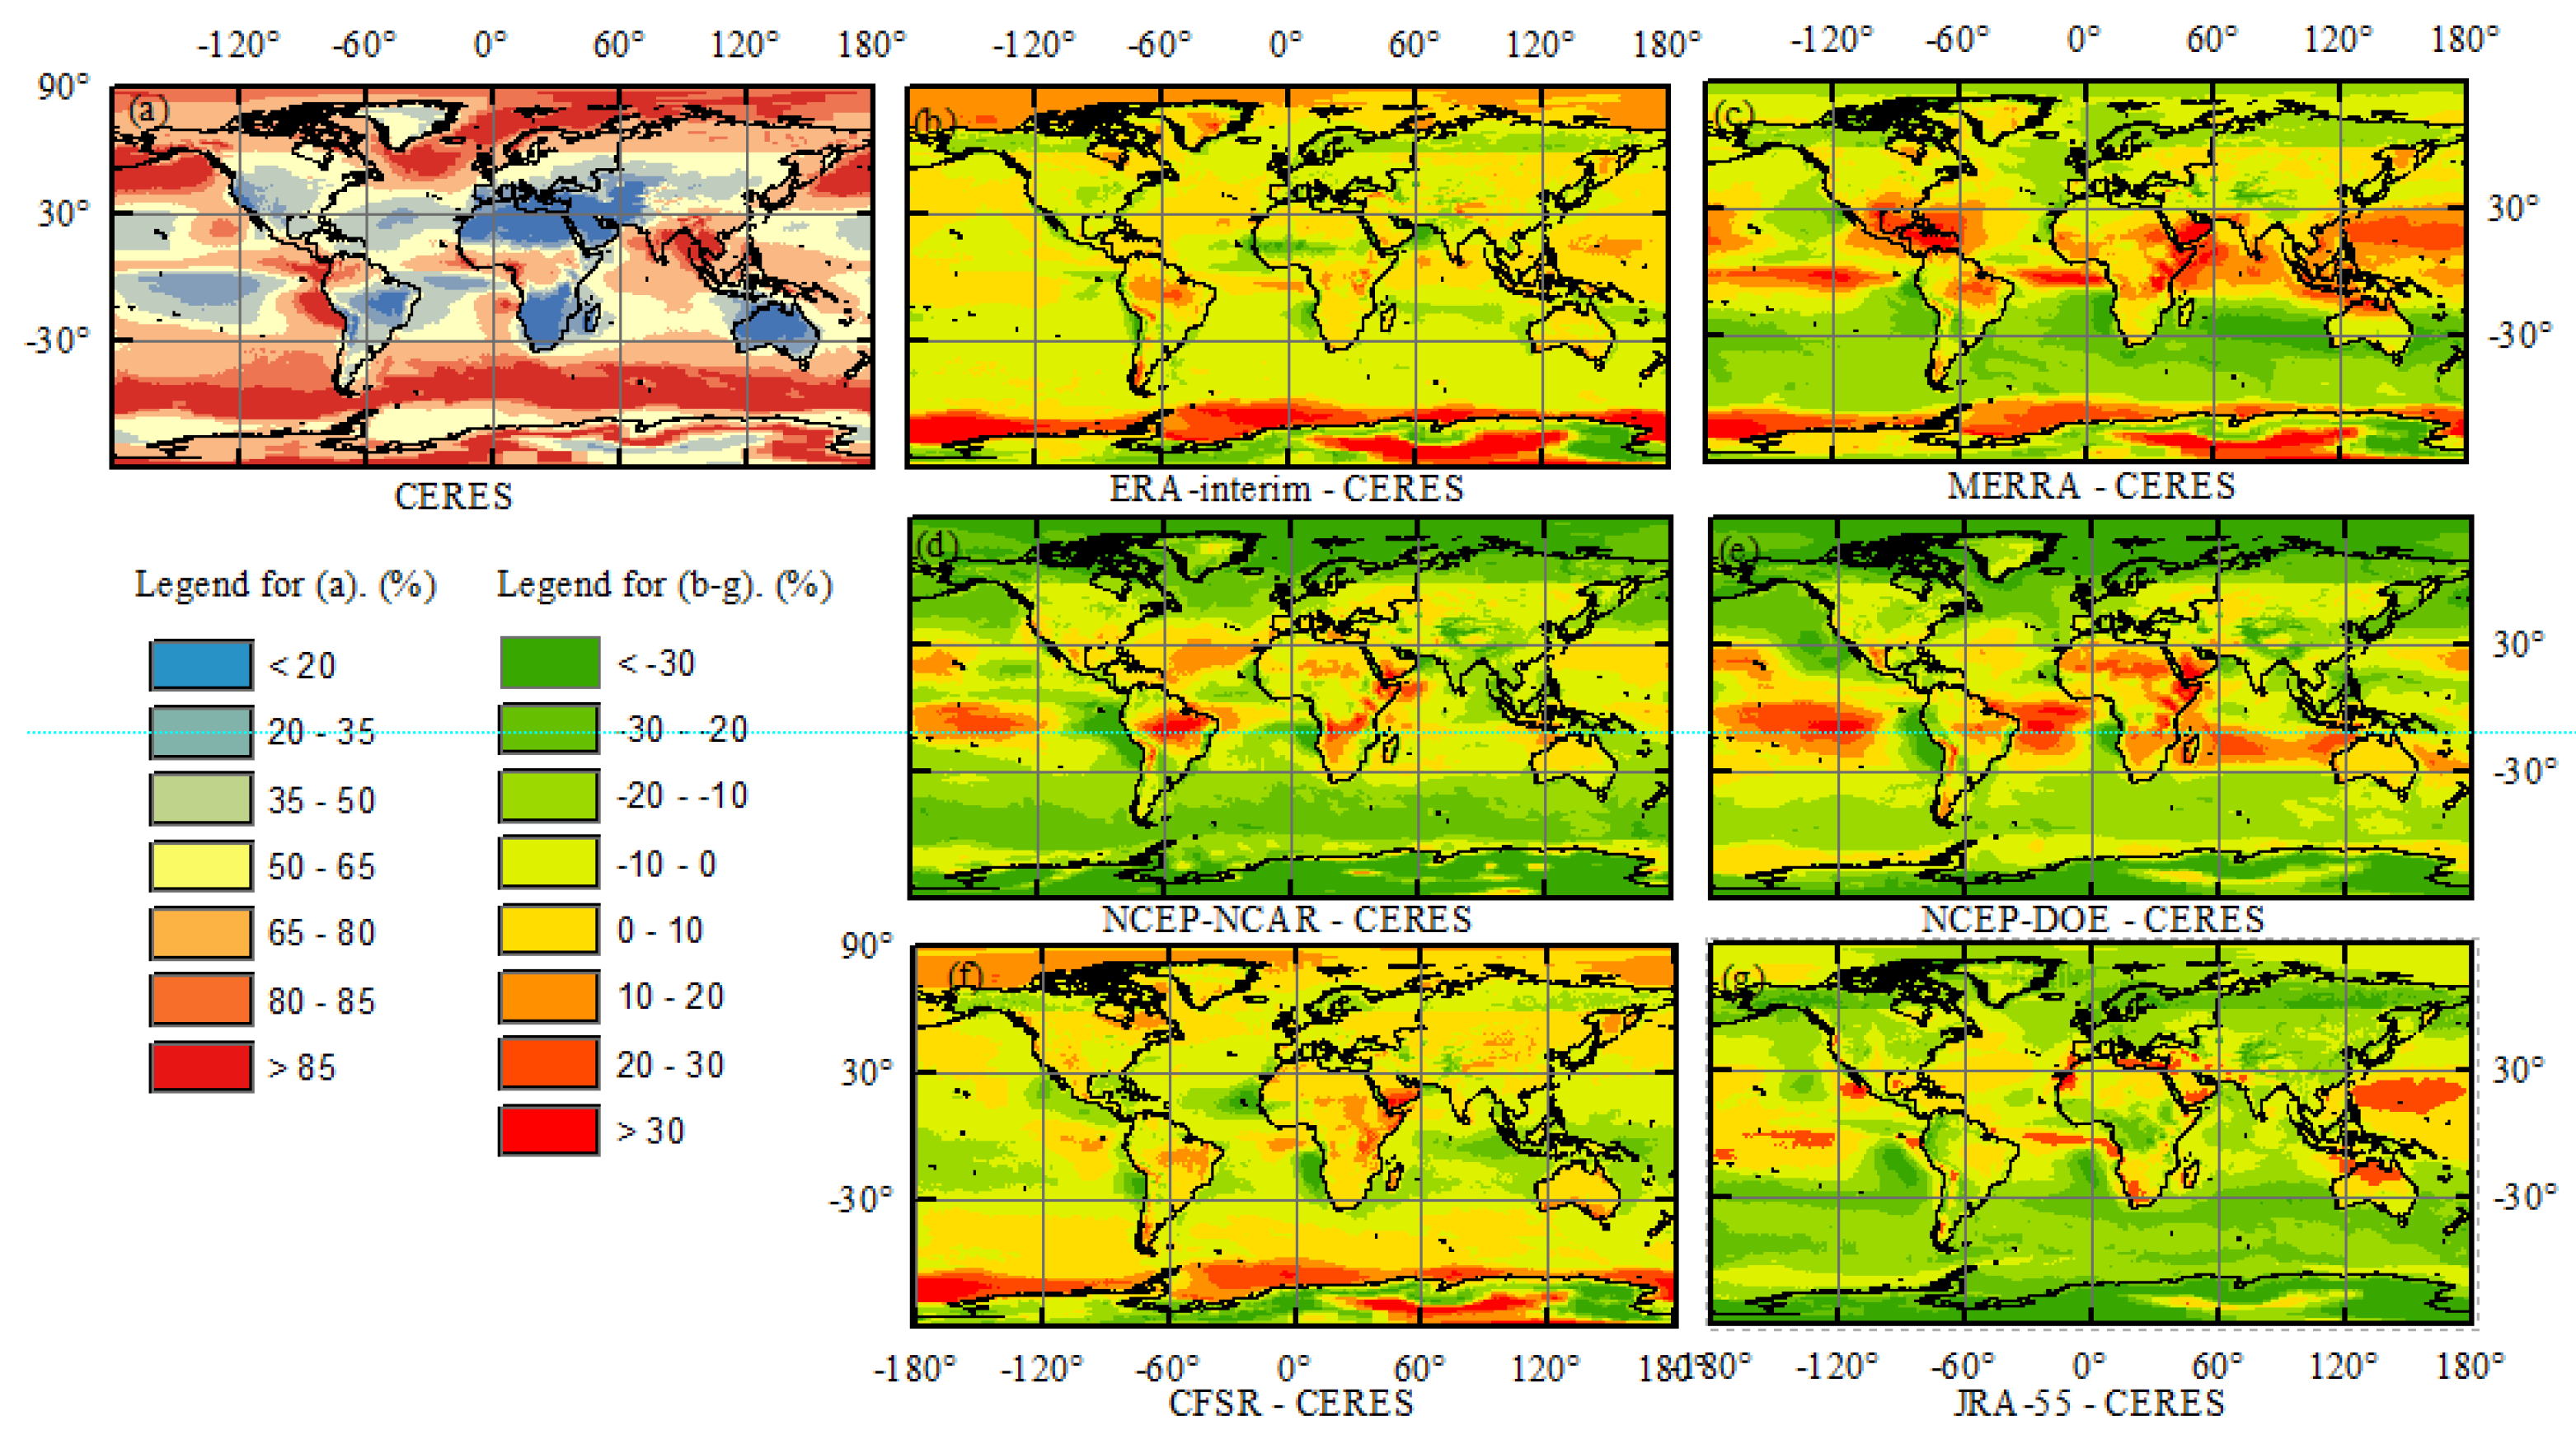
60]. In this study, the CERES CF climatologies for DJF and JJA, and the biases between the reanalyzed CF and the CERES CF (reanalysis minus CERES) from 2001 to 2009 were also examined in this study, as shown in
Figure 6 and
Figure 7. The observed CF from CERES indicated that clouds occurred more frequently in the Southern Ocean, the Northern Pacific, and the Northern Atlantic Oceans, and the Intertropical Convergence Zone (ITCZ) in both JJA and DJF. However, clouds occurred less frequently over the central areas of the Pacific and Atlantic Oceans, the Saharan Desert, Western Asia, Australia, Southwestern America, and in DJF. Clouds occurred more frequently in the Arctic and Antarctic in DJF than that in JJA. From the combination of
Figure 4,
Figure 5,
Figure 6 and
Figure 7, it is clear that the high values of
Rs were accompanied by lower CF in most of the regions within the same latitudinal bands (regardless of the seasonal cycles). According to
Figure 4 and
Figure 6, the six reanalyses overestimated
Rs in the Southern Oceans and Eastern China in DJF, which were related to the underestimation of CF in DJF. The overestimation of NCEP-NCAR on most of the continents and the underestimation of NCEP-DOE in tropical oceans in DJF were related to the underestimation and overestimation of CF in the corresponding regions, respectively. Similar results were also found in JJA, with the exception of China. Although almost all of the six reanalysis products overestimated
Rs in China, the CF values from the reanalysis products were slightly overestimated, except for NCEP-DOE and JRA-55. Previous studies have shown that aerosols might be another potential source of the larger positive biases in China [
4,
26,
53], where heavy pollution is occurring due to rapid economic development and high population density. Similarly, the interactions between clouds and aerosols may amplify this overestimation in China. However, because quantitative clouds and aerosols measurements are not available, it is impossible to determine the quantitative contributions of clouds and aerosols to the larger positive biases of
Rs in China. In any case, efforts are needed to improve the cloud schemes for different regions and seasons in reanalysis estimates.
The gridded comparison results for the monthly
Rs from the six global reanalysis products using the CERES-EBAF
Rs are shown in
Table 7. The biases of the reanalysis
Rs products ranged from −2.98 W/m
2 to 21.97 W/m
2 over the globe, −3.26 W/m
2 to 32.13 W/m
2 over land, and −2.85 W/m
2 to 16.99 W/m
2 over the oceans. Almost all of the reanalysis overestimated the monthly
Rs over land, the oceans, and the globe, except for ERA-Interim which slightly underestimated
Rs. These results were different from the validation results presented in
Section 3.1. The biases and RMSE values of the global reanalyses compared with the CERES-EBAF
Rs data were smaller than those between the global reanalyses and surface observations. For instance, the ERA-Interim had a bias of 11.25 W/m
2 using surface observations at 674 sites as the validation data, but the bias was only −2.85 W/m
2 when compared with CERES-EBAF
Rs data. Overall, most of the reanalyzed
Rs were overestimated, although in some regions,
Rs was underestimated, and the differences between the surface observations and the reanalyses were sometimes greater than 100 W/m
2. The gridded comparison results for the monthly mean CF estimated by the six global reanalysis products using the CERES CF as the validation data are also summarized in
Table 8. The biases of the reanalysis CF products ranged from −14.17 (%) to 2.42 (%) over the globe, −15.61 (%) to 3.94 (%) over land, and −13.47 (%) to 1.93 (%) over the oceans, as shown in
Table 8.
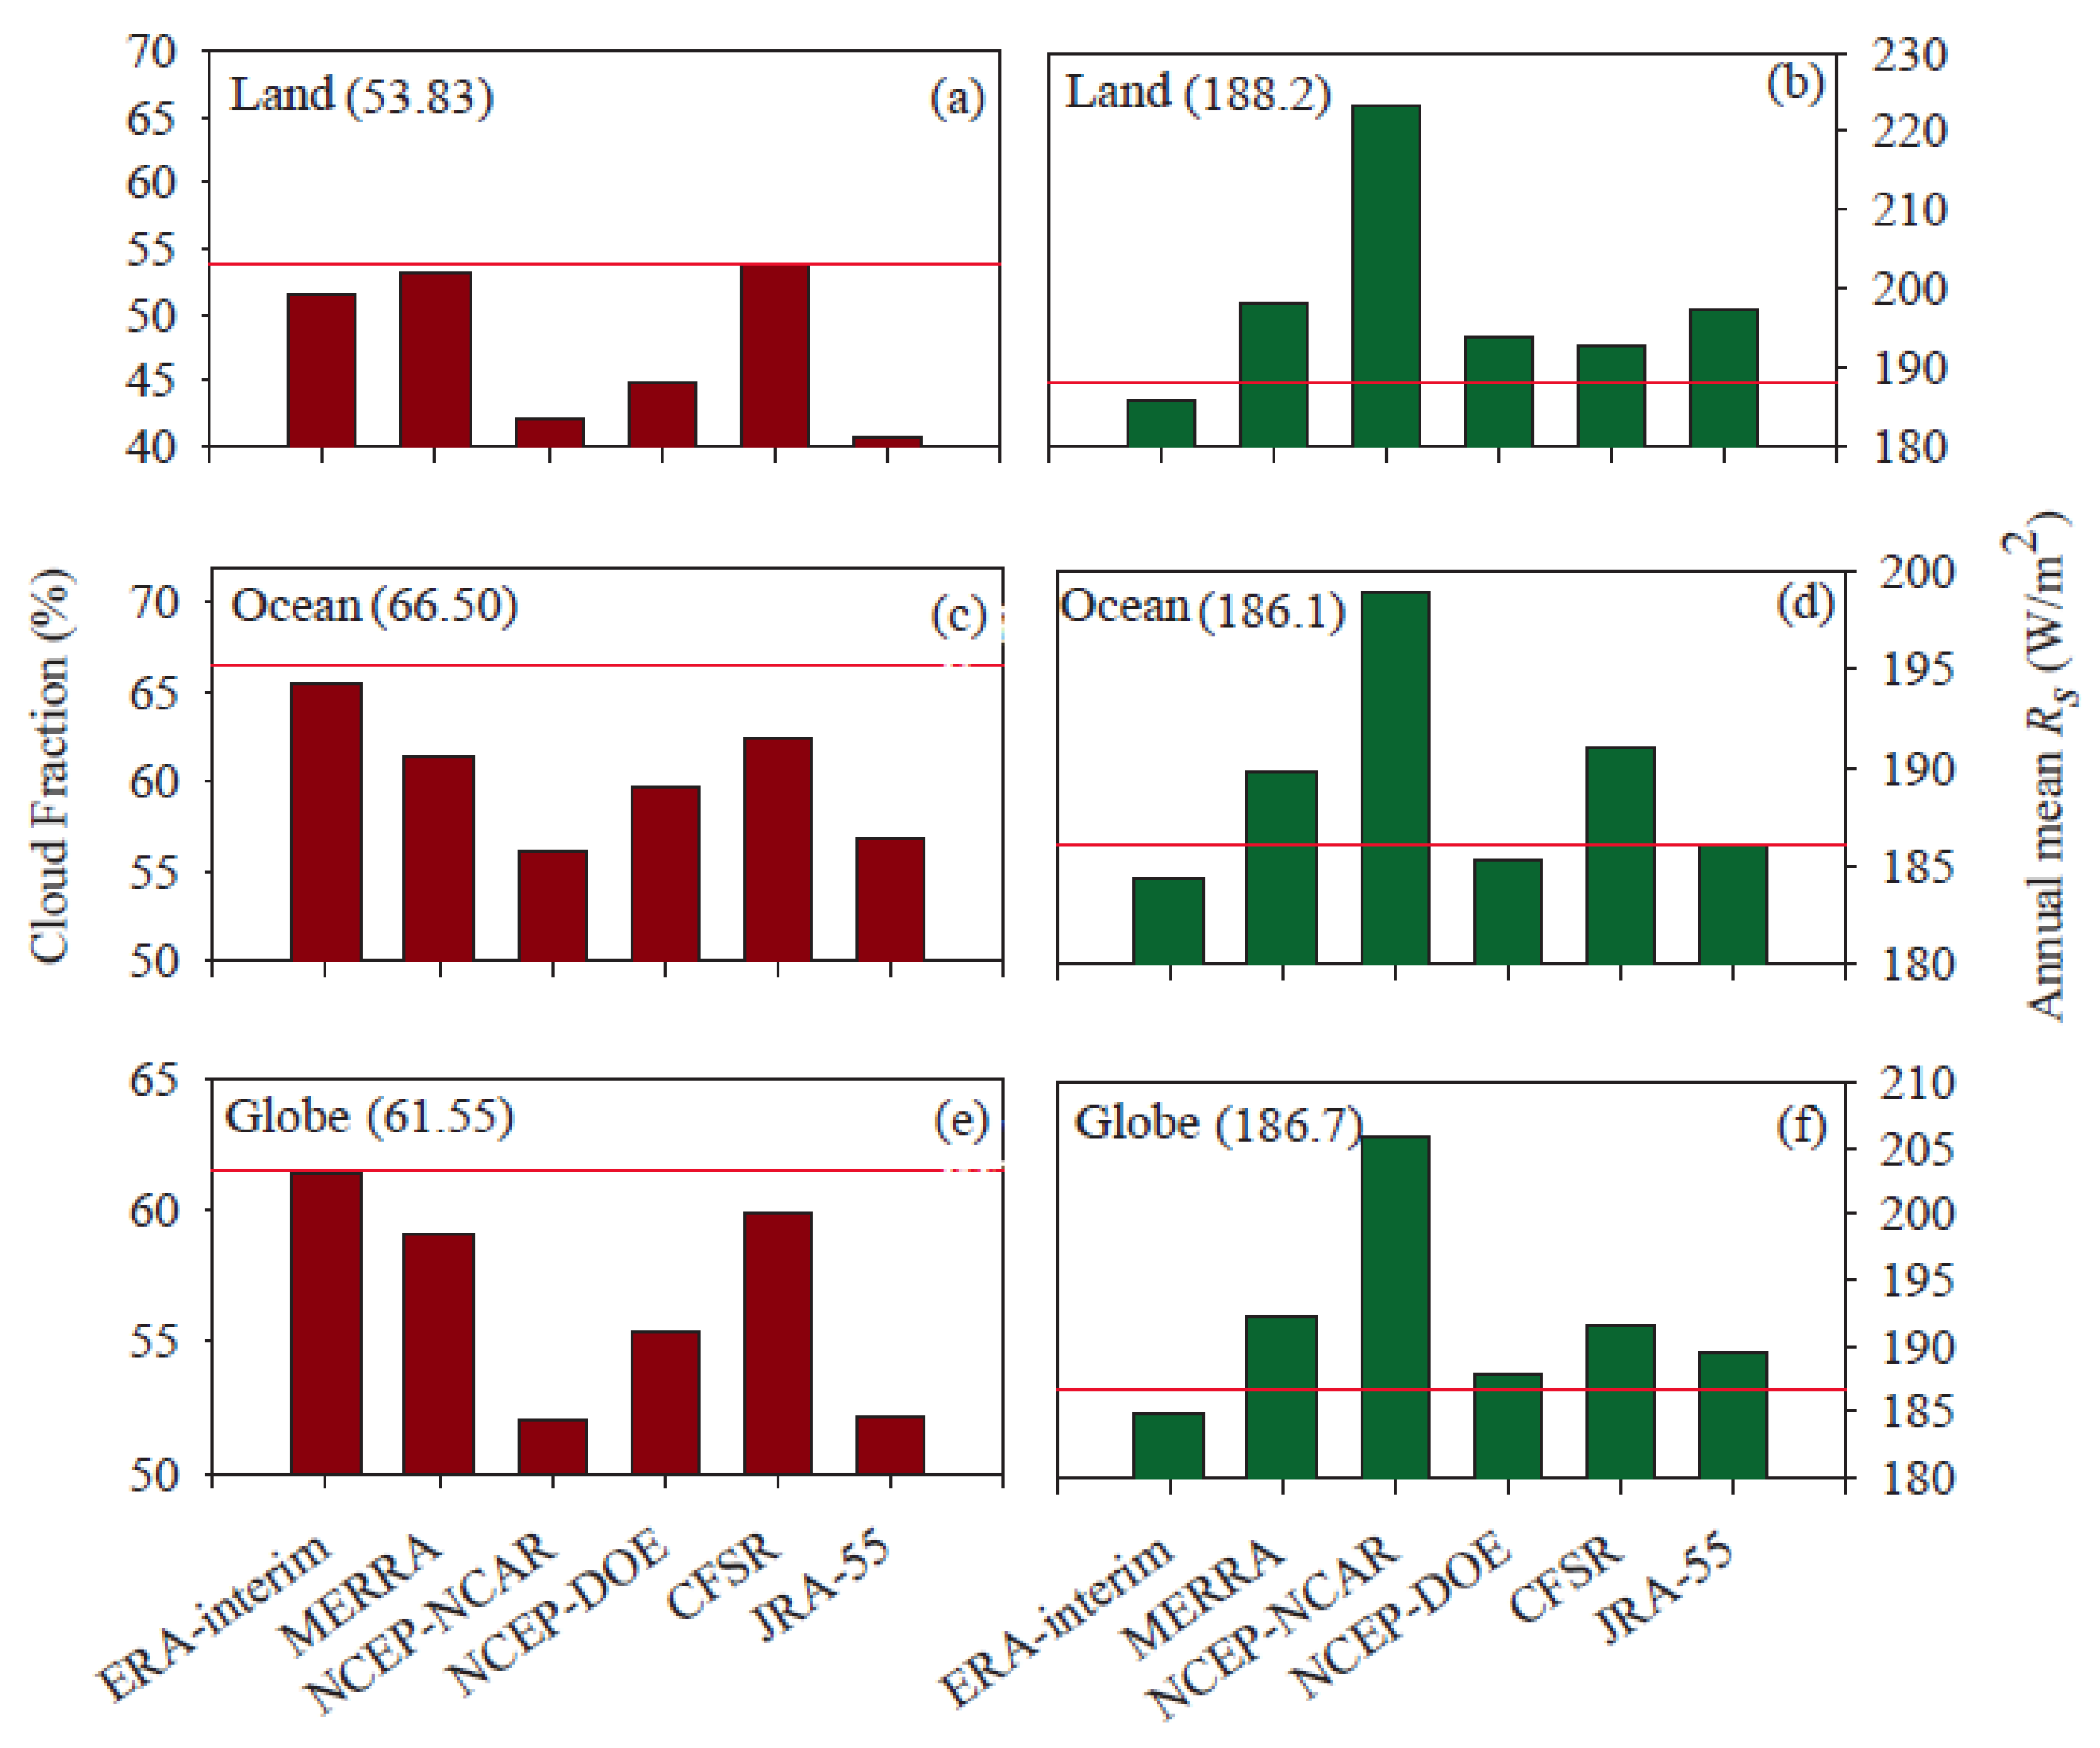
Figure 8 shows the multi-year annual mean CF and
Rs obtained from the global reanalyses and CERES data from 2001 to 2009 over land, oceans, and the globe. From the combination of
Table 7 and
Table 8, and
Figure 8, it is apparent that most of the reanalysis CF data underestimated over land, oceans, and the globe compared with the CERES MODIS observed CF data, whereas most of the reanalysis
Rs data overestimated over land, oceans, and the globe compared with the CERES-EBAF
Rs data. These results further proved that the discrepancies in the reanalysis CF products were reflected in the surface radiation fields, and that the clouds scheme should be improved in the reanalysis estimates.
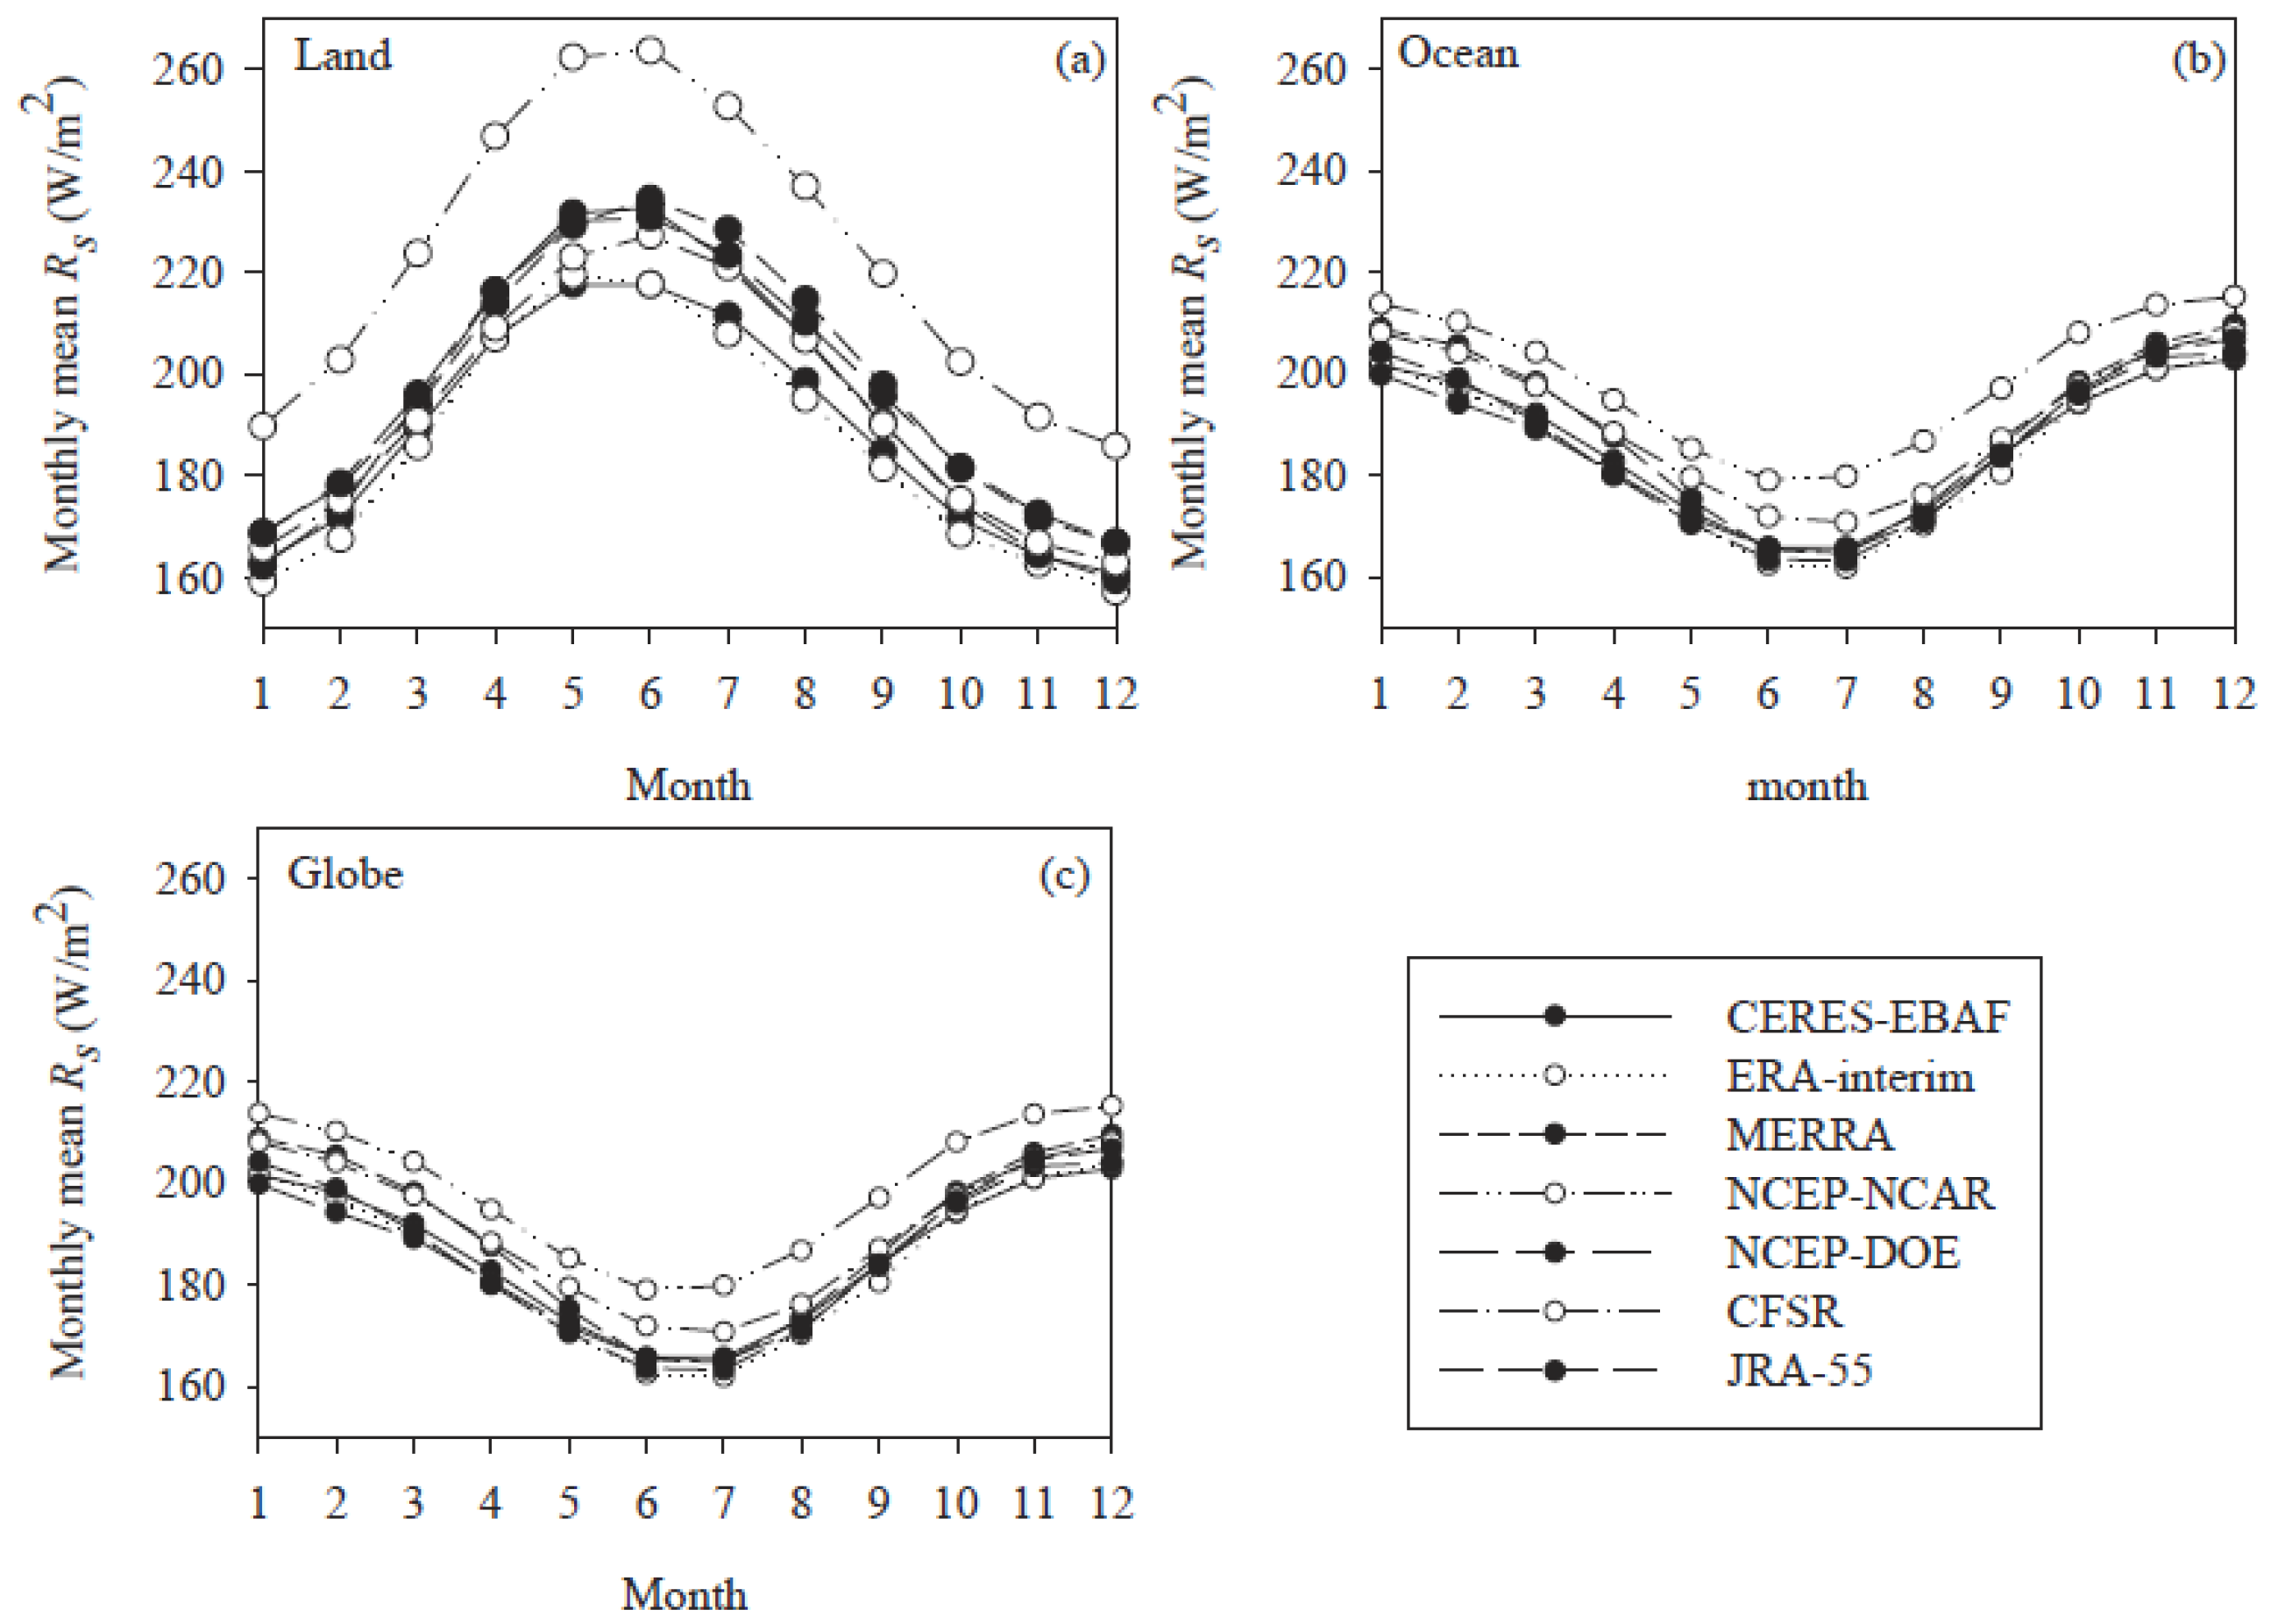
Figure 9a–c show the seasonal variations in calculated surface
Rs from CERES-EBAF and the reanalysis
Rs data from 2001 to 2009 for land, oceans, and the globe. As shown in the figure, although the reanalysis
Rs data showed similar seasonal variability to the CERES-EBAF
Rs data, the reanalysis
Rs data, with the exception of the ERA-Interim, exhibited a higher global monthly mean value compared to the CERES-EBAF
Rs data, especially in the case of the NCEP-NCAR data, with the maximum values occurring in JJA. The ERA-Interim showed a slightly lower value compared to the CERES-EBAF
Rs data at a global scale.
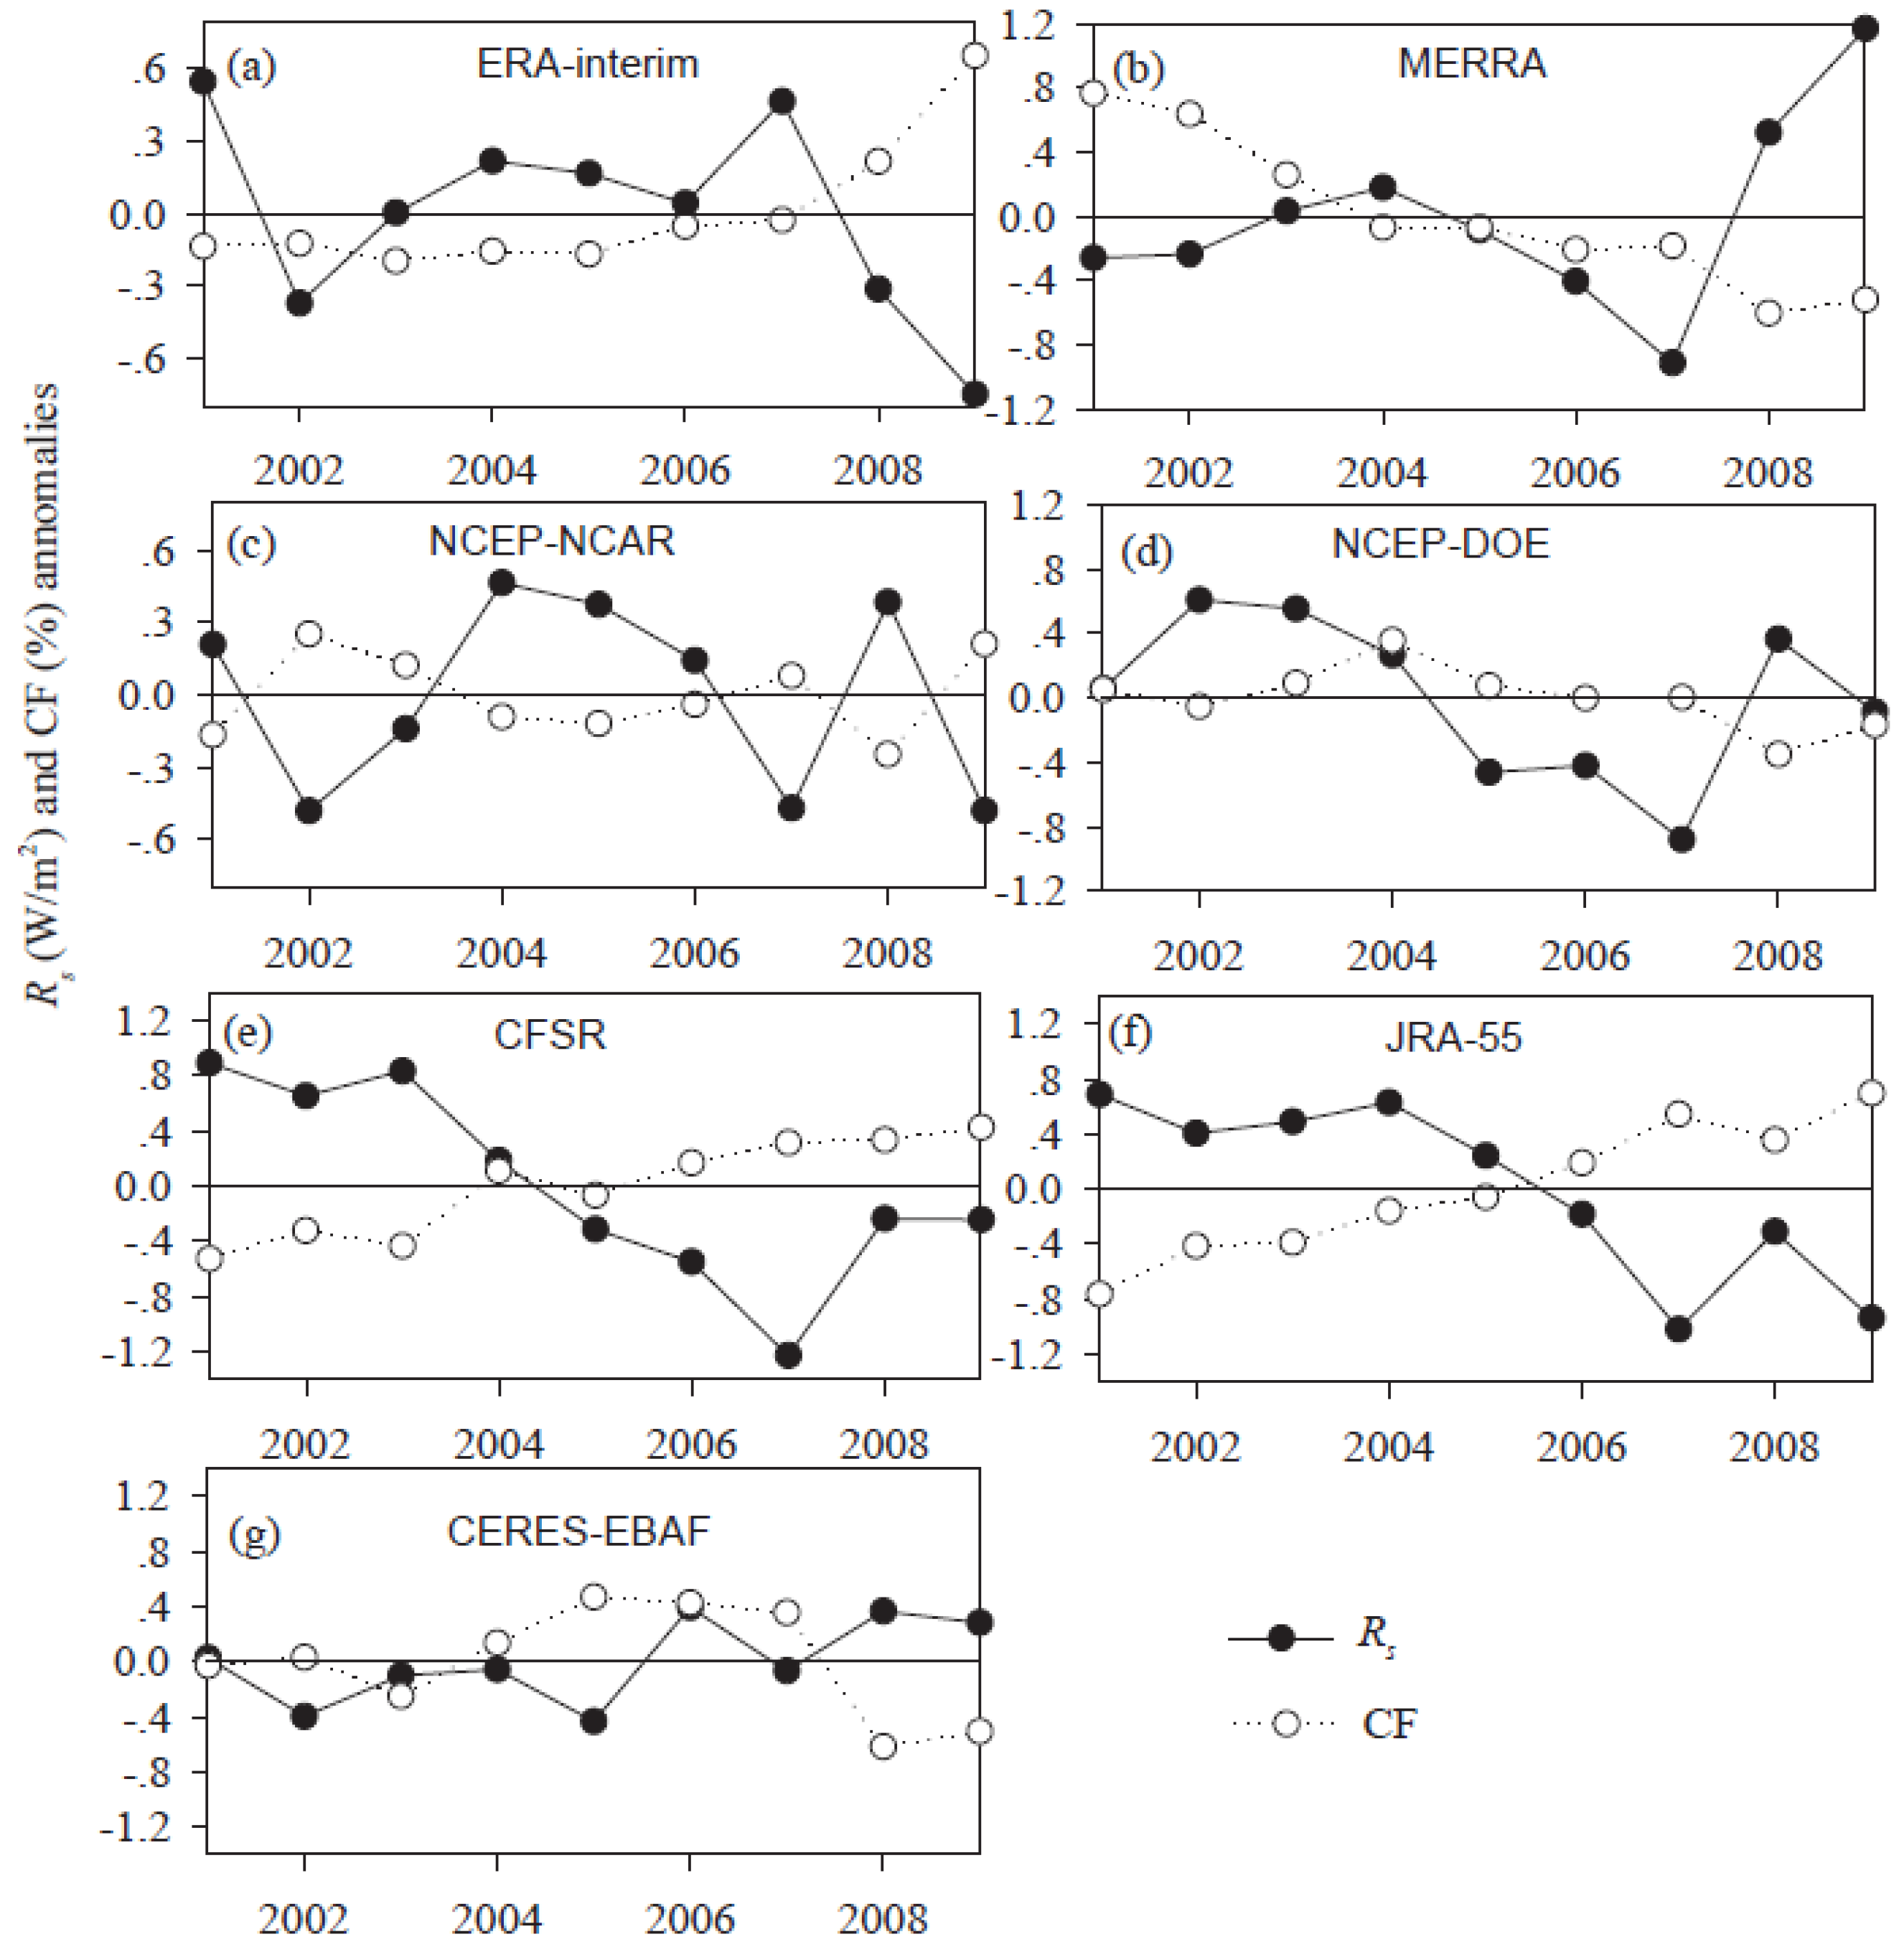
The long-term global annual variability of
Rs from the global reanalyses were also examined using CERES-EBAF
Rs data. The global reanalysis
Rs data showed quite different long-term global annual variability pattern from those derived from the CERES-EBAF data. As shown in
Figure 10, the CF anomalies of global reanalyses showed a highly negative correlation with that of
Rs from the global reanalyses. This means that the long-term global annual variability of
Rs was primarily determined by the CF. Since the cloud scheme may have introduced large uncertainties to the estimates of
Rs in reanalysis, the reanalysis
Rs cannot be used to determine long-term variability in
Rs.
3.3. Global Annual Mean
As is well known,
Rs is an essential component of the total energy exchange between the atmosphere and the Earth’s surface. Much effort has been expended to estimate the global annual mean values from various data sources including surface observations, satellite retrievals, reanalysis products, and global climate simulations [
2,
4,
5,
53,
57,
61,
62,
63,
64].
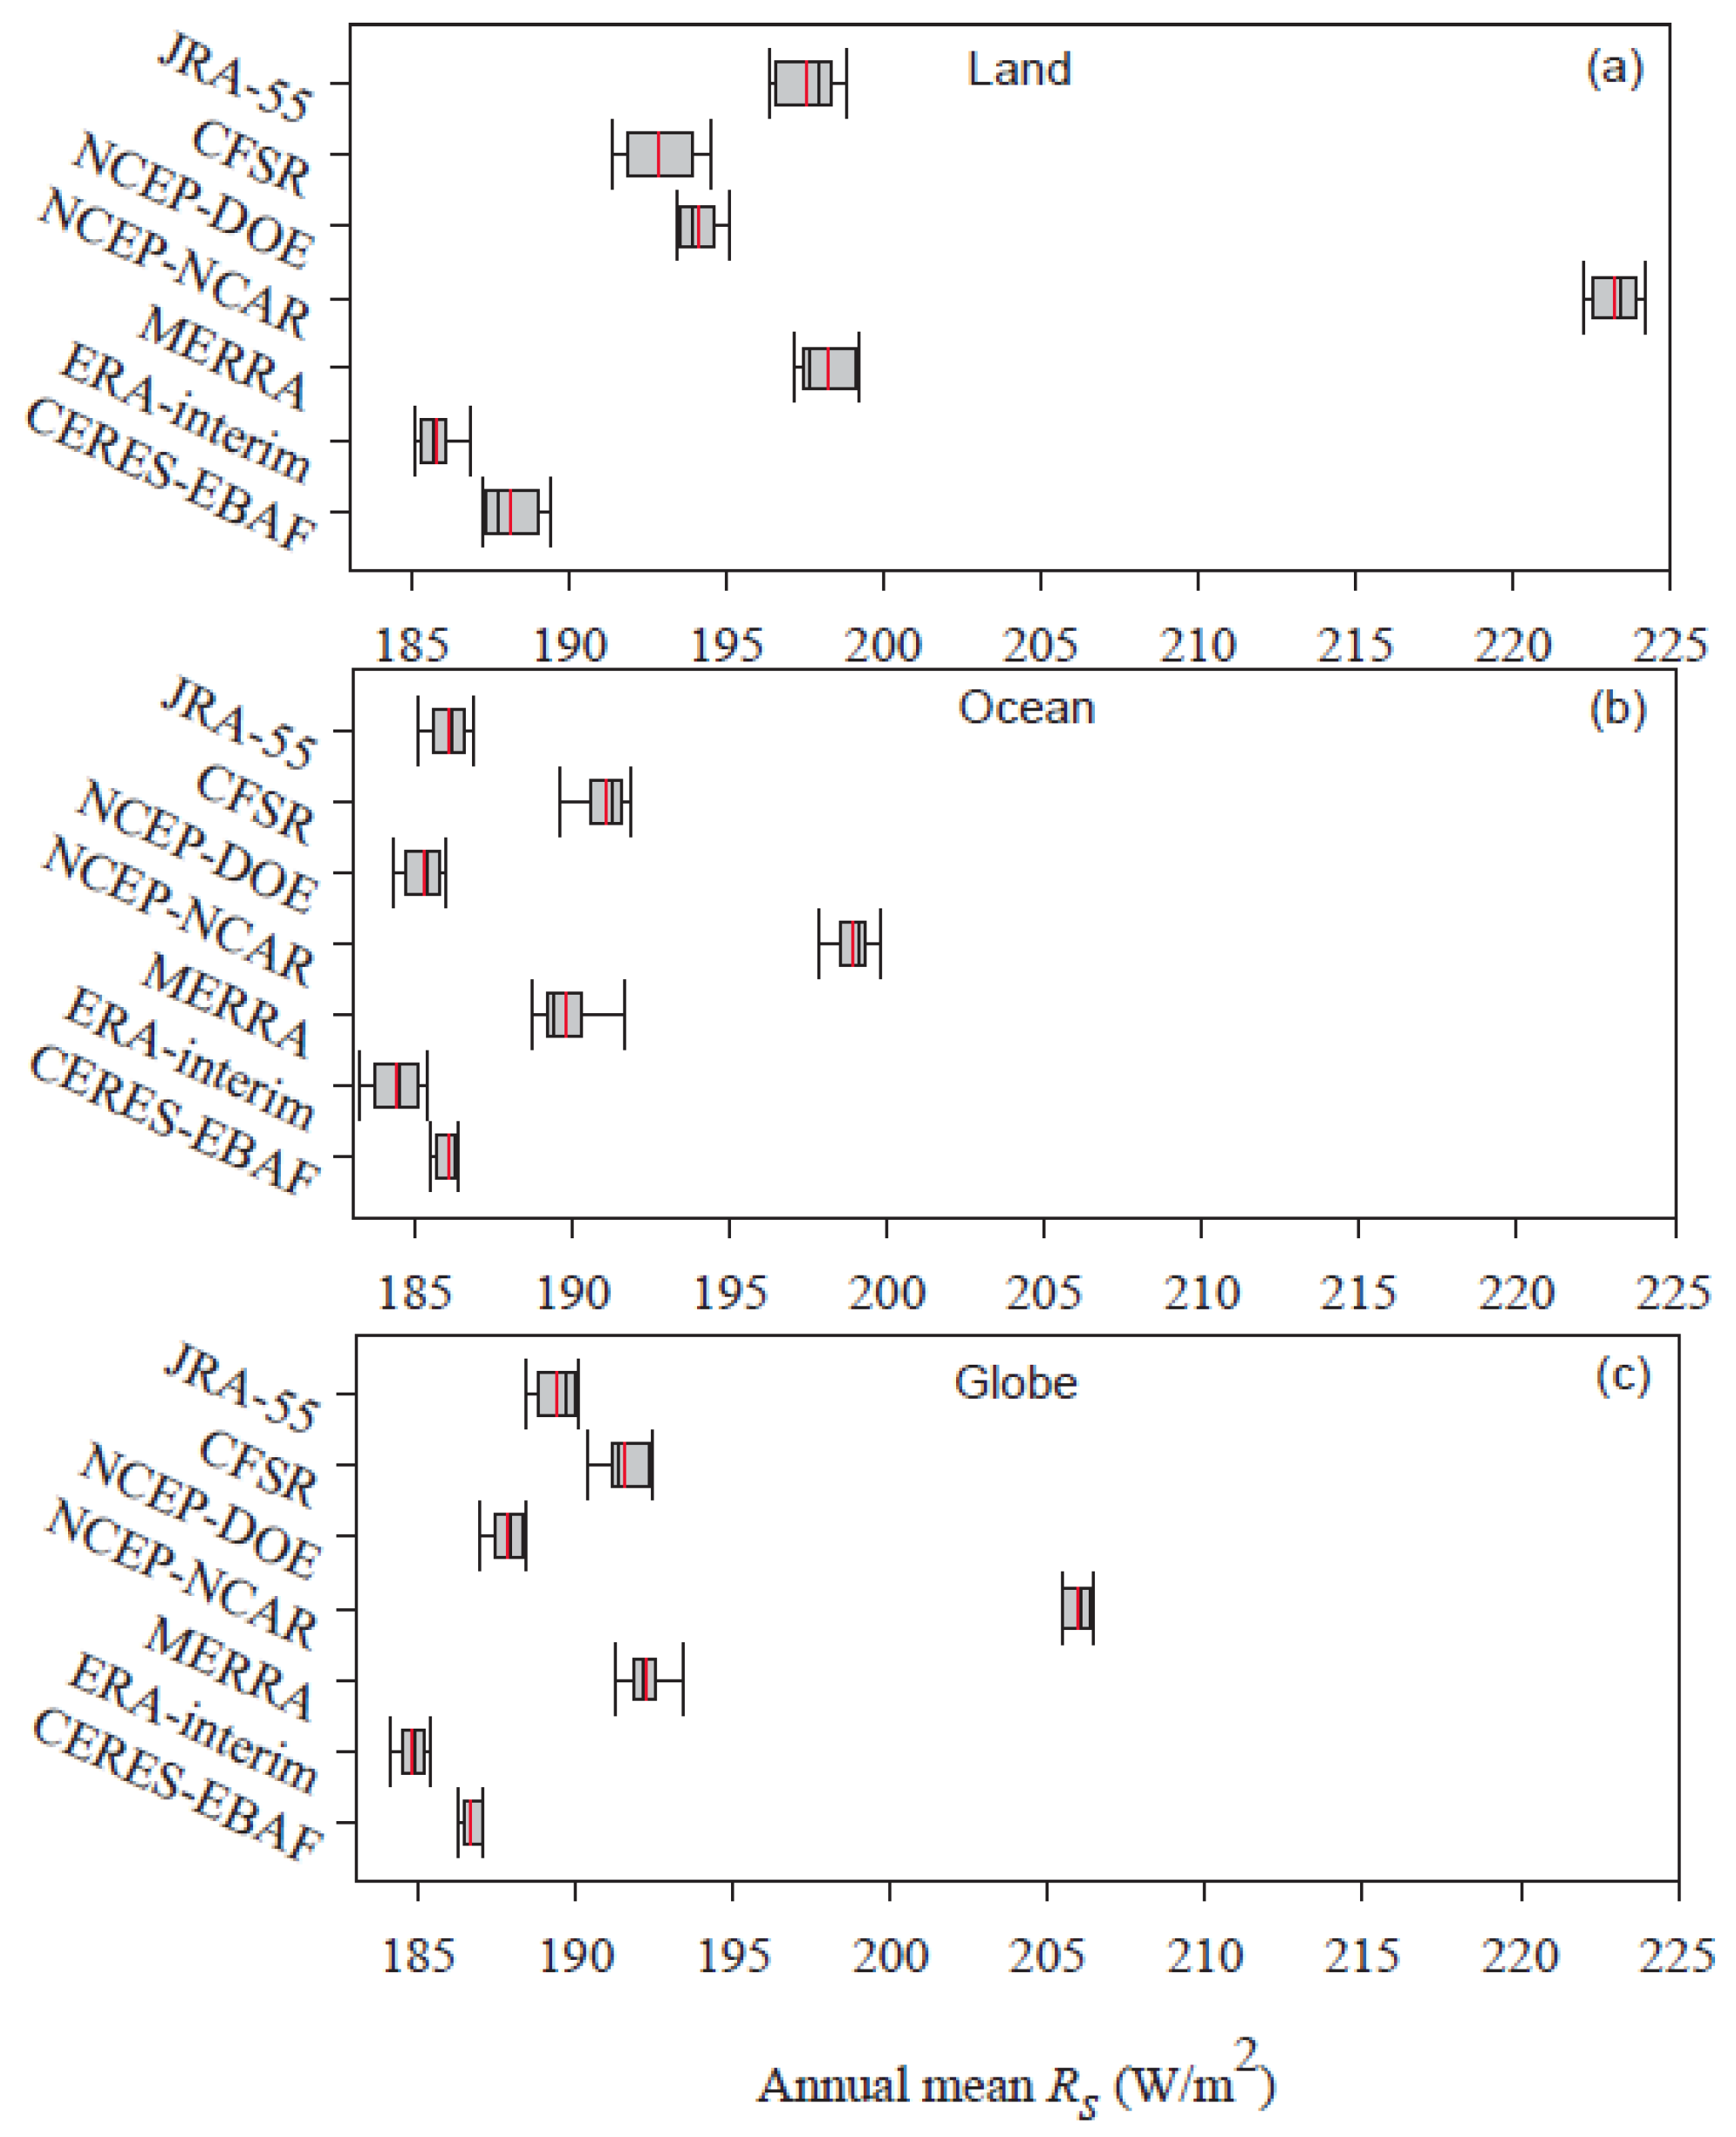
Figure 8 and
Figure 11 display the annual mean
Rs calculated directly from the CERES-EBAF and the reanalysis
Rs data for 2001–2009. The multi-year annual mean
Rs calculated from the nine-year global reanalysis data ranged from 184.8 W/m
2 to 205.9 W/m
2 over the globe, 185.8 W/m
2 to 223.2 W/m
2 over land, and 184.4 W/m
2 to 198.9 W/m
2 over oceans, respectively. The annual mean
Rs calculated from the nine-year CERES-EBAF data were 186.7 W/m
2, 188.2 W/m
2, and 186.1 W/m
2 over the globe, land, and the oceans, respectively. It is obvious that the multi-year annual mean
Rs calculated from the nine-year global reanalysis data are greater than those derived from CERES-EBAF satellite retrievals except for ERA-Interim. Previous studies have always calculated the annual mean after removing the bias between the obtained
Rs from gridded products and surface observations. However, the
Rs obtained from gridded products may show strong latitudinal dependencies in their biases compared with the surface observations, which may introduce large uncertainties into the annual mean
Rs estimates. In this study, a bias, which is the average of biases in the latitude bands (5o latitudinal bands) weighted by the area of the latitudinal band, was also calculated. The averaged biases weighted by the area of the latitudinal band were 3.6 W/m
2, 6.1 W/m
2, and 3.8 W/m
2 over land, the oceans, and the globe, whereas these values were 3.0 W/m
2, 4.2 W/m
2, and 3.3 W/m
2 (
Table 5 and
Table 6) using the surface observations as the validation data directly. It is clear that the biases determined in this way are different from those calculated directly using the surface observations. The global annual mean
Rs values of 184.6 W/m
2, 180.0 W/m
2, and 182.9 W/m
2 were obtained after removing the averaged bias weighted by the area of the latitudinal band over land, the oceans, and the globe. Note that the averaged bias weighted by the area of the latitudinal band over the oceans was greater than those over land and the globe, because the surface observations over the oceans are limited and most of the oceanic surfaces are under-represented in the high latitude regions such as the Northern Pacific Ocean and the Southern Ocean. Therefore, the annual mean
Rs over the oceans may contain larger uncertainties than those derived for land. The global land mean
Rs of 184.6 W/m
2 obtained in this study is very close to the land mean
Rs of 184 W/m
2 obtained by Trenberth and Fasullo [
64] and Wild [
57]


