

Abstract
Litter production and decomposition are key processes controlling the capacity of wetland to store and cycle carbon (C) and nutrients. Typhoons deposit large amounts of green and semi-green (between green and withered) plant tissues and withered litter (normal litter) on wetland soils, generating a pulse of litter production. Climatic models project an increase in typhoon intensity and frequency. Elucidating the impacts of typhoons on C, N and P cycles and storage capacities in subtropical and tropical wetland areas is thus important. We analyzed the patterns and changes of litter decomposition after a typhoon in the Minjiang River estuary in southeastern China. Green litter decomposed the fastest, and the loss of mass did not differ significantly between semi-green litter, withered litter and mixed litter (all soil litter after a typhoon). During the decomposition process the remaining green litter had the highest, and withered litter the lowest N and P concentrations. The biomass loss rate of litter during the studied period was related to the initial litter N and P concentrations. Remaining litter generally increased its N:P ratio during decomposition. The ratio of the released N and P was consequently lower than the initial N:P ratio in all litter types. The typhoon enhanced the release of C, N and P from the litter (884, 12.3 and 6 kg ha−1, respectively) by 264 days after the typhoon. The soil was accordingly enriched with organic matter and nutrients for several months, which should favor microbial growth rates (higher C, N and P availability and lower C:nutrient and N:P ratios) and increase the rates of C and nutrient cycling. If the frequency and/or intensity of typhoons increase, a constant increase in the release of N and P to the soil with lower N:P ratios could change the N and P cycles in wetlands and provide better conditions for the spread of fast-growing species.
Export citation and abstract BibTeX RIS

Content from this work may be used under the terms of the Creative Commons Attribution 3.0 licence. Any further distribution of this work must maintain attribution to the author(s) and the title of the work, journal citation and DOI.
1. Introduction
Coastal wetlands occupy 5.7 × 10⁶ km2 globally (Mitsch and Gosselink 2007, Ramsar Convention Secretariat 2013) and 1.2 × 10⁴ km2 in China (Shen and Zhu 1999, Huang et al 2006). They are cradles of biodiversity upon which countless species of plants and animals depend for survival (Ramsar Convention Secretariat 2013). Wetlands are also among the world's most productive environments and provide a wide array of benefits. Coastal wetlands are good sinks of C and nutrients as peat and plant matter (Mitsch and Gosselink 2007, Ramsar Convention Secretariat 2013) and are among the ecosystems most affected by global change. In fact, wetlands can be both sources and sinks of carbon depending on climatic conditions (Kayranli et al 2010). Imbalances between N and P driven by human activity tend to be larger and have greater impact in wetlands (Peñuelas et al 2012, 2013), but we lack information on the effect of typhoons on the functional traits of wetlands, such as nutrient cycles in the plant-soil system.
Litter is the most important pool of C and nutrients in wetlands (Adair et al 2008, Poll et al 2008) and the origin for nutrient recycling (Peng and Liu 2002). The rate of litter decomposition strongly affects the accumulation of C and nutrients in wetlands and alters the capacity of soil to fix C and nutrients (Yin et al 1994, Tong and Liu 2009). Changes in the rates of litter production and decomposition can thus shift the C flux and thereby indirectly affect global warming. Higher nutrient releases can also enhance water eutrophication.
Typhoons are common in subtropical and tropical Asiatic regions (Tong and Yang 2007) and have the potential to uproot, snap, break or defoliate plants (Brokaw and Walker 1991). Large amounts of fresh litter, including green and semi-green litter, are consequently added to soils, which could affect litter composition and in turn the dynamics of C and nutrient cycles. The effects of strong tropical storms on the production and decomposition of litter in ecosystems have been studied in several forests, with no consensus on the rates of litter decomposition. These rates are dependent on forest traits and species composition (Wright and Coleman 2002, Beard et al 2005). Increases in the amounts of litter and N and P released to soils are commonly observed after storms (Ostertag et al 2003, Xu et al 2004, Inagaki et al 2008). A rapid recovery to pre-typhoon litter conditions is also generally observed in tropical forest (Sullivan et al 1999, Ostertag et al 2003, Beard et al 2005).
Information about the impact on litter decomposition during a typhoon is sparse (Tong and Yang 2007), and the impact after the typhoon is even less clear. Despite some studies have suggested the possible impact of typhoons and hurricanes on litter status in wetland areas (Chen and Twilley 1999, Hoeppner et al 2008, Chen et al 2009, Kamruzzaman et al 2013), at the best of our knowledge there is a lack of a detailed study of both the impact on tropical storm event on litter production and mainly on C and nutrient released from litter. Determining the pattern and possible shifts in soil litter decomposition after a typhoon is thus urgently needed.
The elemental compositions of plant tissues and litter are tightly associated (Estiarte and Peñuelas 2015), especially C, N and P concentrations, which are strongly biochemically interrelated (Mulder et al 2013, Wang et al 2014). C:N:P stoichiometry provides a useful tool for studying the nutrient supply and balance in plants and global ecosystems (Elser et al 2000a, 2000b, Sardans et al 2012). Litter stoichiometry controls litter decomposition and nutrient release to soils (Marichal et al 2011). Studying changes in C, N and P stoichiometry during litter decomposition can advance our understanding of the relationships among litter decomposition rate and the interactions of various nutrients in the plant-litter-soil system (Manzoni et al 2010). These changes in litter decomposition and C and N release can have further impacts on soil food webs and an entire ecosystem (Sardans et al 2012, Mulder et al 2013).
China is one of the countries most affected by typhoons (China Association for Disaster Prevention 1991). Typhoons occur mainly south of the Yangtze River (Gao et al 1999), e.g. in Fujian, Guangdong and Zhejiang Provinces. Fujian received an average of three typhoons per year during 1990–2006 (Wang and Tan 2008). Models indicate that precipitation will likely be more extreme near the centers of tropical cyclones, so typhoons will likely be more frequent and intense in western, eastern and southern Asia (IPCC 2014). Indeed, eight typhoons occurred in 2012. The relationship between litter decomposition and litter nutrient stoichiometry, and the relationship between litter nutrient stoichiometry and nutrient release, however, are unknown for tidal wetlands after a typhoon. The projected increase in the frequency of typhoons increases the need to evaluate litter decomposition and the capacities of C and nutrient retention and release in wetlands after a typhoon.
To further understand the effects of typhoons on remaining and released litter mass and nutrients and litC, N and P concentrations, contents and stoichiometries in the wetlands of the Minjiang River estuary, by comparing litter decomposition at various time-points after a typhoon we: (i) evaluated the impacts of a typhoon event on the changes in litter mass, and during decomposition event on remaining litter mass C, N and P concentrations, contents and stoichiometry and on the C, N and P contents released from litter for different types of litter, green (fallen during typhoon), semi-green (fallen during typhoon) and withered (existing previous typhoon), and in the mixture of them after a typhoon in estuarine tidal Cyperus malaccensis wetlands, and (ii) investigated the relationships between nutrient ratios and the capacities to retain and release C and nutrients in these litter types.
2. Materials and methods
2.1. Study site
This study was conducted in the Shanyutan wetland (26°01'46''N, 119°37'31''E; figure 1), the largest tidal wetland (approximately 3120 ha) in the estuary of the Minjiang River. This estuary in southeastern China is an important tidal wetland ecosystem due to its unique location at the transition of the central and southern subtropical climatic zones (Zheng et al 2006). Cyperus malaccensis Lam. var. brevifolius Boeckeler (syn. Cyperus malaccensis Lam. subsp. monophyllis (Vahl)T. Koyama) comprises much of the emergent macrophytic biomass in the estuary (Liu et al 2006). The climate in this region is relatively warm and wet with a mean annual temperature of 19.6 °C and a mean annual precipitation of 1346 mm (Zheng et al 2006). The soil surface is submerged across the study site beneath 10–120 cm of water for 3–3.5 h during each tidal inundation. The soil surface is exposed at low tide, but the soil remains flooded at some depths. Soil properties of the habitats were showed in table 1.
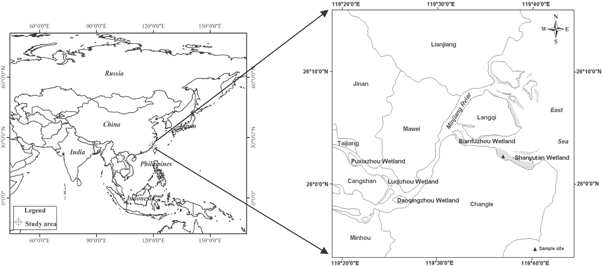
Figure 1. Location of the study area and sampling site (▲) in southeastern China.
Download figure:
Standard image High-resolution imageTable 1. Mean ± SE of some soil properties in the experimental site.
| Water content (%) | Bulk density (g cm−3) | pH | Salinity (mS cm−1) | Clay (%) | Total soil C (g kg−1) | Total soil N (g kg−1) | Total soil P (g kg−1) | C:N | C:P | N:P |
|---|---|---|---|---|---|---|---|---|---|---|
| 82.7 ± 2.8b | 0.871 ± 0.026 | 6.09 ± 0.05 | 0.989 ± 0.044 | 26.7 ± 0.7 | 18.8 ± 0.4 | 1.44 ± 0.03 | 0.742 ± 0.047 | 13.1 ± 0.3 | 28.2 ± 1.6 | 2.12 ± 0.09 |
C. malaccensis is the most abundant plant in this wetland area. It is typically found in the upper (mid to high) portions of mudflats. C. malaccensis is a perennial herb that grows from March to September, with the root and some stems remaining during winter. For C. malaccensis most aboveground biomass is stem, so in our study, we studied C. malaccensis stem litter. Typhoons in this area usually occur from July to October. C. malaccensis uprooted by typhoons becomes the source of green, semi-green and withered litter. Normal C. malaccensis litter is usually withered.
2.2. Experimental design and sample collection and analyses
Green, semi-green, withered (naturally generated) and mixed (all soil litter after a typhoon) C. malaccensis litters were collected immediately after a typhoon in September 2012 (with a duration of about 12 h) in three plots (5 × 5 m) randomly stablished within Shanyutan wetland. We consider green litter the green leaves/shoots fallen as consequence of the typhoon, semi-green litter as nearly-senesced leaves/shoot that were starting to senesce and that the typhoon advanced their fall. We considered withered litter as the litter corresponding to completely senesced and dead leaf/shoot fallen before typhoon. All litter was cut into 10 cm lengths, and 20 g of this material was packed into square 20 cm nylon mesh bags with a mesh size of 0.3 mm, following the method by Zhang et al (2014a). Litter was conserved at 4° C until leaving in filed. For the mixed litter bags (total 20 g litter) including the different types of litter in an equivalent natural proportion; green litter 6 g, semi-green litter 9 g and wither litter 5 g. Twenty seven bags of each four types of litter (green, semi-green, withered and mixed) were then left in the Shanyutan wetland randomly to decompose naturally on 12 October 2012. The litter bags were on the ground in contact with soil, and fixed with the PPR tube bar. Each type had three replicates. An aliquot of each initial litter sample used in the experiment was used to estimate the dry weight equivalent after drying until constant weight in the laboratory.
The decomposition experiment began on 12 October 2012 soon after the typhoon. Three random replicates of each litter type were collected at days 21, 46, 90, 123, 151, 184, 203, 224 and 264 after the beginning of decomposition experiment. We thus collected: four litter types × nine sampling times × three replicates = 108 samples.
Each sample was gently washed with water, oven-dried to a constant weight (85 °C for 24–36 h), weighed and finely ground in a ball mill. The C and N concentrations were determined using a Vario EL III Elemental Analyzer (Elementar Scientific Instruments, Hanau, Germany). P concentration was determined by perchloric-acid digestion and then was measured using the molybdate-blue reaction (Lu 1999) with a UV-2450 spectrophotometer (Shimadzu Scientific Instruments, Kyoto, Japan).
We also calculated the decomposition rate constants (k-values) for each litter type (Olson and Sommers 1982) by using the model: ln (Xt/X0) = −kt, where Xt is the litter dry mass remaining after t day decomposition, X0 is the litter dry mass at the start, and K is the decomposition rate constant.
2.3. Statistical analysis
We calculated the decomposition rate of the different litters and the C, N and P concentrations and mass ratios (C:N, C:P and N:P ratios) along the time-points of sampling. We also estimated the accumulated C, N and P total contents released from litter in each sampling moment as the product of concentrations by the remaining biomasses along the litter decomposition process and also the total C, N and P contents in the litter mass remaining in all the studied types of litter:
- Ei = LBi × [E]i
- Eri = Eo − Ei
- Ei = Total element content in a sampling moment
- LBi = Litter biomass in the corresponding moment (remaining mass litter)
- [E]i = concentration of the element in this moment.
- Eri = Total element released in a sampling moment
- Eo = Total initial content
- We also calculated the total C, N and P released during all the studied period:
- Ert = E264 − Eo; Where Ert = Total element released during 264 days, E264 = Total element content at day 264, Eo = Total initial content.
We used an analysis of repeated measures ANOVA to compare the decomposition rates (remaining mass litter); C, N and P concentrations and total contents, and C:N, C:P and N:P ratios in the initial and in the remaining mass litters, with litter types and sampling time point as independent categorical variables. Pearson's correlations were performed among the investigated parameters. We also analyzed by repeated measures ANOVA the differences in remaining mass, C, N and P concentrations, total contents and ratios of C, N and P released from and retained in the litters between the withered litter, which is the normal litter, and the mixed litter, which represents litter in the soil after a typhoon. All statistical analyses used SPSS 13.0 (SPSS Inc., Chicago, USA).
The differences in the changes in elemental composition and stoichiometry during decomposition between withered and mixed litter were identified by a general discriminant analysis (GDA). This multivariate analysis accounts for the variance in litter decomposition over time as the independent categorical variable. Discriminant analysis is a supervised statistical algorithm that derives an optimal separation between groups established a priori by maximizing between-group variance while minimizing within-group variance (Raamsdonk et al 2001). GDA is thus an adequate tool for identifying the variables most responsible for the differences among groups while controlling the components of the variance due to other categorical variables. Litter C:N, C:P and N:P ratios were calculated as mass ratios. The GDAs were performed using Statistica 6.0 (StatSoft, Inc. Tulsa, USA).
3. Results
3.1. General trends in remaining mass, nutrient concentration and stoichiometry in the litters during decomposition
The C, N and P concentrations of the litters are shown in table 2. The remaining mass and nutrient concentration and stoichiometry in the remaining litter during decomposition were affected by time, litter type and the interaction between time and litter type (figures 2–5, table S1). The mass of remaining litter and C concentrations in the remaining litter decreased over time for all litter types. Along the time of study, mass of remaining litters decreased the most for the green litter (P < 0.05). Along the time of study, C and P concentrations were highest in the green litter, followed by the semi-green, mixed and withered litters (P < 0.05). Along the time of study, N concentrations were highest in the green litter, followed by the mixed, semi-green, and withered litters (P < 0.05). Along the time of study, the C:N ratio was highest in the withered litter, followed by the semi-green, mixed and green litters (P < 0.05). Along the time of study, the C:P ratio was highest in the withered litter, followed by the semi-green, mixed and green litters (P < 0.05). Along the time of study, the N:P ratio was highest in the green litter, followed by the mixed, semi-green and withered litters (P < 0.05). Remaining C and N concentrations were highest in the withered litter, followed by the mixed, semi-green and green litters (P < 0.05). The green litter had the lowest remaining mass and C, N and P concentrations after 264 days of decomposition, and the mixed litter had the highest remaining N concentration (table 3).
Table 2. Mean ± SE of various litter variables at the beginning of the experiment.
| Litter type | C (mg g−1) | N (mg g−1) | P (mg g−1) | C:N | C:P | N:P |
|---|---|---|---|---|---|---|
| Green | 388 ± 0.5b | 11.2 ± 0.1a | 2.78 ± 0.03a | 34.8 ± 0.3d | 139 ± 2c | 4.00 ± 0.04d |
| Semi-green | 378 ± 0.1d | 8.77 ± 0.10b | 1.06 ± 0.01d | 43.2 ± 0.5c | 238 ± 2b | 5.51 ± 0.03b |
| Withered | 393 ± 0.5a | 6.63 ± 0.06c | 1.59 ± 0.01c | 59.3 ± 0.6a | 370 ± 1a | 6.24 ± 0.04a |
| Mixed | 386 ± 0.2c | 8.52 ± 0.07b | 1.83 ± 0.01b | 45.3 ± 0.4b | 211 ± 1d | 4.67 ± 0.05c |
| Between types | F = 300 | F = 503 | F = 1663 | F = 522 | F = 5045 | F = 553 |
| P < 0.001 | P < 0.001 | P < 0.001 | P < 0.001 | P < 0.001 | P < 0.001 |
Different letters within a column indicate significant differences at P < 0.05.
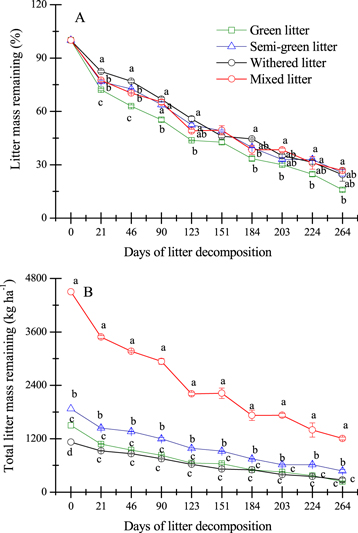
Figure 2. (A) Remaining mass relative to the initial mass and (B) total remaining litter mass (mean ± SE) during decomposition in different types of litter. Different letters indicate significant differences (P < 0.05) among the types of litter in a sampling data.
Download figure:
Standard image High-resolution image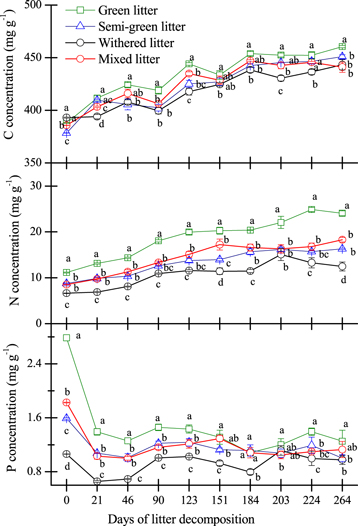
Figure 3. C, N and P concentrations (mean ± SE) of the litters during decomposition. Different letters indicate significant differences (P < 0.05) among the types of litter in a sampling data.
Download figure:
Standard image High-resolution image
Figure 4. Remaining C:N, C:P and N:P ratios (mean ± SE) in mass basis of the litters during decomposition. Different letters indicate significant differences (P < 0.05) among the types of litter in a sampling data.
Download figure:
Standard image High-resolution image
Figure 5. Remaining C, N and P (mean ± SE) in the litters during decomposition. Different letters indicate significant differences (P < 0.05) among the types of litter in a sampling data.
Download figure:
Standard image High-resolution imageTable 3. Mean ± SE of various litter variables at the end of the study (day 264).
| Litter type | Remaining mass (%) | Remaining C (%) | Remaining N (%) | Remaining P (%) |
|---|---|---|---|---|
| Green | 15.91 ± 0.99b | 18.89 ± 1.71b | 34.40 ± 2.71c | 7.25 ± 1.38b |
| Semi-green | 25.38 ± 1.69a | 30.22 ± 1.94a | 47.19 ± 3.13b | 16.00 ± 1.46a |
| Withered | 24.46 ± 3.64a | 27.67 ± 4.35a | 45.11 ± 3.98b | 22.46 ± 3.89a |
| Mixed | 26.78 ± 0.73a | 30.63 ± 1.15a | 57.44 ± 0.80a | 16.45 ± 1.27a |
| Between types | F = 5.46 | F = 4.72 | F = 10.6 | F = 7.55 |
| P = 0.024 | P = 0.035 | P = 0.004 | P = 0.010 |
Different letters within a column indicate significant differences at P < 0.05.
The decomposition rates of the different studied types of litter along the studied period of decomposition were 0.005 97 ± 0.000 18 d−1, 0.004 89 ± 0.000 15 d−1, 0.005 17 ± 0.000 35 d−1 and 0.004 63 ± 0.000 19 d−1 for green, semi-green, wither and mixed litter respectively. Green litter decomposition rate was significantly higher with respect to semi-green litter (P = 0.0070), wither litter (P = 0.024) and mixed litter (P = 0.0034).
3.2. Relationships among remaining litter mass and remaining litter C, N and P concentration and contents
Remaining mass for all litters was correlated negatively with remaining C (R = −0.91, P < 0.001), N (R = −0.74, P < 0.001) and P (R = −0.22, P < 0.05) concentrations and the remaining litter N:P ratio (R = −0.80, P < 0.001) but positively with remaining litter C (R = 0.98, P < 0.001), N (R = 0.81, P < 0.001) and P (R = 0.83, P < 0.001) contents and the remaining litter C:N ratio (R = 0.70, P < 0.001) (table 4).
Table 4. Pearson correlations among mass and nutrient concentrations, contents and ratios (in mass basis) in the remaining litter during decomposition experiment.
| Remaining C content | Remaining N content | Remaining P content | Litter C (mg g−1) | Litter N (mg g−1) | Litter P (mg g−1) | Litter C:N | Litter C:P | Litter N:P | |
|---|---|---|---|---|---|---|---|---|---|
| Remaining mass | R = 0.98 | R = 0.81 | R = 0.83 | R = −0.91 | R = −0.74 | R = −0.22 | R = 0.70 | R = 0.084 | R = −0.80 |
| P < 0.001 | P < 0.001 | P < 0.001 | P < 0.001 | P < 0.001 | P = 0.010 | P < 0.001 | P = 0.193 | P < 0.001 | |
| Remaining C content | R = 0.82 | R = 0.81 | R = −0.88 | R = −0.74 | R = −0.28 | R = 0.69 | R = 0.081 | R = −0.80 | |
| P < 0.001 | P < 0.001 | P < 0.001 | P < 0.001 | P = 0.012 | P < 0.001 | P = 0.203 | P < 0.001 | ||
| Remaining N content | R = 0.83 | R = −0.80 | R = −0.56 | R = −0.057 | R = 0.44 | R = −0.090 | R = −0.70 | ||
| P < 0.001 | P < 0.001 | P < 0.001 | P = 0.208 | P < 0.001 | P = 0.176 | P < 0.001 | |||
| Remaining P content | R = −0.88 | R = −0.82 | R = −0.31 | R = 0.75 | R = 0.14 | R = −0.84 | |||
| P < 0.001 | P < 0.001 | P < 0.001 | P < 0.001 | P = 0.068 | P < 0.001 | ||||
| Litter C (mg g−1) | R = 0.74 | R = 0.21 | R = −0.68 | R = −0.044 | R = 0.83 | ||||
| P < 0.001 | P = 0.015 | P < 0.001 | P = 0.327 | P < 0.001 | |||||
| Litter N (mg g−1) | R = 0.64 | R = −0.93 | R = −0.50 | R = 0.78 | |||||
| P < 0.001 | P < 0.001 | P < 0.001 | P < 0.001 | ||||||
| Litter P (mg g−1) | R = −0.73 | R = −0.95 | R = 0.039 | ||||||
| P < 0.001 | P < 0.001 | P = 0.346 | |||||||
| Litter C:N | R = 0.656 | R = −0.66 | |||||||
| P < 0.001 | P < 0.001 | ||||||||
| Litter C:P | R = 0.11 | ||||||||
| P = 0.141 |
Remaining C, N and P contents for all litters were negatively correlated with remaining litter C concentrations (R = −0.88, P < 0.001; R = −0.80, P < 0.001; R = −0.88, P < 0.001, respectively) and N (R = −0.74, P < 0.001; R = −0.56, P < 0.001; R = −0.82, P < 0.001, respectively) concentrations and the N:P ratio (R = −0.80, P = 0.025; R = −0.70, P = 0.010; R = −0.844, P < 0.001, respectively) (table 4). Remaining litter C and P contents were negatively correlated with the remaining P concentration (R = −0.28, P < 0.05; R = −0.31, P < 0.001, respectively) (table 4). Remaining C, N and P contents were positively correlated with the remaining C:N ratio (R = 0.69, P < 0.001; R = 0.44, P < 0.001; R = 0.75, P < 0.001, respectively) (table 4).
Remaining litter mass at the end of studied period (at 264 days from the beginning of the decomposition experiment) were negatively correlated with initial litter N and P litter concentrations and positively with initial litter N:P ratio (R = −0.61, P < 0.001; R = −0.65, P < 0.001; R = 0.53, P < 0.001, respectively) (table 5).
Table 5. Pearson correlations among final remaining mass and nutrient contents (at 264 days from the beginning of decomposition experiment) in the litter with initial nutrient concentrations and ratios (the analyses included all types of litter).
| Litter C concentration | Litter N concentration | Litter P concentration | Litter C:N | Litter C:P | Litter N:P | |
|---|---|---|---|---|---|---|
| Remaining mass | R = −0.209 | R = −0.605 | R = −0.648 | R = 0.463 | R = 0.447 | R = 0.527 |
| P = 0.258 | P = 0.018 | P = 0.011 | P = 0.065 | P = 0.073 | P = 0.039 | |
| Remaining C content | R = −0.264 | R = −0.569 | R = −0.612 | R = 0.433 | R = 0.401 | R = 0.477 |
| P = 0.203 | P = 0.027 | P = 0.017 | P = 0.080 | P = 0.098 | P = 0.058 | |
| Remaining N content | R = −0.206 | R = −0.483 | R = −0.470 | R = 0.335 | R = 0.236 | R = 0.250 |
| P = 0.261 | P = 0.056 | P = 0.061 | P = 0.144 | P = 0.230 | P = 0.217 | |
| Remaining P content | R = 0.246 | R = −0.860 | R = −0.850 | R = 0.832 | R = 0.811 | R = 0.788 |
| P = 0.221 | P < 0.001 | P < 0.001 | P < 0.001 | P = 0.001 | P = 0.001 |
3.3. Main differences between the withered and mixed litters during the 264 days of decomposition
We analyzed the effect of typhoons on litter decomposition by comparing the nutrient and mass differences between the withered (naturally generated) and mixed (all the litter in soil generated after a typhoon) litters. Mixed litter decomposed faster, had a larger decrease in P concentration and a larger increase in N:P ratios and P released than withered litter (figures 2–5). After 264 days the amounts of C, N and P released from litter due to typhoon (semi-green and green) were equivalent to 884, 12.3 and 6 kg ha−1 (figure 6). The C:P and N:P ratios of the total amounts of elements released from the litters since the typhoon were lower from the mixed than the withered litter (figure 7).

Figure 6. Accumulated C, N and P released (mean ± SE) from the litters during decomposition. Different letters indicate significant differences (P < 0.05) among the types of litter in a sampling data.
Download figure:
Standard image High-resolution image
Figure 7. C:N, C:P, N:P ratios (mean ± SE) of the accumulated elements released during decomposition at each time point of sampling. Different letters indicate significant differences (P < 0.05) among the types of litter in a sampling data.
Download figure:
Standard image High-resolution image3.4. Elemental multivariate analysis of litter decomposition
The green and withered litters were the most differed in the GDA in all litter types for remaining mass and N and P concentrations and contents during decomposition (figure 8). This analysis also identified significant differences in remaining C, N and P concentrations and contents between all litters during decomposition (table 6). All variables, except C concentration, differed among the types of litter (table 7). Green litter lost proportionally more N and P than withered litter during decomposition (figure 6), supporting the results of the univariate analyses.

Figure 8. Cases (A) and variables (B) plotted as functions of their scores (cases) and loadings (variables) in the general discriminant analysis of litter C, N and P concentrations ([C], [N] and [P], respectively), remaining mass (MR), remaining C (CR), remaining N (NR) and remaining P (PR) during litter decomposition. The types of litter were used as grouping factors. GL, green litter; SGL, semi-green litter; WL, withered litter; ML, mixed litter. Error bars represent SE.
Download figure:
Standard image High-resolution image
Table 6. Squared Mahalanobis distances among the litter types in the discriminant function analysis, with mass and C, N and P concentrations and contents (as percentages of initial litters) as independent factors.
| Withered litter | Semi-green litter | Mixed litter | |
|---|---|---|---|
| Sq. Mah. Dist. = 241 | Sq. Mah. Dist. = 82.2 | Sq. Mah. Dist. = 65.9 | |
| Green litter | F = 197 | F = 67.1 | F = 53.8 |
| P < 0.0001 | P < 0.0001 | P < 0.0001 | |
| Sq. Mah. Dist. = 47.8 | Sq. Mah. Dist. = 61.8 | ||
| Withered litter | F = 39.0 | F = 50.5 | |
| P < 0.0001 | P < 0.0001 | ||
| Sq. Mah. Dist. = 8.67 | |||
| Semi-green litter | F = 7.08 | ||
| P < 0.0001 |
Sq. Mah. Dist., squared Mahalanobis distance.
Table 7. Wilks' λ and P-value of the independent litter variables of the discriminant function analysis among the litter types during the decomposition experiment (including data of all sampling days).
| Wilks' λ | P | |
|---|---|---|
| Remaining mass | 0.902 | 0.015 |
| C concentration | 0.967 | 0.33 |
| N concentration | 0.416 | <0.0001 |
| P concentration | 0.363 | <0.0001 |
| Remaining C (% initial) | 0.544 | <0.0001 |
| Remaining N (% initial) | 0.450 | <0.0001 |
| Remaining P (% initial) | 0.451 | <0.0001 |
| Period after typhoon | 0.296 | <0.0001 |
4. Discussion
4.1. Decomposition in the litter types
The green, semi-green, withered and mixed litters had similar patterns of decomposition. The decomposition rate decreased with time and was fastest during the first 21 days when water-soluble substances such as easily soluble carbohydrates are leached from litter and degraded (Valiela et al 1985). Winter began at the study site in the period from day 21 to day 46. The litters decomposed more slowly during this period, likely due to the lower winter temperatures. Temperatures gradually increased at the start of spring (day 123), but the decomposition rate remained low. The low decomposition rates in spring may have been due to the progressive accumulation of more recalcitrant compounds in the litter, such as lignin and cellulose, as decomposition progressed (Osono and Takeda 2004, Talbot and Treseder 2012).
Green litter decomposed the fastest, and the semi-green, withered and mixed litters had similar decomposition rates. These differences were consistent with the higher initial quality of the green litter, which had the highest N and P concentrations (table 1). The decomposition rates of litter in wetlands have been correlated with litter quality (Tong and Liu 2009, Zhang et al 2014a). The green litter had the lowest C:N, C:P and N:P ratios. The C:N ratio is a particularly good indicator of the rate of litter decomposition (Enriquez et al 1993, Ågren et al 2013), because the higher the C:N ratio, the more difficult to break down compounds and consequently the lower the decomposition rate (Windham 2001). A low C:nutrient stoichiometry thus improves the carbon-use efficiency of microorganisms (Manzoni et al 2012), accelerating their rate of reproduction and promoting litter decomposition (Lee and Bukaveckas 2002, Moretto and Distel 2003).
By the end of the decomposition experiment, 73%–84% of the litter mass was lost. The decomposition rates in our study were much higher than those observed in a temperate wetland in northeastern China (14%–45% mass loss) (Zhang et al 2014b). This difference may have been due to species differences (Zhang et al 2014b) and/or to the higher temperatures at our subtropical study site, because temperature is an important factor controlling the rate of decomposition (Ferreira and Chauvet 2011, Salinas et al 2011, Bothwell et al 2014). Microbial activity and growth increase with temperature, favoring the conditions for high decomposition rates (Jonasson et al 1999) and enhancing the mineralization of organic nutrients in the soil, which increase the release of soil nutrients, providing a positive feedback for the rate of litter decomposition (Rustad et al 2001, Rui et al 2012). However, despite our fast sampling immediately after the typhoon event, some samples were harvested some hours (maximum 12 h) after the typhoon and some nutrient release could have occurred. In any case, the long-time sampling period and the frequency of sampling provide sufficient data for better understanding of the nutrient and stoichiometrical shifts throughout the decomposition process of the different types of litter after typhoon event.
Nutrient limitation is especially significant in tidal wetlands, likely because the periodic inundation of the soil limits the access of plants to soil nutrients by the anoxic effects on root growth (Amlin and Rood 2001, Kirwan and Guntenspergen 2012), by slowing mineralization (Adame et al 2010) and by the high leaching of P and particularly of N (Noe and Hupp 2007, Kobayashi et al 2009). The N-limitation of this wetland is also evident by its soil N:P ratio (4.4 on a molar basis) (Wang et al 2014), which is much lower than the average of 28 for various wetlands around the world (Xu et al 2013). Previous studies in Mnjiang River estuarine wetlands have observed a general N-limitation in the tall-grasses communities (Wang et al 2015a, 2015b).
Litter C and N concentration generally increased over time during decomposition, but P sharply decreased in the first 21 days and then remained relatively constant. These results were similar to those reported in the same wetland area (Tong et al 2011). N-limitation in litter decomposition generally appears at C:N ratios >30 and N concentrations <20 mg g−1 (Moore et al 2006, Jacob et al 2009, Zhang et al 2014b). In our study, the initial litter C:N ratio for all litter types ranged between 34.8 and 59.3, all of which were >30 (the N-limitation threshold), especially for the withered litter. The initial N concentration for all litter types in this study was 6.62–11.15 mg g−1, lower than the N-limitation threshold of 20 mg g−1. The initial N:P ratio in all litters ranged between 9.18 and 10.47, significantly lower than the critical N-limitation value of 15–26 (Güsewell and Verhoeven 2006, Güsewell and Gessner 2008).
These data thus suggest that N would likely be limiting for litter decomposition. The litter, however, was enriched proportionally more in N than in P during decomposition. The accumulated ratio of N and P released from the litter was very low, because most P was lost in the first 21 days of decomposition, and the accumulated release of N was more constant over time. These rapid and high P losses during the first stages of decomposition of the withered litter and the higher losses of P in contrast to N at early and even larger stages of decomposition has been widely observed in wetlands (Zhang et al 2014b). Some studies have reported that the litter N:P ratio is a good indicator of decomposition, with higher N release when the ratio is low and higher P release when the ratio is high (Güsewell and Freeman 2003). Along the studied decomposition period we have observed that remaining litter mass was better correlated with litter N concentration (R = −0.74, P < 0.001) than with litter P concentration (R = −0.22, P < 0.001) consistently with what is expected when litter decomposition is N-limited (Güssewell and Verhoeven 2006). Other studies, however, have reported that the N:P ratio does not account for the patterns of N and P mineralization during litter decomposition (Rejmankova and Houdkova 2006, Zhang et al 2014b). The litter mass remaining and the total C in litter mass remaining at the end of the studied period (264 days after the beginning of litter decomposition) was inversely related to initial litter N and P concentrations, thus showing that litter with higher N and P concentrations and with lower N:P ratio decomposes faster. This result is consistent with the expected patterns in the frame of ecological stoichiometry (Sterner and Elser 2002, Sardans et al 2012).
Other variables such as the species of the litter (Zhang et al 2014b), salinity (Rejmankova and Houdkova 2006) or changes in flooding (De Neiff et al 2006) can also have a large influence on litter decomposition and nutrient releases in wetlands. De Nieff et al (2006) observed that litter with lower initial N or P concentrations accumulated more N and P, respectively, than litter with higher initial concentrations. In our study, litter N:P ratio was a significant indicator of the dynamics of N and P mineralization and release during decomposition. Other data for the decomposition of green litter in wetlands have not been published for comparison, but the patterns of decomposition of the green and withered litters were very similar.
4.2. Typhoon-induced changes in remaining mass and amounts and ratios of C, N and P and in the amounts and ratios of C, N, and P released from litter
Remaining mass, elemental concentrations and stoichiometry differed between the mixed and withered litters even after 264 days of decomposition. In contrast, litter in tropical forests after a tropical storm of level 5 (hurricane/typhoon) returned to prehurricane levels very quickly (60–300 days) (Ostertag et al 2003), and decomposition rates of green and yellow litter caused by typhoon were higher than naturally withered litter after a typhoon (Xu et al 2004). Xu et al (2004) estimated that 21.3 kg ha−1 of N and 0.7 kg ha−1 of P were released to soil during the first year after a typhoon. These values are very similar to those in our study 264 days (approximately nine months) after a typhoon: 12 kg ha−1 of N and 5 kg ha−1 of P. The N:P ratios, however, were very different between the studies. Sullivan et al (1999) observed that the differences in decomposition rates in a Puerto Rican tropical forest before and after a hurricane depended on the species of the litter. Litter conditions and rates of decomposition recover quickly in Puerto Rican subtropical forests after hurricanes (Beard et al 2005). In contrast to our results, litter decomposition in a temperate forest in North America decreased after a hurricane (Wright and Coleman 2002). Litter N concentration in an evergreen temperate forest of Chamaecyparis obtuse, though, tended to increase after a typhoon (Inagaki et al 2008).
The typhoon increased the release of C, N and P from litter (884, 12.3 and 6 kg ha−1, respectively, after 264 days of decomposition experiment). Thus, the N:P, C:P and C:N ratios released from mixed litter (litter present after typhoon) were lower than those ratios released from withered litter (litter present before typhoon). The increases in the cycling rates of C, N and P accompanied by higher releases of C, N and P and low N:P ratios should thus favor plant species with high growth rates (Sterner and Elser 2002, Sardans et al 2012). Typhoon-driven maintenance of rapid nutrient cycling may be an important mechanism for the maintenance of trees in some tropical forests (Xu et al 2004). In addition to the projected increase in typhoon frequency (IPCC 2014), it is important to take into account the projected rise in sea level with the consequent enhancement of flooding intensity and the great spread of invasive species affecting these wetland areas (Wang et al 2015a, 2015b). Previous studies have observed that in this same wetlands the invasive species Phragmites australis and Spartina alterniflora have a more conservative use of N, the limiting nutrient (Wang et al 2015a, 2015b), are able to take up more N when flooding intensity rises (Wang et al 2015c) and have higher N:P ratios and lower growth rates (Wang et al 2015b) than the native species. Thus, higher typhoon frequency can interact with increasing plant invasions (Wang et al 2015a, 2015b, 2015c). Moreover, by increasing the release of 884 kg of C ha−1 from plants the increase of frequency of typhoon events can reduce plant biomass and increase the C release from plant-soil system to the atmosphere. These results support the development of long-term studies to better understand the effects of continual typhoons on soil conditions and to determine if continual typhoons can change the 'regeneration niche' (Davis 1991) of the soil by modifying its C, N and P concentrations and stoichiometric relationships.
5. Main findings, conclusions and perspectives
- (1)The typhoon increased litter production four-fold and changed the patterns of nutrient release between the newly produced litter (green and semi-green litter) and withered litter.
- (2)The typhoon enhanced the release of C, N and P from the litter (884, 12.3 and 6 kg ha−1, respectively, after 264 days of decomposition experiment). Higher rates of microbial growth and C and nutrient cycling should thus be expected after a typhoon.
- (3)Remaining litter generally increased its N:P ratio during decomposition. The ratio of the released N and P was consequently lower than the initial N:P ratio in all litter types, implying that typhoon decouples N and P cycling across different ecosystem compartments.
- (4)If the frequency and/or intensity of typhoons increase, a constant increase in the release of N and P to the soil and the changes in soil N:P ratios could change the N and P cycles in wetlands and provide better conditions for the spread of fast-growing species.
Acknowledgments
The authors would like to thank Siang Wan, and Hui Xu for their assistance with field sampling. Funding was provided by the Natural Science Foundation Key Programs of Fujian Province (2014R1034-3 and 2014Y0054), Natural Science Foundation of Fujian Province (2014J01119), the European Research Council Synergy grant ERC-SyG-2013-610028 IMBALANCE-P and the Spanish Government grant CGL2013-48074-P.
Conflicts of Interest
The authors declare no conflicts of interest.